Performance Report 2009 - Constructing...
40
UK Industry Performance Report Based on the UK Construction Industry Key Performance Indicators 2009 BERR Department for Business Enterprise & Regulatory Reform In Partnership with Headline Sponsor:
Transcript of Performance Report 2009 - Constructing...

UK IndustryPerformance Report
Based on the UK Construction Industry Key Performance Indicators
2009
BERR Department for BusinessEnterprise & Regulatory Reform
In Partnership with
Headline Sponsor:

The KPI Project Management Group:The data used to compile the UK Construction Industry KPIs is collected under the guidance of the KPI Project ManagementGroup chaired by the Department for Business Enterprise and Regulatory Reform. In 2009, the members of the Group were:
Industry Performance Report 2009 - ContentsEconomic KPIs - All Construction - Year on Year ComparisonsKPI summary table 02KPI group trend graph 04
Economic KPIs - All Construction - Individual KPI Trend GraphsClient Satisfaction - Product, Service & Value for Money 06
Contractor Satisfaction - Overall - Performance, Provision of Information & Payment 07
Defects - Impact at Handover, Predictability Cost -Project & Design 08
Predictability Cost - Construction, Predictability Time -Project & Design 09
Predictability Time - Construction, Construction Cost & Time 10
Profitability, Productivity - (VAPH Current Values) & (VAPH Constant 2000 Values) 11
Gross Productivity (TOPH), Return on Value Added (ROVA) & Return on Capital Employed (ROCE) 12
Safety - Industry & Safety - Contractors - All Companies 13
Respect for People KPIs - All Construction -Year on Year ComparisonsKPI summary table 14KPI group trend graph 15
Environment KPIs - All Construction -Year on Year ComparisonsKPI summary table 16KPI group trend graph 17
Economic KPIs - All Housing - Year on Year ComparisonsKPI summary table 18KPI group trend graph 19
Economic KPIs - All Non-Housing - Year on Year ComparisonsKPI summary table 20KPI group trend graph 21
Construction Consultants KPIs - Year on Year ComparisonsKPI summary table 22KPI group trend graph 23
M&E Contractors KPIs - Year on Year ComparisonsKPI summary table 24KPI group trend graph 25
Construction Products Industry KPIs -Year on Year ComparisonsKPI summary table 26KPI group trend graph 27
Constructing Excellence Demonstration Projects -Year on Year ComparisonsKPI summary table 28KPI group trend graph 29
Constructing Excellence Demonstration Projects -Comparisons with All ConstructionKPI summary table 30KPI group trend graph 31
Appendix 32How to read the data tables and graphs 33Data Sources for the UK Construction Industry KPIs 35About Constructing Excellence 37
Keith Folwell (Chairman) Department for BusinessEnterprise and Regulatory Reform
Jo ChanningOffice for National Statistics
Bob PackhamKPI Consortium
Joe MartinRoyal Institution of Chartered Surveyors
Paul BurrowsRoyal Institution of Chartered Surveyors
Martin PrintKPI Consortium
Jon de SouzaConstructing Excellence in theBuilt Environment
Sam RakusenRakusen Design FX Ltd.
Gerry Samuelsson - BrownBuilding Services Research &Information Association
David CrowhurstBuilding Research Establishment
John TebbitConstruction Products Association
Susan WhiteKPI Consortium
Andrew GibbonsMRM Solutions
© Constructing Excellence. Requests to use any part of this document shouldbe sent to Constructing Excellence:
Warwick House, 25 Buckingham Palace Road, London SW1W 0PPTel: 020 7592 1100 Fax: 020 7592 1101
In Partnership with
BERR Department for BusinessEnterprise & Regulatory Reform

2009 UK Construction Industry KPIs - Industry Performance Report 01
Executive SummaryThis is the eleventh year of publication of the Construction
Industry KPIs, based on data from thousands of projects
collated from government and industry surveys. These
enable individual firms to benchmark their performance
with other firms, and they also enable us to measure
improvement across the industry through this annual
Industry Performance Report.
The report contains trend data for economic performance,
people performance and environmental performance, as
well as for housing, consultants, M&E contractors and
construction products, and Constructing Excellence
demonstration projects are also included.
Overall, the results show some of the effects to be
expected as the industry moves from a period of
sustained growth into recession. 59% of the headline KPIs
showed improvement, 13% were level, and 28% showed
a decline in performance. Overall the rate of improvement
has slowed down in recent years.
Economic indicatorsThe industry showed improvement in three quarters of the areas
measured by the headline Economic All Construction KPIs. This continues
a trend seen over the preceding eleven years. This year, seven KPIs
showed better performance, one was level, and two (cost predictability
and safety) worsened. Safety performance declined slightly but there
have been small improvements in the levels of client satisfaction, and
productivity and profitability have risen. The cost and time predictability
KPIs show that the underlying causes of variability are still entrenched in
the industry.
Environmental indicatorsThis year’s Environment KPIs reveal a mixed picture for the industry’s
performance (seven showing improvement and five worsening),
suggesting that the industry is making patchy progress in this vital area.
Client perception of how much care is being taken for the environment
during the construction phase generally moved ahead this year, and
there was a reduction in waste transported off site.
People indicatorsRespect for People KPI data has been collected and analysed for eight
years. The first four years showed steady improvement in most areas,
but the picture has been mixed since then. This year, four of the
headline KPIs showed improvement, one was static, and three
worsened.
Employee satisfaction declined again slightly this year, but employee
turnover reduced. Pay levels continued to move upwards, and there was
a slight improvement in training, although the median remains low at 1.1
days per employee per year.
HousingClient satisfaction fell this year, with client satisfaction with the product
down to 84% (86% in 2008). Client Satisfaction - service fell to 79%
(84% in 2008) and defects scores worsened to 76% (80% in 2008).
Cost predictability improved but time predictability worsened slightly, and
profitability leveled off at 8.8%. Productivity drifted down fractionally
(£50.0k value added per employee in 2009, compared with £53.3k in
2008), and the inflation adjusted figure declined slightly too (£39.8k in
2009 compared with £42.1k in 2008).
ConsultantsOverall, client satisfaction has improved since 2002, but this has levelled
off over the past three years. This year client satisfaction remained more
or less static. Training days per employee was reported at 2.0 days per
employee (last year 1.5 days per year), and there were increases in
profitability (from 13.3% to 14.8%) and productivity rose from £46,100
per employee last year to £48,700.
M&E Contractors Client satisfaction in the M&E sector levelled off this year, although the
overall trend since 2001 has been generally positive. For the fifth year in
a row, M&E Contractors' safety performance showed an improvement,
with 55% of all companies achieving zero reportable accidents (50% in
2008), and 25% of larger (60+ employees) companies achieving zero
accidents too (24% in 2008). Defects performance improved very
slightly from 68% last year to 69% this year, while cost and time
predictability remained fairly static. Median profitability declined slightly to
3.9% (down from 4.1% last year), and productivity declined from
£55.7k value-added per employee to £53.9k.
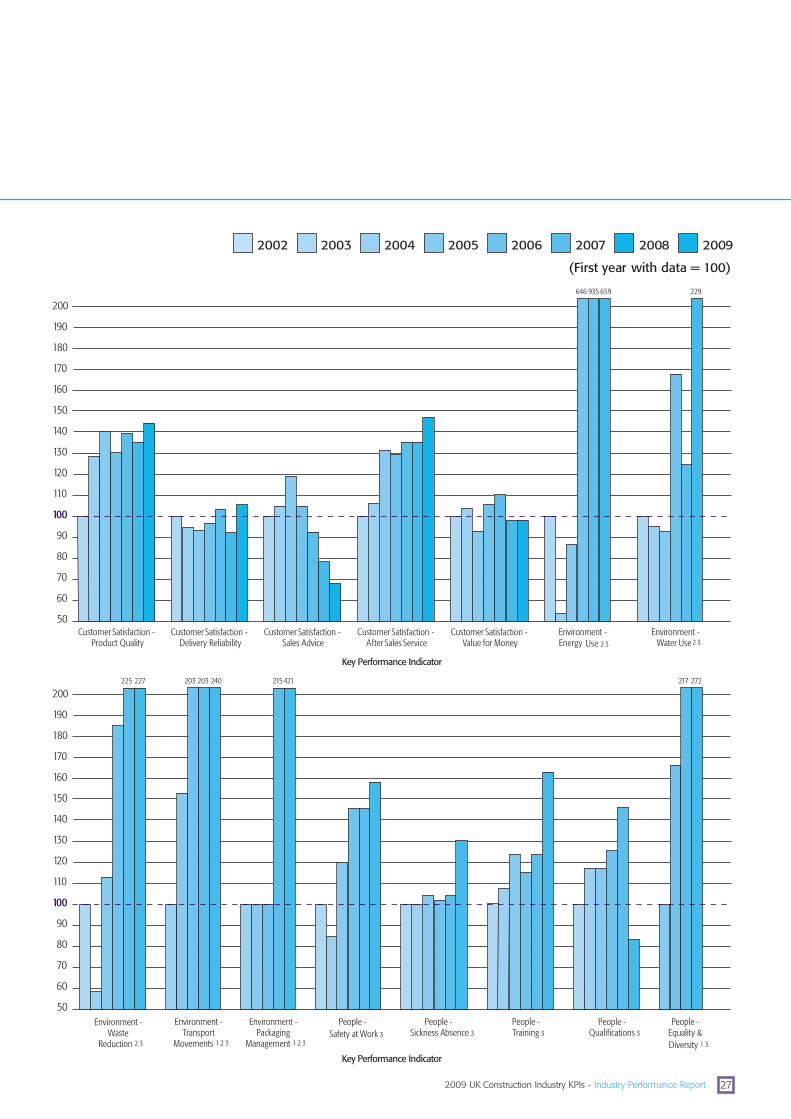
Construction ProductsData collection in 2008 was restricted to measuring customer
satisfaction.. Three out of the five KPIs showed record high levels of
performance. Customer satisfaction with product quality reached an all-
time high (82% compared with 77% last year). Delivery reliability was
also at a record level (72% compared to 62% last year). After sales
service also recorded a jump to its highest level of 72%. Value for money
ratings remained unchanged at 50%, and sales advice ratings were only
36%.
DemonstrationsProjects in our Demonstrations Programme continued to exceed the
performance of the general industry, as they have since their inception.
The industry continues to close the gap on customer satisfaction, but the
gap is much greater for productivity, safety and qualifications and skills.
Demonstration projects are more predictable, with project cost
predictability hitting 88% compared to 48% for the industry as a whole.
Project time predictability shows a similar performance gap, with
demonstration projects recording 90% against the industry's 45%.
Demonstration sites continue to be safer places to work, with a mean
accident incidence rate of 317 compared to the industry figure of 906.
2009 UK Construction Industry KPIs - Industry Performance Report02
KPI MeasurePerformance Trend
Client Satisfaction - Product % scoring 8/10 or better 72% 73% 72% 73% 78% 80% 83% 84% 82% 83% 86%
Client Satisfaction - Service % scoring 8/10 or better 58% 63% 63% 65% 71% 74% 77% 79% 75% 77% 84%
Client Satisfaction -Value for Money 1 % scoring 8/10 or better - - 67% 69% 73% 74% 79% 80% 75% 75% 82%
Contractor Satisfaction -Performance - Overall 1 % scoring 8/10 or better - - - - 64% 65% 63% 62% 62% 62% 64%
Contractor Satisfaction -Provision of Information - Overall 1 % scoring 8/10 or better - - - - 57% 59% 58% 56% 56% 56% 59%
Contractor Satisfaction -Payment - Overall 1 % scoring 8/10 or better - - - - 67% 66% 65% 65% 63% 63% 67%
Defects - Impact at Handover 1 % scoring 8/10 or better - 65% 53% 58% 68% 68% 72% 77% 73% 73% 77%
Predictability Cost - Project 1 % on cost or better - 50% 46% 48% 52% 50% 48% 45% 46% 49% 48%
Predictability Cost - Design % on cost or better 65% 64% 63% 63% 65% 62% 63% 66% 64% 65% 61%
Predictability Cost - Construction % on cost or better 37% 45% 48% 50% 52% 49% 48% 44% 49% 48% 46%
Predictability Time - Project 1 % on time or better - 28% 36% 42% 44% 44% 46% 44% 58% 45% 45%
Predictability Time - Design % on time or better 27% 37% 41% 46% 53% 55% 52% 57% 58% 58% 53%
Predictability Time - Construction % on time or better 34% 62% 59% 61% 59% 60% 62% 60% 65% 58% 59%
Construction Cost 1 % change compared with one year ago -3.0% -2.0% 3.0% 2.0% 5.0% 1.1% -0.8% -0.8% -3.8% -1.7% -4.3%
Construction Time 1 % change comparedwith one year ago - 3.0% 1.0% 4.0% 1.0% -1.7%-1.3% 0.1% -0.3% -0.5% -3.9%
1999 2000 2001 2002 2003 2004 2005 2006 2007 2008 2009LastYear
AllYears
Economic KPIs – All Construction Year-on-Year Comparisons

2009 UK Construction Industry KPIs - Industry Performance Report 03
1 Data not available before the first year shown.
2 The measure for this KPI was changed in 2000, 1999 data therefore not reported. In order to regularise the volatile mix of financial data by company size from year to year, in 2006 a standard method of weighting by number of employees was adopted in line with other international financial KPIs. This method was applied retrospectively to past years and, where applicable, their results were revised.
3 Current values are deflated by the "All Construction Output Price Index" for the first years KPI to arrive at constant values .
4 This KPI is based on company annual accident incidence rate published by the Health & Safety Executive on its website at Table 1 "Injuries in GB by Industry and Severity of Injury as reported to all Enforcing Authorities".
5 Data for this KPI was not available before 2002. This KPI is based on company annual accident incidence rates collected in the BERR ContractorSurvey adjusted for under reporting.
KPI MeasureTrend
Profitability 2 Median % profit before interest & tax - 4.4% 5.1% 5.2% 5.4% 7.0% 8.1% 7.9% 8.2% 9.6% 9.9%
Productivity Median value added/(VAPH Current Values) 2 FTE employee (£000) - 27.0 28.0 28.0 31.1 32.6 34.2 38.2 42.0 45.5 46.2
Productivity Median value added/(VAPH Constant 2000 Values) 2 3 FTE employee (£000) - 27.0 26.8 26.0 27.9 28.2 27.5 29.3 31.2 32.3 33.0
Gross Productivity (TOPH) 2 Median turnover/FTE employee (£000) - 59.0 58.0 51.0 54.0 58.3 59.7 58.9 57.5 54.4 57.0
Return on Value Added (ROVA) 2 Median % PBIT/value added - 18.9% 20.2% 21.1% 16.8% 18.3% 15.8% 20.5% 21.4% 22.4% 24.1%
Return on Capital Median % PBIT/Employed (ROCE) 2 capital employed - 17.9% 24.8% 21.6% 28.9% 34.3% 41.3% 36.2% 37.6% 39.8% 47.4%
Safety - Industry 4 Accident incidence rate 1354 1271 1318 1217 1097 1172 1023 901 946 865 906
Safety - Contractors - % achieving zero All Companies 5 accident incidence rate - - - 31% 39% 42% 50% 51% 62% 60% 63%
1999 2000 2001 2002 2003 2004 2005 2006 2007 2008 2009LastYear
AllYears
Performance

2009 UK Construction Industry KPIs - Industry Performance Report04
Key Performance Indicator
Key Performance Indicator
1999 2000 2001 2002 2003 2004 2005 2006 2007 2008 2009
(First year with data = 100)
60
80
100
120
140
160
180
200
220
ClientSatisfaction - Product
ClientSatisfaction -
Service
ClientSatisfaction -
Value for Money 1
ContractorSatisfaction -Performance -
Overall 1
ContractorSatisfaction - Provision of Information - Overall 1
ContractorSatisfaction - Payment - Overall 1
Defects 1 PredictabilityCost -
Project 1
240
60
80
120
140
160
180
200
220
ConstructionCost
ConstructionTime 1
PredictabilityTime -
Construction
PredictabilityCost -
Construction
PredictabilityTime - Design
PredictabilityTime -Project 1
tyPredictabiliCost - Design
240
100
Economic KPIs – All Construction Year-on-Year Comparisons (contd.)

2009 UK Construction Industry KPIs - Industry Performance Report 05
60
80
120
140
160
180
200
220
240
Key Performance Indicator
100
Safety -All Companies 5
Contractors -Safety -Industry 4
Return on Capital Employed (ROCE) 2
Return on Value Added (ROVA) 2
Gross Productivity (TOPH) 2
2
Productivity(VAPH Constant 2000 Values) 3
Productivity(VAPH Current
Values) 2
Profitability 2
265
1 Data not available before the first year shown.
2 The measure for this KPI was changed in 2000, 1999 data therefore not reported. In order to regularise the volatile mix of financial data by company size from year to year, in 2006 a standard method of weighting by number of employees was adopted in line with other international financial KPIs. This method was applied retrospectively to past years and, where applicable, their results were revised.
3 Current values are deflated by the "All Construction Output Price Index" for the first years KPI to arrive at constant values .
4 This KPI is based on company annual accident incidence rate published by the Health & Safety Executive on its website at Table 1 "Injuries in GB by Industry and Severity of Injury as reported to all Enforcing Authorities".
5 Data for this KPI was not available before 2002. This KPI is based on company annual accident incidence rates collected in the BERR ContractorSurvey adjusted for under reporting.

2009 UK Construction Industry KPIs - Industry Performance Report06
Economic KPIs – All Construction Individual KPI Trends
100%
90%
80%
70%
60%
30%
40%
50%
20%
10%
0%
BETTER
% scoring 8/10 or better
1999
72%
2000
73%
2001
72%
2002
73%
2003
78%
2004
80%
2005
83%
2006
84%
2007
82%
2009
86%
2008
83%
100%
90%
80%
70%
60%
30%
40%
50%
20%
10%
0%
% scoring 8/10 or better
2002
65%
2004
74%
2006
79%
2007
75%
2005
77%
2009
84%
2008
77%77%
2003
71%
2001
63%
2000
63%
1999
58%
100%
90%
80%
70%
60%
30%
40%
50%
20%
10%
0%20001999 2002
69%
2004
74%
2005
79%
2006
80%
2007
75%
2009
82%
2008
75%
BET
TER
Data not available before the first year shown.
% scoring 8/10 or better
2003
73%
2001
67%
The annual KPI surveys ask clients to rate how satisfied they
were with the completed facility on a scale from 1-10.
After levelling off between 2005 and 2008, there was a strong
improvement in 2009 to an all-time high of 86% of projects
scoring 8 out of 10 or better.
The annual KPI surveys ask clients to rate how satisfied they were
with the service provided by the project team on a scale from 1-10.
After levelling off between 2005 and 2008, there was a strong
improvement in 2009 to an all-time high of 84% of projects
scoring 8 out of 10 or better.
The annual KPI surveys ask clients to rate how satisfied they were
with the value for money provided on the project on a scale
from 1-10.
In 2009, performance rose to an all-time high of 82% achieving 8
out of 10 or better, reversing the downward trend of the last two
years.
Client Satisfaction - Product
Client Satisfaction - Service
Client Satisfaction - Value for Money

2009 UK Construction Industry KPIs - Industry Performance Report 07
The annual KPI surveys ask contractors to rate how satisfied they
were with the overall performance of the client on a 1-10 scale.
In 2009, 64% of contractors awarded 8 out of 10 or better. This is
unchanged since last year and over six years.
The annual KPI surveys ask contractors to rate how satisfied they
were with the overall provision of information by the client on a
1-10 scale.
In 2009, 59% of contractors awarded 8 out of 10 or better. This is
a slight improvement since last year but almost unchanged over six
years.
The annual KPI surveys ask contractors to rate how satisfied
they were with the overall provision of payment by the client on
a 1-10 scale.
In 2009, 67% of contractors awarded 8 out of 10 or better. This
is an improvement on last year, but there has been no
improvement over seven years.
100%
90%
80%
70%
60%
30%
40%
50%
20%
10%
0%200120001999 2002 2003
64%
2004
65%
BET
TER
Data not available before the first year shown.
% scoring 8/10 or better
2006
62%
2005
63%
2007
62%
2009
64%
2008
62%
100%
90%
80%
70%
60%
30%
40%
50%
20%
10%
0%200120001999 2002 2004
59%
2005
58%
BET
TER
% scoring 8/10 or better
2006
56%
2007
56%
2009
59%
2008
56%
2003
57%
Data not available before the first year shown.
100%
90%
80%
70%
60%
30%
40%
50%
20%
10%
0%200120001999 2002 2005
65%
2006
65%
2007
63%
2009
67%
2008
63%
BET
TER
Data not available before the first year shown.
% scoring 8/10 or better
2004
66%
2003
67%
Contractor Satisfaction -Performance - Overall
Contractor Satisfaction -Provision of Information - Overall
Contractor Satisfaction - Payment - Overall

100%
90%
80%
70%
60%
30%
40%
50%
20%
10%
0%
BETTER
1999
65%
2000
64%
2001
63%
2002
63%
2003
65%
2005
63%
2007
64%
2009
61%
2008
65%
2006
66%
2004
62%
% on cost or better
100%
90%
80%
70%
60%
30%
40%
50%
20%
10%
0%1999
BETTER
% on cost or better
2002
48%
2005
48%
2006
45%
Data not available before the first year shown.
2007
46%
2009
48%
2008
49%
2003
52%
2004
50%
2000
50%
2001
46%
The annual KPI surveys ask for the actual out-turn cost of design
compared with the figure agreed at the start of that phase.
In 2009, 61% of projects delivered on target or better compared
with 65% in 2008. This is a significant decline in performance this
year, and an overall slight decline over eleven years.
Since 2000 the annual KPI surveys have assessed the cost
predictability of the whole project (i.e. the combined cost of
design and construction).
In 2009, 48% of projects delivered on target or better, compared
with 49% in 2008. This represents a slight decline in
performance this year and virtually unchanged performance over
nine years.
Predictability Cost - Design
Predictability Cost - Project
100%
90%
80%
70%
60%
30%
40%
50%
20%
10%
0%1999
BETTER
% scoring 8/10 or better
2000
65%
2001
53%
2002
58%
2003
68%
2004
68%
2007
73%
2009
77%
2008
73%
Data not available before the first year shown.
2006
77%
2005
72%The annual KPI surveys ask clients to rate the impact of defects in
the project at the point of handover, on a scale from 1-10, where
10 represents zero defects.
In 2009, 77% of projects achieved 8 out of 10 or better, an
improvement on last year, equalling the highest performance
measured over ten years.
Defects - Impact at Handover
08 2009 UK Construction Industry KPIs - Industry Performance Report

2009 UK Construction Industry KPIs - Industry Performance Report 09
100%
90%
80%
70%
60%
30%
40%
50%
20%
10%
0%
BETTER
1999
37%
2000
45%
2002
50%
2004
49%
2005
48%
2006
44%
2007
49%
2008
48%
% on cost or better
2003
52%
2001
48%
2009
46%
The annual KPI surveys ask for the actual out-turn time taken for
the design phase compared with the length of time agreed at
the start of that phase.
In 2009, 53% of projects delivered on target or better compared
with 58% in 2008. This represents a significant decline in
performance this year. The improvement in performance from
1999 to 2003 has now levelled off.
Since 2000 the annual KPI surveys have assessed the time
predictability of the whole project (i.e. the combined time for
design and construction).
In 2009, 45% of projects delivered on target or better, the same as
in 2008. Over ten years there has been significant improvement,
but this has levelled off over the most recent years.
The annual KPI surveys ask for the actual out-turn cost of
construction compared with the figure agreed at the start of
that phase.
In 2009, 46% of projects delivered on target or better compared
with 48% in 2008. This represents a slight decline in performance
this year but virtually unchanged performance over ten years.
100%
90%
80%
70%
60%
30%
40%
50%
20%
10%
0%
BETTER
2000
37%
2003
53%
2004
55%
2007
58%
2009
53%
2008
58%
% on time or better
1999
27%
2001
41%
2002
46%
2005
52%
2006
57%
100%
90%
80%
70%
60%
30%
40%
50%
20%
10%
0%1999
BETTER
2003
44%
2004
44%
2006
44%
2007
58%
2009
45%
2008
45%
Data not available before the first year shown.
% on time or better
2000
28%
2001
36%
2002
42%
2005
46%
Predictability Cost - Construction
Predictability Time - Design
Predictability Time - Project

2009 UK Construction Industry KPIs - Industry Performance Report10
The annual KPI surveys ask for the actual out-turn time taken for
the construction phase compared with the length of time agreed
at the start of that phase.
In 2009, 59% of projects delivered on programme or better,
compared with 58% in 2008. Over the past ten years there
has been a slight decline in performance.
100%
90%
80%
70%
60%
30%
40%
50%
20%
10%
0%
BETTER
% on time or better
1999
34%
2001
59%
2003
59%
2000
62%
2002
61%
2004
60%
2005
62%
2007
65%
2009
59%
2008
58%
2006
60%
Predictability Time - Construction
-10%
-8%
-6%
-4%
-2%
4%
2%
0%
6%
8%
10%1999
-3.0%
2000
-2.0%
2001
3.0%
2003
5.0%
2004
1.1%
-0.8%
2005
-0.8%
2006
-3.8%
2007
-4.3%
2009
-1.7%
2008B
ETTE
R
% change compared with one year ago
2002
2.0%
BERR collates data on the total cost of construction, and is able to
normalise this by type and size of facility and region of the country.
Analysis of this data shows that construction costs in 2008 fell
in absolute terms by 4.3% compared with 2008. This is an
improvement over last year but a virtually unchanged performance
over eleven years.
Construction Cost
-10%
-8%
-6%
-4%
-2%
4%
2%
0%
6%
8%
10%
% change compared with one year ago
1999 2000
3.0%
2001
1.0%
2002
4.0%
2003
1.0%
2004
-1.7%
1.3%
2005 2006
0.1%
2007
-0.3%
2009
-3.9%
2008
-0.5%
BET
TER
Data not available before the first year shown.
BERR collates data on the duration of construction and is able to
normalise this by type and size of facility and region of the country.
Analysis of this data shows that construction times in 2009 were
3.9% better on average than in 2008. This is an improvement this
year, but virtually unchanged performance over ten years.
Construction Time

2009 UK Construction Industry KPIs - Industry Performance Report 11
15.0%
7.5%
10.0%
12.5%
5.0%
2.5%
0.0%1999
5.1%
2001
5.2%
2002
7.0%
2004
7.9%
2006
8.2%
2007
9.9%
2009
9.6%
2008
Median % profit before interest & tax
2005
8.1%
4.4%
2000 2003
5.4% BET
TER
The measure for this KPI was changed in 2000, 1999 data therefore not reported. In order to regularise the volatile mix of financial data by company size from year to year, in 2006 a standard method of weighting by number of employees was adopted in line with other international financial KPIs. This method was applied retrospectively to past years and, where applicable, their results were revised.
Data on profit before interest and tax (PBIT) is obtained from firms
filing annual accounts with Companies House. A snapshot of this
data taken each January relates to financial performance reported
in the previous year.
In 2009, the median profitability before tax and interest was
9.9%, compared with 9.6% in 2008. This represents a small
improvement in performance this year and there has been a
significant improvement over ten years.
Profitability - (ROS)
31.2
27
60
50
40
30
20
10
01999
Median value added / FTE employee (£000)
2000
27.0
2004
32.6
2003
31.1
2005
34.2
2007
42.0
2009
46.2
2008
45.5
The measure for this KPI was changed in 2000, 1999 data therefore not reported. In orderregularise the volatile mix of financial data by company size from year to year, in 2006 a standard method of weighting by number of employees was adopted in line with other international financial KPIs. This method was applied retrospectively to past years and, where applicable, their results were revised.
BET
TER
2001
8.02
2002
28.0
2006
38.2Data on value added (gross turnover less all bought-in supplies) is
obtained from firms filing annual accounts with Companies House.
A snapshot of this data taken each January relates to financial
performance reported in the previous year.
In 2009, the median value added per employee was £46.2k
compared to £45.5k in 2008. This represents a significant
improvement in performance this year and over ten years.
Productivity - (VAPH Current Values)
60
50
40
30
20
10
01999
Median value added / FTE employee (£000)
2007
31.2
2001
26.8
2003
27.9
2004
28.2
2006
29.3
2000
27.0
Current values are deflated by the "All Construction Output Price Index" for the first years KPI to arrive at constant values.
The measure for this KPI was changed in 2000, 1999 data therefore not reported.
BET
TER
In order to regularise the volatile mix of financial data by company size from year to year, in 2006 a standard method of weighting by number of employees was adopted in line with other international financial KPIs. This method was applied retrospectively to past years and, where applicable, their results were revised.
2005
27.5
2002
26.0
2009
33.0
2008
32.3
Data on value added (gross turnover less all bought-in supplies) is
obtained from firms filing annual accounts with Companies House.
A snapshot of this data taken each January relates to financial
performance reported in the previous year. The data for each year is
adjusted back to the 2000 values to remove the effect of inflation.
In 2009, the median value added per employee (adjusted) was
£33.0k compared to £32.3k in 2008. This represents a slight
improvement in performance this year and over ten years.
Productivity - (VAPH Constant 2000 Values)

2009 UK Construction Industry KPIs - Industry Performance Report12
80
70
60
30
40
50
20
10
0
BETTER
Median turnover / FTE employee (£000)
1999 2000
59.0
2001
58.0
2002
51.0
2003
54.0
2004
58.3
2005
59.7
2006
58.9
2007
57.5 57.0
2009
54.4
2008
The measure for this KPI was changed in 2000, 1999 data therefore not reported. In order to regularise the volatile mix of financial data by company size from year
to year, in 2006 a standard method of weighting by number of employees was adopted in line with other international financial KPIs. This method was applied retrospectively to past years and, where applicable, their results were revised.
Data on gross productivity (turnover per employee) is obtained
from firms filing annual accounts with Companies House. A sample
of this data taken each January relates to financial performance
reported in the previous year.
In 2009, the median gross turnover per employee was £57.0k
compared to £54.4k in 2008. This represents a slight improvement
in performance this year but virtually unchanged over ten years.
Gross Productivity (TOPH)
15%
20%
25%
30%
10%
5%
0%1999
BET
TER
BET
TER
Median % PBIT / value added
The measure for this KPI was changed in 2000, 1999 data therefore not reported. In order to regularise the volatile mix of financial data by company size from year to year, in 2006 a standard method of weighting by number of employees was adopted in line with other international financial KPIs. This method was applied retrospectively to past years and, where applicable, their results were revised.
2002
21.1%
2005
15.8%
2006
20.5%
2007
21.4%
2001
20.2%
2000
18.9%
2003
16.8%
2004
18.3%
2009
24.1%
2008
22.4%Data on return on value-added is obtained from firms filing annual
accounts with Companies House. A sample of this data taken each
January relates to financial performance reported in the previous year.
In 2009, the median return on value added was 24.1% compared to
22.4% in 2008. This represents a significant improvement in
performance this year and over ten years.
Return on Value Added (ROVA)
50%
45%
40%
35%
30%
15%
20%
25%
10%
5%
0%1999
BET
TER
Median % PBIT / capital employed
2001
24.8%
2003
28.9%
2004
34.3%
2002
21.6%
2005
41.3%
2006
36.2%
The measure for this KPI was changed in 2000, 1999 data therefore not reported. In order to regularise the volatile mix of financial data by company size from year to year, in 2006 a standard method of weighting by number of employees was adopted in line with other international financial KPIs. This method was applied retrospectively to past years and, where applicable, their results were revised.
2000
17.9%
2007
37.6%
20092008
39.8%
47.4%
Data on return on capital employed is obtained from firms filing
annual accounts with Companies House. A sample of this data
taken each January relates to financial performance reported in the
previous year.
In 2009, the median return on capital employed was 47.4%
compared to 39.8% in 2008. This represents a significant
improvement in performance this year and over ten years.
Return on Capital Employed (ROCE)

2009 UK Construction Industry KPIs - Industry Performance Report 13
The provisional HSE data for all reportable accidents in 2008/09
indicates an accident incidence rate of 906 reportable accidents
per 100,000 employed. The equivalent figure for 2007/08 was 865.
This represents a slight deterioration in performance this year, but
there has been a significant improvement over eleven years.
The annual KPI surveys ask for company annual accident
incidence rates per 100,000 employed. The data set is adjusted
for under reporting.
In 2009, 63% of companies reported a zero accident incidence
rate compared with 60% in 2008. This represents a slight
improvement in performance this year and over eight years.
1500
750
1000
1250
500
250
0
BETTER
Mean accident incidence rate
This KPI is based on company annual accident incidence rate published by the Health & Safety Executive on its website at Table 1 "Injuries in GB by Industry and Severity of Injury as reported to all Enforcing Authorities".
2000
1271
2005
1023
2006
901
1999
1354
2002
1217
2004
1172
2001
1318
2003
1097
2007
946
2009
906
2008
865
100%
90%
80%
70%
60%
30%
40%
50%
20%
10%
0%200120001999
BETTER
Data for this KPI was not available before 2002. This KPI is based on company annual accident incidence rates collected in the BERR Contractor Survey adjusted for under reporting.
% achieving zero accident incidence rate
2002
31%
2003
39%
2004
42%
2005
50%
2006
51%
2007
62%
2009
63%
2008
60%
Safety - Industry
Safety - Contractors - All Companies

2009 UK Construction Industry KPIs - Industry Performance Report14
Respect for People KPIs – All Construction Year-on-Year Comparisons
KPI Measure
Employee Satisfaction 1 % scoring 8/10 or better - 41% 41% 51% 55% 47% 46% 44%
Staff Turnover -All Companies 1 Median % staff turnover - 7.7% 7.1% 6.7% 5.9% 5.0% 6.3% 4.2%
Sickness Absence -All Companies 1 Median number of days lost - 1.8 1.7 1.5 1.4 1.7 1.7 1.7
Safety - Industry 2 Accident incidence rate 1217 1097 1172 1023 901 946 865 906
Safety - Contractors All companies 3 % achieving zero accident incidence rate 31% 39% 42% 50% 51% 62% 60% 63%
Working Hours Median usual hours worked / week 44 41 41 40 40 40 40 40
Travelling Time Median travel time to work / day (mins) 31 24 25 25 25 25 25 25
Qualifications & Skills 1 Median % of direct employees qualified to NVQ Level 2 or higher qualification - - 30% 33% 40% 33% 25% 22%
Equality & Diversity 1 % scoring 8/10 or better - 44% 46% 54% 54% 56% 56% 60%
Training 1 Median annual training days / full-time equivalent employee - 0.8 0.8 1.0 1.0 0.9 1.0 1.1
Pay Median gross weekly earnings (£) 365 414 425 441 460 481 495 512
Investors in People 4 Mean % of direct employees covered by IiP commitment and recognition 15.4% 16.7% 19.0% 14.9% 11.1% 11.1% 12.4% 17.6%
Performance TrendAll
YearsLastYear
1 Data not available before the first year shown.
2 Based on company annual accident incidence rate published by the Health & Safety Executive on its website at Table 1 "Injuries in GB by Industry and Severity of Injury as reported to all Enforcing Authorities".
3 Based on company annual accident incidence rates collected in the BERR Contractor Survey adjusted for under reporting (see KPI Tutorial for details).
4 Based on Investors in People UK Ltd latest industry average performance. liP UK Ltd made major revisions to the make up of the SIC Code content of their data base of Construction Organisations in 2005 & 2006.
2003 2004 2005 2006 2007 2008 20092002

80
160
170
180
190
200
140
150
130
110
120
90
70
Key Performance Indicator
60
80
160
170
180
190
200
140
150
130
110
120
90
70
Key Performance Indicator
60
EmployeeSatisfaction 1
StaffTurnover 1
Safety - Industry 2
Safety - Contractors - All Companies 3
Working Hours
TravellingTime
Qualifications& Skills 1
Equality &Diversity 1
Training 1 Pay Investors in People 4
2002 2003 2004 2005 2006 2007 2008 2009
(First year with data = 100)
SicknessAbsence -
All Companies 1
100
100
203
2009 UK Construction Industry KPIs - Industry Performance Report 15
2009 UK Construction Industry KPIs - Industry Performance Report16
Environment KPIs – All Construction Year-on-Year Comparisons
KPI Measure
Product Performance -
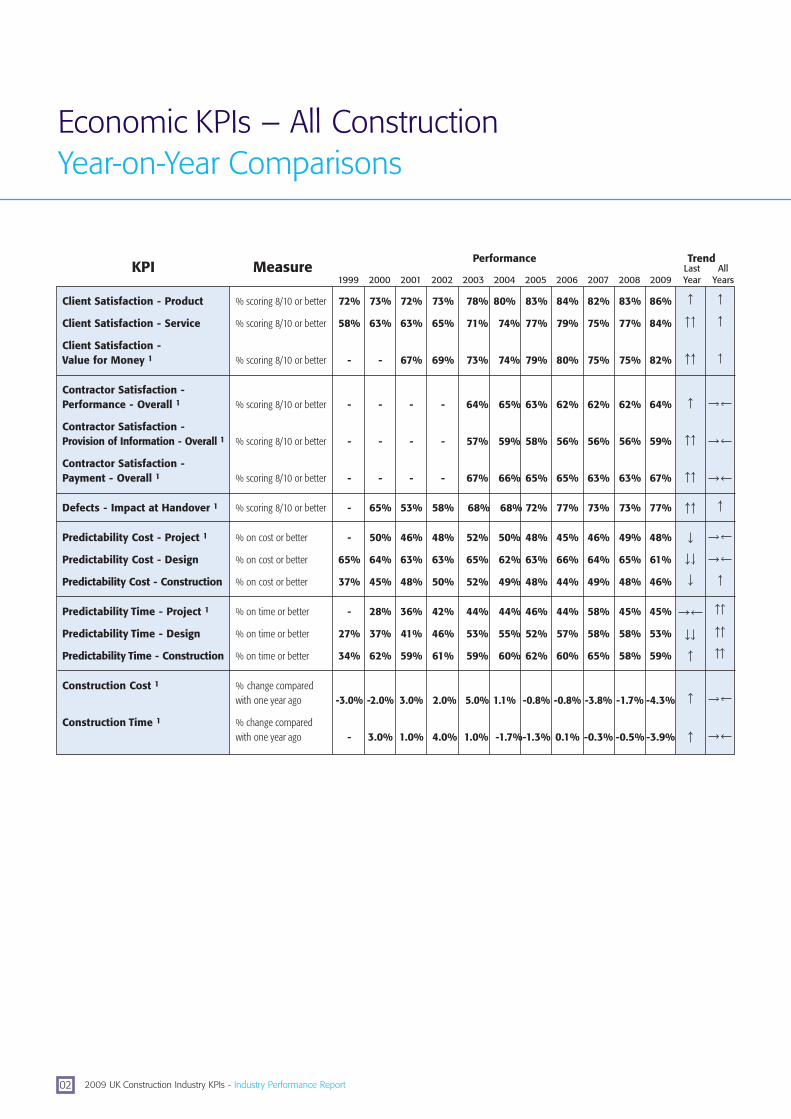
Impact on the Environment % scoring 8/10 or better 28% 32% 53% 54% 51% 55% 64%
Impact on Biodiversity % scoring 8/10 or better 34% 28% 33% 36% 34% 35% 31%
Whole Life Performance % scoring 8/10 or better 29% 35% 41% 41% 39% 35% 44%
Energy Use (Designed) Median energy use kgCO2 / 100m2 gross floor area 4414 4295 4291 3729 3775 4474 4539
Energy Use (Designed) - Housing SAP Rating 1 2 3 4 Median SAP2001 rating - 90 95 97 100 100 - - -
Energy Use (Designed) - Housing SAP Rating 1 3 Median SAP2005 rating - - - - - - 82 - -
Mains Water Use (Designed) 3 Median water use m3 / 100m2 gross floor area 69.6 70.4 53.2 52.0 90.4 80.0 49.5
Area of Habitat -Created/Retained 1 % when no change or an increase in area of habitat - 84% 76% 83% 78% 80% 82%
Construction Process Performance -
Impact on the Environment % scoring 8/10 or better 51% 56% 44% 45% 44% 48% 49%
Impact on Biodiversity % scoring 8/10 or better 35% 39% 45% 48% 46% 49% 47%
Energy Use (Current Values) Median energy use kgCO2 / £100k project value 288 322 293 293 273 192 241
Energy Use (Constant 2003Values) 5 Median energy use kgCO2 / £100k project value 288 335 327 343 331 243 303
Mains Water Use (CurrentValues) Median water use m3 / £100k project value 7.5 9.7 8.2 8.9 8.2 7.1 6.3
Mains Water Use (Constant2003 Values) 5 Median water use m3 / £100k project value 7.5 10.1 9.2 10.4 9.9 9.0 7.9
Waste (Current Values) Median waste removed from site m3 / £100kproject value 43.5 47.1 41.6 37.0 39.1 36.9 36.6
Waste (Constant 2003 Values) 5 Median waste removed from site m3 / £100kproject value 43.5 48.9 46.5 43.4 47.3 46.7 46.0
Commercial Vehicle Movements (Current Values) Median movements onto site / £100k project value 44.0 34.5 29.4 30.4 29.4 26.5 28.3
Commercial Vehicle Movements (Constant 2003
Values) 5 Median movements onto site / £100k project value 44.0 35.8 32.8 35.6 35.6 33.5 35.6
1 Data not available before the first year shown.
2 Data not available after 2008.
3 Limited data use with caution.
4 Insufficient data to publish a result in 2008. The 2007 result used for 2008.
5 Current values are delated by the “All Construction Output Price Index” for the first years KPI to arrive at constant values.
Performance
LastYear2003 2004 2005 2006 2007 2008 2009
AllYears
Trend

Key Performance Indicator
Key Performance Indicator
2003 2004 2005 2006 2007 2008 2009
(First year with data = 100)
120
80
140
160
60
100
120
80
200
140
180
160
60
100
Key Performance Indicator
120
80
140
180
160
60
100
229
Impact on theEnvironment -
Product
Impact onBiodiversity -
Product
Whole LifePerformance -
Product
Energy Use(Designed) -
Product
Energy Use(Designed)
Housing SAP 20011 2 3 4
Energy Use(Designed)
Housing SAP 20051 3
Mains Water Use(Designed) -
Product 3
Area of HabitatCreated/Retained -
Product 1
Impact on theEnvironment -
Construction Process
Impact on Biodiversity- Construction Process
Energy Use -Construction Process -
(Current Values)
Energy Use -Construction Process -
(Constant Values) 5
Mains Water Use -Construction Process -
(Current Values)
Mains Water Use -Construction Process -
(Constant Values) 5
Waste -Construction Process -
(Current Values)
Waste -Construction Process -
(Constant Values) 5
Transport Movements -Construction Process -
(Current Values)
Transport Movements -Construction Process -
(Constant Values) 5
2009 UK Construction Industry KPIs - Industry Performance Report 17

2009 UK Construction Industry KPIs - Industry Performance Report18
Economic KPIs – All HousingYear-on-Year Comparisons
1 In order to regularise the volatile mix of financial data by company size from year to year, in 2006 a standard method of weighting by number of employees was adopted in line with other international financial KPIs. This method was applied retrospectively to past years and, where applicable, their results were revised.
2 Current values are deflated by the "All Construction Output Price Index" for the first years KPI to arrive at constant values
3 This KPI is based on company annual accident incidence rate published by the Health & Safety Executive on its website at Table 1 "Injuries in GB by Industry and Severity of Injury as reported to all Enforcing Authorities".
4 There is no sector breakdown available for this KPI. This KPI is based on company annual accident incidence rates collected in the BERR ContractorSurvey adjusted for under reporting (see KPI Tutorial for details).
KPI MeasureTrend
Client Satisfaction - Product % scoring 8/10 or better 81% 86% 87% 81% 83% 86% 84%
Client Satisfaction - Service % scoring 8/10 or better 74% 80% 80% 78% 74% 84% 79%
Defects - Impact at Handover % scoring 8/10 or better 73% 78% 78% 82% 74% 80% 76%
Predictability Cost - Project % on cost or better 49% 60% 45% 43% 48% 40% 51%
Predictability Cost - Design % on cost or better 66% 66% 67% 67% 66% 71% 65%
Predictability Cost - Construction % on cost or better 48% 56% 49% 46% 56% 44% 50%
Predictability Time - Project % on time or better 46% 49% 44% 42% 46% 43% 40%
Predictability Time - Design % on time or better 51% 55% 51% 53% 58% 56% 55%
Predictability Time - Construction % on time or better 62% 62% 56% 57% 59% 54% 48%
Construction Cost % change compared with one year ago 0.3% 2.0% 1.0% -2.1% 1.8% -0.8% -0.5%
Construction Time % change compared with one year ago -1.8% -2.3% 2.2% 0.8% 1.0% -1.3% -4.9%
Profitability 1 Median % profit beforeinterest & tax 5.5% 7.7% 8.9% 8.5% 7.1% 8.8% 8.8%
Productivity (Current Values) 1 Median value added/ FTE employee (£000) 32.0 31.9 36.6 47.8 54.0 53.3 50.0
Productivity (Constant 2003 Values) 1 2 Median value added/ FTE employee (£000) 32.0 30.7 32.8 40.8 44.6 42.1 39.8
Safety - Industry 3 Accident incidence rate 1097 1172 1023 901 946 865 906
Safety - Contractors - % achieving zero accidentAll Companies 4 incidence rate 39% 42% 50% 51% 62% 60% 63%
Last All2004 2005 2006 2007 2008 2009 Year Years2003
Performance
2009 UK Construction Industry KPIs - Industry Performance Report 19
140
60
2003 2005 2006 2007 2008 20092004
Key Performance Indicator
Key Performance Indicator
160
180
80
120
140
60
160
180
80
120
Client Satisfaction -
Product
Client Satisfaction -
Service
Defects PredictabilityCost -Design
PredictabilityCost -
Construction
Safety -Industry 3
Safety - AllCompanies 4
Profitability 1 Productivity(Current Values) 1
Productivity(Constant 2003
Values) 1 2
ConstructionCost
ConstructionTime
PredictabilityTime - Design
PredictabilityTime -
Construction
PredictabilityTime -Project
PredictabilityCost -Project
(First year with data = 100)
100
100

KPI MeasurePerformance Trend
Client Satisfaction - Product % scoring 8/10 or better 76% 77% 81% 85% 82% 82% 86%
Client Satisfaction - Service % scoring 8/10 or better 70% 73% 75% 79% 78% 72% 86%
Defects - Impact at Handover % scoring 8/10 or better 64% 60% 66% 74% 71% 68% 77%
Predictability Cost - Project % on cost or better 54% 50% 48% 46% 45% 51% 47%
Predictability Cost - Design % on cost or better 66% 63% 63% 68% 65% 62% 59%
Predictability Cost - Construction % on cost or better 52% 48% 47% 43% 46% 50% 44%
Predictability Time - Project % on time or better 46% 41% 46% 45% 46% 48% 47%
Predictability Time - Design % on time or better 57% 60% 54% 60% 54% 61% 50%
Predictability Time - Construction % on time or better 59% 59% 65% 62% 60% 57% 65%
Construction Cost % change compared with one year ago 3.4% 1.2% 0.4% -0.8% -2.9% 0.6% -3.2%
Construction Time % change compared with one year ago 1.5% -0.3% -0.3% 1.0% -1.3% 0.7% -3.4%
Profitability 1 Median % profit beforeinterest & tax 4.9% 6.4% 7.6% 7.5% 8.2% 9.1% 9.4%
Productivity (Current Values) 1 Median value added/ FTE employee (£000) 29.4 30.1 31.6 35.9 39.0 41.8 43.3
Productivity (Constant 2003 Values) 1 2 Median value added/ FTE employee (£000) 29.4 29.0 28.3 30.6 32.2 33.0 34.4
Safety - Industry 3 Accident incidence rate 1097 1172 1023 901 946 865 906
Safety - Contractors % achieving zero accident- All Companies 4 incidence rate 39% 42% 50% 51% 62% 60% 63%
1 In order to regularise the volatile mix of financial data by company size from year to year, in 2006 a standard method of weighting by numberof employees was adopted in line with other international financial KPIs. This method was applied retrospectively to past years and, where applicable, their results were revised.
2 Current values are deflated by the "All Construction Output Price Index" for the first years KPI to arrive at constant values
3 This KPI is based on company annual accident incidence rate published by the Health & Safety Executive on its website at Table 1 "Injuries in GB by Industry and Severity of Injury as reported to all Enforcing Authorities".
4 There is no sector breakdown available for this KPI. This KPI is based on company annual accident incidence rates collected in the BERR Contractor Survey adjusted for under reporting (see KPI Tutorial for details).
Economic KPIs – All Non-HousingYear-on-Year Comparisons
2009 UK Construction Industry KPIs - Industry Performance Report20
2003 2004 2005 2006 2007 2008 2009Last Year
AllYears

140
Key Performance Indicator
186
Key Performance Indicator
160
180
80
120
140
60
160
180
80
120
Client Satisfaction -
Product
Client Satisfaction -
Service
Defects -Impact at Handover
Safety -Industry 3
PredictabilityCost -Design
Predictability Cost -
Construction
Profitability 1 Productivity (Current Values) 1
Productivity
Values) 1 2(Constant 2003
ConstructionCost
ConstructionTime
PredictabilityTime - Design
60Predictability
Time - Construction
PredictabilityTime -Project
PredictabilityCost -Project
2003 2004 2005 2006 2007 2008 2009
Safety - Contractors -
All Companies 4
(First year with data = 100)
100
100
192
2009 UK Construction Industry KPIs - Industry Performance Report 21

2009 UK Construction Industry KPIs - Industry Performance Report22
Construction Consultants KPIsYear-on-Year Comparisons
KPI Measure
Client Satisfaction - Overall Performance % scoring 8/10 or better 45% 42% 48% 51% 50% 52% 54% 55%
Client Satisfaction - Value for Money % scoring 8/10 or better 39% 37% 45% 41% 49% 47% 46% 46%
Client Satisfaction - Quality of service % scoring 8/10 or better 42% 43% 45% 43% 47% 49% 49% 49%
Client Satisfaction - Timely delivery % scoring 8/10 or better 41% 38% 42% 36% 38% 44% 45% 45%
Client Satisfaction - H&S awareness % scoring 8/10 or better 42% 39% 49% 45% 54% 55% 57% 58%
Training Median annual training daysper FTE employee 1.9 2.2 3.2 2.0 1.4 1.2 1.5 2.0
Profitability 1 Median % profit before interest and tax 8.0% 7.5% 8.6% 9.3% 9.6% 10.7% 13.3% 14.8%
Productivity (Current Values) 1 Median value added / UK FTE employee (£000s) 31.0 33.4 35.6 36.4 36.4 40.9 46.1 48.7
Productivity (Constant 2002 Values) 1 2 Median value added / UK FTE employee (£000s) 31.0 32.4 33.2 31.6 30.1 32.7 35.3 37.5
Trend
20032002 2004 2005 2006 2007 2008 2009LastYear
AllYears
Performance
1 In order to regularise the volatile mix of financial data by company size from year to year, in 2006 a standard method of weighting by number of employees was adopted in line with other international financial KPIs. This method was applied retrospectively to past years and, where applicable, their results were revised.
2 Current values deflated by the "All Construction Output Price Index" for the first years KPI to arrive at constant values.

2009 UK Construction Industry KPIs - Industry Performance Report 23
180
70
80
90
110
120
150
140
160
130
170
20032002 2004 2005 2006 2007 2008 2009
Key Performance Indicator
Key Performance Indicator
60
60
ClientSatisfaction
OverallPerformance
ClientSatisfactionValue forMoney
ClientSatisfactionQuality of
Service
ClientSatisfaction
TimelyDelivery
ClientSatisfaction
H&SAwareness
180
70
80
90
110
120
150
140
160
130
170
Training Productivity(Current Values) 1
Profitability 1 Productivity(Constant 2002
Values) 1 2
(First year with data = 100)
100
100
185

2009 UK Construction Industry KPIs - Industry Performance Report24
M&E Contractors KPIsYear-on-Year Comparisons
KPI Measure
Client Satisfaction - Design % scoring 8/10 or better 38% 37% 39% 51% 61% 63% 63% 60% 64%
Client Satisfaction - Installation % scoring 8/10 or better 56% 68% 65% 63% 67% 71% 74% 72% 71%
Client Satisfaction - Service % scoring 8/10 or better 56% 55% 58% 61% 69% 66% 67% 68% 69%
Client Satisfaction - Quality % scoring 8/10 or better 50% 44% 38% 44% 44% 45% 46% 48% 48%O&M Manuals
Defects % scoring 8/10 or better 63% 55% 63% 60% 66% 66% 66% 68% 69%
Predictability - Cost % on cost or better 37% 40% 41% 42% 43% 45% 47% 47% 46%
Predictability - Time % on time or better 53% 52% 49% 46% 47% 49% 53% 54% 53%
Profitability Median % profit turnover 2.2% 4.2% 3.9% 4.3% 4.3% 4.1% 3.9% 4.1% 3.9%
Productivity (Current Values) Median value added / 26.1 34.0 43.0 50.0 50.0 49.8 55.0 55.7 53.9M&E operative (£000)
Productivity (Constant 2001 Values) 2 Median value added / 26.1 32.9 40.3 45.1 42.0 39.8 42.6 41.3 40.2M&E operative (£000)
Safety - M&E Contractors - % achieving zero accident All Companies 3 incidence rate - 31% 35% 22% 32% 34% 48% 50% 55%
Safety - M&E Contractors - % achieving zero accident Companies with 60 staff or more 3 incidence rate - 7% 14% 4% 13% 16% 23% 24% 25%
2001
TrendPerformanceLastYear2002 2003 2004 2005 2006 2007 2008 2009
AllYears
2 Current values deflated by the "All Construction Output Price Index" for the first years KPI to arrive at constant values.
3 Based on company annual accident incidence rates collected in the BSRIA M&E Contractors Survey. From 2002 data has been adjusted
for under reporting, therefore, direct comparison with 2001 is not valid.

180
60
80
140
160
200
120
Key Performance Indicator
2001 2002 2003 2004 2005 2006 2007 2008 2009
180
60
80
140
160
200
220
240
120
Key Performance Indicator
40
ClientSatisfaction -
Design
ClientSatisfaction -Installation
ClientSatisfaction -
Service
ClientSatisfaction - Quality of
O&M Manuals
-
Defects Predictability -Cost
Predictability - Time
Profitability Productivity(Current Values)
Safety - M&E Contractors -All Companies 3
(First year with data = 100)
Safety -M&E Contractors -Companies with
60 or more staff 3
40
100
100
Productivity(Constant 2001
Values) 2
357343329
2009 UK Construction Industry KPIs - Industry Performance Report 25

2009 UK Construction Industry KPIs - Industry Performance Report26
Construction Products Industry KPIsYear-on-Year Comparisons
KPI Measure
Customer Satisfaction
Product Quality % scoring 8/10 or better 57% 73% 80% 74% 79% 77% 82%
Delivery Reliability % scoring 8/10 or better 68% 64% 63% 65% 70% 62% 72%
Sales Advice % scoring 8/10 or better 53% 55% 63% 55% 48% 42% 36%
After Sales Service % scoring 8/10 or better 49% 52% 64% 63% 66% 66% 72%
Value for Money % scoring 8/10 or better 51% 53% 47% 54% 56% 50% 50%
Environment
Energy Use 2 3 Median energy consumed KgCO2 / 10 tonne of production output 743 1397 869 115 80 113 - - -
Water Use 2 3 Median water used m3 / 10 tonne of production output 1.90 2.00 2.09 1.13 1.55 0.83 - - -
Waste Reduction 2 3 Median tonnes of waste leaving site as a % of total production output 1.33% 2.29% 1.19% 0.72% 0.59% 0.48% - - -
Transport Movements 1 2 3 Median number movements / 10 tonneof production output - 1.20 0.79 0.59 0.59 0.50 - - -
Packaging Management 1 2 3 Median tonnes of packaging bought as a % of total production output - 1.01% 1.01% 1.01% 0.47% 0.24% - - -
People
Safety at Work 3 Mean accident incidence rate 2050 2412 1702 1416 1416 1288 - - -
Sickness Absence 3 Median number of days lost per employee 6.1 6.1 5.9 6.0 5.9 4.7 - - -
Training 3 Median annual training days / full-time equivalent employee 1.3 1.4 1.6 1.5 1.6 2.1 - - -
Qualifications 3 Median % of full-time employeesqualified To NVQ Level 2 or higher 24% 28% 28% 30% 35% 20% - - -
Equality & Diversity 1 3 % scoring 8/10 or better - - 18% 30% 39% 49% - - -
2003 2004 2005 2006 2007 2008 2009
PerformanceLastYear
AllYears
1 Data not available before the first year shown.
2 Sample sizes unstable. Trends not provided as they may be misleading.
3 Data for this KPI has not been updated since 2008
Trend
110
70
60
130
90
80
120
150
140
160
180
170
200
190
50
110
70
60
130
90
80
120
150
140
160
180
170
200
190
50
2002 2003 2004 2005 2006 2007 2008 2009
Key Performance Indicator
Key Performance Indicator
646 935 659 229
225 203 203 240 215 217 272421227
Environment -Waste
Reduction 2 3
Environment -Transport
Movements 1 2 3
Environment -Packaging
Management 1 2 3
People - Sickness Absence 3
People - Safety at Work 3
People -Training 3
People -Qualifications 3
People - Equality & Diversity 1 3
(First year with data = 100)
Customer Satisfaction - Product Quality
Customer Satisfaction - Delivery Reliability
Customer Satisfaction - After Sales Service
Customer Satisfaction - Value for Money
Environment - Energy Use 2 3
Environment - Water Use 2 3
Customer Satisfaction - Sales Advice
100
100
2009 UK Construction Industry KPIs - Industry Performance Report 27

2009 UK Construction Industry KPIs - Industry Performance Report28
Constructing Excellence Demonstration ProjectsYear-on-Year Comparisons
KPI Measure
Economic KPIs:
Client Satisfaction - Product % scoring 8/10 or better 93% 84% 90% 90% 89% 86% 86% 88% 89%
Client Satisfaction - Service % scoring 8/10 or better 76% 78% 86% 94% 88% 83% 83% 90% 92%
Defects - Impact at Handover % scoring 8/10 or better 82% 86% 87% 75% 84% 78% 79% 87% 86%
Predictability Cost - Project 1 % on cost or better - - - - - 73% 92% 77% 88%
Predictability Time - Project 1 % on time or better - - - - - 79% 86% 89% 90%
Profitability 2 Median % profit before interest & tax 6.0% 5.0% 6.0% 6.5% 7.0% 10.0% 9.8% 7.1% 7.6%
Productivity (Current Values) Median value added/ FTE employed (£000) 37.0 35.0 36.0 55.0 89.7 79.0 84.3 84.5 84.0
Productivity(Constant 2000 Values) 3 Median value added/
FTE employed (£000) 37.0 33.9 33.8 49.6 75.3 63.2 65.3 62.6 62.6
Respect for People KPIs:
Safety - Overall 4 Mean accident incidence rate 569 605 428 435 458 425 410 330 317
Safety - All Projects 4 % scoring zero accident incidence rate - - - 78% 78% 76% 77% 65% 81%
Employee Satisfaction % scoring 8/10 or better - - - 89% 92% 88% 90% 90% 87%
Staff Turnover - All Projects Median % staff turnover - - - 2.0% 3.0% 4.0% 3.0% 3.0% 3.0%
Qualifications & Skills Median % of direct employees qualified to NVQ Level 2 or higher - - - 100% 93% 96% 98% 98% 98%
Environment KPIs:
Environmental Impact - Product % scoring 8/10 or better - - 62% 71% 82% 93% 88% 92% 93%
Environmental Impact -Construction Process % scoring 8/10 or better - - 76% 82% 83% 89% 88% 90% 90%
20022001 2003 2004 2005 2006 2007 2008 2009
Trend
1 Data not available before the first year shown.
2 Some of the CE data sets that show a 0% profit have been excluded as they are from the clients point of view and, therefore, no profit would be made.
3 Current values are deflated by the “All Construction Output Price Index” for the first years KPI to arrive at constant values.
4 CE safety data is project based while KPI safety data is company based..
PerformanceAll
YearsLastYear

120
200
180
160
220
240
260
140
80
60
40
20
0
100
20022001 2003 2004 2005 2006 2007 2008 2009
Key Performance Indicator
Key Performance Indicator
ClientSatisfaction -
Product
ClientSatisfaction -
Service
Defects -Impact atHandover
PredictabiliCost
Project 1
PredictabiliTime
Project 1
Profitability 2
Productivity
EnvironmentalImpact -Process 1
EnvironmentalImpact -Product 1
Safety - All Projects 4
Productivity
All Projects 1
StaffrTurnove -
Employee Satisfaction 1
Qualifications& Skills 1
(First year with data = 100)
Safety - Overall 4
120
180
160
140
80
60
40
20
0
100
(Current Values) (Constant 2000 Values) 3
2009 UK Construction Industry KPIs - Industry Performance Report 29

2009 UK Construction Industry KPIs - Industry Performance Report30
Constructing Excellence Demonstration Projects (contd.)
Comparison with All Construction
KPI Measure
Economic KPIs:
Client Satisfaction - Product % scoring 8/10 or better 86% 89%
Client Satisfaction - Service % scoring 8/10 or better 84% 92%
Defects - Impact at Handover % scoring 8/10 or better 77% 86%
Predictability Cost - Project % on cost or better 48% 88%
Predictability Time - Project % on time or better 45% 90%
Profitability 2 Median % profit before interest & tax 9.9% 7.6%
Productivity (Current Values) Median value added / FTE employed (£000) 46.2 84.0
Productivity (Constant 2000 Values) 3 Median value added / FTE employed (£000) 33.0 62.6
Respect for People KPIs:
Safety - Overall 4 Accident incidence rate 906 317
Safety - All Projects 4 % scoring zero accident incidence rate 63% 81%
Employee Satisfaction % scoring 8/10 or better 44% 87%
Staff Turnover - All Projects Median % staff turnover 4.2% 3.0%
Qualifications & Skills Median % of direct employees qualified to NVQ Level 2 or higher 22% 98%
Environment KPIs:
Environmental Impact - Product % scoring 8/10 or better 64% 93%
Environmental Impact -Construction Process % scoring 8/10 or better 49% 90%
2 Some of the CE data sets that show a 0% profit have been excluded as they are from the clients point of view and, therefore, no profit would be made.
3 Current values are deflated by the “All Construction Output Price Index” for the first years KPI to arrive at constant values.
3 CE safety data is project based while KPI safety data is company based.
All ConstructionPerformance
2009
ConstructingExcellence
DemonstrationPerformance
2009

2009 UK Construction Industry KPIs - Industry Performance Report 31
Key Performance Indicator
Key Performance Indicator
ClientSatisfaction -
Product
ClientSatisfaction -
Service
Defects - Impact atHandover
Predictability - Cost
Project 1
Predictability - Time
Project 1
Productivity(Constant 2000 Values) 3
SafetyOverall 4
Employee Satisfaction
StaffTurnover -
All Projects
Qualifications& Skills
Environmental Impact - Process
Environmental Impact - Product
150
200
250
300
50
0
100
Safety -All Projects 4
(All Construction = 100)
150
50
300
100
200
250
0Profitability 2 Productivity
(Current Values)
445

2009 UK Construction Industry KPIs - Industry Performance Report32
Appendix
The UK Construction Industry Key Performance
Indicators (KPIs) have been published by
Constructing Excellence every year since 1999
using data collected under the guidance of the
Department for Business Enterprise and
Regulatory Reform.
The Industry Performance Report summarises the trends in
performance of the main sets of KPIs to show to what extent
the industry is improving in key aspects of economic, social
and environment performance. This information can be used by
government departments and organisations committed to driving
industry performance forward to inform policy, and also by
individual organisations to measure their rate of performance
improvement against that of the wider industry.
Between 1999 and 2006, the Industry Performance Report was
published in hard copy as part of the UK Construction Industry
KPI Pack and UK Housing KPI Toolkit. Since 2007, publication of
the KPIs has been on the KPIzone website (www.kpizone.com).
More details of KPIzone can be found on page 37.

How to read the Data Tables and GraphsThe industry KPI performance is summarised into tables and graphs whose key features are summarised below:
KPI summary table
KPI group and industry sector
Explanatory notes
How change in the industry is measured
The year the data was reported. The datarelates to performance in the previous year.
Trend between latestyear and previous
year’s performance
Trend between latestyear and first year
data available
KPI name
Economic KPIs - All Construction -Year on Year Comparisons
2009 UK Construction Industry KPIs - Industry Progress Report 33
KPI MeasurePerformance Trend
Client Satisfaction - Product % scoring 8/10 or better 72% 73% 72% 73% 78% 80% 83% 84% 82% 83% 86%
Client Satisfaction - Service % scoring 8/10 or better 58% 63% 63% 65% 71% 74% 77% 79% 75% 77% 84%
Client Satisfaction -Value for Money 1 % scoring 8/10 or better - - 67% 69% 73% 74% 79% 80% 75% 75% 82%
Contractor Satisfaction -Performance - Overall 1 % scoring 8/10 or better - - - - 64% 65% 63% 62% 62% 62% 64%
Contractor Satisfaction -Provision of Information - Overall 1 % scoring 8/10 or better - - - - 57% 59% 58% 56% 56% 56% 59%
Contractor Satisfaction -Payment - Overall 1 % scoring 8/10 or better - - - - 67% 66% 65% 65% 63% 63% 67%
Defects - Impact at Handover 1 % scoring 8/10 or better - 65% 53% 58% 68% 68% 72% 77% 73% 73% 77%
Predictability Cost - Project 1 % on cost or better - 50% 46% 48% 52% 50% 48% 45% 46% 49% 48%
Predictability Cost - Design % on cost or better 65% 64% 63% 63% 65% 62% 63% 66% 64% 65% 61%
Predictability Cost - Construction % on cost or better 37% 45% 48% 50% 52% 49% 48% 44% 49% 48% 46%
Predictability Time - Project 1 % on time or better - 28% 36% 42% 44% 44% 46% 44% 58% 45% 45%
Predictability Time - Design % on time or better 27% 37% 41% 46% 53% 55% 52% 57% 58% 58% 53%
Predictability Time - Construction % on time or better 34% 62% 59% 61% 59% 60% 62% 60% 65% 58% 59%
Construction Cost 1 % change compared with one year ago -3.0% -2.0% 3.0% 2.0% 5.0% 1.1% -0.8% -0.8% -3.8% -1.7% -4.3%
Construction Time 1 % change comparedwith one year ago - 3.0% 1.0% 4.0% 1.0% -1.7%-1.3% 0.1% -0.3% -0.5% -3.9%
1999 2000 2001 2002 2003 2004 2005 2006 2007 2008 2009LastYear
AllYears
1 Data not available before the first year shown.
2 The measure for this KPI was changed in 2000, 1999 data therefore not reported. In order to regularise the volatile mix of financial data by company size from year to year, in 2006 a standard method of weighting by number of employees was adopted in line with other international financial KPIs. This method was applied retrospectively to past years and, where applicable, their results were revised.
3 Current values are deflated by the "All Construction Output Price Index" for the first years KPI to arrive at constant values .
4 This KPI is based on company annual accident incidence rate published by the Health & Safety Executive on its website at Table 1 "Injuries in GB by Industry and Severity of Injury as reported to all Enforcing Authorities".
5 Data for this KPI was not available before 2002. This KPI is based on company annual accident incidence rates collected in the BERR ContractorSurvey adjusted for under reporting.

2009 UK Construction Industry KPIs - Industry Progress Report34
Subsequent year’s data shows relative performance compared to first year ofdata. For example, a result of 120 represents a 20% improvement over the
result of the first year. A result of 80 represents a 20% decline in performance
KPI group andindustry sector
KPI name
KPI performanceover each year
Brief commentary onKPI performance
KPI group trend graph
Individual KPI trend graph
KPI name
Economic KPIs - All Construction -Year on Year Comparisons
Client Satisfaction - Product
The annual KPI surveys ask clients to rate how satisfied
they were with the completed facility on a scale
from1-10.
After levelling off between 2005 and 2008, there was a
strong improvement in 2009 to an all-time high of 86%
of projects scoring 8 out of 10 or better.
100%
90%
80%
70%
60%
30%
40%
50%
20%
10%
0%
BETTER
% scoring 8/10 or better
1999
72%
2000
73%
2001
72%
2002
73%
2003
78%
2004
80%
2005
83%
2006
84%
2007
82%
2009
86%
2008
83%
Key Performance Indicator
1999 2000 2001 2002 2003 2004 2005 2006 2007 2008 2009
(First year with data = 100)
60
80
100
120
140
160
180
200
220
ClientSatisfaction - Product
ClientSatisfaction -
Service
ClientSatisfaction -
Value for Money 1
ContractorSatisfaction -Performance -
Overall 1
ContractorSatisfaction - Provision of Information - Overall 1
ContractorSatisfaction - Payment - Overall 1
Defects 1 PredictabilityCost -
Project 1
240
First year result isalways indexed to 100
How to read the Data Tables and Graphs (contd.)The industry KPI performance is summarised into tables and graphs whose key features are summarised below:

Data Sources for the UK Construction Industry KPIs
M&E ContractorsKPIs
Co-ordinated by BSRIA
Annual survey of M&E clients
Annual survey of
M&E contractors
ConstructionConsultants KPIs
Co-ordinated by the
Association for Consulting
and Engineering, the Royal
Institution of British
Architects, the Royal
Institution of Chartered
Surveyors, the Chartered
Institute of Building, the
Chartered Institute of
Architectural Technologists,
and the Chartered
Institution of Building
Services Engineers.
Annual survey of clients
Annual survey of
consultancy firms
ConstructionProducts IndustryKPIs
Co-ordinated by
Construction Products
Association
Annual survey of customers
(main contractors, specialist
contractors, architects and
construction clients)
Annual survey of
construction products
manufacturers.
DemonstrationProjects
Co-ordinated by
Constructing Excellence
Data submitted by
Constructing Excellence
Demonstration Projects
2009 UK Construction Industry KPIs - Industry Progress Report 35

2009 UK Construction Industry KPIs - Industry Progress Report36
Data Sources (contd.)
Economic KPIs
Client Satisfaction
- Product1,6
1,6
1,6
1,6
1,6
2,9
8
8
4,7
3
5
2
2
2,9
10
2
1,6
2
1,6
1,6
2
2
1,6
2
2
1,6
1,6
1,6
11
12
Client Satisfaction
- Service
Defects
2Contractor Satisfaction
Predictability - Cost
Predictability - Time
Safety
Productivity
Profitability
Construction Cost
Construction Time
Respect forPeople KPIs
Employee Satisfaction
Staff Turnover
Sickness/Absence
Safety
Working Hours
Qualifications & Skills
Equality & Diversity
Training
Pay
Investors in People
Environment KPIs
Impact on the
Environment
Energy Use (Designed)
- Product
Mains Water Use
- Construction Process
Waste
Commercial Vehicle
Movements
Impact on
Biodiversity
Area of Habitat
Created/Retained
Whole Life
Performance
Data Source(see below)
The data sources referred to in the table above are:
1. ONS Quarterly Clients’ KPI Survey
2. ONS Quarterly Contractor KPI Survey
3. ONS New Orders Survey
4. ONS Quarterly Building Price & Cost Indices
5. ONS Annual Employee Satisfaction Survey
6. BCIS Annual Clients’ KPI Survey
7. BCIS Quarterly Review of Building Prices
8. Dun and Bradstreet, Intercompany Comparisons, and Companies House supplied by pH Group Ltd
9. Health & Safety Executive
10. ONS - Labour Force Survey
11. ONS - Annual Survey ofHours and Earnings
12. Investors in People UK Ltd
Data Source(see below)
Data Source(see below)
Energy Use
- Construction Process
Mains Water Use
(Designed) - Product
Data Sources (contd.)

About Constructing Excellence
Constructing Excellence provides a range of services to help implement KPIs:
At Constructing Excellence we bring distinctive value to our customers’ businesses through six core activities:
Action Research and Innovation:Members shape and take part in Constructing Excellence’s researchprogramme, from major action research projects to working groups andconfidential learning clubs.
KPIs and Benchmarking:Constructing Excellence has led the way in industry performancemeasurement, with diagnostic tools central to its activities.Members receive:
• Complimentary KPIzone subscription
• Complimentary introductory Explorer InteractiveTM
business diagnostic session
• 20% discount on KPI Workshops
Guidance and Training:Constructing Excellence is able to offer members consultancy tailoredto their business requirements. This service includes free or discountedaccess to Constructing Excellence publications, and discounts onfacilitation and mentoring services and conferences.
Networks:Existing members see real benefits in these networks, meeting withother like minded individuals and companies, building relationships,sharing best practice and developing business contacts.
Demonstrations:One of the key benefits of membership is being able to demonstrateparticipation to key stakeholders such as customers, employees,suppliers and investors. Constructing Excellence provides members:
• Opportunities to showcase projects
• Opportunities to share and learn from members’ exemplars
• Invitations to speak as an acknowledged industry leader at Constructing Excellence events
Leadership and Influence:Constructing Excellence works closely with government, strategicpartners, firms and influences organisations to shape the future of thesector. Members have the chance to take an active role in influencingGovernment priorities and to have input into the formation of futurepolicy at regular forums and conferences.
HelpdeskA direct point of contact to answer initial enquiries about KPIs. Tel 020 7592 1100
KPIZone WebsiteKPIzone is an on-line management tool that provides a straightforward step-by-step process to help companies and organisationsfrom all sectors of the construction industry to choose KPIs, andbenchmark performance.
KPIzone makes benchmarking easy, helping you create your ownKPI handbook, store and retrieve data and produce and print acomprehensive report of your performance results.
For further information visit www.kpizone.com .
KPI WorkshopsAn introduction to the benefits and use of the Construction Industry KPIs. Each Workshop explores the importance of measuringperformance with the help of practical examples, a step by stepguide to their use, and case studies of organisations that havesuccessfully implemented KPIs.
WebsiteAn extensive database of best practice activities, information andresources is available on www.constructingexcellence.org.uk .
CONSTRUCTING EXCELLENCEWarwick House
25 Buckingham Palace Road
London
SW1W 0PP 020 7592 1100
email: [email protected] www.constructingexcellence.org.uk www.kpizone.com
2009 UK Construction Industry KPIs - Industry Progress Report 37

CONSTRUCTING EXCELLENCEWarwick House25 Buckingham Palace RoadLondon SW1W 0PP
Tel: 020 7592 1100Fax: 020 7592 1101
E-mail: [email protected]: www.constructingexcellence.org.uk
BERR Department for BusinessEnterprise & Regulatory Reform
In Partnership with