Performance of Typical Concrete Mixtures for ... · Performance of Typical Concrete Mixtures for...
11
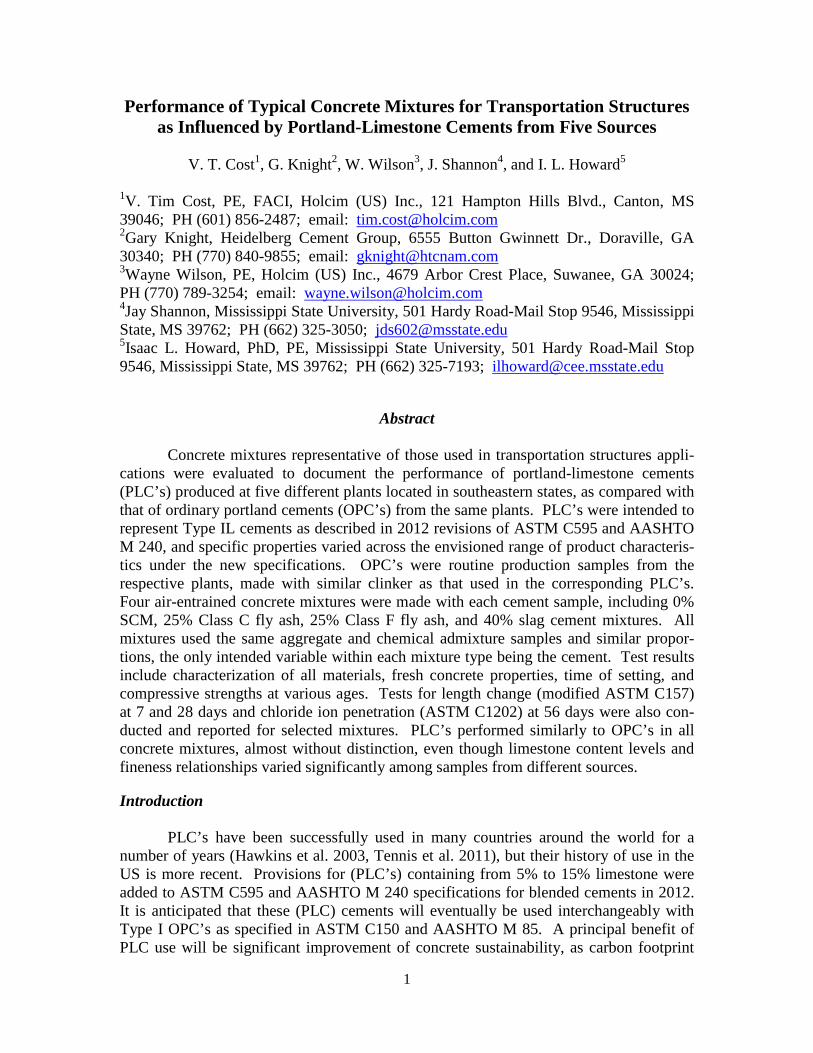
1 Performance of Typical Concrete Mixtures for Transportation Structures as Influenced by Portland-Limestone Cements from Five Sources V. T. Cost 1 , G. Knight 2 , W. Wilson 3 , J. Shannon 4 , and I. L. Howard 5 1 V. Tim Cost, PE, FACI, Holcim (US) Inc., 121 Hampton Hills Blvd., Canton, MS 39046; PH (601) 856-2487; email: [email protected] 2 Gary Knight, Heidelberg Cement Group, 6555 Button Gwinnett Dr., Doraville, GA 30340; PH (770) 840-9855; email: [email protected] 3 Wayne Wilson, PE, Holcim (US) Inc., 4679 Arbor Crest Place, Suwanee, GA 30024; PH (770) 789-3254; email: [email protected] 4 Jay Shannon, Mississippi State University, 501 Hardy Road-Mail Stop 9546, Mississippi State, MS 39762; PH (662) 325-3050; [email protected] 5 Isaac L. Howard, PhD, PE, Mississippi State University, 501 Hardy Road-Mail Stop 9546, Mississippi State, MS 39762; PH (662) 325-7193; [email protected] Abstract Concrete mixtures representative of those used in transportation structures appli- cations were evaluated to document the performance of portland-limestone cements (PLC’s) produced at five different plants located in southeastern states, as compared with that of ordinary portland cements (OPC’s) from the same plants. PLC’s were intended to represent Type IL cements as described in 2012 revisions of ASTM C595 and AASHTO M 240, and specific properties varied across the envisioned range of product characteris- tics under the new specifications. OPC’s were routine production samples from the respective plants, made with similar clinker as that used in the corresponding PLC’s. Four air-entrained concrete mixtures were made with each cement sample, including 0% SCM, 25% Class C fly ash, 25% Class F fly ash, and 40% slag cement mixtures. All mixtures used the same aggregate and chemical admixture samples and similar propor- tions, the only intended variable within each mixture type being the cement. Test results include characterization of all materials, fresh concrete properties, time of setting, and compressive strengths at various ages. Tests for length change (modified ASTM C157) at 7 and 28 days and chloride ion penetration (ASTM C1202) at 56 days were also con- ducted and reported for selected mixtures. PLC’s performed similarly to OPC’s in all concrete mixtures, almost without distinction, even though limestone content levels and fineness relationships varied significantly among samples from different sources. Introduction PLC’s have been successfully used in many countries around the world for a number of years (Hawkins et al. 2003, Tennis et al. 2011), but their history of use in the US is more recent. Provisions for (PLC’s) containing from 5% to 15% limestone were added to ASTM C595 and AASHTO M 240 specifications for blended cements in 2012. It is anticipated that these (PLC) cements will eventually be used interchangeably with Type I OPC’s as specified in ASTM C150 and AASHTO M 85. A principal benefit of PLC use will be significant improvement of concrete sustainability, as carbon footprint
Transcript of Performance of Typical Concrete Mixtures for ... · Performance of Typical Concrete Mixtures for...
1
Performance of Typical Concrete Mixtures for Transportation Structures as Influenced by Portland-Limestone Cements from Five Sources
V. T. Cost1, G. Knight2, W. Wilson3, J. Shannon4, and I. L. Howard5
1V. Tim Cost, PE, FACI, Holcim (US) Inc., 121 Hampton Hills Blvd., Canton, MS 39046; PH (601) 856-2487; email: [email protected] 2Gary Knight, Heidelberg Cement Group, 6555 Button Gwinnett Dr., Doraville, GA 30340; PH (770) 840-9855; email: [email protected] 3Wayne Wilson, PE, Holcim (US) Inc., 4679 Arbor Crest Place, Suwanee, GA 30024; PH (770) 789-3254; email: [email protected] 4Jay Shannon, Mississippi State University, 501 Hardy Road-Mail Stop 9546, Mississippi State, MS 39762; PH (662) 325-3050; [email protected] 5Isaac L. Howard, PhD, PE, Mississippi State University, 501 Hardy Road-Mail Stop 9546, Mississippi State, MS 39762; PH (662) 325-7193; [email protected]
Abstract
Concrete mixtures representative of those used in transportation structures appli-cations were evaluated to document the performance of portland-limestone cements (PLC’s) produced at five different plants located in southeastern states, as compared with that of ordinary portland cements (OPC’s) from the same plants. PLC’s were intended to represent Type IL cements as described in 2012 revisions of ASTM C595 and AASHTO M 240, and specific properties varied across the envisioned range of product characteris-tics under the new specifications. OPC’s were routine production samples from the respective plants, made with similar clinker as that used in the corresponding PLC’s. Four air-entrained concrete mixtures were made with each cement sample, including 0% SCM, 25% Class C fly ash, 25% Class F fly ash, and 40% slag cement mixtures. All mixtures used the same aggregate and chemical admixture samples and similar propor-tions, the only intended variable within each mixture type being the cement. Test results include characterization of all materials, fresh concrete properties, time of setting, and compressive strengths at various ages. Tests for length change (modified ASTM C157) at 7 and 28 days and chloride ion penetration (ASTM C1202) at 56 days were also con-ducted and reported for selected mixtures. PLC’s performed similarly to OPC’s in all concrete mixtures, almost without distinction, even though limestone content levels and fineness relationships varied significantly among samples from different sources. Introduction
PLC’s have been successfully used in many countries around the world for a number of years (Hawkins et al. 2003, Tennis et al. 2011), but their history of use in the US is more recent. Provisions for (PLC’s) containing from 5% to 15% limestone were added to ASTM C595 and AASHTO M 240 specifications for blended cements in 2012. It is anticipated that these (PLC) cements will eventually be used interchangeably with Type I OPC’s as specified in ASTM C150 and AASHTO M 85. A principal benefit of PLC use will be significant improvement of concrete sustainability, as carbon footprint
2
and embodied production energy of PLC are reduced, relative to OPC (Tennis et al. 2011). The use of byproduct SCM’s further extends sustainability benefits. In some cases it has been shown that SCM use in PLC mixtures, compared to that in similar OPC mixtures, may result in slightly enhanced strength development, setting, and occasionally other attributes (Cost et al. 2013, De Weerdt et al. 2011).
Some US producers of portland cement have in recent years supplied PLC’s under a performance specification, ASTM C1157, and reported experiences have been favora-ble (Cost et al. 2013, Van Dam et al. 2010). These experiences, however, have been somewhat limited in states where transportation agencies use AASHTO specifications, which until 2012 have had no corresponding designation. As new AASHTO M 240 specifications for PLC’s were evolving in 2012, questions were raised by some state agencies as to how such cements would perform in traditional concrete mixtures and what, if any, distinctions should be made in their allowable use, relative to OPC’s.
This study was undertaken to document the performance of PLC’s produced at
five different plants located in southeastern (AASHTO) states, as compared with that of OPC’s from the same plants, in concrete mixtures representative of those used in trans-portation structures applications. This project was originally proposed by the Georgia Department of Transportation, but when project funding proved to be unavailable, six Portland Cement Association member companies that ship cement into Georgia decided to collectively support the effort, including all laboratory work. Five of the six partici-pating companies supplied a PLC and an OPC sample for the project. The PLC and OPC sample from each respective plant was produced with a similar clinker and grinding circuit. The properties of both PLC and OPC samples varied across each respective specification range. Each cement sample was characterized for standard chemical and physical properties as well as limestone content and overall particle size distribution. The project scope involved four air-entrained concrete mixtures with each cement sample, including 0% SCM, 25% Class C fly ash, 25% Class F fly ash, and 40% slag cement mixtures, distinguished only by the cement sample. Though the Georgia Department of Transportation allows fly ash replacement of cement only up to 15% in such concrete mixtures, 25% fly ash replacement was chosen as a somewhat more extreme case for documenting SCM effects in such mixtures, but also in recognition that many of the other southeastern states allow fly ash use up to this level. Concrete mixtures were laboratory batched using routine protocols, and testing of both fresh and hardened concrete was done on each batch to provide realistic comparisons of concrete properties and perfor-mance as affected by the different cements.
Materials, Mixture Proportions, and Procedures
Cement samples were requested from participating producers without guidance as
to particular properties desired except that there should be one sample of each plant’s routine production OPC (ASTM C150 / AASHTO M 85 Type I or II) and one sample of a PLC, made from similar clinker produced during the same time period, that would be representative of envisioned production for Type IL cement according to ASTM C595 / AASHTO M 240. The samples were blind labeled (with respect to source) in random

3
fashion and are identified herein simply as OPC or PLC from sources A, B, C, D, and E. Table 1 contains chemical and physical properties for each cement sample. Upon initial evaluation, it was found that the PLC sample from source A actually exceeded the specification upper limit for limestone content, as calculated using the limestone purity provided by that plant, but this was thought to be a fortunate oversight since it provided the opportunity to document performance essentially over and slightly beyond the entire specification range of limestone content (6.2 to 16.0%). The Type I and II OPC’s
contained from 1.1% to 4.6% limestone (5% is the upper limit in specifications for portland cement, ASTM C150 and AASHTO M 85).
Cement fineness and particle size distribution (PSD) have been found to be criti-
cal influences on the performance of PLC, especially in relation to limestone content (Cost et al. 2013, De Weerdt et al. 2011, Tennis et al. 2011). To help document these properties, the PSD of each cement was measured using a laser diffraction particle size analyzer. Figure 1 compares the relationships of Blaine fineness and limestone content
Table 1. Properties of Cements Used in Testing

4
for OPC’s and PLC’s from each source. Figure 2 shows PSD’s for each cement, with indicated median particle size.
A single sample of each SCM
was obtained and used throughout. Properties of the SCM’s as reported in test certificates provided by the suppli-ers are summarized in Table 2. Other materials included a single sample of ASTM C494 (AASHTO M 194) Type A water reducing admixture and a sin-gle sample of ASTM C260 (AASHTO M 154) air entraining admixture. Aggregates included a local crushed granite coarse aggregate of 25 mm (1 in.) maximum size (no. 57) and a local, alluvial/marine sand fine aggregate, both meeting ASTM Specification C33/C33M and Georgia Department of Transportation requirements.
Four categories of concrete
mixtures were planned according to SCM use: no SCM’s, 25% Class C fly ash, 25% Class F fly ash, and 40% slag cement. A total of 40 concrete mixtures were batched, including a mix of each category with each cement sample. Concrete proportions were similar for each mix category, with changes only in the relative proportions of cementitious
Figure 1. Limestone content and Blaine fineness compared for each cement sample, by source.
Figure 2. PSD’s for each cement, by source.

5
components, except for slight adjust-ments in fine aggregate and water pro-portions to achieve a constant yield and relatively uniform slump. Total cementi-tious content was constant, at 363 kg/m3 (611 lb/yd3) for all mixtures. Coarse ag-gregate content was constant, at 1098 kg/m3 (1851 lb/yd3) for all mixtures, based on saturated surface dry (SSD) conditions. Fine aggregate content, after yield adjustments, ranged from 651 kg/m3 (1097 lb/yd3) to 698 kg/m3 (1176 lb/yd3), based on SSD conditions. All mixtures were proportioned assuming a 4.0% total air content, though actual air
content varied since control of air using replicate batches with admixture dosage adjust-ments was beyond the scope of this work. Constant admixture dosages of 2.6 mL/kg (4 fl oz/cwt) for the Type A water reducing admixture and 0.1 L/m3(2.5 fl oz/yd3) for the air entraining admixture were used throughout. Initial proportioning used a w/cm of 0.501 for “no SCM” mixtures and 0.475 for all mixtures containing SCM’s, selected based on experience with the materials for an objective slump range of 10 to 13 cm (4 to 5 in.), though actual water contents were adjusted as needed to achieve target slumps.
Concrete mixtures were made and tested at the Heidelberg Technology Center
facilities in Doraville, GA. All batches were 0.068 m3 (2.4 ft3) in design yield. Concrete was batched and mixed and concrete test specimens were obtained according to ASTM C192/C192M. Tests on each fresh concrete batch included slump (ASTM C143/C143M), air content (ASTM C231), unit weight and yield (ASTM C138/C138M), temperature (ASTM C1064/C1064M), and time of setting (ASTM C403/C403M). 10x20 cm (4x8 in.) cylindrical concrete specimens were tested for compressive strength ac-cording to ASTM C39/C39M at various ages.
Additional specimens from some batches were tested for chloride ion penetration
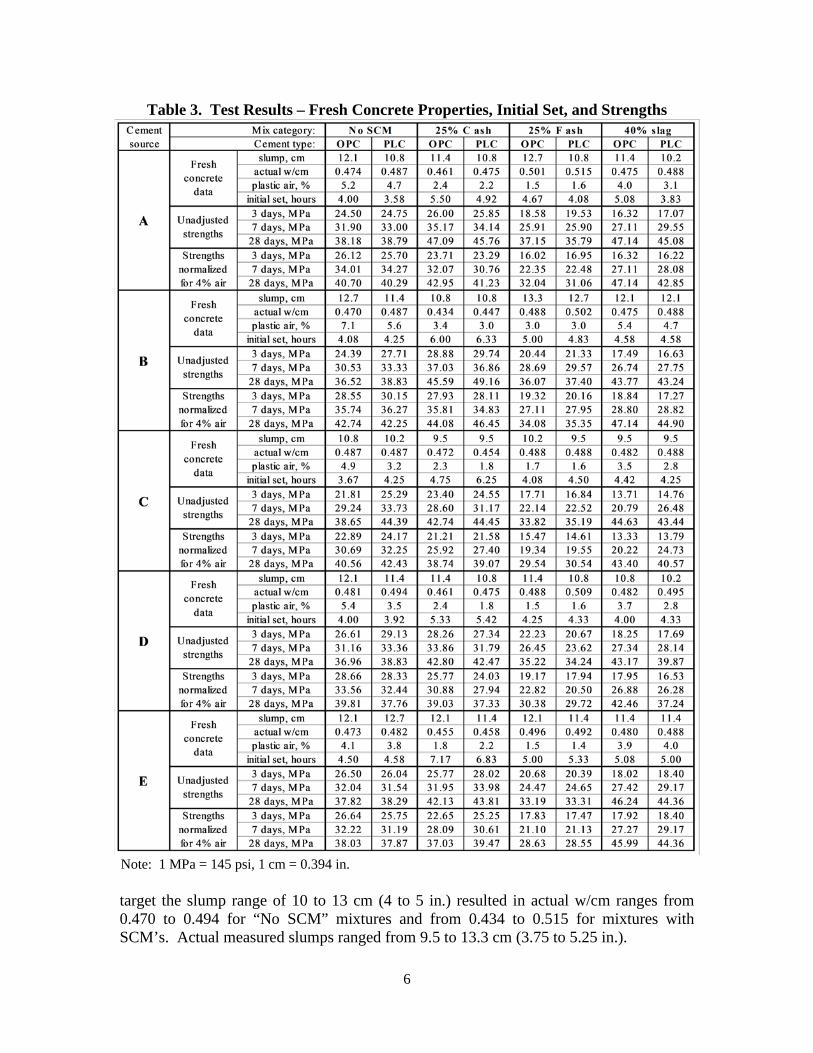
(ASTM C1202) and/or length change (ASTM C157/C157M, with modifications) at ages of interest. Specific batches were selected based on the availability of equipment and manpower, with the objectives of providing data for each mixture category and a range of PLC properties. Length change testing was done according to ASTM C157/C157M ex-cept that the moist curing period prior to 28 days of drying was only 7 days, rather than 28 days as called for in the specification. This protocol is called for by some state trans-portation agencies in the southeastern US. Test Results and Data Analysis Table 3 contains a summary of fresh concrete properties, time of initial set data, and strength test results. Each reported strength is the average of compressive tests of three 10x20 cm (4x8 in.) cylindrical concrete specimens. Mix water adjustments used to
Table 2. Properties of SCM’s
6
target the slump range of 10 to 13 cm (4 to 5 in.) resulted in actual w/cm ranges from 0.470 to 0.494 for “No SCM” mixtures and from 0.434 to 0.515 for mixtures with SCM’s. Actual measured slumps ranged from 9.5 to 13.3 cm (3.75 to 5.25 in.).
Table 3. Test Results – Fresh Concrete Properties, Initial Set, and Strengths
Note: 1 MPa = 145 psi, 1 cm = 0.394 in.
7
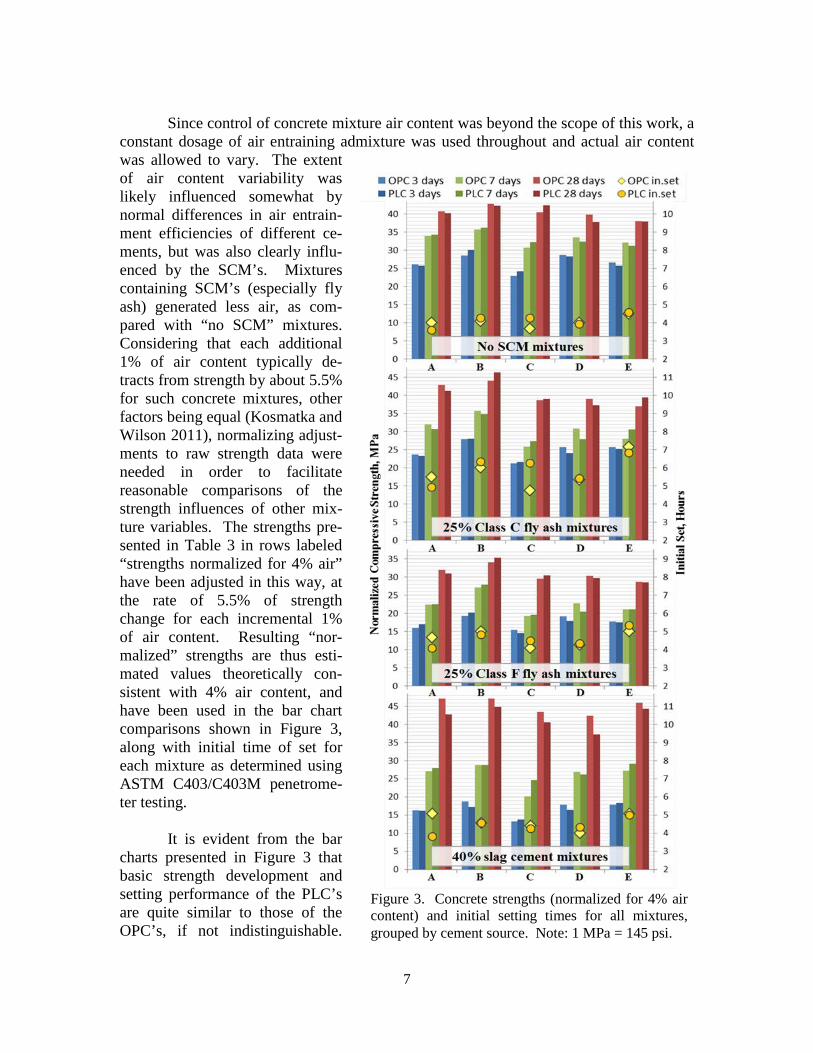
Since control of concrete mixture air content was beyond the scope of this work, a
constant dosage of air entraining admixture was used throughout and actual air content was allowed to vary. The extent of air content variability was likely influenced somewhat by normal differences in air entrain-ment efficiencies of different ce-ments, but was also clearly influ-enced by the SCM’s. Mixtures containing SCM’s (especially fly ash) generated less air, as com-pared with “no SCM” mixtures. Considering that each additional 1% of air content typically de-tracts from strength by about 5.5% for such concrete mixtures, other factors being equal (Kosmatka and Wilson 2011), normalizing adjust-ments to raw strength data were needed in order to facilitate reasonable comparisons of the strength influences of other mix-ture variables. The strengths pre-sented in Table 3 in rows labeled “strengths normalized for 4% air” have been adjusted in this way, at the rate of 5.5% of strength change for each incremental 1% of air content. Resulting “nor-malized” strengths are thus esti-mated values theoretically con-sistent with 4% air content, and have been used in the bar chart comparisons shown in Figure 3, along with initial time of set for each mixture as determined using ASTM C403/C403M penetrome-ter testing.
It is evident from the bar
charts presented in Figure 3 that basic strength development and setting performance of the PLC’s are quite similar to those of the OPC’s, if not indistinguishable.
Figure 3. Concrete strengths (normalized for 4% air content) and initial setting times for all mixtures, grouped by cement source. Note: 1 MPa = 145 psi.

8
Within each mixture cate-gory, there is generally less performance deviation be-tween each OPC and the corresponding PLC than between cement sources. Related variability is re-markably low for a data set without replicate mixtures and averaged results.
Figure 4 presents
strength bar charts for the averages of all sources of each cement type in each mixture category, based on the normalized data. These average strengths further support that PLC performance is almost identical to that of OPC in these mixtures, even though cement sample characteristics and limestone content vary rather widely within specification ranges.
There are clearly hydration synergies involving fine limestone particles of PLC’s
that contribute to the development of concrete properties; otherwise, dilution of clinker would detract from performance. These synergies include improved particle size distri-bution and packing, establishment of nucleation sites for more efficient hydration, reac-tion of calcium carbonate with aluminate phases to form calcium carboaluminates, and possibly other chemical interaction that accelerates the hydration of tricalcium silicate in the presence of calcium carbonate (Tennis et al. 2011). The extent of these performance synergies has been connected with fineness (total surface area) of ground limestone by many researchers, supporting the conclusion that such synergy is at least in part due to chemical interactions.
Some research has suggested that overall PLC fineness and PSD (thus related
properties of the limestone component fraction of the PLC) can be optimized so as to en-hance PLC performance beyond that of OPC made with the same clinker, especially in combination with SCM’s (Cost et al. 2013), and that for PLC’s having limestone contents in the range of 10% to 15%, roughly equivalent performance generally results when Blaine fineness is about 100 m2/kg higher than that of OPC made with similar clinker (Tennis et al. 2011, Thomas and Hooton 2010). The data produced in this study gener-ally support this premise as an approximation, with indications that hydration contribu-tions of limestone are possible over a range of specific PLC properties.
Documentation of concrete durability trends and other special performance attrib-
utes of PLC was not a principal objective of this work, and much data of this nature is readily available (Tennis et al. 2011, Thomas and Hooton 2010), but the concrete mix-tures comprising this study did avail an opportunity to compare permeability (chloride
Figure 4. Concrete strengths (normalized for 4% air content) for each mixture category and cement type – averages of mixtures for all 5 cement sources. Note: 1 MPa = 145 psi.

9
ion penetration as measured by ASTM C1202) and shrinkage (length change according to ASTM C157/C157M, with modifications) trends as influ-enced only by the limestone contents of a particular PLC relative to a corresponding OPC from a particular source.
Figure 5 shows chlo-
ride ion penetration test results at 56 days (each value is the average of two specimens), which included mixtures with cements from one of the ce-ment sources in each mixture category, except that mixtures using cements from two cement sources (A and E) were tested in the case of the No SCM mix category. This enabled a contrasting comparison as influenced by the limestone content extremes represented among the PLC samples (16% for PLC-A and 6.2% for PLC-E). These measurements do follow trends reported by some (Tennis et al. 2011, Thomas and Hooton 2010) in which the permeability of con-crete made using PLC without SCM’s may be slightly greater than that for similar OPC mixtures, especially for PLC’s with higher limestone content. Also in agreement with reported trends, though, influences of PLC’s are generally favorable relative to those of OPC’s in mixtures with SCM’s, resulting in lower permeability.
Figure 6 shows the re-
sults of length change tests after 28 days of drying for concrete specimens from all mixture categories made with cements from sources A, C, and E. While the only con-sistent indication of the influ-ence of limestone content is for slightly greater shrinkage associated with PLC mixtures in the case of source A (which was the 16% limestone con-tent PLC), the more signifi-cant trend is relative to the mixture category, as influ-enced by the particular SCM’s. Overall, slag mix-tures showed the least shrink-
Figure 5. Chloride ion penetration (ASTM C1202) results at 56 days (average of 2 specimens) for concrete from indicated batches.
Figure 6. Length change (modified ASTM C157/C157M) at 28 days for concrete specimens of each mixture category with cements from sources A, C, and E.
10
age, followed by Class F fly ash mixtures. Class C fly ash mixtures had the greatest indi-cated shrinkage, overall. Considering variability, most of these trends are rather slight, and it might be difficult to conclude from this data that there are any significant shrinkage influences relative to cement type (PLC vs. OPC). Summary and Conclusions • PLC’s produced by five different cement companies with limestone contents ranging
from 6.2% to 16% performed almost identically to the corresponding OPC’s from the same plants in all four mixture categories included (No SCM, 25% Class C fly ash, 25% Class F fly ash, and 40% slag cement), using materials common to northern Georgia and proportions typical of those used in transportation structures projects.
• No performance trends could be identified in any concrete data that would suggest the need for any operational distinctions when changing from OPC to PLC in projects using such mixtures.
• Variability of performance among the mixtures tested was noticeably greater as influenced by cement source or by mixture category (SCM replacement of cement) than as influenced by cement type (PLC vs. OPC) from the same source.
Acknowledgement The principal author wishes to express gratitude to the personnel and companies listed below for their commitment and dedication to this project, which would not have been possible without the production and supply of cement samples and the donation of considerable expertise and personnel time in the laboratory: Todd Moss - Argos USA Chris Walker - Argos USA Steve Wilcox - Argos USA Frank Lennox - Buzzi Unicem, USA Bill Goodloe – Cemex, Inc. Wayne Wilson – Holcim (US) Inc. Andy Chafin – Lehigh Cement Company / Heidelberg Technology Center Gary Knight – Lehigh Cement Company / Heidelberg Cement Group Derek Brown – Lehigh Cement Company Dan Green – National Cement Company Special thanks are owed to the Heidelberg Cement Group for hosting all testing at their laboratory facilities in Doraville, GA, and for conducting chemical and physical testing of cement samples.

11
References Cost, V. T., Howard, I. L., and Shannon, J., “Improving Concrete Sustainability and
Performance Using Portland-Limestone Cement (PLC) Synergies,” 92nd Annual Meeting of The Transportation Research Board, Washington, D.C., January 2013, Paper 13-4429, 15 pp.
De Weerdt, K., Kjellsen, K. O., Sellevold, E., and Justnes, H., “Synergy Between Fly Ash and Limestone Powder in Ternary Cements,” Cement and Concrete Composites, Volume 33, Issue 1, January 2011, pp. 30-38.
Hawkins, P., Tennis, P. D., and Detwiler, R. J., “The Use of Limestone in Portland Cement: A State-of-the-Art Review,” EB227, Portland Cement Association, Skokie, IL, 2003, 44 pp.
Kosmatka, S. H., and Wilson, M. L., “Design and Control of Concrete Mixtures,” EB001.15, Portland Cement Association, Skokie, IL, 2011, p. 157.
Tennis, P. D., Thomas, M. D. A., and Weiss, W. J., “State-of-the-Art Report on Use of Limestone in Cements at Levels of up to 15%,” PCA R&D SN3148, Portland Cement Association, Skokie, IL, 2011, 74 pp.
Thomas, M. D. A., and Hooton, R. D., “The Durability of Concrete Produced with Portland-Limestone Cement: Canadian Studies,” PCA R&D SN3142, Portland Cement Association, Skokie, IL, 2010, 26 pp.
Van Dam, T., Smartz, B., and Laker, T., “Performance Enhancing – Research Shows Ways of Reducing Concrete’s Footprint,” Roads & Bridges, November 2010, 6 pp.