Performance of the Muon Identification at LHCb - CERN · rUniversita di Ferrara, Ferrara, Italy`...
19
This content has been downloaded from IOPscience. Please scroll down to see the full text. Download details: IP Address: 137.138.125.164 This content was downloaded on 31/10/2013 at 10:19 Please note that terms and conditions apply. Performance of the Muon Identification at LHCb View the table of contents for this issue, or go to the journal homepage for more 2013 JINST 8 P10020 (http://iopscience.iop.org/1748-0221/8/10/P10020) Home Search Collections Journals About Contact us My IOPscience
Transcript of Performance of the Muon Identification at LHCb - CERN · rUniversita di Ferrara, Ferrara, Italy`...

This content has been downloaded from IOPscience. Please scroll down to see the full text.
Download details:
IP Address: 137.138.125.164
This content was downloaded on 31/10/2013 at 10:19
Please note that terms and conditions apply.
Performance of the Muon Identification at LHCb
View the table of contents for this issue, or go to the journal homepage for more
2013 JINST 8 P10020
(http://iopscience.iop.org/1748-0221/8/10/P10020)
Home Search Collections Journals About Contact us My IOPscience

2013 JINST 8 P10020
PUBLISHED BY IOP PUBLISHING FOR SISSA MEDIALAB
RECEIVED: May 23, 2013ACCEPTED: September 23, 2013
PUBLISHED: October 17, 2013
Performance of the Muon Identification at LHCb
F. Archilli,a W. Baldini,b G. Bencivenni,a N. Bondar,c W. Bonivento,d S. Cadeddu,d
P. Campana,a A. Cardini,d P. Ciambrone,a X. Cid Vidal,e C. Deplano,d P. De Simone,a
A. Falabella, f ,r M. Frosini,g,15 S. Furcas,a,1 E. Furfaro,h M. Gandelman,i
J.A. Hernando Morata, j G. Graziani,g A. Lai,d G. Lanfranchi,a J.H. Lopes,i O. Maev,c
G. Manca,d G. Martellotti,h A. Massafferri,k D. Milanes,l,2 R. Oldeman,d,m
M. Palutan,a G. Passaleva,g D. Pinci,h E. Polycarpo,i,3 R. Santacesaria,h
E. Santovetti,n,p A. Sarti,a,q A. Satta,n B. Schmidt,e B. Sciascia,a F. Soomro,a
A. Sciubbah,q and S. Vecchib
aINFN - Laboratori Nazionali di Frascati, Frascati, ItalybSezione INFN di Ferrara, Ferrara, ItalycPetersburg Nuclear Physics Institute, Gatchina, St-Petersburg, RussiadSezione INFN di Cagliari, Cagliari, ItalyeEuropean Organisation for Nuclear Research (CERN), Geneva, Switzerlandf Sezione INFN di Bologna, Bologna, ItalygSezione INFN di Firenze, Firenze, ItalyhSezione INFN di Roma, Roma, ItalyiUniversidade Federal do Rio de Janeiro (UFRJ), Rio de Janeiro, BrasiljUniversidade de Santiago de Compostela, Santiago de Compostela, SpainkCentro Brasileiro de Pesquisas Fısicas (CBPF), Rio de Janeiro, BrasillSezione INFN di Bari, Bari, Italy
mUniversita di Cagliari, Cagliari, ItalynSezione INFN di Roma Tor Vergata, Roma, ItalyoUniversita di Firenze, Firenze, ItalypUniversita di Roma Tor Vergata, Roma, ItalyqSapienza, Universita di Roma, Roma, ItalyrUniversita di Ferrara, Ferrara, Italy
E-mail: [email protected]
1Now at Sezione INFN di Milano, Milano, Italy.2Now at LPNHE, Universite Pierre et Marie Curie, Universite Paris Diderot, CNRS/IN2P3, Paris, France.3Corresponding author.
c© CERN 2013, published under the terms of the Creative Commons Attribution 3.0License by IOP Publishing Ltd and Sissa Medialab srl. Any further distribution of this
work must maintain attribution to the author(s) and the published article’s title, journal citation and DOI.doi:10.1088/1748-0221/8/10/P10020

2013 JINST 8 P10020
ABSTRACT: The performance of the muon identification in LHCb is extracted from data usingmuons and hadrons produced in J/ψ → µ+µ− , Λ0 → pπ− and D?+ → π+D0(K−π+) decays.The muon identification procedure is based on the pattern of hits in the muon chambers. A mo-mentum dependent binary requirement is used to reduce the probability of hadrons to be misiden-tified as muons to the level of 1%, keeping the muon efficiency in the range of 95-98%. Asfurther refinement, a likelihood is built for the muon and non-muon hypotheses. Adding a re-quirement on this likelihood that provides a total muon efficiency at the level of 93%, the hadronmisidentification probabilities are below 0.6%.
KEYWORDS: Particle identification methods; Performance of High Energy Physics Detectors
ARXIV EPRINT: 1306.0249
2013 JINST 8 P10020
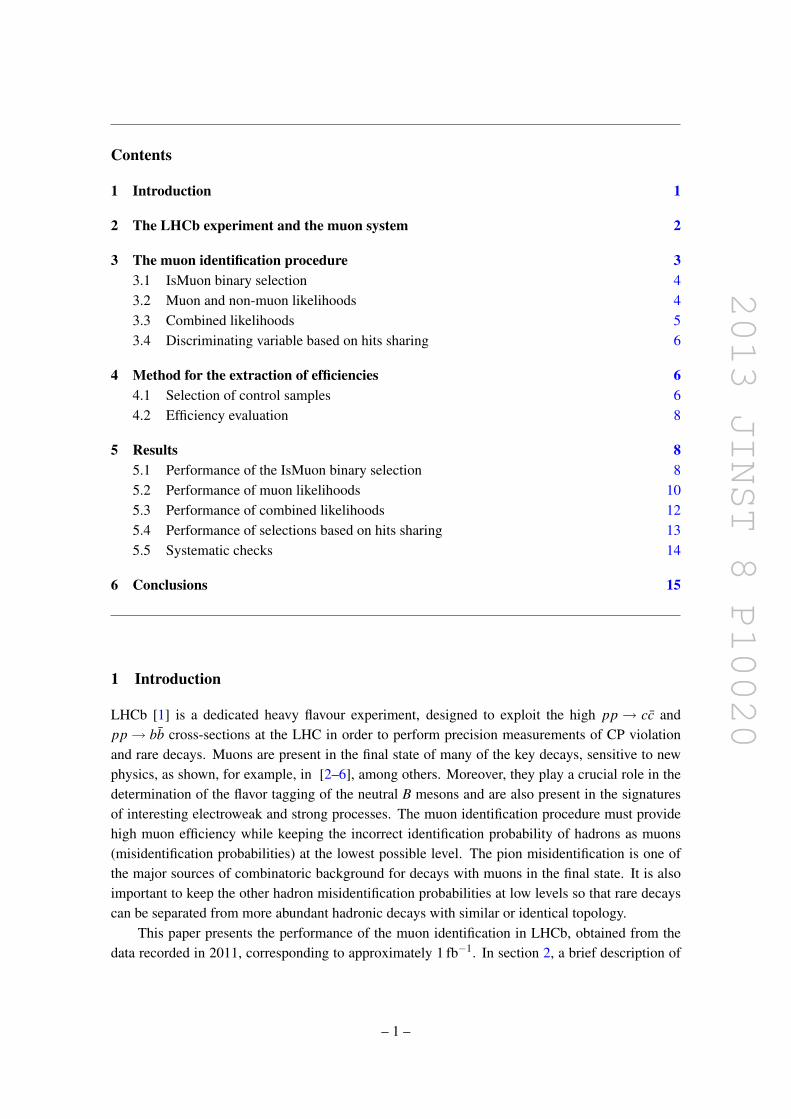
Contents
1 Introduction 1
2 The LHCb experiment and the muon system 2
3 The muon identification procedure 33.1 IsMuon binary selection 43.2 Muon and non-muon likelihoods 43.3 Combined likelihoods 53.4 Discriminating variable based on hits sharing 6
4 Method for the extraction of efficiencies 64.1 Selection of control samples 64.2 Efficiency evaluation 8
5 Results 85.1 Performance of the IsMuon binary selection 85.2 Performance of muon likelihoods 105.3 Performance of combined likelihoods 125.4 Performance of selections based on hits sharing 135.5 Systematic checks 14
6 Conclusions 15
1 Introduction
LHCb [1] is a dedicated heavy flavour experiment, designed to exploit the high pp → cc andpp→ bb cross-sections at the LHC in order to perform precision measurements of CP violationand rare decays. Muons are present in the final state of many of the key decays, sensitive to newphysics, as shown, for example, in [2–6], among others. Moreover, they play a crucial role in thedetermination of the flavor tagging of the neutral B mesons and are also present in the signaturesof interesting electroweak and strong processes. The muon identification procedure must providehigh muon efficiency while keeping the incorrect identification probability of hadrons as muons(misidentification probabilities) at the lowest possible level. The pion misidentification is one ofthe major sources of combinatoric background for decays with muons in the final state. It is alsoimportant to keep the other hadron misidentification probabilities at low levels so that rare decayscan be separated from more abundant hadronic decays with similar or identical topology.
This paper presents the performance of the muon identification in LHCb, obtained from thedata recorded in 2011, corresponding to approximately 1 fb−1. In section 2, a brief description of
– 1 –

2013 JINST 8 P10020
the LHCb spectrometer and the muon detection system is given. The muon identification algorithmis discussed in section 3. The method used to extract the muon efficiency and the misidentificationprobability from data is explained in section 4. Finally, the performance results are presented insection 5, followed by the conclusions in section 6.
2 The LHCb experiment and the muon system
The LHCb detector [1] is a single-arm forward spectrometer. A vertex locator (VELO) determineswith high precision the positions of the vertices of pp collisions (PVs) and the decay vertices oflong-lived particles. The tracking system includes a silicon strip detector located in front of a dipolemagnet with an integrated field of about 4 Tm, and a combination of silicon strip detectors and strawdrift chambers placed behind the magnet. The momentum of charged particles is determined witha resolution of σp/p∼0.4(0.6)% at a momentum scale of 3(100)GeV/c.
Charged hadron identification is achieved with two ring-imaging Cherenkov (RICH) detectors.The calorimeter system consists of a scintillator pad detector, a preshower, an electromagneticcalorimeter and a hadronic calorimeter. It identifies high transverse energy1 hadron, electron andphoton candidates and provides information for the trigger.
The muon system [7] is composed of five stations (M1-M5) of rectangular shape, placed alongthe beam axis, as shown in figure 1. Station M1 is located in front of the calorimeters and is usedto improve the transverse momentum measurement in the first level hardware trigger. StationsM2 to M5 are placed downstream the calorimeters and are interleaved with iron absorbers 80 cmthick to select penetrating muons. The total absorber thickness in front of station M2, includingthe calorimeters, is approximately 6.6 interaction lengths. More than 99% of the total area of thesystem is equipped with multi-wire proportional chambers (MWPC) with Ar/CO2/CF4(40:55:5)as gas mixture. Only the inner part of the first station is instrumented with triple-GEM detectorsfilled with Ar/CO2/CF4(45:15:40).
The chambers are positioned to provide with their sensitive area a hermetic geometric accep-tance to high momentum particles coming from the interaction point. In addition, the chambersof different stations form projective towers pointing to the interaction point. The detectors pro-vide digital space point measurements on the particle trajectories, supplying information to thetrigger processor and to the data acquisition (DAQ). The information is obtained by partitioningthe detector into rectangular logical pads whose dimensions define the x, y resolution in the planeperpendicular to the beam axis. Each station is divided into four regions, R1 to R4 with increasingdistance from the beam axis, as shown in figure 2. The linear dimensions of the regions R1, R2,R3, R4, and their segmentation scale in the ratio 1:2:4:8.
Each muon station is designed to perform with an efficiency above 99% in a 20ns time win-dow with a noise rate below 1kHz per physical channel, which was achieved during operation, asdescribed in [7].
The muon system provides information for the selection of high transverse momentum muonsat the trigger level and for the offline muon identification. This document refers to the latter proce-
1The transverse energy of a 2×2 cells cluster is defined as ET = ∑4i=1 Ei sinθi, where Ei is the energy deposited in
cell i and θi is the angle between the z-axis and a neutral particle assumed to be coming from the mean position of theinteraction envelope hitting the centre of the cell [11].
– 2 –

2013 JINST 8 P10020
250mrad
100mrad
M1
M3M2
M4 M5
RICH2HCAL
ECALSPD/PS
Magnet
T1T2T3
z5m
y
5m
< 5m
10m 15m 20m
TTVertexLocator
RICH1
Figure 1. Schematic view of the LHCb experiment. The muon stations are seen as the five green verticalbars, the second one placed just after the calorimeters, shown as the blue rectangles.
Figure 2. Schematic view of one muon system station (reproduced from [7]).
dure, which uses only the information from the 4 stations located after the calorimeters. The muonidentification in the trigger system is described in [8].
3 The muon identification procedure
The muon identification strategy can be divided in three steps:
• A loose binary selection of muon candidates based on the penetration of the muons throughthe calorimeters and iron filters, which provides high efficiency while reducing the misiden-tification probability of hadrons to the percent level (called IsMuon);
• Computation of a likelihood for the muon and non-muon hypotheses, based on the patternof hits around the extrapolation to the different muon stations of the charged particles trajec-tories reconstructed with high precision in the tracking system. The logarithm of the ratio
– 3 –
2013 JINST 8 P10020
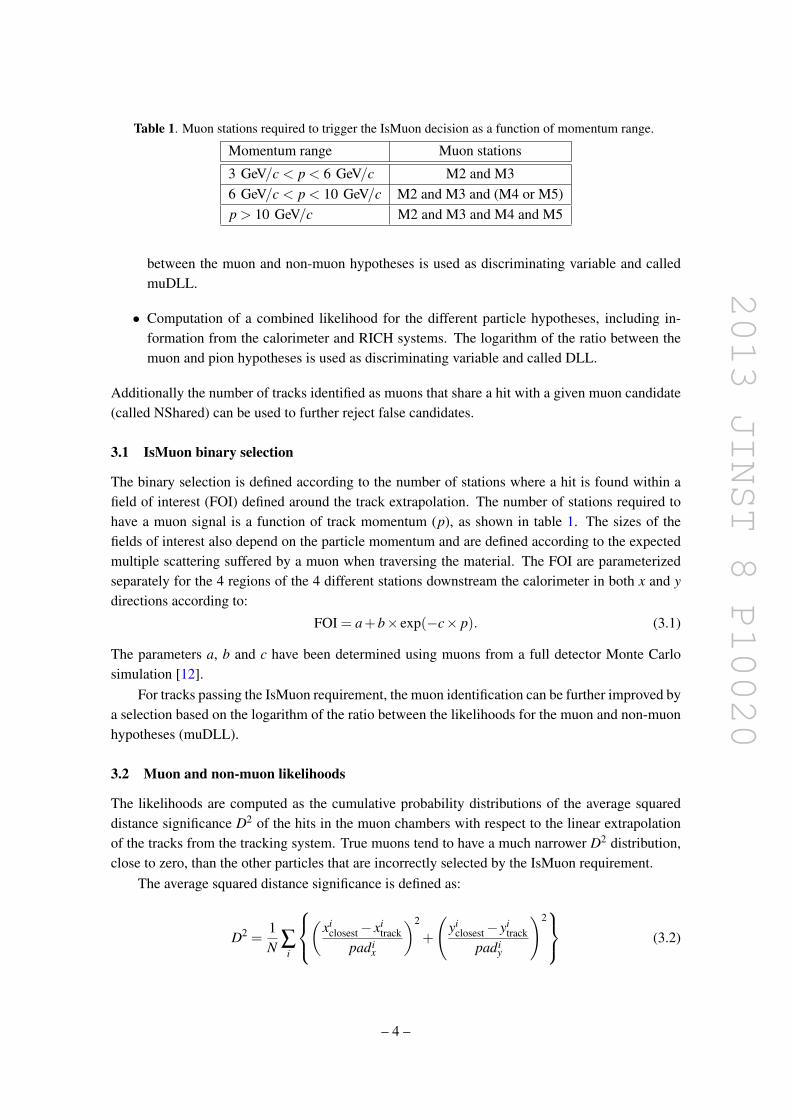
Table 1. Muon stations required to trigger the IsMuon decision as a function of momentum range.
Momentum range Muon stations
3 GeV/c < p < 6 GeV/c M2 and M36 GeV/c < p < 10 GeV/c M2 and M3 and (M4 or M5)p > 10 GeV/c M2 and M3 and M4 and M5
between the muon and non-muon hypotheses is used as discriminating variable and calledmuDLL.
• Computation of a combined likelihood for the different particle hypotheses, including in-formation from the calorimeter and RICH systems. The logarithm of the ratio between themuon and pion hypotheses is used as discriminating variable and called DLL.
Additionally the number of tracks identified as muons that share a hit with a given muon candidate(called NShared) can be used to further reject false candidates.
3.1 IsMuon binary selection
The binary selection is defined according to the number of stations where a hit is found within afield of interest (FOI) defined around the track extrapolation. The number of stations required tohave a muon signal is a function of track momentum (p), as shown in table 1. The sizes of thefields of interest also depend on the particle momentum and are defined according to the expectedmultiple scattering suffered by a muon when traversing the material. The FOI are parameterizedseparately for the 4 regions of the 4 different stations downstream the calorimeter in both x and ydirections according to:
FOI = a+b× exp(−c× p). (3.1)
The parameters a, b and c have been determined using muons from a full detector Monte Carlosimulation [12].
For tracks passing the IsMuon requirement, the muon identification can be further improved bya selection based on the logarithm of the ratio between the likelihoods for the muon and non-muonhypotheses (muDLL).
3.2 Muon and non-muon likelihoods
The likelihoods are computed as the cumulative probability distributions of the average squareddistance significance D2 of the hits in the muon chambers with respect to the linear extrapolationof the tracks from the tracking system. True muons tend to have a much narrower D2 distribution,close to zero, than the other particles that are incorrectly selected by the IsMuon requirement.
The average squared distance significance is defined as:
D2 =1N ∑
i
(
xiclosest− xi
trackpadi
x
)2
+
(yi
closest− yitrack
padiy
)2 (3.2)
– 4 –
2013 JINST 8 P10020
where the index i runs over the stations containing hits within the FOI, (xiclosest,i,y
iclosest) are the
coordinates of the closest hit to the track extrapolation point for each station (xitrack,y
itrack) and
padix,y correspond to one half of the pad sizes in the x,y directions. The total number of stations
containing hits within their FOI is denoted by N.The D2 distribution for muons depends on the multiple scattering and, therefore, on the mo-
mentum (p) and polar angle (θ ) distributions of the analyzed sample. In order to avoid a depen-dence of the muon likelihood on the calibration sample (with particular p and θ ), the tuning ofthe muon likelihood is performed separately in momentum bins and muon detector regions (whichcorrespond to 4 intervals in θ ).
The likelihood for the non-muon hypothesis is calibrated with the D2 distribution for protons,since the other charged hadrons (pions or kaons) selected by IsMuon will present a D2 distributionwith a component identical to the protons and a component very similar to the true muons, due todecays in flight before the calorimeter. For protons, the hits in the muon system found around thetrack extrapolation are essentially due to three sources: hits from punch-though [9] protons, hitsfrom true muons pointing to the same direction of the proton or random hits. The last two are atfirst order uncorrelated to the proton momentum while the first one can present some momentumdependence, less important however than the dependence expected for muons.
Hence, the tuning of the non-muon likelihood is merely performed separately for the 4 muonsystem regions, due to their different granularity.
The likelihood for the muon (or non-muon) hypothesis is then defined, for each candidate,as the integral of the calibrated muon (or proton) D2 probability density function from 0 to themeasured value, D2
0.The results presented in this document are obtained with a muon likelihood calibrated with
muons from J/ψ → µ+µ− decays selected from the data taken in 2010, as described in section 4.The non-muon likelihood has been calibrated with a simulated sample of decays Λ0→ pπ− .
The D2 distributions for muons, protons, pions and kaons obtained from data are shown infigure 3(a). The distributions of the logarithm of the ratio between the muon and non-muon hy-potheses (muDLL) are shown in figure 3(b). More details about the selection of the particles usedto make these plots and to extract the performance are given in section 4.
3.3 Combined likelihoods
The muon and non-muon likelihoods presented in section 3.2 can be combined with the likeli-hoods provided by the RICH systems and the calorimeters to improve the muon identificationperformance.
The Cherenkov angles measured in the two RICH detectors are combined with the track mo-mentum using an overall event log-likelihood algorithm. For each track in the event, a likelihoodis assigned to each of the different mass hypotheses (electron, muon, pion, kaon and proton). TheRICH likelihood can differentiate between muon and other particles in particular at low momen-tum, below 5 GeV/c [10].
The energy deposition in the calorimeters also allows the evaluation of likelihoods for themuon (minimum ionizing particle), electron and hadron hypotheses.
A combined log-likelihood is then obtained for each track and for each of the different masshypotheses by summing the logarithms of the likelihoods obtained using the muon system, the
– 5 –

2013 JINST 8 P10020
)2Square Distance Significance(D0 50 100 150 200
Ent
ries
/2
-510
-410
-310
-210
-110
1ProtonsPionsKaonsMuons
LHCb
(a)
muDLL-2 0 2 4 6 8
Ent
ries
/0.2
0
0.02
0.04
0.06
0.08
0.1
0.12
0.14
0.16 ProtonsPionsKaonsMuons
LHCb
(b)
Figure 3. Average square distance significance distributions for muons, protons, pions and kaons (a) and thecorresponding muDLL distributions (b).
RICH and the calorimeters. In this computation, the non-muon likelihood obtained in the muonsystem is assigned to the electron, pion, kaon and proton hypotheses. The difference of the com-bined log-likelihoods for the muon and pion hypotheses (DLL) is then used to identify the muons.
3.4 Discriminating variable based on hits sharing
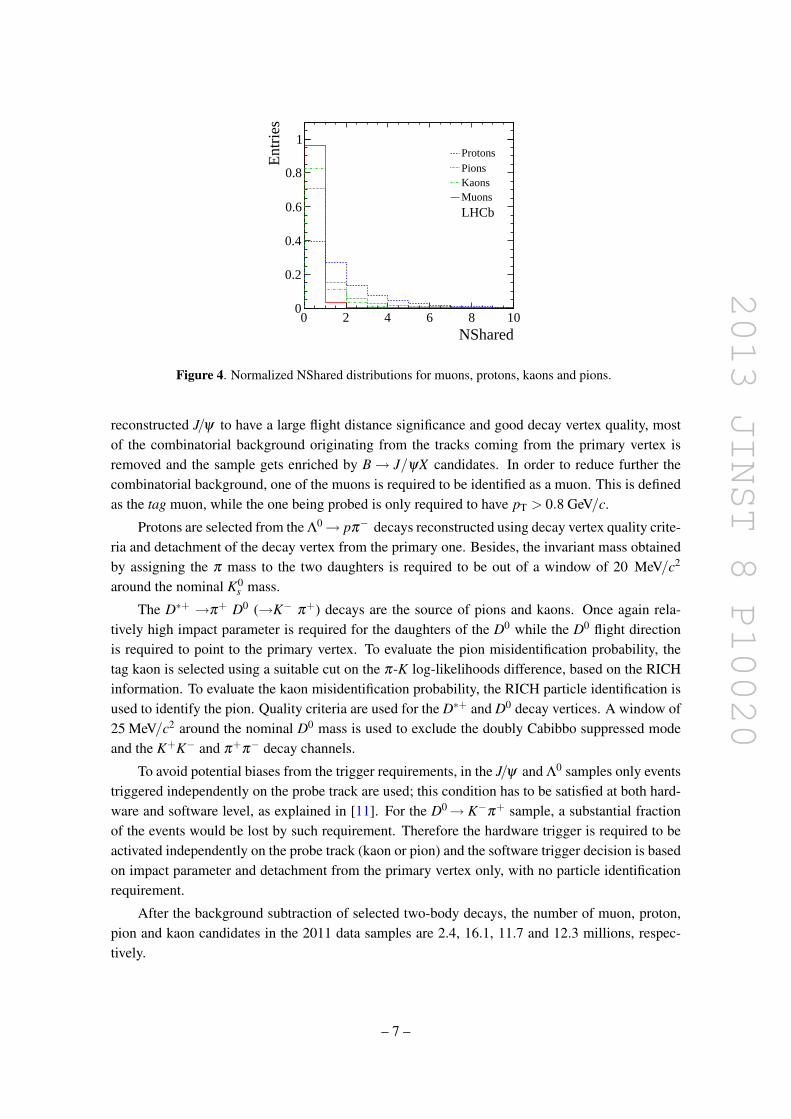
Different tracks can be associated to the same muon hits when the matching of tracks to muonchamber hits is performed. Reducing the number of tracks that share hits can help to improve themisidentification probability. To use this information, a discriminant variable named NShared isbuilt for tracks satisfying the IsMuon criteria and a score of 1 is added to a given track if it sharesany hits with another one. The score is given to the track to which the hit is more distant. Withthis definition, a track having NShared=3, for example, shares at least one hit with 3 other tracksin the event, all of them with D2 values smaller than the track own D2. Selecting muons withNShared=0 is the usual way to reduce the probability of incorrectly identifying hadrons as muonsdue to nearby true muons in high multiplicity events, but looser requirements can also be appliedas shown in figure 4.
4 Method for the extraction of efficiencies
In order to extract the performance of the muon identification from data, muon, proton, pion, andkaon candidates are selected with high purity from two body decays using kinematical requirementsonly. When necessary, the purity is improved by using a tag and probe technique where particleidentification requirements are applied to one of the tracks (tag) while the other (probe) is used forthe computation of the muon efficiency or of the hadron misidentification probability.
4.1 Selection of control samples
An abundant source of muons is provided in the experiment by the J/ψ → µ+µ− decay. Byrequiring the muons to have a high impact parameter with respect to the primary vertex and the
– 6 –
2013 JINST 8 P10020
NShared0 2 4 6 8 10
Ent
ries
0
0.2
0.4
0.6
0.8
1ProtonsPionsKaonsMuons
LHCb
Figure 4. Normalized NShared distributions for muons, protons, kaons and pions.
reconstructed J/ψ to have a large flight distance significance and good decay vertex quality, mostof the combinatorial background originating from the tracks coming from the primary vertex isremoved and the sample gets enriched by B→ J/ψX candidates. In order to reduce further thecombinatorial background, one of the muons is required to be identified as a muon. This is definedas the tag muon, while the one being probed is only required to have pT > 0.8 GeV/c.
Protons are selected from the Λ0→ pπ− decays reconstructed using decay vertex quality crite-ria and detachment of the decay vertex from the primary one. Besides, the invariant mass obtainedby assigning the π mass to the two daughters is required to be out of a window of 20 MeV/c2
around the nominal K0s mass.
The D∗+ →π+ D0 (→K− π+) decays are the source of pions and kaons. Once again rela-tively high impact parameter is required for the daughters of the D0 while the D0 flight directionis required to point to the primary vertex. To evaluate the pion misidentification probability, thetag kaon is selected using a suitable cut on the π-K log-likelihoods difference, based on the RICHinformation. To evaluate the kaon misidentification probability, the RICH particle identification isused to identify the pion. Quality criteria are used for the D∗+ and D0 decay vertices. A window of25 MeV/c2 around the nominal D0 mass is used to exclude the doubly Cabibbo suppressed modeand the K+K− and π+π− decay channels.
To avoid potential biases from the trigger requirements, in the J/ψ and Λ0 samples only eventstriggered independently on the probe track are used; this condition has to be satisfied at both hard-ware and software level, as explained in [11]. For the D0→ K−π+ sample, a substantial fractionof the events would be lost by such requirement. Therefore the hardware trigger is required to beactivated independently on the probe track (kaon or pion) and the software trigger decision is basedon impact parameter and detachment from the primary vertex only, with no particle identificationrequirement.
After the background subtraction of selected two-body decays, the number of muon, proton,pion and kaon candidates in the 2011 data samples are 2.4, 16.1, 11.7 and 12.3 millions, respec-tively.
– 7 –

2013 JINST 8 P10020
4.2 Efficiency evaluation
As a baseline method to evaluate the efficiency εmuonID of a generic muon identification requirementdenoted in this section by muonID (e.g. IsMuon true or DLL greater than a given cut), is used:
εmuonID =Strue
Strue +Sfalse, (4.1)
where Strue and Sfalse are the numbers of signal events satisfying and not satisfying muonID, ex-tracted from data using
Strue,false = Ntrue,false−Btrue,false. (4.2)
Ntrue,false are obtained by counting the number of J/ψ candidates with invariant mass lyingwithin a signal mass window around the J/ψ mass; the number of background events within thesame mass window, Btrue,false, is computed by extrapolating to the signal window the mass fit donein the J/ψ sidebands.
For the proton misidentification probability, the same method is used. The kaon and pionmisidentification probabilities are also obtained with eq. (4.1), but Strue,false and Btrue,false are ex-tracted directly from a full fit of the signal and background shapes to the invariant mass distributionof the D0 candidates.
5 Results
The muon identification performance is presented in terms of the muon efficiency and hadronmisidentification probabilities for the different requirements. In all cases, the performance is eval-uated for tracks extrapolated within the geometrical acceptance of the muon detector.
5.1 Performance of the IsMuon binary selection
The efficiency of the IsMuon requirement, εIM , is the efficiency of finding hits within the fieldsof interest in the muon chambers for tracks extrapolated to the muon system. In figure 5, εIM isshown as a function of the muon momentum, for different transverse momentum ranges. A weakdependency with transverse momentum is observed and in particular a drop of ∼2% is measuredfor the lowest pT interval. This efficiency drop is essentially due to tracks close to the inner edgesof region R1 which in principle have their extrapolation points within M1 and M5 acceptance, butare in fact scattered outside the detector. For particles with pT above 1.7 GeV/c, the efficiency isabove 97% in the whole momentum range, from 3 GeV/c to 100 GeV/c. The average efficiencyobtained for the µprobe in the J/ψ calibration sample is εIM =(98.13± 0.04)%, for particles withp > 3 GeV and pT > 0.8 GeV/c. This efficiency is in agreement with the expected values fromMonte Carlo simulation within 1%, validating the extraction of the FOI parameterization describedin eq. (3.1).
The misidentification probabilities ℘IM(p → µ) , ℘IM(π → µ) and ℘IM(K → µ) are alsoshown in figure 5. The observed decrease of ℘IM with increasing transverse momentum isexpected, since tracks with higher transverse momentum traverse the detector at higher po-lar angles, in the lower occupancy regions. The proton misidentification probability is smallerthan 0.5% for all pT ranges and momentum above 30GeV/c. It drops quickly with mo-mentum for the lowest pT ranges, reaching a plateau at about 30-40 GeV/c. The pion and
– 8 –

2013 JINST 8 P10020
Momentum [GeV/c]0 20 40 60 80 100
IMε
0.8
0.85
0.9
0.95
1
1.05
<1.7 [GeV/c]T
0.8<p
<3.0 [GeV/c]T
1.7<p
<5.0 [GeV/c]T
3.0<p
>5.0 [GeV/c]T
p
<1.7 [GeV/c]T
0.8<p<3.0 [GeV/c]
T1.7<p
<5.0 [GeV/c]T
3.0<p>5.0 [GeV/c]
Tp
LHCb
(a)
Momentum [GeV/c]0 20 40 60 80 100
)µ→
(pIM
℘
0
0.005
0.01
0.015
0.02
0.025
0.03
0.035
<0.8 [GeV/c]T
p<1.7 [GeV/c]
T0.8<p
<3.0 [GeV/c]T
1.7<p<5.0 [GeV/c]
T3.0<p
LHCb
(b)
Momentum [GeV/c]0 20 40 60 80 100
)µ→π(
IM℘
0
0.01
0.02
0.03
0.04
0.05
0.06
0.07
LHCb
(c)
Momentum [GeV/c]0 20 40 60 80 100
)µ→
(KIM
℘
0
0.01
0.02
0.03
0.04
0.05
0.06
0.07
LHCb
(d)
Figure 5. IsMuon efficiency and misidentification probabilities, as a function of momentum, in ranges oftransverse momentum: εIM (a), ℘IM(p→ µ) (b), ℘IM(π → µ) (c) and ℘IM(K→ µ) (d).
kaon misidentification probabilities have a similar behavior, increasing with decreasing pT .Above 40 GeV/c, the pion misidentification probability is almost at the level of the protonmisidentification probability. At low momentum, decays in flight are the dominant source of in-correct identification, as can be seen from the difference between the pion/kaon and proton curves.While the proton misidentification probability, within the pT intervals chosen, lies within 0.1-1.3%,the pion and kaon misidentification probabilities are within 0.2-5.6% and 0.6-4.5%, respectively.For momentum above 30 GeV/c, ℘IM(π → µ) and ℘IM(K→ µ) have a small dependence on pT.At the lowest pT range, the kaon misidentification probability is lower than the pion for the lowestmomentum interval, in spite of the larger decay width of kaons to muons. Since the muon is pro-duced with a larger opening angle with respect to the original track trajectory in kaon decays than inpion decays, and on average low momentum particles tend to decay further upstream in the detector,then the hits in the muon chambers have a higher probability to lie outside the fields of interest.
When integrated over p > 3 GeV/c and the whole pT spectra of our calibration samples,the average values for the misidentification probabilities are ℘IM(p → µ) =(1.033 ± 0.003)%,
– 9 –

2013 JINST 8 P10020
Table 2. Average IsMuon efficiency and misidentification probabilities in different transverse momentumintervals (%). Uncertainties are statistical.
pT interval (GeV/c) muon proton pion kaonpT < 0.8 1.393± 0.005 6.2± 0.1 4.3±0.1
0.8 < pT < 1.7 96.94± 0.07 0.737± 0.003 2.19± 0.01 1.93±0.11.7 < pT < 3.0 98.53± 0.05 0.149± 0.004 0.61± 0.01 0.93±0.013.0 < pT < 5.0 98.51± 0.06 0.12± 0.02 0.40± 0.01 0.72±0.01
5.0 < pT 98.51± 0.07 0.33± 0.02 0.69±0.01
℘IM(π → µ) =(1.025±0.003)% and ℘IM(K→ µ) =(1.111±0.003)%. For pions and kaons, about60% of the misidentification probability is due to decays in flight, for these particular samples. Theaverage efficiency and misidentification probabilities, integrated over momentum (p > 3 GeV/c),are also given in table 2, for 5 different pT intervals. There are not enough candidates in the muon,pion and kaon samples for a measurement dependent on momentum in the lowest pT bin. Similarlyfor the protons, in the highest pT interval.
The LHCb detector has been designed to operate at the luminosity of L = 2×1032 cm−2s−1
and with a probability of having one interaction per beam crossing maximal with respect to highernumbers. However, in the 2011 run the experiment operated with an average number of interactionsper beam crossing about 2.5 times the nominal average, with a corresponding increase of the overalldetector occupancies. The behavior of εIM and ℘IM was then evaluated as a function of the numberof tracks which contain hits in the tracking subsystems, from the VELO to the tracking stations.No significant decrease of εIM is observed, while an increase of the misidentification probabilities isseen with higher track multiplicities, as expected. The detailed behaviour of both the efficiency andthe misidentification probabilities as a function of momentum is shown in figure 6. The probability℘IM(p→ µ) increases by a factor 2.7 for particles with momentum in the range 3 to 5 GeV/c,when comparing events with track multiplicity smaller than 40 and events with track multiplicitybetween 150 and 250, which is the highest interval of multiplicity analysed. At high momentum,the difference is much less pronounced. For pions and kaons, the increase at low momentum is afactor of two, approximately, and drops quickly to a plateau value starting at 20 GeV/c. Since theFOI are smaller at high momentum, the misidentification probability becomes less sensitive to themultiplicity of the underlying event.
The charge dependence of the efficiency εIM is also analysed. No difference between theefficiencies is seen up to the level of the statistical fluctuations. When integrating over the wholemomentum range, the relative difference is 0.09±0.08%, compatible with zero within the statisticaluncertainty.
5.2 Performance of muon likelihoods
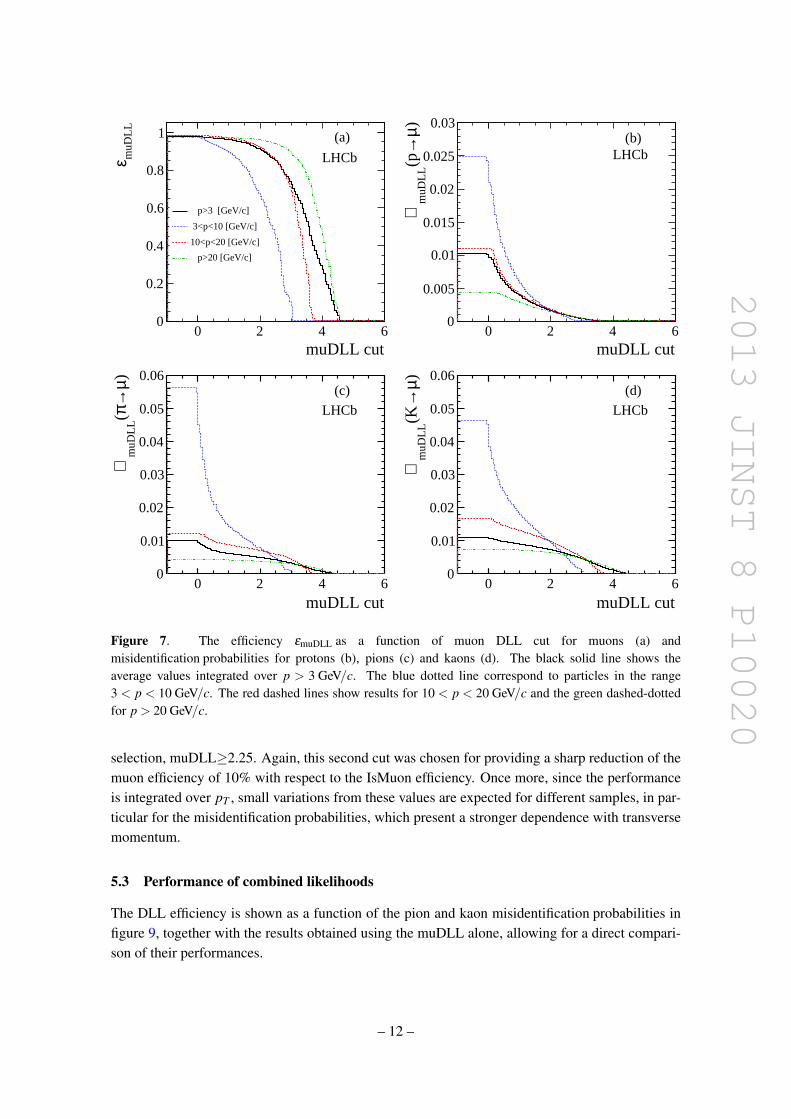
The muon identification efficiency (εmuDLL ) is measured as a function of a selection cutin the variable muDLL, for different momentum ranges, as shown in figure 7(a). Themisidentification probabilities are also shown in figure 7(b) to figure 7(d), for the same momentumranges. The black solid line shows the average fractions, when integrated over p > 3 GeV/c (andpT > 0.8 GeV/c for the muons). All curves start at the efficiency or misidentification probability
– 10 –

2013 JINST 8 P10020
Momentum [GeV/c]0 20 40 60 80 100
IMε
0.8
0.85
0.9
0.95
1
1.05
ntracks<4040<ntracks<6060<ntracks<150150<ntracks<250
LHCb
(a)
Momentum [GeV/c]0 20 40 60 80 100
)µ→
(pIM
℘
0
0.005
0.01
0.015
0.02
0.025
0.03
0.035
0.04
0.045
LHCb
(b)
Momentum [GeV/c]0 20 40 60 80 100
)µ→π(
IM℘
0
0.02
0.04
0.06
0.08
0.1
0.12
0.14
LHCb
(c)
Momentum [GeV/c]0 20 40 60 80 100
)µ→
(KIM
℘
0
0.02
0.04
0.06
0.08
0.1
0.12
0.14
LHCb
(d)
Figure 6. IsMuon efficiency εIM (a) and ℘IM for protons (b), pions (c) and kaons (d) as a function ofmomentum for different ranges of the number of trajectories reconstructed in the event (ntracks).
corresponding to the IsMuon requirement. For tracks with p > 10 GeV/c, the muon efficiency isindependent of momentum up to muDLL∼2. To achieve a misidentification probability indepen-dent from the momentum, the value of the muDLL cut must depend on particle momentum. Byapplying a muDLL cut irrespective of the momentum, the misidentification probabilities show astrong momentum dependence.
As an example, when requiring muDLL≥1.74, a cut that provides a final muon efficiency of93.2%, the final misidentification probabilities are 0.21%, 0.78% and 0.52% for protons, kaons andpions respectively. This cut, which provides a sharp decrease of 5% of the efficiency with respectto the IsMuon efficiency, is used here as an example only for a clear comparison between the muonDLL and the DLL. Since the average efficiency and misidentification probabilities values are givenfor our calibration samples, which have their particular momentum and pT spectrum, they can bedifferent for samples with different kinematic distributions.
The momentum dependence of εmuDLL and of ℘muDLL for particles satisfying this particularcut, muDLL≥1.74, are shown in figure 8, compared to the IsMuon requirement alone and a tighter
– 11 –
2013 JINST 8 P10020
muDLL cut0 2 4 6
muD
LL
ε
0
0.2
0.4
0.6
0.8
1
p>3 [GeV/c]
3<p<10 [GeV/c]
10<p<20 [GeV/c]
p>20 [GeV/c]
LHCb
(a)
muDLL cut0 2 4 6
)µ→
(pm
uDL
L℘
0
0.005
0.01
0.015
0.02
0.025
0.03
LHCb(b)
muDLL cut0 2 4 6
)µ→π(
muD
LL
℘
0
0.01
0.02
0.03
0.04
0.05
0.06
LHCb
(c)
muDLL cut0 2 4 6
)µ→
(Km
uDL
L℘
0
0.01
0.02
0.03
0.04
0.05
0.06
LHCb
(d)
Figure 7. The efficiency εmuDLL as a function of muon DLL cut for muons (a) andmisidentification probabilities for protons (b), pions (c) and kaons (d). The black solid line shows theaverage values integrated over p > 3 GeV/c. The blue dotted line correspond to particles in the range3 < p < 10 GeV/c. The red dashed lines show results for 10 < p < 20 GeV/c and the green dashed-dottedfor p > 20 GeV/c.
selection, muDLL≥2.25. Again, this second cut was chosen for providing a sharp reduction of themuon efficiency of 10% with respect to the IsMuon efficiency. Once more, since the performanceis integrated over pT , small variations from these values are expected for different samples, in par-ticular for the misidentification probabilities, which present a stronger dependence with transversemomentum.
5.3 Performance of combined likelihoods
The DLL efficiency is shown as a function of the pion and kaon misidentification probabilities infigure 9, together with the results obtained using the muDLL alone, allowing for a direct compari-son of their performances.
– 12 –

2013 JINST 8 P10020
Momentum [GeV/c]0 20 40 60 80 100
IMε
0.75
0.8
0.85
0.9
0.95
1
1.05
IsMuon
muDLL>1.74
muDLL>2.25
LHCb(a)
Momentum [GeV/c]0 20 40 60 80 100
)µ→
(pIM
℘
0
0.005
0.01
0.015
0.02
0.025
0.03LHCb
(b)
Momentum [GeV/c]0 20 40 60 80 100
)µ→π(
IM℘
-310
-210
-110 LHCb(c)
Momentum [GeV/c]0 20 40 60 80 100
)µ→
(KIM
℘
-310
-210
-110 LHCb(d)
Figure 8. Muon efficiency (a) and misidentification probabilities for protons (b), pions (c) and kaons (d)as a function of the particle momentum for the IsMuon requirement alone (black solid circles) and with theadditional cuts muDLL≥1.74 (red triangles) and muDLL≥2.25 (blue open circles).
The DLL benefits from RICH and calorimeter information, being more effective than the muonDLL alone in separating pions and kaons from muons. After IsMuon, this is the most used particleidentification requirement used to select muons in LHCb and the actual cut value is usually chosenaccording to the compromise between purity and efficiency needed for that specific study. Theaverage misidentification rates corresponding to a cut which provides an average decrease of 5%(equivalent to the one obtained with muDLL≥1.74, as previously shown) are around 0.65% and0.38% for the kaons and pions, respectively.
5.4 Performance of selections based on hits sharing
As mentioned in section 3, after requiring IsMuon, an additional way of reducing the incorrectidentification probability of hadrons as muons, in particular at high occupancy, is the use of a cuton NShared.
– 13 –

2013 JINST 8 P10020
)µ→π(DLL
℘0.005 0.01
DL
Lε
0
0.2
0.4
0.6
0.8
1
DLLmuDLL
LHCb(a)
)µ→(KDLL
℘0.005 0.01
DL
Lε
0
0.2
0.4
0.6
0.8
1
LHCb(b)
Figure 9. Average efficiency εDLL as a function of the pion (a) and kaon (b) misidentification probabilitiesfor particles with momentum in the range p > 3 GeV/c. The dotted lines show the DLL performance, whilethe muon DLL performance is shown with a solid line.
)µ→π(NShared
℘0 0.02 0.04 0.06
NSh
ared
ε
0.8
0.82
0.84
0.86
0.88
0.9
0.92
0.94
0.96
0.981
LHCb
(a)
p>3 [GeV/c]3<p<10 [GeV/c]10<p<20 [GeV/c]p>20 [GeV/c]
)µ→(pNShared
℘0 0.01 0.02 0.03
NSh
ared
ε
0.8
0.82
0.84
0.86
0.88
0.9
0.92
0.94
0.96
0.981
LHCb
(b)
Figure 10. Muon efficiency εNShared as a function of the pion and proton misidentification probabilities.The average values, for all particles with p > 3 GeV/c, are shown with a black line, compared to the threemomentum ranges separately, as for figure 7.
The muon efficiency is shown as a function of the pion misidentification probability for corre-sponding NShared cut in figure 10(a); protons are shown in figure 10(b). Due to similar decay-in-flight pollution at low momentum, kaons behave as pions. The black solid line shows the averagevalues integrated over p > 3 GeV/c. The NShared selection is particularly effective at low mo-menta, with increasing the FOI size.
5.5 Systematic checks
The effect of the trigger and of the method chosen to evaluate the efficiency and misidentificatinprobabilities are investigated. Alternatively to the requirement of the J/ψ → µ+µ− sample beingtriggered independently of the probe muon, a muon trigger decision based on the tag muon was
– 14 –

2013 JINST 8 P10020
used to evaluate the IsMuon efficiency. The systematic uncertainty due to the choice of triggerstrategy is taken as the difference between the two determinations, which is 0.2%.
When performing a full fit to the signal and background components of the mass distributionsused to extract the yields of signal events satisfying or not the muon identification requirements,the resulting efficiencies and proton misidentification probability rates agree within the statisticaluncertainties with the results shown in section 5.
For the pion and kaon misidentification probabilities, the effect of the trigger is studied andfound to be negligible within the uncertainties, independently of momentum and transverse mo-mentum. Also the systematic uncertainty related to the method used for the evaluation of theefficiency is found to be negligible as a function of momentum, apart from a few intervals where itis comparable with the statistical accuracy.
6 Conclusions
The performance of the muon identification procedure used in the LHCb experiment has beenevaluated, using a dataset corresponding to 1 fb−1 recorded in 2011 at
√s = 7 TeV.
A loose binary criterium that can be used to select muons is based on the matching of muonhits with the particle trajectory. For candidates satisfying this requirement, likelihoods for muonand non-muon hypotheses are built with the pattern of hits around the trajectories, which can beused to refine the selection. An additional way of rejecting fake muon candidates is provided by avariable sensitive to hit sharing by nearby particles.
The muon identification efficiency was observed to be robust against the variation of detectoroccupancies and presents a weak dependence on momentum and transverse momentum. Hadronmisidentification probabilities present a stronger dependence on hit or track multiplicity, howeverthe highest increase factors are observed only for low momentum particles.
Average muon identification efficiencies at the 98% level are attainable for pion and kaonmisidentification below the 1% level at high transverse momentum, using the loosest identificationcriterium. The performance of additional requirements based on likelihoods or on hits sharingcan be tuned according to the needs of each analysis and reduce the misidentification probabilitiesdependence on track multiplicity. Adding a requirement on the difference of the log-likelihoodsthat provides a total muon efficiency at the level of 93%, the hadron misidentification probabilitiesare below 0.6%.
Acknowledgments
We express our gratitude to our colleagues in the CERN accelerator departments for the excellentperformance of the LHC. We thank the technical and administrative staff at CERN and at theLHCb institutes, and acknowledge support from the National Agencies: CAPES, CNPq, FAPERJand FINEP (Brazil); CERN; NSFC (China); CNRS/IN2P3 (France); BMBF, DFG, HGF and MPG(Germany); SFI (Ireland); INFN (Italy); FOM and NWO (The Netherlands); SCSR (Poland);ANCS (Romania); MinES of Russia and Rosatom (Russia); MICINN, XuntaGal and GENCAT(Spain); SNSF and SER (Switzerland); NAS Ukraine (Ukraine); STFC (United Kingdom); NSF(U.S.A.). We also acknowledge the support received from the ERC under FP7 and the RegionAuvergne.
– 15 –

2013 JINST 8 P10020
References
[1] LHCb collaboration, The LHCb Detector at the LHC, 2008 JINST 3 S08005.
[2] LHCb collaboration, First Evidence for the Decay B0s → µ+µ−, Phys. Rev. Lett. 110 (2013) 021801
[arXiv:1211.2674].
[3] LHCb collaboration, Measurement of the isospin asymmetry in B→ K(∗)µ+µ− decays, JHEP 07(2012) 133 [arXiv:1205.3422].
[4] LHCb collaboration, Differential branching fraction and angular analysis of the decayB0→ K∗0µ+µ−, Phys. Rev. Lett. 108 (2012) 181806 [arXiv:1112.3515].
[5] LHCb collaboration, Measurement of the CP-violating phase φs in the decay B0s → J/ψφ , Phys. Rev.
Lett. 108 (2012) 101803 [arXiv:1112.3183].
[6] LHCb collaboration, Measurement of the CP-violating phase φs in B0s → J/ψ f0(980), Phys. Lett. B
707 (2012) 497 [arXiv:1112.3056].
[7] Alves Jr. et al, Performance of the LHCb muon system, 2013 JINST 8 P02022.
[8] R. Aaij and J. Albrecht, Muon triggers in the High Level Trigger of LHCb, LHCb-PUB-2011-017.
[9] C. Grupen, Particle Detectors, Cambridge University Press, Cambridge, England (1996).
[10] M. Adinolfi et al., Performance of the LHCb RICH detector at the LHC, Eur. Phys. J. C (2013) 2431.
[11] R. Aaij et al, The LHCb Trigger and its Performance, 2013 JINST 8 P04022.
[12] LHCb collaboration, The LHCb simulation application, Gauss: Design, evolution and experience, J.Phys. Conf. Ser. 331 (2011) 032023.
– 16 –