Performance of nanocrystalline Ni3N as a negative ... · PDF fileIts electrochemical...
12
1 Performance of nanocrystalline Ni 3 N as a negative electrode for sodium-ion batteries Xianji Li, Mahboba M. Hasan, Andrew L. Hector and John R. Owen Chemistry, University of Southampton, Highfield, Southampton SO17 1BJ, UK [email protected] Abstract Nickel nitride is synthesised by high temperature ammonolysis of nickel(II) hexamine and tris(ethylenediamine) salts. Its electrochemical characteristics are examined in half cells vs lithium and sodium. Samples with high surface area are found to have significant reversible charge storage capacity in sodium cells and hence to be a promising negative electrode material for sodium-ion batteries. Introduction Battery technology has been fundamental to the development of portable electronics over recent years, and the development of green energy technologies and electric vehicles are powerful drivers for further improvement. Lithium-ion batteries provide high energy density and are currently the leading technology to address these energy storage requirements. 1 However, due to the limited reserves and the increasing price of exploitable lithium raw materials 2 , there is a need for alternative competitive battery technologies. Sodium based energy storage devices could provide a high voltage and energy density similar to that achieved with lithium-ion batteries 2 and the abundance and low cost of sodium are a distinct advantage, especially for larger scale devices such as those needed for electric vehicles. Taking inspiration from lithium-ion batteries, 3 most reports on sodium-ion batteries have used metal intercalating materials in the positive electrodes such as layered transition metal oxide 4, 5 and olivine 6 materials. A number of recent reports show good performance in positive electrode materials for sodium-ion batteries. 7-11 Cao et al reported a capacity of 128 mAhg −1 in Na 4 Mn 9 O 18 nanowires at a charge/discharge rate of 0.1C (0.1 × theoretical capacity per hour) and 77% capacity retention after 1000 cycles at a rate of 0.5 C. 8 Tepavcevic et al obtained around 250 mAh/g capacity at a cycling rate of 0.08C from nanostructured bilayered V 2 O 5 . 10 Goodenough and co-workers recently reported a prussian blue framework structure with a reversible capacity of around 100 mAh g -1 and no capacity fade in 30 cycles. 11
Transcript of Performance of nanocrystalline Ni3N as a negative ... · PDF fileIts electrochemical...

1
Performance of nanocrystalline Ni3N as a negative electrode for sodium-ion batteries
Xianji Li, Mahboba M. Hasan, Andrew L. Hector and John R. Owen
Chemistry, University of Southampton, Highfield, Southampton SO17 1BJ, UK
Abstract
Nickel nitride is synthesised by high temperature ammonolysis of nickel(II) hexamine and
tris(ethylenediamine) salts. Its electrochemical characteristics are examined in half cells vs
lithium and sodium. Samples with high surface area are found to have significant reversible
charge storage capacity in sodium cells and hence to be a promising negative electrode
material for sodium-ion batteries.
Introduction
Battery technology has been fundamental to the development of portable electronics over
recent years, and the development of green energy technologies and electric vehicles are
powerful drivers for further improvement. Lithium-ion batteries provide high energy density
and are currently the leading technology to address these energy storage requirements.1
However, due to the limited reserves and the increasing price of exploitable lithium raw
materials2, there is a need for alternative competitive battery technologies. Sodium based
energy storage devices could provide a high voltage and energy density similar to that
achieved with lithium-ion batteries2 and the abundance and low cost of sodium are a distinct
advantage, especially for larger scale devices such as those needed for electric vehicles.
Taking inspiration from lithium-ion batteries,3 most reports on sodium-ion batteries have
used metal intercalating materials in the positive electrodes such as layered transition metal
oxide4, 5
and olivine6 materials. A number of recent reports show good performance in
positive electrode materials for sodium-ion batteries.7-11
Cao et al reported a capacity of 128
mAhg−1
in Na4Mn9O18 nanowires at a charge/discharge rate of 0.1C (0.1 × theoretical
capacity per hour) and 77% capacity retention after 1000 cycles at a rate of 0.5 C.8
Tepavcevic et al obtained around 250 mAh/g capacity at a cycling rate of 0.08C from
nanostructured bilayered V2O5.10
Goodenough and co-workers recently reported a prussian
blue framework structure with a reversible capacity of around 100 mAh g-1
and no capacity
fade in 30 cycles.11

2
Graphite is widely employed as the negative electrode material for lithium-ion batteries as it
can intercalate large amounts of lithium (up to one per C6 unit) and retains a low potential
even with small lithium loadings. It does not intercalate sodium and so cannot be used for
sodium-ion batteries,12
hence the negative electrode is a key challenge for the development of
viable sodium ion batteries. Carbon-based materials still dominate the negative electrode
literature for sodium-ion batteries.2, 13-16
The first successful use of a carbon material, from
decomposition of a glucose precursor, was published by Stevens et al.13
Alcántara et al
reported that carbon black can offer a first cycle reversible capacity close to 200 mAhg-1
at
very low oxidation/reduction rates (0.0125C).14
More recently, Wenzel et al used porous
silica templates to prepare templated carbon which can provide a 180 mAhg-1
capacity in the
first reduction cycle at 0.5C, which decreased to around 120 mAhg-1
after 40 cycles.15
This is
still a good cycling performance compared with most published carbon materials. Very
recently Cao et al reported hollow carbon nanowires prepared from pyrolysis of hollow
polyaniline nanowires that can deliver an initial capacity of 251 mAhg-1
and retain 206.3
mAhg-1
after 400 cycles at 0.2C, a better cyclability than any other carbon-based material.16
A non- carbon-based material, NASICON-type NaTi2(PO4)3 was reported by Park et al17
to
provide around 120 mAhg-1
capacity over 30 cycles, at a sodium insertion potential of 2.1 V
versus Na/Na+. A number of authors have also very recently shown good cycling
performance in Sn, Sb and SnSb alloy materials.18-21
In recent years, conversion reaction mechanisms have been intensively investigated for
lithium-ion batteries,22
and transition metal nitrides are one promising group of materials23-26
operating via the general reaction:
The forward (reduction) process in this reaction would occur during charging if the material
were in use as a negative electrode, or during discharge (at higher potential) during use as a
positive electrode. Nickel nitride (Ni3N) has been examined as a negative electrode material
via conversion reactions for lithium-ion batteries, and the conversion mechanism in these
electrodes was demonstrated by the presence of nickel metal observed by ex-situ diffraction
measurements on thin film electrodes.24
Despite an already high theoretical capacity of 423
mAhg-1
based on the above reaction, nanosized Ni3N prepared from decomposition of nickel
amide achieved a specific capacity of 1200 mAhg-1
in the first reduction reaction.27
This
capacity is not recovered on oxidation and quickly diminished on subsequent cycling, hence

3
the performance of Ni3N is not competitive with other materials. However, negative
electrodes for sodium-ion applications are less well developed and performance in a sodium-
ion environment at the level exhibited by Ni3N under lithium-ion conditions would be of
interest. This paper describes the behaviour of nanocrystalline Ni3N in a sodium-ion battery
environment.
Experimental
Nickel nitride was synthesized in two ways:
1) Nickel (II) nitrate hexahydrate (4 g) was dissolved in deionised water (5 cm3) and 35%
ammonia solution (10 cm3, Fisher) was added slowly with stirring to produce a bluish-violet
solution. This solution was dried by evaporation under flowing ammonia and further dried in
a dessicator over BaO for three weeks. After grinding the precursor was heated at 335 °C for
6 h followed by 200 °C for 8 h under flowing ammonia (BOC anhydrous grade, further dried
by flowing over 3 Å molecular sieves).
2) Nickel(II) nitrate hexahydrate (1 g, Aldrich) was dissolved in ethanol (10 cm3) with
stirring and dried by removing the solvent in vacuo with gentle warming. The resulting
yellow solid was dissolved in ethanol (5 cm3) and ethylenediamine (2 cm
3, Aldrich, 99%)
was added drop wise. Pink nickel tris(ethylenediamine) nitrate was recovered by removing
solvent in vacuo. This solid was heated at 360 °C for 4 h then 200 °C for 40 h under flowing
ammonia.
Powder X-ray diffraction (PXD) patterns were recorded on a Siemens D5000 diffractometer
using monochromatic Cu-Kα1 radiation. Thermogravimetric analyses (TGA) used a Mettler-
Toledo TGA/SDTA85le with flowing argon (50 ml/min). The temperature was raised from
25 to 800 °C at 10 °C/min and was held at maximum temperature for 20 or 60 minutes. The
morphology was examined by transmission electron microscopy (TEM) on a Hitachi H7000
with an accelerating voltage of 75 kV, using samples prepared by ultrasound dispersion into
distilled methanol and dropping onto carbon grids. Infrared (IR) spectra were recorded on a
Perkin Elmer Spectrum 100 FTIR with samples prepared as KBr discs. Surface areas were
calculated using the Brunauer-Emmett-Teller (BET) method28
with nitrogen adsorption data
collected using a Gemini 2375 Surface Area Analyser. Samples were sent for combustion
microanalysis (C, H and N) to Medac Ltd.

4
Electrochemical cells were assembled in two-electrode Swagelok cells using sodium metal
foil (Aldrich, 99.9%) as the counter electrode. Two sheets of Whatman GF/D borosilicate
glass fibre were used as separator, soaked with 1 M NaPF6 in ethylene carbonate/diethyl
carbonate (1:1) electrolyte. The electrolyte components were separately dried (solvents dried
by distillation from BaO and NaPF6 dried under vacuum at 120 °C) before combining in the
glove box. Electrochemical testing used a Bio-Logic SP150 potentiostat. The working
electrode consisted of a powdered mixture of 75% active material with 20% of acetylene
black (Shawinigan, Chevron Phillips Chemical Co. LP) and 5% PTFE rolled into a 90 µm
thick sheet and then cut into a 10 mm diameter disc.
Results and discussion
The synthesis of Ni3N from reaction of a nickel hexamine salt with ammonia was previously
described by Gajbhiye et al.29
We found that [Ni(NH3)6].2NO3 tended to lose ammonia on
drying and that good samples, that converted effectively to Ni3N without NiO contamination,
could only be obtained by drying in a dessicator flushed with gaseous ammonia (over a BaO
drying agent). Most samples contained a small amount of nickel metal in the product and the
amount of this impurity increased with synthesis temperature, but carrying out reactions at
335 °C then reducing the temperature to 200 °C for 8 hours resulted in a phase pure material
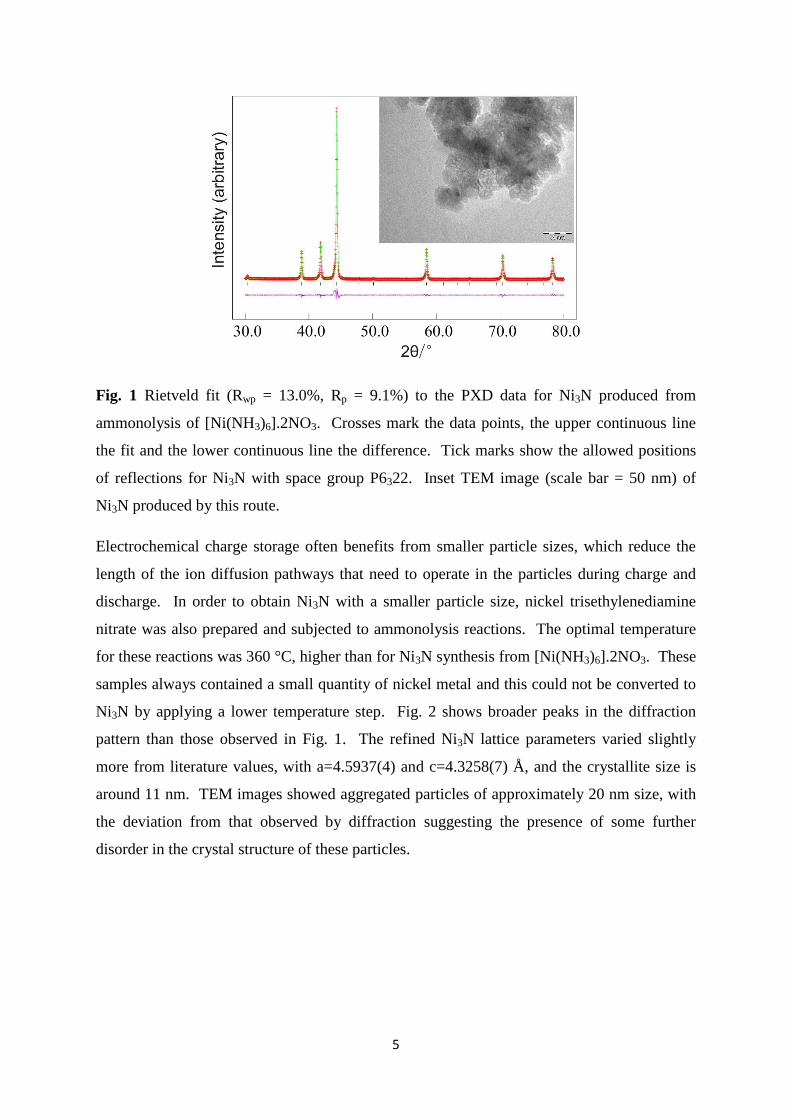
by PXD. Rietveld refinement of the diffraction data (Fig. 1) yielded lattice parameters of
a=4.62231(14) and c=4.30630(13) Å, which are close to the reported values of a=4.624(4)
and c=4.316(4) Å.29
Crystallite size was determined from the Lorentzian components of the
profile fit30
to be around 50 nm which is similar to the overall particle size observed in TEM
images (Fig. 1). These images also show that the nano-sized particles are quite aggregated.
Thermogravimetric analysis (TGA) shows that the sample obtained from nickel hexamine
nitrate loses approximately 7.8% of its mass in a single sharp mass loss just above 400 °C.
Ni3N contains 7.4% N and hence this mass loss is consistent with decomposition to nickel
metal and nitrogen. Elemental analysis of this material showed it contained 7.3% N, 0.1% C
and undetectable amounts of H (<0.1%). Nitrogen adsorption (BET) measurements showed
these samples to have a fairly small surface area of 2.8 m2g
-1, consistent with the relatively
large and aggregated crystallites.
5
Fig. 1 Rietveld fit (Rwp = 13.0%, Rp = 9.1%) to the PXD data for Ni3N produced from
ammonolysis of [Ni(NH3)6].2NO3. Crosses mark the data points, the upper continuous line
the fit and the lower continuous line the difference. Tick marks show the allowed positions
of reflections for Ni3N with space group P6322. Inset TEM image (scale bar = 50 nm) of
Ni3N produced by this route.
Electrochemical charge storage often benefits from smaller particle sizes, which reduce the
length of the ion diffusion pathways that need to operate in the particles during charge and
discharge. In order to obtain Ni3N with a smaller particle size, nickel trisethylenediamine
nitrate was also prepared and subjected to ammonolysis reactions. The optimal temperature
for these reactions was 360 °C, higher than for Ni3N synthesis from [Ni(NH3)6].2NO3. These
samples always contained a small quantity of nickel metal and this could not be converted to
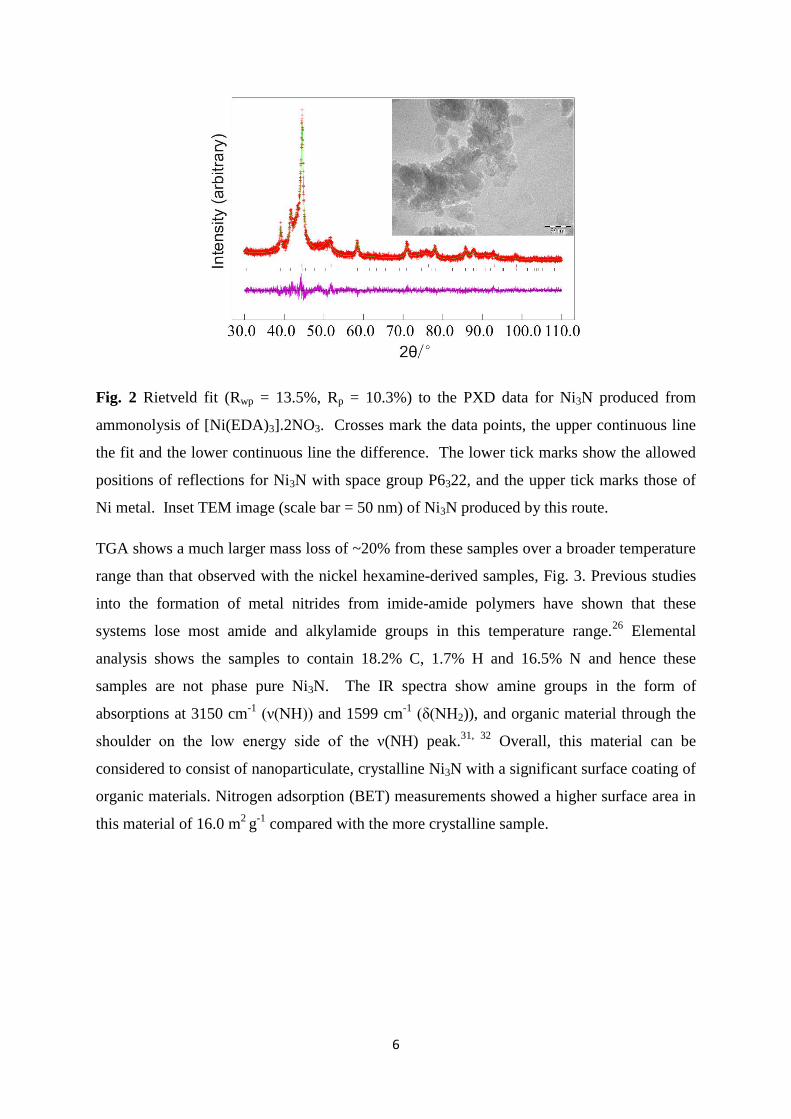
Ni3N by applying a lower temperature step. Fig. 2 shows broader peaks in the diffraction
pattern than those observed in Fig. 1. The refined Ni3N lattice parameters varied slightly
more from literature values, with a=4.5937(4) and c=4.3258(7) Å, and the crystallite size is
around 11 nm. TEM images showed aggregated particles of approximately 20 nm size, with
the deviation from that observed by diffraction suggesting the presence of some further
disorder in the crystal structure of these particles.
6
Fig. 2 Rietveld fit (Rwp = 13.5%, Rp = 10.3%) to the PXD data for Ni3N produced from
ammonolysis of [Ni(EDA)3].2NO3. Crosses mark the data points, the upper continuous line
the fit and the lower continuous line the difference. The lower tick marks show the allowed
positions of reflections for Ni3N with space group P6322, and the upper tick marks those of
Ni metal. Inset TEM image (scale bar = 50 nm) of Ni3N produced by this route.
TGA shows a much larger mass loss of ~20% from these samples over a broader temperature
range than that observed with the nickel hexamine-derived samples, Fig. 3. Previous studies
into the formation of metal nitrides from imide-amide polymers have shown that these
systems lose most amide and alkylamide groups in this temperature range.26
Elemental
analysis shows the samples to contain 18.2% C, 1.7% H and 16.5% N and hence these
samples are not phase pure Ni3N. The IR spectra show amine groups in the form of
absorptions at 3150 cm-1
(ν(NH)) and 1599 cm-1
(δ(NH2)), and organic material through the
shoulder on the low energy side of the ν(NH) peak.31, 32
Overall, this material can be
considered to consist of nanoparticulate, crystalline Ni3N with a significant surface coating of
organic materials. Nitrogen adsorption (BET) measurements showed a higher surface area in
this material of 16.0 m2
g-1
compared with the more crystalline sample.

7
Fig. 3 TGA trace (left) and IR spectrum (right) of Ni3N derived from ammonolysis of
[Ni(EDA)3].2NO3.
Galvanostatic cycling of the [Ni(EDA)3].2NO3-derived Ni3N samples vs Li showed very
similar results to those recently reported by Gillot et al using nickel amide-derived Ni3N.22
During the first reduction at 1C (a rate determined such that theoretical capacity of 423
mAhg-1
would be achieved in 1 h), 840 mAhg-1
of charge was passed as the potential fell
from 3 V to 1 mV. However, much of this is believed to be irreversible capacity due to solid-
electrolyte interface (SEI)-forming side reactions and the reversible capacity is better
evaluated for the subsequent oxidation cycles over the same potential range. The oxidation
specific capacity for the first oxidation was about 400 mAhg-1
and this value fell smoothly to
~210 mAhg-1
after 30 cycles. At a faster rate of 5C (2115 mAg-1
) the capacities were lower
(230 mAhg-1
in the first reduction and 120 mAhg-1
in the first oxidation) but the capacity
profile was more level on cycling, delivering 108 mAhg-1
in the 3rd
oxidation and 98 mAhg-1
in the 30th
oxidation. These data are presented more fully in the supplementary information
(Fig. S1).
Ni3N samples were tested for their reduction-oxidation behaviour vs sodium foil using 1M
NaPF6 in EC:DEC (1:1) as the electrolyte.33
Initially the behaviours of the two types of Ni3N
prepared in this study were compared with reduction/oxidation rates of 0.5C (211 mAg-1
).
Most of the oxidation profile is observed below 1.5 V and hence use of Ni3N as a negative
electrode in high voltage cells, where the oxidation process would occur during cell discharge,
is feasible. The first reduction cycle showed a capacity of 120 mAhg-1
in the
[Ni(NH3)6].2NO3-derived Ni3N and 465 mAhg-1
in the [Ni(EDA)3].2NO3-derived material

8
(Fig. 4). In both cases the capacity fell significantly in the first 5 cycles, presumably due to
SEI formation as observed in Li cells, but then stabilised and maintained fairly constant
values after 30 cycles. In the higher surface area [Ni(EDA)3].2NO3-derived sample the 30th
reduction cycle showed a specific capacity of 126 mAhg-1
. The higher capacity from the
[Ni(EDA)3].2NO3-derived material shows that despite the expected conversion mechanism
the particle size is still very significant in determining the capacity that can be derived from
Ni3N. Hence further cycling studies focussed on this smaller particle size material.
Fig. 4 Reduction specific capacity vs cycle number of Ni3N-sodium half cells using
[Ni(EDA)3].2NO3-derived Ni3N (top) and [Ni(NH3)6].2NO3-derived Ni3N (bottom) cycled
between 1 mV and 3 V at 0.5C (211 mAg-1
) for 30 cycles.
The loss of current to SEI formation during initial cycles means that consideration of the
oxidation process, which is discharge in the context of using Ni3N as the negative electrode in
a sodium-ion cell, and the Coulombic efficiency (charge passed on discharging/oxidation
divided by charge passed on charging/reduction) is as important as the specific capacity. Fig.
5 shows this data for [Ni(EDA)3].2NO3-derived Ni3N-sodium half cells cycling at various
current rates. It is striking that at all three rates the reduction and oxidation curves are close
together, and hence the Coulombic efficiency is close to 100%, from the third cycle. This
suggests that irreversible processes such as SEI formation are close to complete at this point.
The specific capacity is always greater at lower reduction/oxidation rates, e.g. the first
reduction process requires 517 mAhg-1
of charge at 0.1C (42.3 mAg-1
) but only 326 mAhg-1

9
at 1C (423 mAg-1
). The first oxidation delivers 137 (1C), 193 (0.5C) or 227 (0.1C) mAhg-1
and after 20 cycles these values fall to 80 (1C), 126 (0.5C) or 134 (0.1C) mAhg-1
. The ~75%
reduction capacity decrease on cycling was similar to that previously22
(and herein) observed
for Ni3N-lithium cells but note that a smaller drop in capacity is observed when only the
oxidation (sodium-ion cell discharge) process is considered.
Fig. 5 Specific capacity during the first five reduction/oxidation cycles (top) and specific
capacity versus cycle number profile (bottom) of Ni3N-sodium half cells cycled between 1
mV and 3 V for 20 cycles at 1C (423 mAg-1
, left), 0.5C (211.5 mAg-1
, centre) and 0.1C (42.3
mAg-1
, right). In the specific capacity vs cycle number plots closed circles show specific
reduction capacity, open circles show specific oxidation capacity and squares depict
Coulombic efficiency.
The mechanism of charge storage by Ni3N in sodium cells was investigated by recording X-
ray diffraction data on an assembled Ni3N composite electrode, electrochemically reducing it
in a sodium half cell to 0.1 mV at a slow scan rate to maximise conversion, and re-recording
the diffraction pattern (without air exposure) under identical conditions. In contrast to studies
on Ni3N thin films cycled vs Li where crystalline Ni was observed,24
no new peaks were
found suggesting that the reduction products were amorphous. Interestly, though, the Ni3N
peaks were only reduced in magnitude. This suggests that only the surfaces of the Ni3N
crystallites is being utilised and hence that still smaller crystallites might result in the

10
availability of greater capacity. It is possible that the reducing capacity on cycling is due to
gradual consumption of the Ni3N active material, but note that after 20 cycles the specific
oxidation capacity at 0.1C (134 mAhg-1
) is still 32% of the theoretical capacity of 423
mAhg-1
for complete conversion to Ni metal and Na3N, and that the intensity of the
diffraction features is similar after 1 reduction or 20 reductions.
Fig. 6 Ex-situ PXD patterns of Ni3N electrodes before any electrochemical cycling (top), and
after reduction at a rate of 0.067C (28.2 mAg-1
) to 0.001 V (middle) and after reduction and
oxidation at a rate of 0.5C (211.5 mAg-1
) for 20 cycles (bottom). PXD patterns were
collected on identical samples before and after reduction with the same geometry and
detector integration regions to ensure comparability.
The performance of Ni3N as the active material for negative electrodes in sodium-ion cells is
comparable with that of many of the best materials currently in the literature. The best
capacity after 20 cycles (134 mAhg-1
) exceeds the capacity of carbon black, for which
extended cycling studies were not reported, with charge and discharge over a similar potential
range.14
“Templated carbon”15
and NaTi2(PO4)3,17
both deliver ~120 mAhg-1
over this
number of cycles, again with a similar potential range. “Hard carbon” has significantly higher
capacity but was initially found to plate sodium during charging, making it unacceptable for
use over multiple cycles due to the risk of dendrite formation.12
A more recent study of hard
carbon found it possible to utilise ~220 mAhg-1
of this capacity reversibly (100+ cycles),2 and
a similar performance has been demonstrated in hollow carbon nanowire materials.16
It is

11
likely that the already promising performance of Ni3N might be further improved by
reductions in particle size to bring it closer to this performance level, since the diffraction
results show incomplete conversion in the present study.
Conclusions
Ni3N shows good capacity and cycling characteristics on redox cycling vs sodium, and is a
promising negative electrode material for sodium-ion batteries. This performance is
competitive with the best nanoparticulate carbon materials.
References
1. J. M. Tarascon and M. Armand, Nature, 2001, 414, 359.
2. S. Komaba, W. Murata, T. Ishikawa, N. Yabuuchi, T. Ozeki, T. Nakayama, A. Ogata, K.
Gotoh and K. Fujiwara, Adv. Funct. Mater., 2011, 21, 3859.
3. B. L. Ellis and L. F. Nazar, Curr. Opin. Solid State Mater. Sci., 2012, 16, 168-177.
4. A. Mendiboure, C. Delmas and P. Hagenmuller, J. Solid State Chem., 1985, 57, 323.
5. A. Bhide and K. Hariharan, Sol. St. Ionics, 2011, 192, 360.
6. P. Moreau, D. Guyomard, J. Gaubicher and F. Boucher, Chem. Mater., 2010, 22, 4126.
7. A. Caballero, L. Hernan, J. Morales, L. Sanchez, J. Santos Pena and M. A. G. Aranda, J.
Mater. Chem., 2002, 12, 1142.
8. Y. Cao, L. Xiao, W. Wang, D. Choi, Z. Nie, J. Yu, L. V. Saraf, Z. Yang and J. Liu, Adv.
Mater., 2011, 23, 3155.
9. H. Liu, H. Zhou, L. Chen, Z. Tang and W. Yang, J. Power Sources, 2011, 196, 814.
10. S. Tepavcevic, H. Xiong, V. R. Stamenkovic, X. Zuo, M. Balasubramanian, V. B. Prakapenka,
C. S. Johnson and T. Rajh, ACS Nano, 2011, 6, 530.
11. Y. Lu, L. Wang, J. Cheng and J. B. Goodenough, Chem. Commun., 2012, 48, 6544.
12. P. Ge and M. Fouletier, Sol. St. Ionics, 1988, 28–30,, 1172.
13. D. A. Stevens and J. R. Dahn, J. Electrochem. Soc., 2000, 147, 1271.
14. R. Alcántara, J. M. Jiménez-Mateos, P. Lavela and J. L. Tirado, Electrochem. Commun., 2001,
3, 639.
15. S. Wenzel, T. Hara, J. Janek and P. Adelhelm, Energy Env. Sci., 2011, 4, 3342.
16. Y. Cao, L. Xiao, M. L. Sushko, W. Wang, B. Schwenzer, J. Xiao, Z. Nie, L. V. Saraf, Z.
Yang and J. Liu, Nano Lett., 2012, 12, 3783.
17. S. I. Park, I. Gocheva, S. Okada and J.-I. Yamaki, J. Electrochem. Soc., 2011, 158, A1067.
18. L. Wu, F. Pei, R. Mao, F. Wu, Y. Wu, J. Qian, Y. Cao, X. Ai and H. Yang, Electrochim. Acta,
2013, 87, 41-45.
19. J. Qian, Y. Chen, L. Wu, Y. Cao, X. Ai and H. Yang, Chem. Commun., 2012, 48, 7070-7072.
20. L. Xiao, Y. Cao, J. Xiao, W. Wang, L. Kovarik, Z. Nie and J. Liu, Chem. Commun., 2012, 48,
3321-3323.
21. M. K. Datta, R. Epur, P. Saha, K. Kadakia, S. K. Park and P. N. Kumta, J. Power Sources,
2013, 225, 316-322.
22. J. Cabana, L. Monconduit, D. Larcher and M. R. Palacín, Adv. Mater., 2010, 22, E170.
23. B. Das, M. V. Reddy, P. Malar, T. Osipowicz, G. V. Subba Rao and B. V. R. Chowdari, Sol.
St. Ionics, 2009, 180, 1061.
24. Y. Wang, Z.-W. Fu, X.-L. Yue and Q.-Z. Qin, J. Electrochem. Soc., 2004, 151, E162.
25. Q. Sun and Z.-W. Fu, Electrochem. Sol-St. Lett., 2007, 10, A189.
26. Q. Sun and Z.-W. Fu, Electrochim. Acta, 2008, 54, 403.
27. F. Gillot, J. Oro-Sole and M. R. Palacin, J. Mater. Chem., 2011, 21, 9997.
28. S. Brunauer, P. H. Emmett and E. Teller, J. Amer. Chem. Soc., 1938, 60, 309.

12
29. N. S. Gajbhiye, Ningthoujam, R.S. and Weissmüller, J., Phys. Status Solidi (a), 2002, 189,
691.
30. H. M. Rietveld, J. Appl. Cryst., 1969, 2, 65.
31. D. V. Baxter, M. H. Chisholm, G. J. Gama, V. F. DiStasi, A. L. Hector and I. P. Parkin, Chem.
Mater., 1996, 8, 1222.
32. K. Nakamoto, ed., Infrared and Raman Spectra of Inorganic and Organic Compounds 3rd ed,
J. Wiley: New York, 1978.
33. C. Vidal-Abarca, P. Lavela, J. L. Tirado, A. V. Chadwick, M. Alfredsson and E. Kelder, J.
Power Sources, 2012, 197, 314.