
Performance of Initial Public Offerings in Public and...
31
Performance of Initial Public Offerings in Public and Private Owned Firms of Pakistan Henna and Attiya Yasmin Javid
Transcript of Performance of Initial Public Offerings in Public and...

Performance of Initial Public Offerings in Public and Private
Owned Firms of Pakistan
Henna
and
Attiya Yasmin Javid

Introduction
When any private company first time sells his stock to general public
is known as Initial Public offerings, while the term privatization of
IPO refers to the procedure through which a government initially
transfers ownership of assets and control of commercial activities to
the private sector.
Firms undergo IPO process for a variety of reasons:
IPOs forms the exit strategy for the present owners.
To meet high growth rates capital-raise by the IPO.
vertical and/or horizontal integration.
To meet the expansion requirements.
Introduction (cont’d)
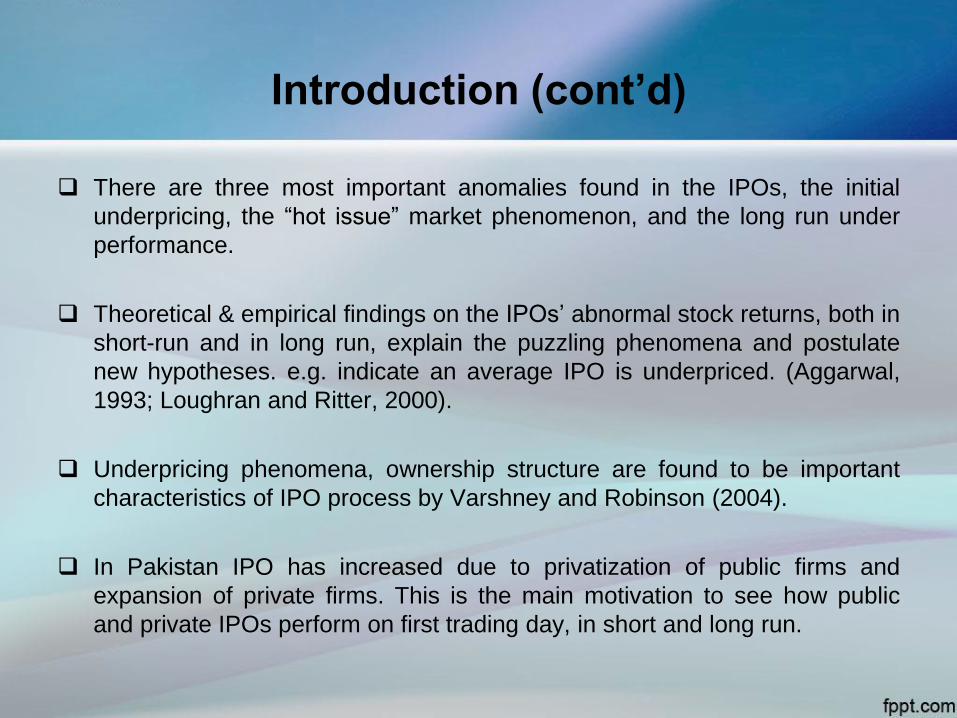
There are three most important anomalies found in the IPOs, the initial
underpricing, the “hot issue” market phenomenon, and the long run under
performance.
Theoretical & empirical findings on the IPOs’ abnormal stock returns, both in
short-run and in long run, explain the puzzling phenomena and postulate
new hypotheses. e.g. indicate an average IPO is underpriced. (Aggarwal,
1993; Loughran and Ritter, 2000).
Underpricing phenomena, ownership structure are found to be important
characteristics of IPO process by Varshney and Robinson (2004).
In Pakistan IPO has increased due to privatization of public firms and
expansion of private firms. This is the main motivation to see how public
and private IPOs perform on first trading day, in short and long run.

Objectives
The objectives of the study are as follows:
To measure, analyze and compare the IPO performance of short run
for first trading day, weekly, over 3 and 6 months and the long-run
aftermarket performance for first five years of public and private
owned firms listed at the KSE.
The study examines the factors that affect the degree of
underpricing and aftermarket performance of public and private
IPOs.
The study also distinguishes the association of ownership structure
and level of underpricing for public and private IPOs.

Research Gap
Most of the research on this issue is done in developed markets. But
in developing markets this area is still less explored. Especially in
case of Pakistan, there is only one study which explicitly compared
IPOs performance for private and privatize enterprises.
This is the first study which compares the short run performance till
6 months, while long run aftermarket performance up to five years
with their determinants, study also compares the association
between underpricing and ownership structure for both public and
private IPOs listed at KSE.
The study provides information to investors, government,
researchers, Capital Markets Authority and other regulatory
agencies about short-run and long-run performance of IPOs.
Literature Review
Researcher year Research
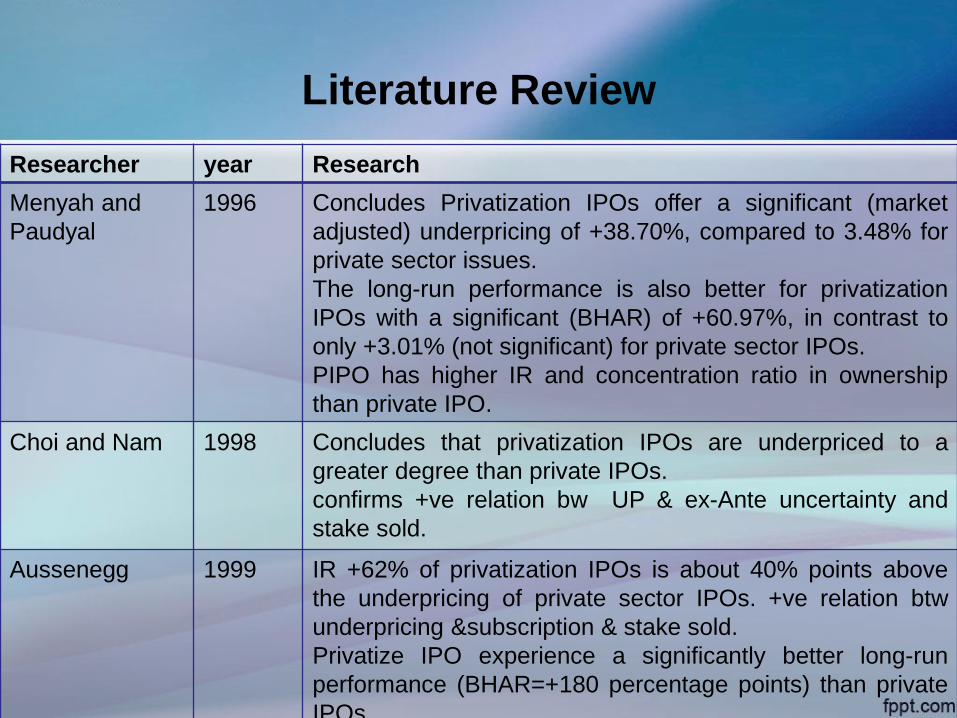
Menyah and
Paudyal
1996 Concludes Privatization IPOs offer a significant (market
adjusted) underpricing of +38.70%, compared to 3.48% for
private sector issues.
The long-run performance is also better for privatization
IPOs with a significant (BHAR) of +60.97%, in contrast to
only +3.01% (not significant) for private sector IPOs.
PIPO has higher IR and concentration ratio in ownership
than private IPO.
Choi and Nam 1998 Concludes that privatization IPOs are underpriced to a
greater degree than private IPOs.
confirms +ve relation bw UP & ex-Ante uncertainty and
stake sold.
Aussenegg 1999 IR +62% of privatization IPOs is about 40% points above
the underpricing of private sector IPOs. +ve relation btw
underpricing &subscription & stake sold.
Privatize IPO experience a significantly better long-run
performance (BHAR=+180 percentage points) than private
IPOs.

Literature Review
Researcher
Year
Research
Suchard and
Singh
2007 PIPOs are significantly more underpriced that IPOs of
privately owned companies and Australian PIPOs are
significantly less underpriced than IPOs of privately owned
companies.
underperformance of IPOs of privately owned companies and
the over-performance of PIPOs .
Rizwan and
Khan
2007 MAR of PIPOs are 45.25% and 47.67 percent above those of
private sector IPOs.
The long run performance of privatization IPOs (12.69%) has
been remarkably better than the private sector IPOs
(-33.11%).
Concludes +ve relation btw IR & stake sold and firm size.

Theoretical Background & Development of
Hypothesis
• H1: The mean initial market-adjusted return of privatize IPOs is lower than for public IPOs.
• H2: There is a negative relationship between underpricing and firm Size.
• H3: There is a positive relationship between underpricing and oversubscription.
• H4: There is a positive relationship between underpricing and ex-ante uncertainty.
Asymmetric Information
Theory
• H5: The relationship between the level of underpricing and the market volatility is positive.
Market Volatility

Theoretical Background & Development of
Hypothesis
• H6: There is a positive relationship between the initial market-adjusted
return and the retention ratio of the shares at the initial offer.
• H7: The relationship between the level of underpricing and the fraction of the share retain at the initial offer is negative for privatize IPOs.
• H8: The larger the size of offer, the lower the underpricing.
. H9:The correlation between ownership structure and underpricing
is higher in privatize IPOs than public IPOs.
Signaling Theory
• H10: The long-run abnormal performance of privatize IPOs is
significantly better than the public IPOs.
. H11: For privatize IPOs the long-run aftermarket performance over 5
years is non-negative.
Divergence of Opinion
Theoretical Background & Development of
Hypothesis
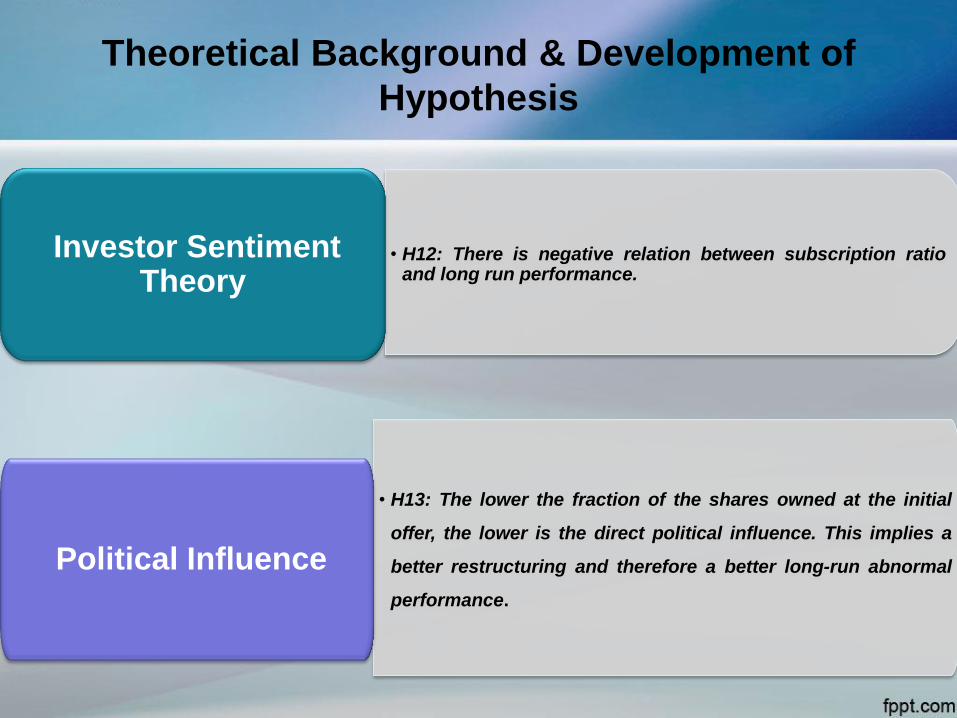
• H12: There is negative relation between subscription ratio and long run performance.
Investor Sentiment Theory
• H13: The lower the fraction of the shares owned at the initial
offer, the lower is the direct political influence. This implies a
better restructuring and therefore a better long-run abnormal
performance.
Political Influence

Measure of Initial Returns
Market Adjusted Initial Return

Measure of Aftermarket Performance
Aftermarket Performance
Variables Definition
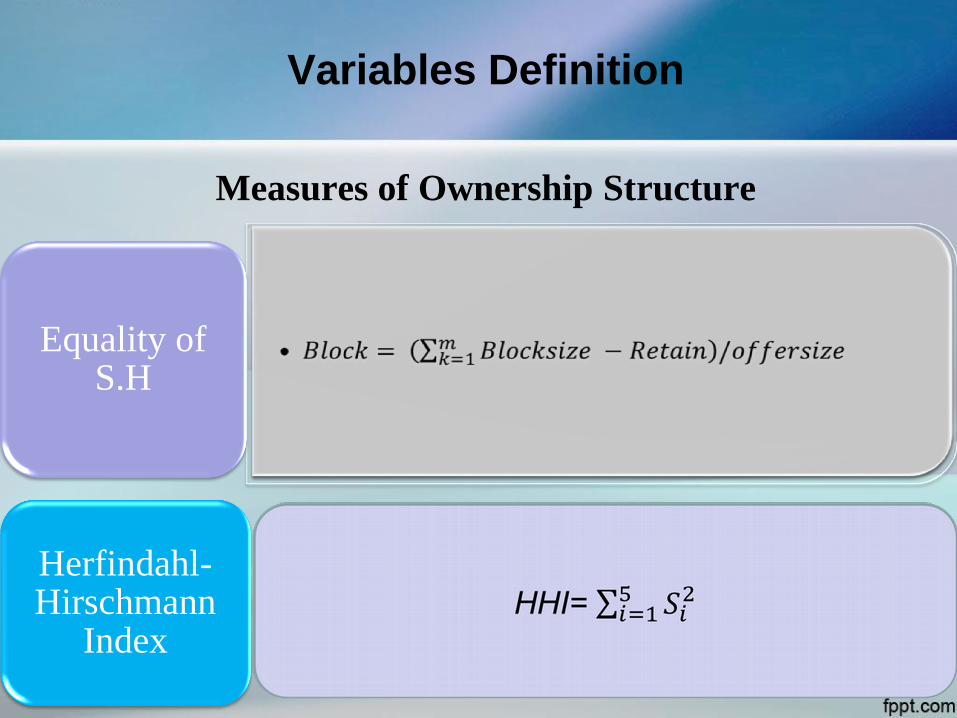
Measures of Ownership Structure
Equality of S.H
Herfindahl-Hirschmann
Index

Variables Definition
. Firm Size
. Subscription Ratio
. Retention Ratio
. Aftermarket Risk
. Natural log of total assets of issue at the listing time.
. Times Subscribed
. No. of share holdings by issuers.
. S.D of daily share returns during first trading month.

Variables Definition
• Natural log of market capitalization of issue after listing.
• S.D of daily returns of KSE index.
• Net income by total assets.
. Issue Proceeds
. Mkt Volatility
. ROA
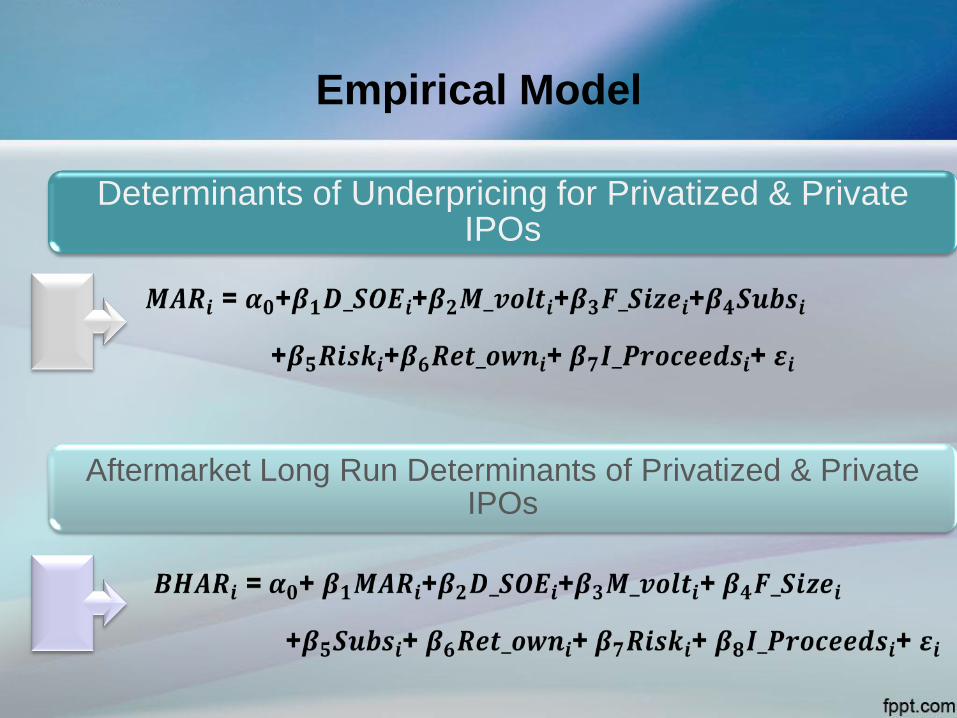
Empirical Model
Determinants of Underpricing for Privatized & Private IPOs
Aftermarket Long Run Determinants of Privatized & Private IPOs
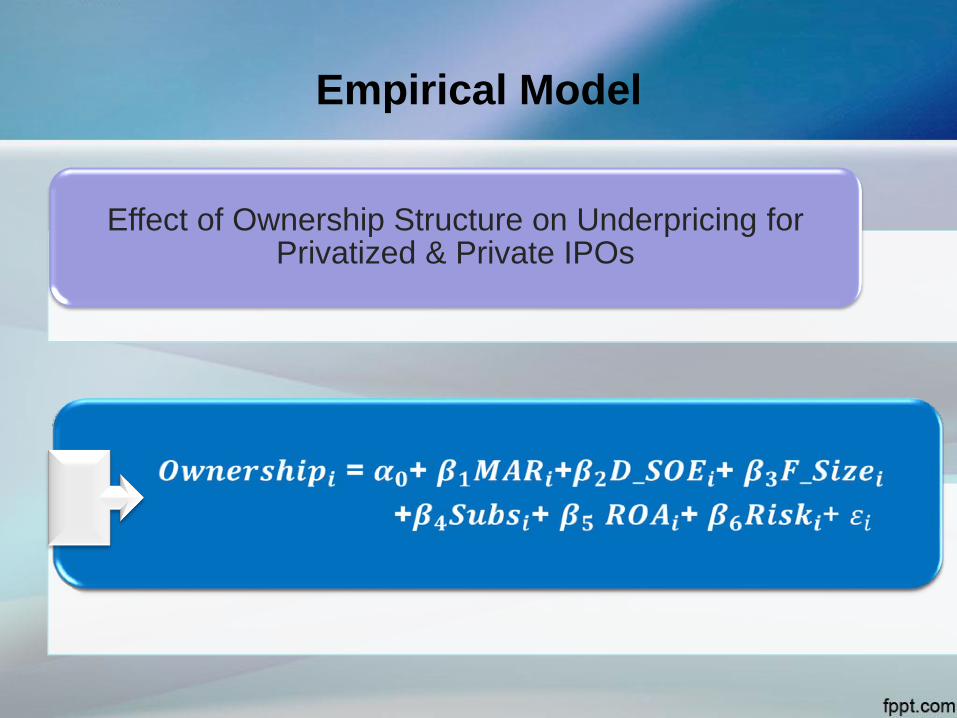
Empirical Model
Effect of Ownership Structure on Underpricing for Privatized & Private IPOs

Data & Sample Selection
Observations are from Mar 2001 - June 2015
61 privately owned & 11 state owned companies IPOs are listed at KSE.
Event study
Data is taken from prospectuses collected from SECP annul reports, balance
sheet analysis and KSE.
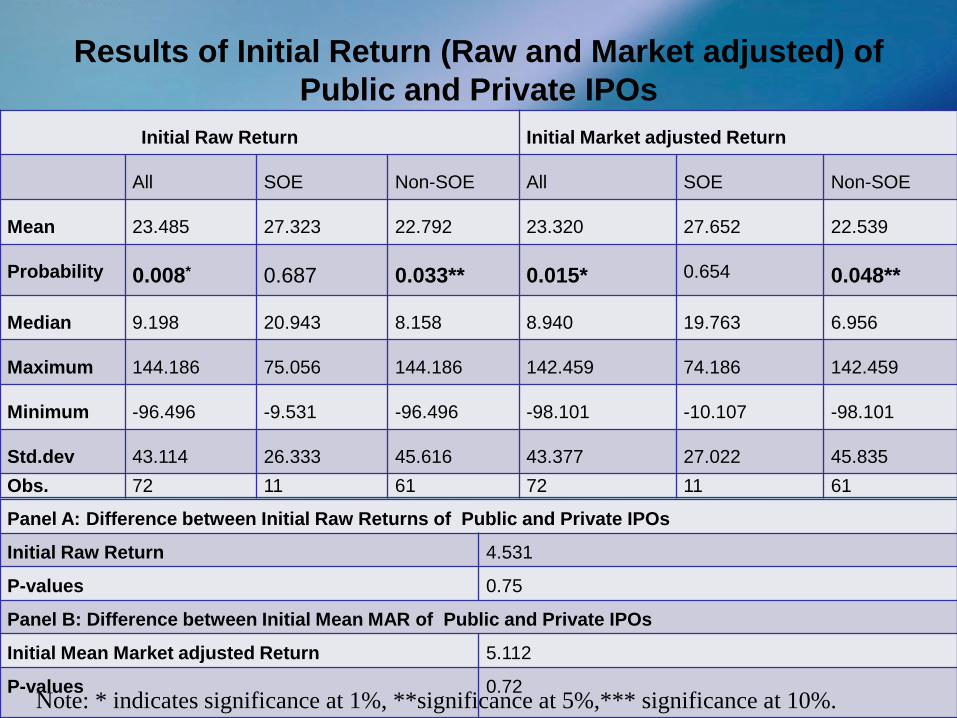
Results of Initial Return (Raw and Market adjusted) of
Public and Private IPOs
Initial Raw Return Initial Market adjusted Return
All SOE Non-SOE All SOE Non-SOE
Mean 23.485 27.323 22.792 23.320 27.652 22.539
Probability 0.008* 0.687 0.033** 0.015* 0.654 0.048**
Median 9.198 20.943 8.158 8.940 19.763 6.956
Maximum 144.186 75.056 144.186 142.459 74.186 142.459
Minimum -96.496 -9.531 -96.496 -98.101 -10.107 -98.101
Std.dev 43.114 26.333 45.616 43.377 27.022 45.835
Obs. 72 11 61 72 11 61
Panel A: Difference between Initial Raw Returns of Public and Private IPOs
Initial Raw Return 4.531
P-values 0.75
Panel B: Difference between Initial Mean MAR of Public and Private IPOs
Initial Mean Market adjusted Return 5.112
P-values 0.72 Note: * indicates significance at 1%, **significance at 5%,*** significance at 10%.
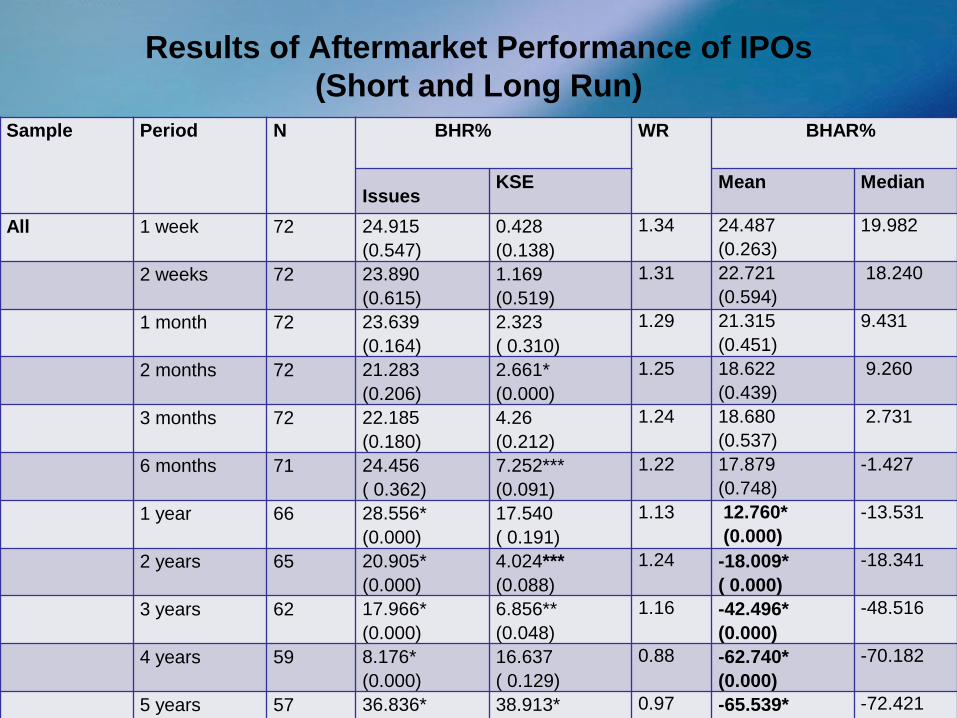
Results of Aftermarket Performance of IPOs
(Short and Long Run)
Sample Period N BHR%
WR BHAR%
Issues KSE Mean Median
All 1 week 72 24.915
(0.547)
0.428
(0.138)
1.34 24.487
(0.263)
19.982
2 weeks 72 23.890
(0.615)
1.169
(0.519)
1.31 22.721
(0.594)
18.240
1 month 72 23.639
(0.164)
2.323
( 0.310)
1.29 21.315
(0.451)
9.431
2 months 72 21.283
(0.206)
2.661*
(0.000)
1.25 18.622
(0.439)
9.260
3 months 72 22.185
(0.180)
4.26
(0.212)
1.24 18.680
(0.537)
2.731
6 months 71 24.456
( 0.362)
7.252***
(0.091)
1.22 17.879
(0.748)
-1.427
1 year 66 28.556*
(0.000)
17.540
( 0.191)
1.13 12.760*
(0.000)
-13.531
2 years 65 20.905*
(0.000)
4.024***
(0.088)
1.24 -18.009*
( 0.000)
-18.341
3 years 62 17.966*
(0.000)
6.856**
(0.048)
1.16 -42.496*
(0.000)
-48.516
4 years 59 8.176*
(0.000)
16.637
( 0.129)
0.88 -62.740*
(0.000)
-70.182
5 years 57 36.836*
(0.000)
38.913*
(0.008)
0.97 -65.539*
(0.000)
-72.421
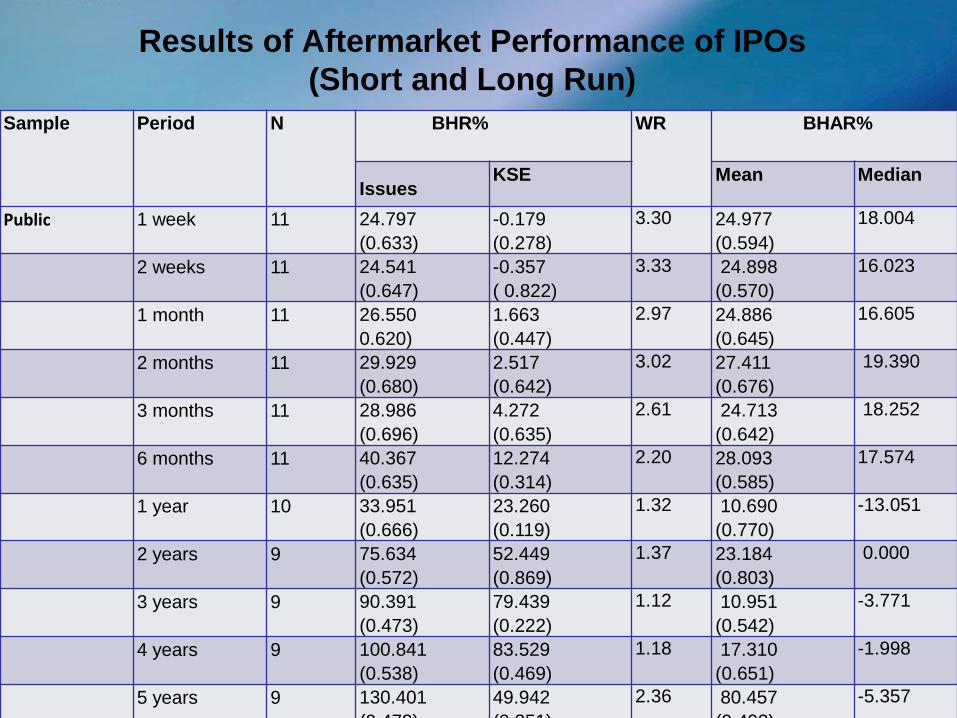
Results of Aftermarket Performance of IPOs
(Short and Long Run)
Sample Period N BHR%
WR BHAR%
Issues KSE Mean Median
Public 1 week 11 24.797
(0.633)
-0.179
(0.278)
3.30 24.977
(0.594)
18.004
2 weeks 11 24.541
(0.647)
-0.357
( 0.822)
3.33 24.898
(0.570)
16.023
1 month 11 26.550
0.620)
1.663
(0.447)
2.97 24.886
(0.645)
16.605
2 months 11 29.929
(0.680)
2.517
(0.642)
3.02 27.411
(0.676)
19.390
3 months 11 28.986
(0.696)
4.272
(0.635)
2.61 24.713
(0.642)
18.252
6 months 11 40.367
(0.635)
12.274
(0.314)
2.20 28.093
(0.585)
17.574
1 year 10 33.951
(0.666)
23.260
(0.119)
1.32 10.690
(0.770)
-13.051
2 years 9 75.634
(0.572)
52.449
(0.869)
1.37 23.184
(0.803)
0.000
3 years 9 90.391
(0.473)
79.439
(0.222)
1.12 10.951
(0.542)
-3.771
4 years 9 100.841
(0.538)
83.529
(0.469)
1.18 17.310
(0.651)
-1.998
5 years 9 130.401
(0.473)
49.942
(0.351)
2.36 80.457
(0.492)
-5.357

Results of Aftermarket Performance of IPOs
(Short and Long Run)
Sample Period N BHR%
WR BHAR%
Issues KSE Mean Median
Private 1 Week 61 24.936
(0.183)
0.538*
(0.000)
1.39 24.398
(0.197)
20.952
2 weeks 61 23.773
(0.208)
1.445
(0.630)
1.35 22.328
(0.301)
18.759
1 month 61 23.114
(0.124)
2.443
(0.630)
1.32 20.671
(0.125)
7.809
2 months 61 20.053
(0.144)
2.733*
(0.000)
1.27 17.036
(0.153)
8.428
3 months 61 23.051
(0.248)
4.225
(0.624)
1.28 17.591
(0.265)
0.724
6 months 60 24.047
(0.126)
6.578
(0.318)
1.26 16.037*
(0.197)
-3.259
1 year 56 31.906*
(0.000)
17.341
(0.207)
1.19 13.133*
(0.000)
-14.01
2 years 56 12.702*
(0.000)
41.978***
(0.071)
0.70 -25.437*
(0.000)
-27.618
3 years 53 5.868*
(0.000)
68.225**
(0.032)
0.49 -52.134*
(0.000)
-51.723
4 years 50 -10.845*
(0.000)
87.231
(0.000)*
0.28 -77.175**
(0.051)
-77.092
5 years 48 -12.540*
(0.000)
106.692*
(0.000)
0.22 -91.866***
(0.013)
-83.495

Short & Long run Aftermarket Performance of
Public & Private IPOs
-120.00%
-100.00%
-80.00%
-60.00%
-40.00%
-20.00%
0.00%
20.00%
40.00%
60.00%
80.00%
100.00%
1 week 2 weeks 1 month 2 months 3 months 6 months 1 year 2 years 3 years 4 years 5 years
Aft
erm
arke
t P
erf
orm
ance
Time Period
Short run & Long run Aftermarket Performance of Public & Private IPOs
SOE Non-SOE
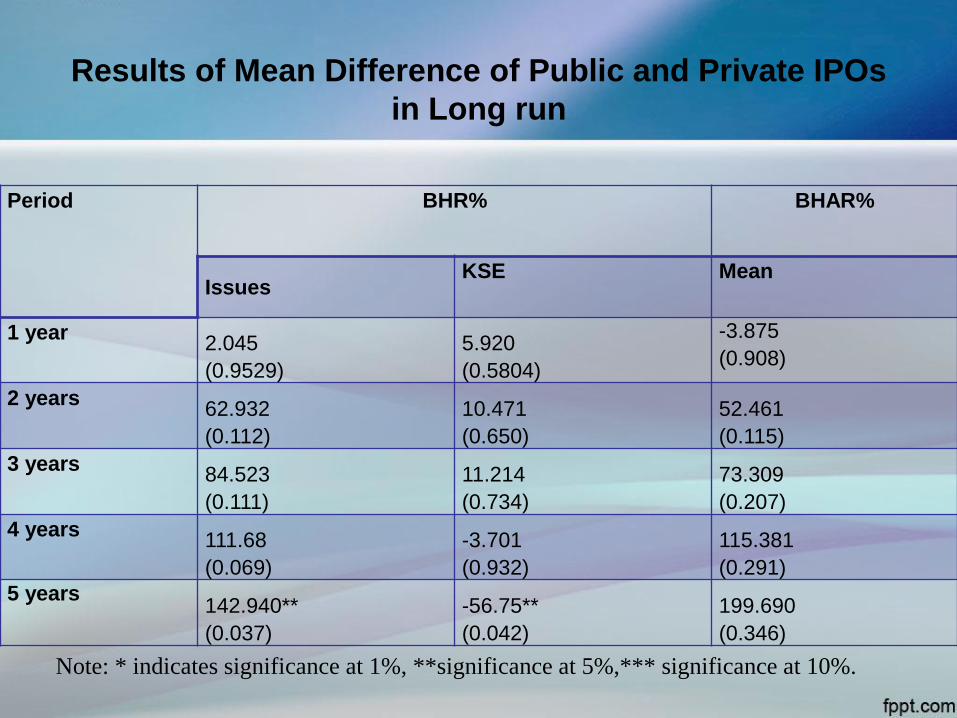
Results of Mean Difference of Public and Private IPOs
in Long run
Period BHR%
BHAR%
Issues KSE Mean
1 year 2.045
(0.9529)
5.920
(0.5804)
-3.875
(0.908)
2 years 62.932
(0.112)
10.471
(0.650)
52.461
(0.115)
3 years 84.523
(0.111)
11.214
(0.734)
73.309
(0.207)
4 years 111.68
(0.069)
-3.701
(0.932)
115.381
(0.291) 5 years
142.940**
(0.037)
-56.75**
(0.042)
199.690
(0.346)
Note: * indicates significance at 1%, **significance at 5%,*** significance at 10%.

Results of First day Underpricing Determinants of
Public and Private IPOs
Independent Variables
Dependent variable: First day market adjusted return
Coefficient t-Statistic Prob.
D_SOE 0.0838 0.63 0.533 R square = 0.482
M_Volt -0.3707 -1.19 0.239 Adj R-squared =0.425
I_Proceeds -0.0517 -1.25 0.215 Prob F-stat = 0.000
F_Size -0.0417** -2.15 0.035 DW stat = 1.984
Ret_own -0.2485 -0.76 0.452
Risk 1.3942** 2.10 0.039
Subs 0.0365** 2.04 0.045
Constant -0.4549*** -1.68 0.098
Note: * indicates significance at 1%, **significance at 5%,*** significance at 10%.

Results of After-market long run determinants of Public
and Private IPOs
Independent
Variables
Dependent Variable: Buy and hold abnormal return over 5 years.
Coefficient t-Statistic Prob.
MAR_1 -1.1280* -3.19 0.002 R square = 0.28
D_SOE 0.8176 1.27 0.205 Adj. R square = 0.19
M_Volt 1.5816* 2.81 0.006 Prob(F-stat) = 0.004
I_Proceeds -0.1148 -0.68 0.497 DW stat = 1.96
F_Size -0.0211 -0.27 0.782
Ret_own 1.8757** 2.53 0.013
Risk 1.6160 1.05 0.297
Subs 0.0623 0.84 0.403
Constant -1.2836 -1.18 0.239
Note: * indicates significance at 1%, **significance at 5%,*** significance at 10%.

Results of Effect of Underpricing on Ownership
Structure (Concentration) of Public & Private IPOs
Independent Variables Dependent Variable: Block
Coefficient t-Statistic Prob.
D_SOE 0.058 0.65 0.52 R square = 0.148
F_Size -0.037** -2.46 0.016 Adj. R square = 0.07
MAR -0.136** -2.40 0.019 Prob(F-stat) = 0.04
Risk -1.014** -2.57 0.012 DW stat = 2.04
ROA 0.063*** 1.80 0.076
Subs 0.020 1.34 0.185
Constant 1.080* 3.11 0.003
Independent Variables Dependent Variable: HHI Coefficient t-Statistic Prob.
D_SOE 0.056 1.07 0.290 R square = 0.174
F_Size -0.022** -2.50 0.015 Adj. R square = 0.09
MAR -0.074* -2.69 0.009 Prob(F-stat) = 0.04
Risk -0.435** -2.18 0.033 DW stat = 2.03
ROA 0.020 1.14 0.257
Subs 0.005 0.61 0.546
Constant 0.643* 3.28 0.002

Conclusion
• Pakistan‘s Public and Private IPOs are underpriced for first trading day, but
the mean difference of both IPOs is not statistically significant.
• Firm size, after market risk level of IPO and subscription ratio are significant
factors of underpricing and supports winner‘s curse model (Rock, 1986).
• In a sample of All and Public IPOs, the positive BHAR up to one year period
and underperforms in long run over 5 years period. While, Private IPOs
BHAR outperforms in all years. But the positive mean difference in long run
of Public and Private IPOs is statically insignificant.
• First day MAR, market volatility and retention ratio are significant factors
that can influence aftermarket long run performance.
• Concentration of ownership structure is similar in both group of IPOs, which
is against the signaling theory. First day MAR has negative and firm size,
risk of IPO and ROA significant impact on concentration of ownership.
Policy implications
The study proposes some following implications:
Market forces can do better instead of investment banks. It would
make system efficient in long run.
Regulatory authorities needs to take some steps to minimize
concentration in ownership structure of new issues.
To make dispersion in ownership structure, and to involve more
small investors which are mostly uninform of IPO prices, there
should be some specific range of underpricing by issuers and
Securities and Exchange Commission of Pakistan (SECP).
Future Research
Future research may be conduct in following areas:
Researchers may compare the BHAR with matching firm portfolio (equal
weighted) with firm’s different characteristics as a benchmark in long run
performance.
Researchers may also detect long run returns with cumulative abnormal
returns (CAR) and may also use methodology of calendar time study to
evaluate abnormal performances.
More explanatory variables which may influence underpricing level and
aftermarket long run performance can be tested for Public and Private
IPOs.
It will be interesting to test other underpricing and long run theories for
Public and Private IPOs.


![Investor Participation in Initial Public Offerings · 2017-05-27 · 2016] Investor Participation in Initial Public Offerings 565 investors6 who have longstanding relationships with](https://static.fdocuments.us/doc/165x107/5f2fd3f0f2cd2026ee62068b/investor-participation-in-initial-public-offerings-2017-05-27-2016-investor-participation.jpg)


