Performance of Elephant (Eliphas maximus) Dung Activated...
15
International Journal of ChemTech Research CODEN( USA): IJCRGG ISSN : 0974-4290 Vol.6, No.2, pp 1362-1376, April-June 2014 Performance of Elephant (Eliphas maximus) Dung Activated Carbon for the Removal of Crystal Violet from Aqueous Solution Theivarasu C 1 *, Chandra S 2 1 Department of Basic Sciences-Chemistry, PSG College of Technology, Coimbatore, Tamil Nadu, India. 2 Department of Chemistry and Applied Chemistry, PSG Polytechnic College, Coimbatore, Tamil Nadu, India. *Corres.author: [email protected]; Phone No.:9443577832 Abstract: Elephant Dung Activated Carbon (EDAC) prepared by acid treatment was used as an eco friendly adsorbent for the removal of a textile dye, Crystal Violet (CV) from an aqueous solution. Batch adsorption experiments were carried out to determine the kinetic, thermodynamic and isotherm parameters by varying the initial dye concentration and temperature. The adsorption kinetic data were correlated with Pseudo first order, Pseudo second order and Elovich models. Pseudo second order kinetic model fitted very well with the experimental data. The mechanism of adsorption process was determined by studying the intra particle diffusion and liquid film diffusion models. The effect of pH on percentage removal of CV was studied. It was found that the maximum adsorption took place in neutral and alkaline medium. The thermodynamic parameters like Gibb’s Free energy change (∆G), Entropy change (∆S) and enthalpy change (∆H) were calculated. The results indicated that CV adsorption process was endothermic and spontaneous. The experimental data were correlated with Langmuir, Freundlich and Temkin adsorption isotherm models. The data was best represented by Langmuir isotherm model. Keywords: Elephant dung; Crystal Violet; Adsorption; Kinetics; Thermodynamics; Activation energy; Isotherms. Introduction Textile and dyeing industry effluents can create serious environmental pollution problems when they are discharged into water bodies. The untreated effluents possess toxic dyes and pigments which impart colour even at low concentration. These hazardous materials affect photosynthetic activity 1 because of reduced light penetration. So it is important to adopt some treatment methods before discharging the effluents into water to reduce the harmful effects. The methods employed for the removal of dyes from wastewaters include anaerobic decolourisation 2 , chemical oxidation 3 , reverse osmosis 4 , ion exchange 5 and biological treatment 6 . These physico
-
Upload
doankhuong -
Category
Documents
-
view
220 -
download
0
Transcript of Performance of Elephant (Eliphas maximus) Dung Activated...

International Journal of ChemTech Research CODEN( USA): IJCRGG ISSN : 0974-4290
Vol.6, No.2, pp 1362-1376, April-June 2014
Performance of Elephant (Eliphas maximus) Dung
Activated Carbon for the Removal of Crystal Violet from Aqueous Solution
Theivarasu C1*, Chandra S2
1 Department of Basic Sciences-Chemistry, PSG College of Technology, Coimbatore, Tamil Nadu, India.
2Department of Chemistry and Applied Chemistry, PSG Polytechnic College,
Coimbatore, Tamil Nadu, India.
*Corres.author: [email protected]; Phone No.:9443577832
Abstract: Elephant Dung Activated Carbon (EDAC) prepared by acid treatment was used as an eco friendly adsorbent for the removal of a textile dye, Crystal Violet (CV) from an aqueous solution. Batch adsorption experiments were carried out to determine the kinetic, thermodynamic and isotherm parameters by varying the initial dye concentration and temperature. The adsorption kinetic data were correlated with Pseudo first order, Pseudo second order and Elovich models. Pseudo second order kinetic model fitted very well with the experimental data. The mechanism of adsorption process was determined by studying the intra particle diffusion and liquid film diffusion models. The effect of pH on percentage removal of CV was studied. It was found that the maximum adsorption took place in neutral and alkaline medium. The thermodynamic parameters like Gibb’s Free energy change (∆G), Entropy change (∆S) and enthalpy change (∆H) were calculated. The results indicated that CV adsorption process was endothermic and spontaneous. The experimental data were correlated with Langmuir, Freundlich and Temkin adsorption isotherm models. The data was best represented by Langmuir isotherm model.
Keywords: Elephant dung; Crystal Violet; Adsorption; Kinetics; Thermodynamics; Activation energy; Isotherms.
Introduction
Textile and dyeing industry effluents can create serious environmental pollution problems when they are discharged into water bodies. The untreated effluents possess toxic dyes and pigments which impart colour even at low concentration. These hazardous materials affect photosynthetic activity1 because of reduced light penetration. So it is important to adopt some treatment methods before discharging the effluents into water to reduce the harmful effects. The methods employed for the removal of dyes from wastewaters include anaerobic decolourisation2, chemical oxidation3, reverse osmosis4, ion exchange5 and biological treatment6. These physico

Theivarasu C et al /Int.J. ChemTech Res.2014,6(2),pp 1362-1376. 1363
chemical methods are less efficient, expensive and produce wastes which are difficult to dispose. Among these methods, adsorption7 onto activated carbon has been proven to be the most effective method for the color removal in terms of initial cost, simplicity of design, easy operation and insensitivity to toxic substances8. Adsorption is more advantageous than the other conventional methods due to its sludge free clean process and high adsorption capacity for the colored particles. However, usage of commercial activated carbon for adsorption has some limitations like high cost and regeneration problems. This has necessitated the exploration of some effective, cheaper and easily available alternatives. Such alternatives include low cost activated carbons prepared from natural products like date pits9, bagasse10, fruit stones and nutshells11, Jute fiber12, rice husks13, plum kernels14 and coconut shells15. Activated carbons prepared from various products are widely used as adsorbents due to their high adsorption capacity, large surface area and micro porous structure. The wide usefulness of activated carbon as adsorbent is a result of their chemical and thermal stability.
In this paper, an attempt has been made to utilize activated carbon prepared from elephant dung for the removal of CV, a basic dye from aqueous solution. The zero or negligible cost of elephant dung makes this project feasible and cost effective. The main objectives of the study are: Evaluating the performance of using elephant dung as a low cost activated carbon and studying its application to remove CV from wastewater through batch adsorption experiments; Studying the adsorption mechanism through kinetic and equilibrium data; determining the thermodynamic and adsorption isotherm parameters.
Experimental
Adsorbate
Crystal Violet (CAS No.:548-62-9; Molecular formula: C25N3H30Cl; Molar Mass: 407; λmax: 584 nm) was procured from Sigma Aldrich and used as received without further purification. A stock solution of the dye (1000 mg/L) was prepared by dissolving the dye in distilled water. Dilutions of required initial concentrations (10, 20, 30 and 40 mg/L) were made.
Adsorbent
Preparation and characterization of EDAC was reported in our previous paper16.
Batch adsorption experiments
Batch adsorption experiments were conducted to study the effects of contact time, temperature and pH on the adsorption of CV by EDAC and to investigate the chemical kinetics, thermodynamics and the adsorption isotherms. Batch adsorption experiments were carried out at room temperature by taking different initial dye concentrations (10, 20, 30 and 40 mg/L). 50 ml of the dye solutions were taken in 250 ml conical flasks with desired dosage of EDAC. The conical flasks were then shaken using Labline shaking incubator at a constant agitation speed (120 rpm). The samples were withdrawn from the shaker at predetermined time intervals, and the supernatant liquid portions were centrifuged using R-8C laboratory centrifuge (Remi make) at 2000 rpm for 20 minutes and analyzed for remaining dye concentration spectrophotometrically using Schimadzu UV-1700 PharmaSpec UV visible spectrophotometer. The amount of dye adsorbed onto activated carbon was calculated as follows:
qe= (C0-Ce) v/w (1)
where, C0 and Ce are the initial and equilibrium concentrations (mg/L) of the dye solutions respectively. v is the volume of the dye solution taken and w is the weight of the adsorbent used.
Results and discussion
Effect of initial concentration and time
Batch adsorption experiments were conducted to study the influence of contact time and initial dye concentration on the distribution of the dye between the adsorbent and the dye solution at equilibrium. It is also important to assess the adsorption capacity of the adsorbent for the adsorbate. The effect of contact time on the amount of dyes adsorbed per unit time of adsorbent was studied. The effect of contact time on the adsorption of

Theivarasu C et al /Int.J. ChemTech Res.2014,6(2),pp 1362-1376. 1364
CV by EDAC for different initial dye concentrations is shown in figure 1. It was found that the adsorption was rapid in the initial stages, increased gradually and reached equilibrium after a particular time. This could be due to the fact that, in the initial stages of adsorption process, the dye molecules reach boundary layer, diffuse into the adsorbent surface and finally into the pores of the adsorbent. After the initial adsorption of dye molecules, the number of unoccupied sites decrease and the adsorbent surface approaches saturation. Similar results were reported by several authors using low cost adsorbents17,18. The equilibrium time was found to be 300 minutes for 40 mg/L, 270 minutes for 30 mg/L, 210 minutes for 20 mg/L and 150 minutes for 10 mg/L. Further, the amount of dye adsorbed increased with an increase in initial dye concentration. This happened because, the increase in initial concentration enhanced the driving force between the aqueous and solid phases and increased the number of collisions between dye molecules and the adsorbent19. The data reveals that the percent removal of dyes decreases with increase in the dye concentration suggesting that dye removal by adsorption is concentration dependent due to the saturation of adsorption sites on the adsorbent surface. The reason is that, at low concentrations, the ratio of the number of molecules to the available surface area is low, subsequently; the fractional adsorption becomes independent of initial concentration. However, at high concentrations, the available sites of adsorption become fewer and hence the percentage removal of the dye is dependent on initial dye concentration20.
Figure 1: Effect of contact time and initial dye concentration
Adsorption kinetics
The chemical kinetics describes reaction pathways along time to reach equilibrium, whereas chemical equilibrium does not give any information about the pathways and rate of reaction. Adsorption kinetics is highly dependent on the physical or chemical characteristics of the adsorbent material. The adsorption of dyes from liquid to solid phase can be considered as a reversible reaction with equilibrium established between the two phases. Adsorption performance and ultimate cost of an adsorption system depends upon the effectiveness of the process design and the efficiency of process operation. The efficiency of process operation requires an understanding of the kinetics of adsorption or the time dependence of the concentration distribution of the solute between bulk solution and solid adsorbent. In order to investigate the mechanism of adsorption of CV onto EDAC three different kinetic models namely Pseudo first order, Pseudo second order and Elovich models were applied to the experimental data.
Pseudo first order kinetic model
This was the first equation for the adsorption of liquid/solid system based on the solid capacity21 (Ho and McKay, 1999). This model is described as follows22 (Lagergren, 1898).
dqt/dt = k1(qe-qt) (2)
Where, qe and qt are the amount adsorbed (mg/g) at equilibrium and at time, t, respectively and k1 is the pseudo first order rate constant (min-1). After integration by applying conditions, qt = 0 at t = 0 and qt = qt at t = t, then the equation becomes,
log(qe-qt)=logqe-( k1/2.303)t (3)

Theivarasu C et al /Int.J. ChemTech Res.2014,6(2),pp 1362-1376. 1365
A plot (Figure 2) of log (qe-qt) versus time at various initial concentrations (10, 20, 30, and 40 mg/L) gives linear lines. The values of k1 and qe, are calculated from the slope and intercept of the plot respectively. The correlation coefficient of pseudo first order kinetic model obtained for all initial concentrations are relatively low. This indicates that the sorption of CV does not follow pseudo first order kinetics. The inapplicability of the Lagergren equation to describe the kinetics of dyes sorption was also observed for the adsorption of dyes using banana and orange peels5.
Figure 2: Pseudo first order kinetic model
Pseudo second order kinetic model
Kinetic data were further treated with pseudo second order kinetic model. Pseudo second order equation is based on the sorption capacity of the solid phase23. The differential equation is given as follows.
dqt/dt =k2(qe-qt)2 (4)
Where, qe and qt are the adsorption capacity at equilibrium and time t respectively (mg/g) and k2 is the rate constant of pseudo second order adsorption (g/mg.min). Integration of the above equation for the boundary conditions t=0 to t=t and q=0 to qe gives
1/( qe-qt)=1/qe + k2t (5)
The above equation is the integrated law for a pseudo second order reaction. The above equation can be rearranged to obtain
t/qt= 1/ k2qe2 + (1/qe)t (6)
A plot (Figure 3) of t/qt versus t gives a linear relationship which proves that the adsorption follows Pseudo second order kinetics. qe and k2 are calculated from the slope and intercept of the plot respectively. The equilibrium sorption capacity qe, is increasing while increasing the initial dye concentration but a decreasing trend is observed in the pseudo second order rate constant k2. Moreover the calculated values of equilibrium adsorption capacity qe for all the initial dye concentrations are in good agreement with the experimental data. It is also observed that the correlation coefficient r2 values are higher than pseudo first order r2 values. From the results it is understood that pseudo second order kinetics describes the adsorption of CV onto EDAC much better than pseudo first order kinetic model.
Elovich model
Elovich equation is mainly used to describe the second order kinetics assuming that the actual solid surfaces are energetically heterogeneous24. Elovich model is generally expressed as follows25.
dqt/dt =αe-βqt (7)
Where, α and β are constants. The constant ‘α’ is considered as the initial rate because (dqt/dt)→ α as qt→0. Given that qt = 0 at t = 0 and ‘β’ is an indication of the number of sites available for adsorption. The integrated form of the above equation is as follows.

Theivarasu C et al /Int.J. ChemTech Res.2014,6(2),pp 1362-1376. 1366
qt = (1/β)ln(t+t0)-(1/ β)lnt0 (8)
Where t0 = (1/α β). If t>> t0, it is simplified as
qt = (1/β)ln(αβ)+(1/β)lnt (9)
The parameters α and β are calculated from the slope and intercept of the plot (Figure 4) of lnt versus time respectively. Lowering of β values with increase in initial dye concentrations and justification of t>> t0 predict the behavior adsorption of dyes over the whole range of variables studied strongly supports the validity of Elovich equation. The initial adsorption rates α, increases while increasing the initial concentration from 10 to 40 mg/L. Kinetic parameters of pseudo first order, pseudo second order and Elovich models are listed in Table 1.
Applicability of each kinetic model equation was tested with the sum of error squares (SSE) using the following formula26.
SSE = √Σ(qe.exp- qe.cal)2/N (10)
Where, N is the number of data points. A kinetic model having higher r2 values and lower SSE values will have a best fit with the experimental data. In this study higher values of r2 and lower values of SSE were observed for pseudo second order kinetic model. This proved that pseudo second order kinetic model provided a good correlation for the adsorption of CV onto EDAC. Similar reports have already been recorded for the adsorption of Methylene Blue onto bamboo based activated carbon27; Adsorption of direct dyes on activated carbon prepared from sawdust28; Adsorption of Congo red on activated carbon from coir pith29.
Figure 3: Pseudo second order kinetic model
Figure 4: Elovich model
Effect of temperature
Temperature plays an important role in the adsorption process of dyes. Increase in temperature, increases the rate of diffusion of the adsorbate molecules across the external boundary layer and into the internal pores of the adsorbent, due to the decrease in viscosity of solution. The effect of temperature on percentage removal of CV is shown in figure 5. The effect of temperature on the adsorption of CV was examined by carrying out experiments at 301K, 308K, 318K, 328K and 338K with 50 ml of 40 mg/L dye solution with 100 mg adsorbent. From the results it is observed that the percentage removal of the dye increased as the temperature increased. Increase in dye uptake with increase in temperature reveals that the adsorption of dyes onto EDAC is endothermic in nature. When the temperature is increased, the mobility of the dye molecules increased and the retarding forces on the diffusing ions decreased, thereby increasing the sorption capacity of the adsorbent30. The enhancement of adsorption capacity of the adsorbent at high temperatures was also attributed to the enlargement of pore size and activation of the adsorbent surface31. Equilibrium time of 40 mg/L of CV was reduced from 300 to 180 minutes. This is due to the reason that, increase in temperature, increases the particle density, which form voids, resulting in a reduced equilibrium time32. Similar results were reported by Sreelatha et al., 201133 and Ncibi et al., 200734 for the adsorption of reactive dyes (reactive red 141 and reactive blue 21) using palm

Theivarasu C et al /Int.J. ChemTech Res.2014,6(2),pp 1362-1376. 1367
shell powder (An Agrowaste) and chitosan as adsorbents and for the adsorption of textile reactive dye (reactive red 228) using Posidonia Oceanica (L.) fibrous biomass as an adsorbent respectively. From the results it is understood that increase in temperature increases the adsorption capacity of the adsorbent indicating that adsorption of dyes onto EDAC is highly dependent on temperature.
Table 1. Kinetic parameters
Concentration (mg/L) 10 20 30 40
_________________________________________________________________________________________
Pseudo first order kinetic model q e.exp (mg/g) 4.986 9.063 13.016 16.286
qe.cal (mg/g) 6.024 11.494 16.666 20.408
k1x10-2(min-1) 1.842 1.382 1.612 1.382
r 2 0.994 0.963 0.905 0.969
SSE 0.961 1.780 2.412 2.690
Pseudo second order kinetic model qe.cal (mg/g) 4.897 9.527 15.812 17.458
k2x10-3(g/mg.min) 3.387 1.187 0.788 0.659
r 2 0.994 0.994 0.995 0.997
SSE 0.605 1.212 2.175 1.902
Elovich model α (mg/g.min) 0.441 0.549 0.649 0.797
β(g/mg) 0.748 0.384 0.285 0.217
r 2 0.990 0.993 0.975 0.972
SSE 0.824 1.817 2.541 2.730
_________________________________________________________________________________________
Figure 5: Effect of temperature on percentage removal of CV
Evaluation of thermodynamic parameters
In order to understand the nature of adsorption, it is important to determine the thermodynamic parameters such as Gibb’s free energy change (∆G), enthalpy change (∆H) and entropy change (∆S). Based on fundamental thermodynamics concept, it is assumed that in an isolated system, energy can neither be gained nor lost and the entropy change is the only driving force. In environmental engineering practice, both energy and entropy factors

Theivarasu C et al /Int.J. ChemTech Res.2014,6(2),pp 1362-1376. 1368
must be considered in order to determine the spontaneity of the process. The Gibb’s free energy change (∆G) is the fundamental criterion of spontaneity. Reactions occur spontaneously at a given temperature, if (∆G) is negative. If the change in entropy ∆S is positive, the degree of disorder was increased by the adsorption reaction. Positive ∆H values suggested the endothermic nature of adsorption.
Gibb’s free energy change (∆G), change in enthalpy (∆H) and change in entropy (∆S) were determined from adsorption affinity parameter, Kc, which is the ratio of the amount of dye adsorbed per unit mass Cad to the equilibrium concentration Ce of the adsorbate. The value of Kc is obtained from the following equation.
Kc=qe/Ce (11)
where qe is the concentration of the dye in solid phase and Ce is the concentration of the dye in solution phase. The Gibb’s free energy change (∆G) is calculated as follows.
∆G=∆H-T∆S (12)
The equation can also be written as
lnKc=∆S/R-∆H/RT (13)
It was observed from the results that, ∆G values obtained were negative which confirmed that the adsorption of CV onto EDAC was spontaneous. The Van’t Hoff plot (lnKc versus 1/T) of CV is presented in figure 6 and the thermodynamic parameters evaluated are listed in Table 2. From the results it was found that the ∆G values decreased from -85.007 KJ/mol to -90.443 KJ/mol. This proved the spontaneity and feasibility of the adsorption process35. The positive values of ∆H (40.788 KJ/mol) confirmed the endothermic nature adsorption36. The positive values of ∆S (146.9 J/K/mol) proved the increased randomness at the solid solution interface during adsorption process37. When the dye molecules get adsorbed on the adsorbent surface, water molecules previously bonded to the surface get released and dispersed in the solution resulting in an increase in entropy. This is due to the reason that the previously adsorbed water molecules which are displaced by the adsorbate species, gain more transitional entropy than is lost by the adsorbate molecules thus allowing the prevalence of randomness in the system38.
The nature of adsorption, physisorption or chemisorptions can be found out by the values of Gibb’s free energy change ∆G. If the ∆G values are in between -20 to 0 KJ/mol, then the adsorption is physical in nature. For chemisorptions to occur, ∆G values should lie between -40 and -800 KJ/mol39. In this study the ∆G values of CV varied from - 85.007 to -90.443 KJ/mol indicating that CV adsorption onto EDAC took place by chemisorptiom mechanism.
Figure 6: Van’t Hoff plot
Theivarasu C et al /Int.J. ChemTech Res.2014,6(2),pp 1362-1376. 1369
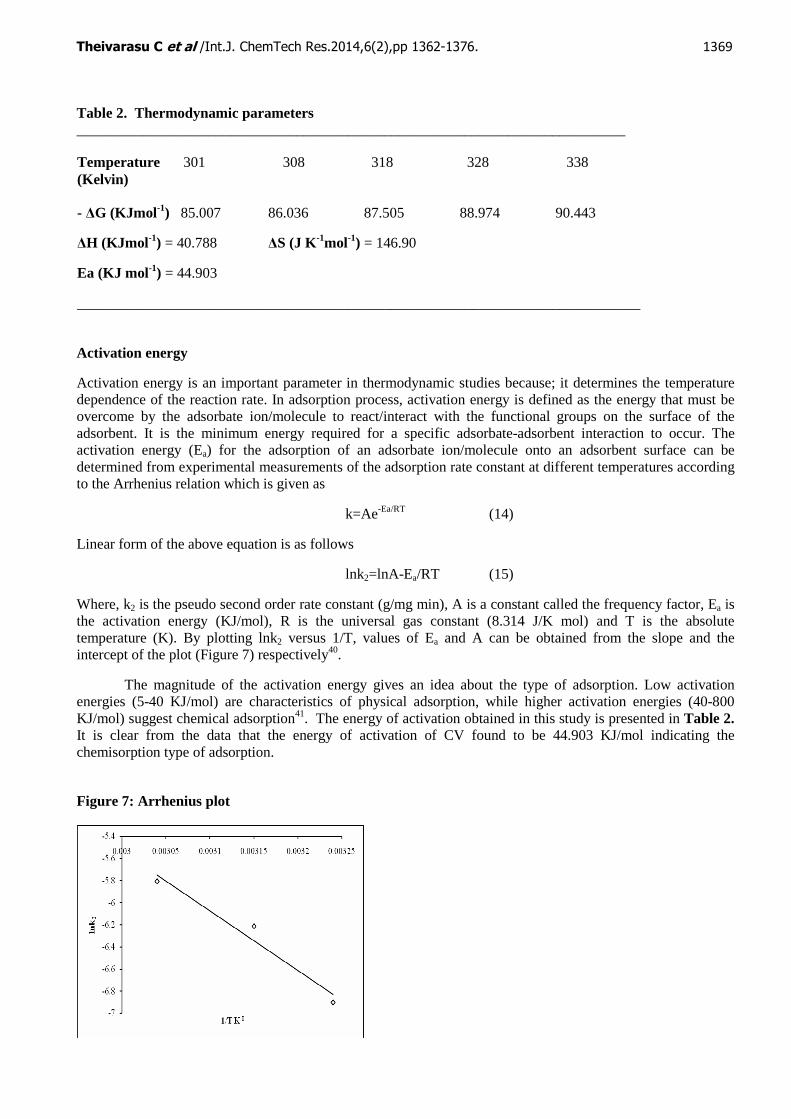
Table 2. Thermodynamic parameters ___________________________________________________________________________
Temperature 301 308 318 328 338 (Kelvin) - ∆G (KJmol -1) 85.007 86.036 87.505 88.974 90.443
∆H (KJmol -1) = 40.788 ∆S (J K-1mol-1) = 146.90
Ea (KJ mol-1) = 44.903
_____________________________________________________________________________
Activation energy
Activation energy is an important parameter in thermodynamic studies because; it determines the temperature dependence of the reaction rate. In adsorption process, activation energy is defined as the energy that must be overcome by the adsorbate ion/molecule to react/interact with the functional groups on the surface of the adsorbent. It is the minimum energy required for a specific adsorbate-adsorbent interaction to occur. The activation energy (Ea) for the adsorption of an adsorbate ion/molecule onto an adsorbent surface can be determined from experimental measurements of the adsorption rate constant at different temperatures according to the Arrhenius relation which is given as
k=Ae-Ea/RT (14)
Linear form of the above equation is as follows
lnk2=lnA-Ea/RT (15)
Where, k2 is the pseudo second order rate constant (g/mg min), A is a constant called the frequency factor, Ea is the activation energy (KJ/mol), R is the universal gas constant (8.314 J/K mol) and T is the absolute temperature (K). By plotting lnk2 versus 1/T, values of Ea and A can be obtained from the slope and the intercept of the plot (Figure 7) respectively40.
The magnitude of the activation energy gives an idea about the type of adsorption. Low activation energies (5-40 KJ/mol) are characteristics of physical adsorption, while higher activation energies (40-800 KJ/mol) suggest chemical adsorption41. The energy of activation obtained in this study is presented in Table 2. It is clear from the data that the energy of activation of CV found to be 44.903 KJ/mol indicating the chemisorption type of adsorption.
Figure 7: Arrhenius plot

Theivarasu C et al /Int.J. ChemTech Res.2014,6(2),pp 1362-1376. 1370
Mass transfer studies
It is important to predict the mechanism of adsorption for the designing of batch adsorber 42. The mechanism of adsorption of a sorbate on a sorbent follows a series of steps. The slowest of these steps controls the overall rate of the adsorption process. Generally, pore and intraparticle diffusion are often rate limiting in a batch reactor and film diffusion is more likely rate limiting in a continuous flow system43. In this study, both intra particle diffusion and liquid film diffusion models were studied.
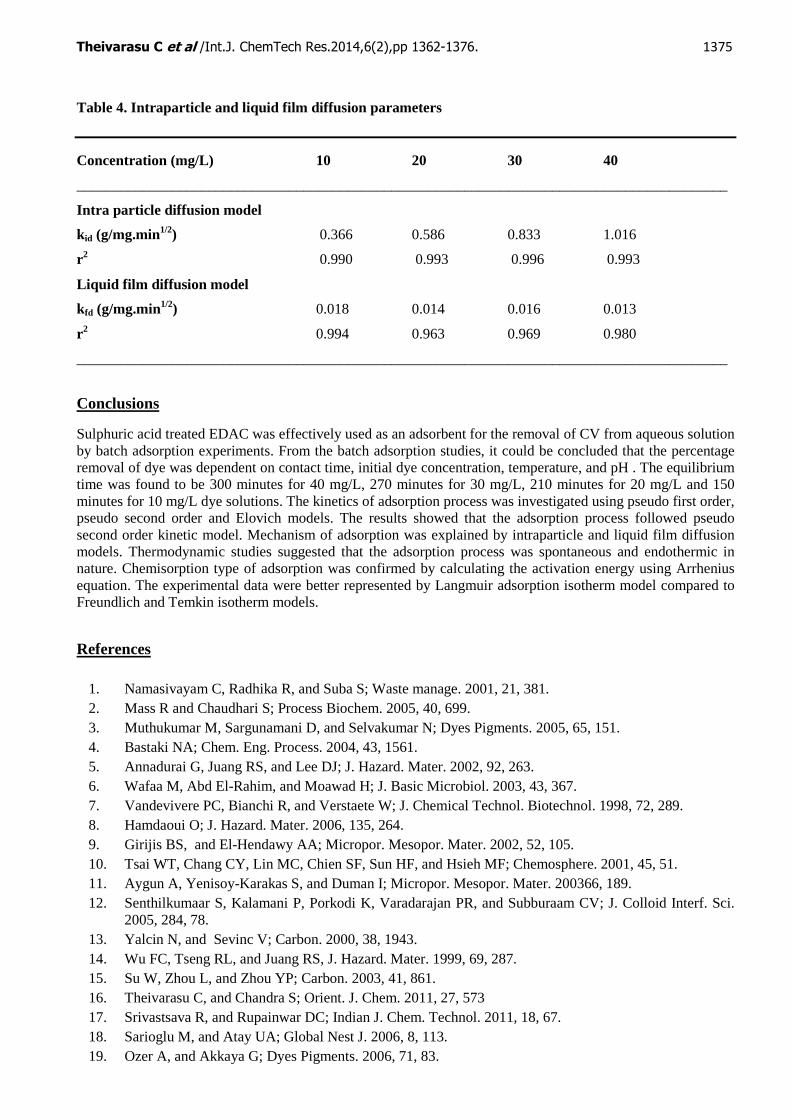
Intraparticle diffusion model
For a solid-liquid adsorption process, the transfer of solute is characterized by external mass transfer (boundary layer diffusion) or internal diffusion or both. However, the rate controlling parameter might be distributed between intraparticle and film diffusion mechanism. Whatever be the case, external diffusion will be involved in the sorption process. An intraparticle diffusion coefficient kid is given by the following equation44.
qt= kidt1/2+C (16)
The plot (qt versus t1/2) of intrapaticle diffusion of CV for different initial dye concentrations (10, 20, 30 and 40 mg/L) is shown in figure 8. The figure shows that there are three different stages of adsorption. The initial curved portion is due to the boundary layer diffusion (film diffusion), the second linear portion represents the intraparticle diffusion and the third portion is the equilibrium stage where intraparticle diffusion starts to slow down and there is no significant adsorption taking place. The slope of the second linear portion of the plot qt versus t1/2 has been defined to yield the intraparticle diffusion parameter Kid (mg/g/min1/2). On the other hand, intercept of the plot represents the boundary layer effect. The larger the intercept, greater the contribution of surface adsorption in the rate controlling step. The rate constants of intraparticle diffusion mechanism are found to increase with increase in concentration of the dyes. If the intraparticle diffusion is the only rate limiting step, then the lines would pass through the origin; if not, the boundary layer diffusion also controls the adsorption to some extent. It can be understood from the figures that the lines did not pass through the origin indicating that intraparticle diffusion was not the only rate limiting step45.
Figure 8: Intraparticle diffusion model
Figure 9: Liquid film diffusion model
Liquid film diffusion model
When the solute molecules transport from the liquid phase to the solid phase, boundary layer plays an important role in adsorption process46. The liquid film diffusion model is represented as follows.
ln(1-F) = kfdt (17)
Where, F is the fractional attainment of equilibrium and kfd is the liquid film diffusion rate constant (min-1). A linear plot of –ln(1-F) versus time, t would suggest that the kinetics of the adsorption process is controlled by diffusion through the liquid film surrounding the solid adsorbent47. The plot of film diffusion of CV for different initial dye concentrations (10, 20, 30 and 40 mg/L) is shown in figure 9. The values of kfd are calculated from the slopes of the respective linear lines of the plot. The intraparticle and liquid film diffusion
Theivarasu C et al /Int.J. ChemTech Res.2014,6(2),pp 1362-1376. 1371
parameters are presented in Table 3. It is suggested from the results that the adsorption process may also be controlled by liquid film diffusion. However, the intercept was not close to zero, indicating indubitable contribution to the rate from particle diffusion48.
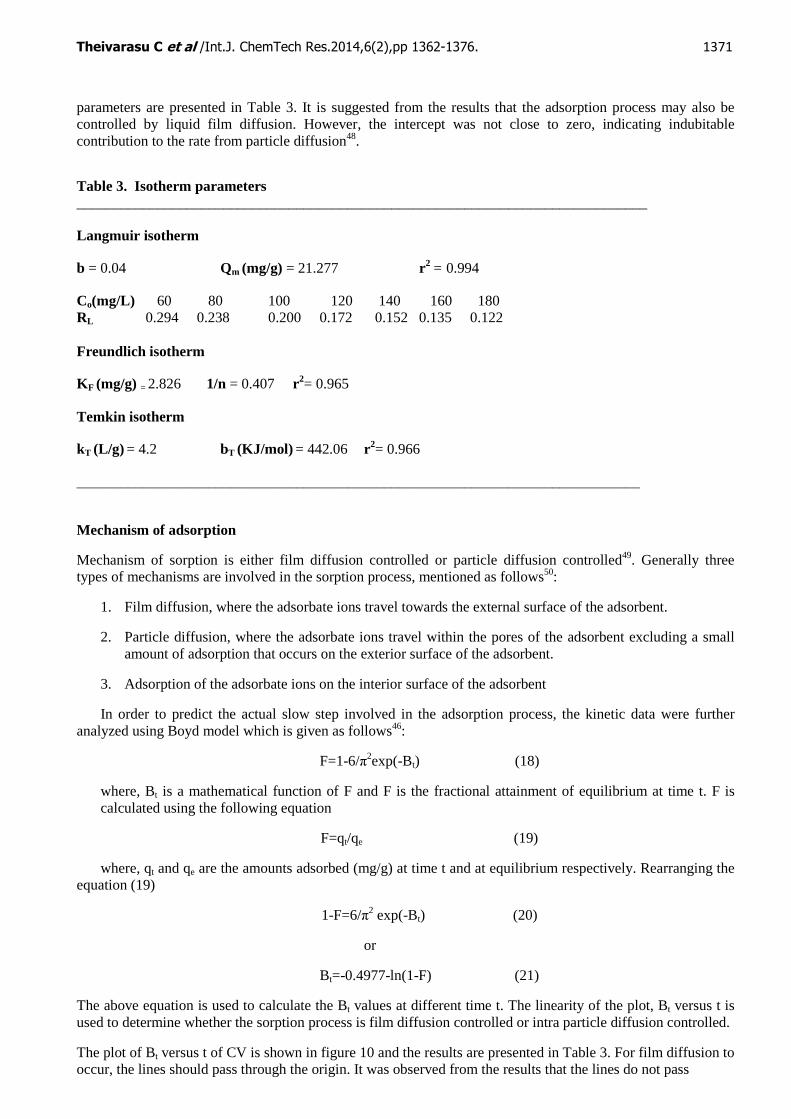
Table 3. Isotherm parameters ______________________________________________________________________________
Langmuir isotherm
b = 0.04 Qm (mg/g) = 21.277 r 2 = 0.994
Co(mg/L) 60 80 100 120 140 160 180 RL 0.294 0.238 0.200 0.172 0.152 0.135 0.122 Freundlich isotherm
K F (mg/g) = 2.826 1/n = 0.407 r 2= 0.965
Temkin isotherm
kT (L/g) = 4.2 bT (KJ/mol) = 442.06 r 2= 0.966
_____________________________________________________________________________
Mechanism of adsorption
Mechanism of sorption is either film diffusion controlled or particle diffusion controlled49. Generally three types of mechanisms are involved in the sorption process, mentioned as follows50:
1. Film diffusion, where the adsorbate ions travel towards the external surface of the adsorbent.
2. Particle diffusion, where the adsorbate ions travel within the pores of the adsorbent excluding a small amount of adsorption that occurs on the exterior surface of the adsorbent.
3. Adsorption of the adsorbate ions on the interior surface of the adsorbent
In order to predict the actual slow step involved in the adsorption process, the kinetic data were further analyzed using Boyd model which is given as follows46:
F=1-6/π2exp(-Bt) (18)
where, Bt is a mathematical function of F and F is the fractional attainment of equilibrium at time t. F is calculated using the following equation
F=qt/qe (19)
where, qt and qe are the amounts adsorbed (mg/g) at time t and at equilibrium respectively. Rearranging the equation (19)
1-F=6/π2 exp(-Bt) (20)
or
Bt=-0.4977-ln(1-F) (21)
The above equation is used to calculate the Bt values at different time t. The linearity of the plot, Bt versus t is used to determine whether the sorption process is film diffusion controlled or intra particle diffusion controlled.
The plot of Bt versus t of CV is shown in figure 10 and the results are presented in Table 3. For film diffusion to occur, the lines should pass through the origin. It was observed from the results that the lines do not pass

Theivarasu C et al /Int.J. ChemTech Res.2014,6(2),pp 1362-1376. 1372
through the origin indicating that film diffusion alone is not rate limiting. So it can be concluded that both intraparticle diffusion and film diffusion control the adsorption process. It can also be concluded that intraparticle diffusion has more control over the adsorption process due to the low linearity of the film diffusion model.
Figure 10: Boyd’s plot
Figure 11: Effect of pH
Effect of pH
It is important to study the effect of pH of EDAC on adsorption of dyes because pH is one of the key factors controlling the adsorption process. Activated carbon materials acquire different types of surface charges according to their functional groups present on the surface of the adsorbent. The interactions with H+ and OH- ions can show amphoteric properties of the carbon surface. Change of pH affects the adsorption process through dissociation of functional groups on the adsorbent surface active sites. This leads to a change in reaction kinetics and equilibrium characteristics of the adsorption process. Dissolution of basic dyes release colored dye cations into solution. Adsorption of these ions onto adsorbent surface is primarily influenced by the surface charge of the adsorbent, which in turn is influenced by the solution pH. Hence adsorption is mainly dependent on the nature of the dye species and surface charge on the adsorbent.
The percent removal of 40 mg/L solutions of CV (Figure 11) with 100 mg of adsorbent increases from 35.17 % to 80.09 % when pH is increased from 2-11. Maximum removal (80.09 %) took place at pH 7 and no significant change occurred above pH 7. It was understood from the results that higher percent removal of these dyes occurred at neutral and alkaline medium. Acidic solution pH did not favor the removal of CV. This could be due to the reason that at acidic pH, excess H+ ions compete with the cationic group of the dye for adsorption sites, thereby lowering the adsorption. As the pH is increased, the surface of the adsorbent becomes negatively charged, which enhances the adsorption of positively charged dye cations through electrostatic forces of attraction51.
Adsorption isotherm
Adsorption isotherm models are widely used to describe the adsorption progress and to investigate the mechanism of adsorption. The adsorption isotherm models are also fundamental in describing the interactive behavior between adsorbate and adsorbent. Analysis of isotherm data is important for predicting the adsorption capacity of the adsorbent, which is one of the main parameters required for the design of adsorption system. Isotherm models are also critical in optimizing the utility of the adsorbent52. Adsorption isotherm models clearly depict the relationship of amount adsorbed by unit weight of adsorbent with the concentration of adsorbent remaining in the medium at equilibrium. Thus, the correlation of equilibrium data using either a theoretical or empirical equation is essential for interpretation and prediction of the adsorption data. The correct interpretation of experimental adsorption isotherm can be realized in terms of mathematical equations called adsorption isotherm model equations. In this regard, various isotherm equations have been used to describe the equilibrium nature of adsorption. Some of these selected models to describe the equilibrium characteristics of adsorption of

Theivarasu C et al /Int.J. ChemTech Res.2014,6(2),pp 1362-1376. 1373
CV onto EDAC are Langmuir, Freundlich and Temkin and isotherm models. The applicability of the isotherm models to the adsorption study was judged by comparing the correlation co efficient, r2 values.
Langmuir isotherm
Langmuir isotherm has been widely used to describe the single solute system. Langmuir theory is based on an assumption that adsorption is a type of chemical combination or a process, and the adsorbed layer was unimolecular. The intermolecular forces decrease rapidly with distance and consequently predict monolayer coverage of the adsorbent53. This isotherm assumes that adsorption takes place at specific homogeneous sites within the adsorbent and there is no significant interaction among the adsorbed species. This model further assumes uniform energies of adsorbate in the plane of the surface54. Theoretically, the adsorbent has a finite capacity for the adsorbate. Once a dye molecule occupies a site, further adsorption cannot take place at that site suggesting monolayer coverage of dyes. This indicates that the adsorption occurs until a monolayer of adsorption and after the completion of adsorption no more interaction between the adsorbent and adsorbate molecules takes place55. The saturated monolayer capacity can be represented by the following expression.
qe=bLQ0Ce/1+Q0Ce (22)
The linear form of equation is given as
Ce/qe=1/ bLQ0 + Ce/Q0 (23)
Where, Ce is the equilibrium concentration of dye (mg/L), qe is the amount of dye adsorbed at equilibrium (mg/g), Q0 is Langmuir constant related to maximum adsorption capacity (mg/g), bL is Langmuir constant related to energy of adsorption (L/mg). The Langmuir constants Q0 and bL are calculated from the linear plot of Ce/qe versus Ce which is shown in figure 12. The value of adsorption capacity Q0 of CV is found to be 21.277 mg/g. The essential feature of Langmuir isotherm can be expressed in terms of a dimensionless separation factor (RL), given by the following equation
RL=1/(1+ bLC0) (24)
where, C0 is the initial dye concentration (mg/L). RL indicates the type of isotherm to be either unfavorable (RL>1), linear (RL=1), favorable (0<RL<1) or irreversible (RL=0). In this study, the RL values are found to lie between 0 and 1, hence suggesting a favorable adsorption of CV onto EDAC.
Freundlich isotherm
Freundlich isotherm describes equilibrium on heterogeneous surfaces and hence does not assume monolayer capacity56. Freundlich model is based on the assumption that adsorption occurs on a heterogeneous adsorption surface having unequally available sites with different energies of adsorption57. Freundlich adsorption isotherm was originally empirical in nature, but was later interpreted as the sorption to heterogeneous surfaces or surfaces supporting sites with varying affinities. Moreover, Freundlich adsorption isotherm model stipulates that the ratio of solute adsorbed to the solute concentration is a function of the solution. This model is used to explain the present adsorption phenomenon, is represented by the following equation.
qe = KF Ce1/n (25)
The linearised form of the above equation is expressed as follows:
lnqe = lnKF + 1/n lnCe (26)
where, KF is the Freundlich adsorption isotherm constant (1/g) related to the extent of adsorption and 1/n is related to the adsorption intensity, which varies with the heterogeneity of the material. The values of KF and 1/n are obtained from the intercept and slope of the plot (Figure 13) of logqe versus logCe. The strength of linear relationship can be expressed by the correlation coefficient, r2 values. This model exhibited slightly inferior correlation coefficient value than Langmuir model.
Theivarasu C et al /Int.J. ChemTech Res.2014,6(2),pp 1362-1376. 1374
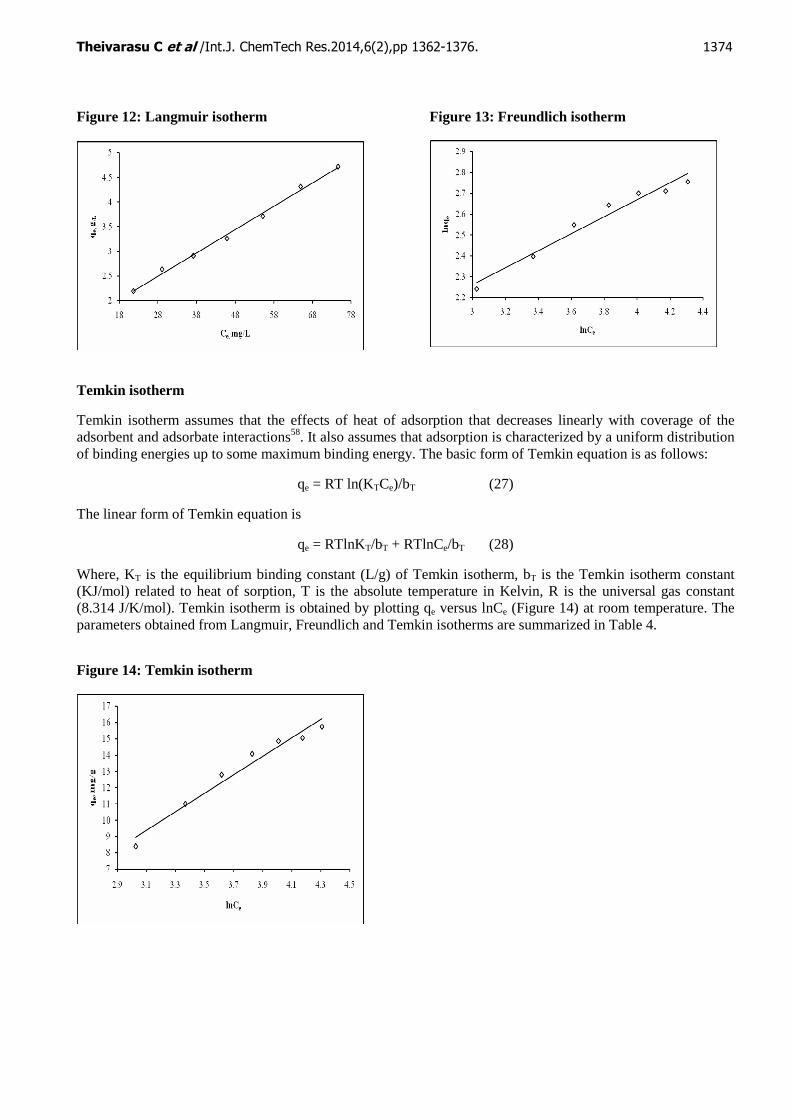
Figure 12: Langmuir isotherm
Figure 13: Freundlich isotherm
Temkin isotherm
Temkin isotherm assumes that the effects of heat of adsorption that decreases linearly with coverage of the adsorbent and adsorbate interactions58. It also assumes that adsorption is characterized by a uniform distribution of binding energies up to some maximum binding energy. The basic form of Temkin equation is as follows:
qe = RT ln(KTCe)/bT (27)
The linear form of Temkin equation is
qe = RTlnKT/bT + RTlnCe/bT (28)
Where, KT is the equilibrium binding constant (L/g) of Temkin isotherm, bT is the Temkin isotherm constant (KJ/mol) related to heat of sorption, T is the absolute temperature in Kelvin, R is the universal gas constant (8.314 J/K/mol). Temkin isotherm is obtained by plotting qe versus lnCe (Figure 14) at room temperature. The parameters obtained from Langmuir, Freundlich and Temkin isotherms are summarized in Table 4.
Figure 14: Temkin isotherm
Theivarasu C et al /Int.J. ChemTech Res.2014,6(2),pp 1362-1376. 1375
Table 4. Intraparticle and liquid film diffusion parameters
Concentration (mg/L) 10 20 30 40
_________________________________________________________________________________________
Intra particle diffusion model
k id (g/mg.min1/2) 0.366 0.586 0.833 1.016
r 2 0.990 0.993 0.996 0.993
Liquid film diffusion model
k fd (g/mg.min1/2) 0.018 0.014 0.016 0.013
r 2 0.994 0.963 0.969 0.980
_________________________________________________________________________________________
Conclusions
Sulphuric acid treated EDAC was effectively used as an adsorbent for the removal of CV from aqueous solution by batch adsorption experiments. From the batch adsorption studies, it could be concluded that the percentage removal of dye was dependent on contact time, initial dye concentration, temperature, and pH . The equilibrium time was found to be 300 minutes for 40 mg/L, 270 minutes for 30 mg/L, 210 minutes for 20 mg/L and 150 minutes for 10 mg/L dye solutions. The kinetics of adsorption process was investigated using pseudo first order, pseudo second order and Elovich models. The results showed that the adsorption process followed pseudo second order kinetic model. Mechanism of adsorption was explained by intraparticle and liquid film diffusion models. Thermodynamic studies suggested that the adsorption process was spontaneous and endothermic in nature. Chemisorption type of adsorption was confirmed by calculating the activation energy using Arrhenius equation. The experimental data were better represented by Langmuir adsorption isotherm model compared to Freundlich and Temkin isotherm models.
References
1. Namasivayam C, Radhika R, and Suba S; Waste manage. 2001, 21, 381. 2. Mass R and Chaudhari S; Process Biochem. 2005, 40, 699. 3. Muthukumar M, Sargunamani D, and Selvakumar N; Dyes Pigments. 2005, 65, 151. 4. Bastaki NA; Chem. Eng. Process. 2004, 43, 1561. 5. Annadurai G, Juang RS, and Lee DJ; J. Hazard. Mater. 2002, 92, 263. 6. Wafaa M, Abd El-Rahim, and Moawad H; J. Basic Microbiol. 2003, 43, 367. 7. Vandevivere PC, Bianchi R, and Verstaete W; J. Chemical Technol. Biotechnol. 1998, 72, 289. 8. Hamdaoui O; J. Hazard. Mater. 2006, 135, 264. 9. Girijis BS, and El-Hendawy AA; Micropor. Mesopor. Mater. 2002, 52, 105. 10. Tsai WT, Chang CY, Lin MC, Chien SF, Sun HF, and Hsieh MF; Chemosphere. 2001, 45, 51. 11. Aygun A, Yenisoy-Karakas S, and Duman I; Micropor. Mesopor. Mater. 200366, 189. 12. Senthilkumaar S, Kalamani P, Porkodi K, Varadarajan PR, and Subburaam CV; J. Colloid Interf. Sci.
2005, 284, 78. 13. Yalcin N, and Sevinc V; Carbon. 2000, 38, 1943. 14. Wu FC, Tseng RL, and Juang RS, J. Hazard. Mater. 1999, 69, 287. 15. Su W, Zhou L, and Zhou YP; Carbon. 2003, 41, 861. 16. Theivarasu C, and Chandra S; Orient. J. Chem. 2011, 27, 573 17. Srivastsava R, and Rupainwar DC; Indian J. Chem. Technol. 2011, 18, 67. 18. Sarioglu M, and Atay UA; Global Nest J. 2006, 8, 113. 19. Ozer A, and Akkaya G; Dyes Pigments. 2006, 71, 83.
Theivarasu C et al /Int.J. ChemTech Res.2014,6(2),pp 1362-1376. 1376
20. Namasivayam C, Muniasamy N, Gayatri K, Rani M, and Ranganathan K; Bioresour. Technol. 1996, 57, 37.
21. Ho YS, and McKay G; Water Res. 1999, 33, 578. 22. Lagergren S; Kungliga Svenska Vetenskapsakdemiens Handlingar. 1898, 24, 1. 23. Ho YS, McKay G; Water Res. 2000, 34, 735. 24. Perez-Marin AB, Zapata VM, Ortuno JF, Aguilar M, Saez J, and Lorens M; J. Hazard. Mater. B.
2007,139, 122. 25. Chien SH, Clayton WR; Soil Science Society of America Journal. 1980, 44, 265. 26. Idris S, Iyaka YA, Dauda BEN, Ndamitso MM, and Umar MT; American Chemical Science Journal.
2012, 2, 1 27. Hameed BH, Din ATM, Ahmad AL; J. Hazard. Mater. 2007, 141, 819. 28. Malik PK; J. Hazard. Mater. 2004,113, 81. 29. Namasivayam C, and Kavitha D; Dyes Pigments 2002, 54, 47. 30. Venkat S.Mane, Indra Deo Mall, and Vimal Chandra Srivastava; Dyes Pigments, 2007, 73, 269. 31. Vadivelan V, and Vasanthakumar K; J. Colloid Interf. Sci. 2005, 286, 90. 32. Chiou MS, and Li HY; Chemosphere. 2003, 50, 1095. 33. Sreelatha G, Ageetha V, Parmar J, and Padmaja P; J. Chem. Eng. Data. 2011, 56, 35. 34. Nicibi MC, Mahjoub B, and Seffen M; Int. J. Environ. Sci. Tech. 2007, 4, 433. 35. Crini G; Bioresour. Technol. 2006, 97, 1061. 36. Raffiea Baseri, Palanisamy PN, and Sivakumar P, International Journal of Chemistry Research. 2012, 3,
36. 37. Bhattacharya KG, and Sharma A; Dyes Pigments. 2005, 65, 51. 38. Namasivayam C, and Yamuna RT; Chemosphere. 1995, 30, 561. 39. Wu CH; J. Hazard. Mater. 2007, 144, 93. 40. El Katori EE, Fouda AS, and Al-Sarawy AA; Indian J. Chem. Technol. 2011, 18, 319. 41. Hardiljeet K. Boparai, Meera Joseph, Denis M. O’Carroll; J. Hazard. Mater. 2011, 186, 458. 42. Senthilkumaar S, Krishna SK, Kalamani P, Subburaam CV, and Ganapathi Subramaniam N; Modern
Applied Science. 2010, 4, 67. 43. Goswami S, and Ghosh UC; Water SA. 2005, 31, 597. 44. Weber WJ, and Morris JC; J. Sanit. Eng. Div. Am. Soc. Civ. Eng. 1963, 89, 31. 45. Vijayaragahvan K, Min Hee Han, Sun Boem Choi, and Yeoung-Sang Yun; Chemosphere. 2007, 68,
1838. 46. Boyd GE, Adamson AW, Meyers Jr. LS; J. Am. Chem. Soc. 1947, 69, 2836. 47. Xiong Chun-hua, Yao Cai-ping, and Wu Xiang-mei; [J], Hydrometallurgy. 2008, 90, 221. 48. Cortina JI, and Miralles N; Sol. Extract. Ion. Exch. 1997, 15, 1067. 49. Okieimen FE, and Orhorhoro F; Int. J. Environ. Anal. Chem. 1986, 24, 319. 50. Reichenberg D; J. Am. Chem. Soc. 1953, 75, 589. 51. Hameed BH, Mahmoud DK, and Ahmad AL; J. Hazard. Mater. 2008, 185, 65. 52. Wang S, Boyjoo Y, and Choueib A; Chemosphere. 2005, 60, 1401. 53. Nevine Kamal Amin; Desalination. 2008, 223, 152. 54. Monika J, Garg V, and Kadirvelu K; J. Hazard. Mater. 2009, 162, 365. 55. Li YJ, Gao BY, Wu T, Wang B, and Li X; J. Hazard. Mater. 2009, 164, 1098. 56. Freundlich HMF; J. Phys. Chem. A. 1906, 57, 385. 57. Colak F, Atar N, and Olgun A; Chem. Eng. J. 2009,150, 122. 58. Choy KKH, McKay G, and Porter JF; Resour. Conserv. Recycl. 1999, 27, 57.
*****