Performance of a SOA-MZI wavelength converter for label...
19
Optical Fiber Technology 10 (2004) 31–49 www.elsevier.com/locate/yofte Invited paper Performance of a SOA-MZI wavelength converter for label swapping using combined FSK/IM modulation format I. Tafur Monroy, a,∗ E.J.M. Verdurmen, a S. Sulur, a A.M.J. Koonen, a H. de Waardt, a G.D. Khoe, a N. Chi, b P.V. Holm-Nielsen, b J. Zhang, b and C. Peucheret b a Eindhoven University of Technology, Eindhoven, The Netherlands b COM, Technical University of Denmark, DK-2800 Kgs. Lyngby, Denmark Received 24 March 2003; revised 19 May 2003 Abstract This paper presents a theoretical and experimental assessment of the performance of a wavelength converter based on semiconductor optical amplifiers (SOA) in a MZI configuration for optical label swapping. The optical labeling of the signal is based on an FSK/IM combined modulation format for the header/payload, respectively. Experimental results are presented for a signaling scheme with payload data at 10 Gbit/s and an FSK label at 312 Mbit/s. Simulation results and measurements of the chirp properties of converted signals operating at data rates of 2.5 and 10 Gbit/s are presented. Conclusions and design guidelines are presented regarding the implications of the wavelength con- verter performance on the quality of the label and payload signals for fast packet/burst forwarding in optically labeled switched networks. 2003 Elsevier Inc. All rights reserved. Keywords: Optical networks; Frequency chirp; Label swapping; Wavelength converter; Packet switching; Burst switching; WDM; IP-over-WDM * Corresponding author. E-mail address: [email protected] (I.T. Monroy). 1068-5200/$ – see front matter 2003 Elsevier Inc. All rights reserved. doi:10.1016/j.yofte.2003.08.002
-
Upload
trinhxuyen -
Category
Documents
-
view
216 -
download
0
Transcript of Performance of a SOA-MZI wavelength converter for label...
r
velengthlabelormatme withof
.th con-
ding in
Burst
Optical Fiber Technology 10 (2004) 31–49
www.elsevier.com/locate/yofte
Invited paper
Performance of a SOA-MZI wavelength convertefor label swapping using combined FSK/IM
modulation format
I. Tafur Monroy,a,∗ E.J.M. Verdurmen,a S. Sulur,a A.M.J. Koonen,a
H. de Waardt,a G.D. Khoe,a N. Chi,b P.V. Holm-Nielsen,b
J. Zhang,b and C. Peucheretb
a Eindhoven University of Technology, Eindhoven, The Netherlandsb COM, Technical University of Denmark, DK-2800 Kgs. Lyngby, Denmark
Received 24 March 2003; revised 19 May 2003
Abstract
This paper presents a theoretical and experimental assessment of the performance of a waconverter based on semiconductor optical amplifiers (SOA) in a MZI configuration for opticalswapping. The optical labeling of the signal is based on an FSK/IM combined modulation ffor the header/payload, respectively. Experimental results are presented for a signaling schepayload data at 10 Gbit/s and an FSK label at 312 Mbit/s. Simulation results and measurementsthe chirp properties of converted signals operating at data rates of 2.5 and 10 Gbit/s are presentedConclusions and design guidelines are presented regarding the implications of the wavelengverter performance on the quality of the label and payload signals for fast packet/burst forwaroptically labeled switched networks. 2003 Elsevier Inc. All rights reserved.
Keywords: Optical networks; Frequency chirp; Label swapping; Wavelength converter; Packet switching;switching; WDM; IP-over-WDM
* Corresponding author.E-mail address: [email protected] (I.T. Monroy).
1068-5200/$ – see front matter 2003 Elsevier Inc. All rights reserved.doi:10.1016/j.yofte.2003.08.002
32 I.T. Monroy et al. / Optical Fiber Technology 10 (2004) 31–49
com-onsid-cketsore-LS)bling
lass ofe core
tency,ling to
ts. Oney somelabelelin-
ex thehere
a [8].ires adisper-y be aat hasectruminten-
Thisnode-MZI)ty forto theabits-resenceposedtion,e fre-er, wede andents
follows.g noderesultsn Sec-ailableor the
1. Introduction
Internet protocol (IP) traffic is expected to be the dominant traffic type in future telemunication networks. Labeled optical packet/burst switched (LOBS) networks are cered a promising solution for fast, flexible and reliable forwarding of IP bursts/paacross optical wavelength division multiplexing (WDM) transport networks [1–5]. Mover, LOBS are compatible with the general multi-protocol label switching (GMPcontrol mechanism [6]. In a LOBS network, bursts of data are composed by assemseveral IP packets in the ingress LOBS nodes according to their destination or cservice. To each burst a label, of a short, fixed length, is assigned and used by thnodes to forward the packet through the network. Therefore, IP/GMPLS is a low lalow overhead routing technique that simplifies packet forwarding and enables scaterabit rates.
Several techniques have been proposed to label optical packets or burst of packeof those is the so-called serial-bit technique, where the label precedes the payload btime guard [7]. A major disadvantage of this technique when used in LOBS is that theand payload information are closely coupled requiring time synchronization for label deation and extraction, and reinsertion of a new label. Another technique is to multipllabel information by using, for instance, a subcarrier multiplexing (SCM) scheme wlabeling information is carried on subcarrier frequency along with the payload datAlthough this out-of-band technique decouples payload and label information, it requbroad spectrum and may suffer from performance degradation due to crosstalk andsion. Furthermore, the scalability of the SCM approach to high bit-rate operation mahurdle. To lessen the above-mentioned drawbacks, the orthogonal modulation formbeen proposed to label optical packets/burst [9,10]. This technique has a compact spand is scalable to high bit-rates. The proposed orthogonal modulation formats aresity modulation (IM) for the payload and frequency shift keying (FSK) for the label.IM/FSK modulation scheme is well suited for label erasing and rewriting in a corecomposed of a semiconductor optical amplifier Mach–Zehnder interferometer (SOAwavelength converter. Moreover, the use of a SOA-MZI structure offers the possibiliintegration of a label swapping node in a single photonic circuit. One relevant issueperformance of the SOA-MZI based label swapping is its chirp performance. In gigper second long-distance direct detection optical telecommunication systems the pof wavelength chirp may limit the transmission distance and the bit rate. In the proFSK/IM labeling scheme, it also may impair the detection of the FSK label informain particular, if the chirp introduced by the label swapping process is larger than thquency deviation between the two frequency tones of the FSK signal. In this pappresent an assessment of the performance of a SOA-MZI based label swapper noits impact on the quality of an FSK/IM signal. Both simulation results and measuremare presented with emphasis on the chirp performance. This paper is organized asIn Section 2, the proposed label swapping scheme together with the label swappinarchitecture based on a SOA-MZI wavelength converter is presented. Simulationof the performance of the FSK/IM modulation scheme are presented in Section 3. Ition 4, experimental results are presented for the performance of a commercially avSOA-MZI converter. In Section 5, we discuss our results and present guidelines f

I.T. Monroy et al. / Optical Fiber Technology 10 (2004) 31–49 33
of IP
pay-on then canis suffi-opticalsignalmod-
ection
SOA-abellabel
omings of anehnderave-ata is
tuning
design of label swapping nodes supporting IM/FSK modulation format for labelingburst/packets. Finally, in Section 6, summary conclusions are drawn.
2. FSK/IM labeling scheme and SOA-MZI wavelength converter based labelswapping node
2.1. FSK/IM combined modulation scheme
The labeling process of the optical signal is illustrated in Fig. 1. The high-speedload data is transmitted using intensity modulation, while the label data is conveyedsame optical carrier by FSK modulation. At the receiver end the payload informatiobe detected by a simple direct detection scheme. Provided the FSK tone spacingciently large (e.g., a few tens of GHz), a direct detection scheme precoded by anbandpass filter can also be used for detection of the label. Such an optically labeledhas a compact spectrum. The feasibility of combined intensity modulation and angleulation has been shown in an experimental WDM network employing a coherent detscheme [11].
2.2. SOA-MZI wavelength converter label swapping node
Figure 2 shows the schematic diagram of a label-swapping node incorporating aMZI wavelength converter. A small part of the incoming optical power is fed to the lprocessing circuit. The label is detected and, with a look-up table operation, a newis defined. The new wavelength label is set by a tunable laser diode, and the incintensity-modulated payload data are transferred to this new wavelength by meaninterferometric wavelength converter based on cross-phase modulation in a Mach–Zinterferometer (MZI) structure with semiconductor optical amplifiers (SOAs). In the wlength conversion process, the old FSK information is erased while the payload dcopied onto the new wavelength. The new FSK label is inserted by frequency de
Fig. 1. Schematic diagram of a FSK/IM combined modulation scheme.
34 I.T. Monroy et al. / Optical Fiber Technology 10 (2004) 31–49
) with
in thees andsible.of the
ulatedd IM.used
lations
ualemu-crucialratio.it isf sev-
operh ther sensi-t errorforingle
prox-tween
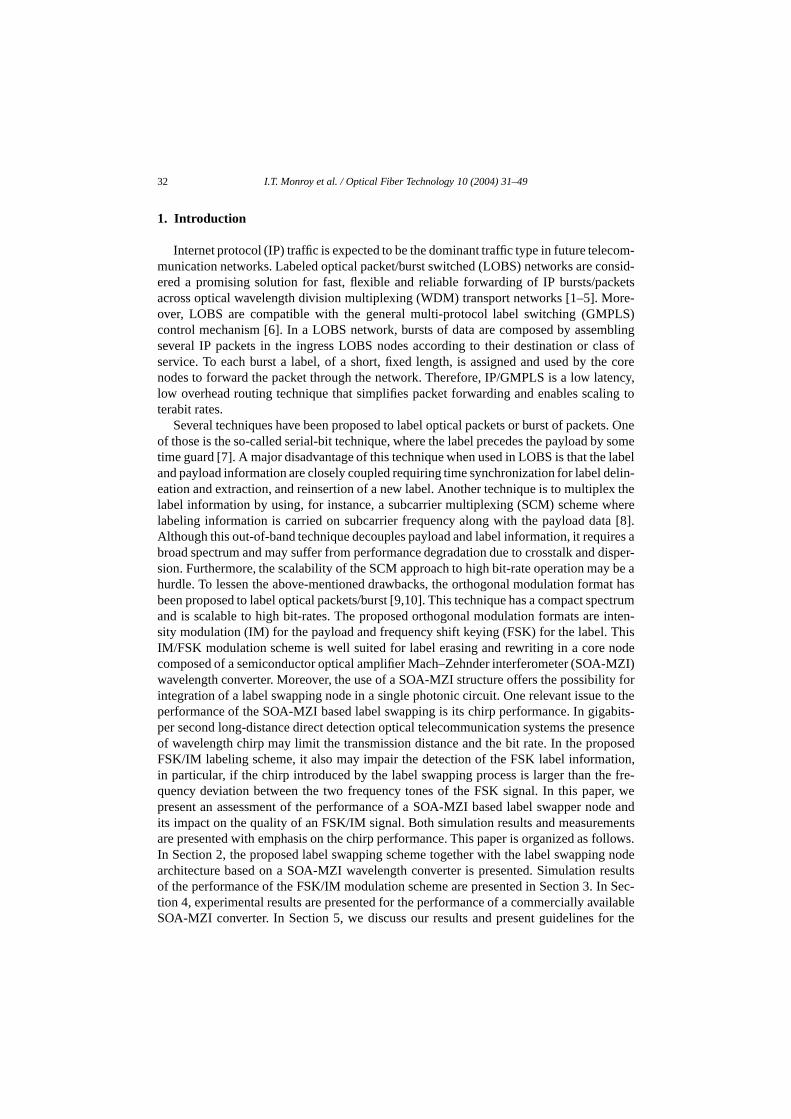
Fig. 2. Schematic diagram for orthogonal FSK/IM labeling in an all optical label swapping node (AOLSa SOA-MZI based wavelength converter.
of the incorporated tunable laser. In this way the label swapping is simplified andmeantime the wavelength conversion functionality can be used for routing purposcontention resolution. As an alternative to FSK labeling, DPSK labeling is also posHowever, it has been shown that DPSK imposes rigorous requirements on the valuelinewidth parameter of the tunable laser diode [12].
3. Simulation results
3.1. Combined modulation format FSK/IM
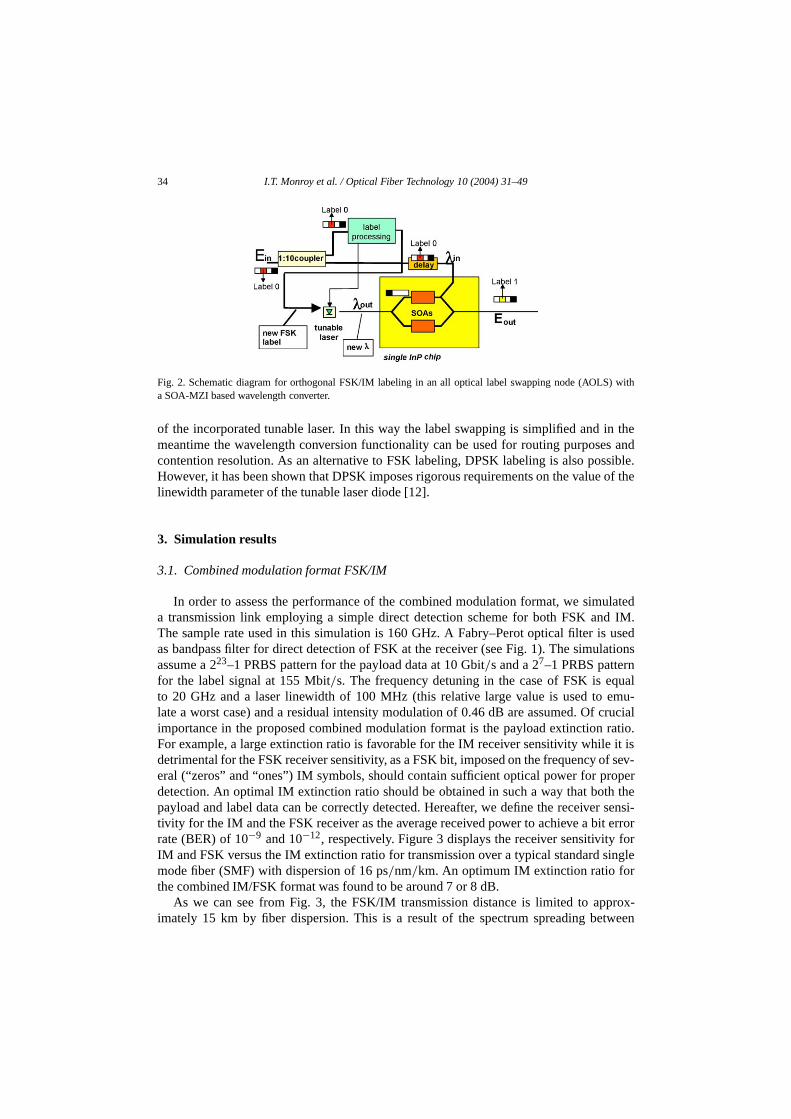
In order to assess the performance of the combined modulation format, we sima transmission link employing a simple direct detection scheme for both FSK anThe sample rate used in this simulation is 160 GHz. A Fabry–Perot optical filter isas bandpass filter for direct detection of FSK at the receiver (see Fig. 1). The simuassume a 223–1 PRBS pattern for the payload data at 10 Gbit/s and a 27–1 PRBS patternfor the label signal at 155 Mbit/s. The frequency detuning in the case of FSK is eqto 20 GHz and a laser linewidth of 100 MHz (this relative large value is used tolate a worst case) and a residual intensity modulation of 0.46 dB are assumed. Ofimportance in the proposed combined modulation format is the payload extinctionFor example, a large extinction ratio is favorable for the IM receiver sensitivity whiledetrimental for the FSK receiver sensitivity, as a FSK bit, imposed on the frequency oeral (“zeros” and “ones”) IM symbols, should contain sufficient optical power for prdetection. An optimal IM extinction ratio should be obtained in such a way that botpayload and label data can be correctly detected. Hereafter, we define the receivetivity for the IM and the FSK receiver as the average received power to achieve a birate (BER) of 10−9 and 10−12, respectively. Figure 3 displays the receiver sensitivityIM and FSK versus the IM extinction ratio for transmission over a typical standard smode fiber (SMF) with dispersion of 16 ps/nm/km. An optimum IM extinction ratio forthe combined IM/FSK format was found to be around 7 or 8 dB.
As we can see from Fig. 3, the FSK/IM transmission distance is limited to apimately 15 km by fiber dispersion. This is a result of the spectrum spreading be
I.T. Monroy et al. / Optical Fiber Technology 10 (2004) 31–49 35
r
ion af-
ersionn of
oyedF andis
msidualig. 4
t is ro-nk of
Fig. 3. Receiver sensitivity (IM at BER of 10−9 and FSK at BER 10−12) against payload extinction ratio fovarious SMF lengths.a = 10 km,b = 15 km,c = 18 km for IM andd = 10, 15, 18 km for FSK.
Fig. 4. Sensitivity (IM at BER of 10−9 and FSK at BER 10−12) as a function of IM extinction ratio at FSKfrequency deviation of 20 GHz for several values of laser linewidth and the residual amplitude modulatter a 60 km SMF dispersion compensated link (a = FSK: 50, 100 MHz; 0, 0.46, and 0.97 dB,b = IM: 50,100 MHz; 0 dB,c = IM: 50, 100 MHz; 0.46 dB,d = IM: 50, 100 MHz; 0.97 dB,e = overall: 50, 100 MHz;0 dB,f = overall: 50, 100 MHz; 0.46 dB,g = overall: 50, 100 MHz; 0.97 dB).
the FSK tones spaced at 20 GHz, which however can be overcome by using dispcompensating fiber (DCF). In Fig. 4 we show the receiver sensitivity as a functiothe payload extinction ratio for both IM payload and FSK label when DCF is emplto compensate for the dispersion of SMF. The dispersion at 1553.6 nm of the SMthe DCF is 16.9 and−100 ps/nm/km, respectively. The dispersion slope of the SMF0.0578 ps/nm2/km, and−0.23 ps/nm2/km for the DCF. We used 60 km SMF and 9.6 kDCF for complete dispersion compensation. The impact of laser linewidth and reamplitude modulation to the IM and FSK receiver sensitivities are also shown in Fwhere we can see that the performance of the IM/FSK combined modulation formabust to large values of the laser linewidth in the order of 100 MHz in a transmission li60 km of SMF with full dispersion compensation.

36 I.T. Monroy et al. / Optical Fiber Technology 10 (2004) 31–49
SK/IM
W.
Crossr soft-
owerTheold
e able
FSK
Fig. 5. Simulation scheme for the performance of the SOA-MZI based wavelength converter supporting Fmodulation format. OBPF: optical bandpass filter, LPF: low pass filter.
Fig. 6. Simulated FSK signal bit pattern (left) and eye diagram (right); the unit of the vertical axes is m
3.2. SOA-MZI based wavelength converter
To investigate the performance of the SOA-MZI wavelength converter based onPhase Modulation (XPM), we have performed simulations in VPI TransmissionMakeware.1 The schematic diagram of the simulations is shown in Fig. 5.
The simulated system operates at 10 Gbit/s for the payload and 155 Mbit/s for thelabel with a frequency deviation of 20 GHz. For the simulation we used a probe pof 0 dB m, and a laser linewidth of 10 MHz for the probe as well as pump signal.converted signal is filtered by an OBPF, with a bandwidth of 40 GHz, to filter out thewavelength. The OBPF for the FSK receiver has a bandwidth of 4 GHz, in order to bto select one of the frequency tones. The IM input signal had a modulation indexm = 0.8,which corresponds to an extinction ratio of 6 dB. An example of the simulated IM/signal at the transmitter output (signalEin in Fig. 5) is shown in Fig. 6.
1 Software tool of VPIsystems (www.vpisystems.com).

I.T. Monroy et al. / Optical Fiber Technology 10 (2004) 31–49 37
l.
ct hasvel ofelumberr for
clear,mance
al. Bylengtheragedon 4.3hirp isimu-tween 2is the
SOA-an be
Fig. 7. Simulation results for the chirp peaks (GHz) versus the extinction ratio (dB) of the input signa
We can clearly see the pattern dependence of the FSK signal in Fig. 6. This effealso been observed experimentally, as shown in Fig. 15. The variation of the one-lethe label is due to the payload bit stream at 10 Gbit/s. During the transmission of one labbit there are 64 payload bits sent on the same optical carrier. Depending on the nof “ones” in the 64 bit sequence of the payload, the power level is higher or lowethe simultaneously transmitted FSK-bit. This power dependence of a binary “one” canalso be clearly seen in the eye-diagram in Fig. 6. However the eye-opening is stillwhich means that the signal can be received error free. However an additional perforpenalty is expected due to the fluctuation of the “one” level.
3.3. Chirp performance
The presence of frequency chirp may degrade the performance of the IM/FSK signmeasuring the time-resolved chirp, detailed and reliable information about the waveconverter dynamics can be obtained. This is in contrast to measuring the time-avchirp, e.g., on a spectrum analyzer. The experimental results will be shown in Sectiwhile in this section the results of the simulations are presented. The simulated cshown in Fig. 7 for several values of the extinction ratio of the input signal. The slated chirp peaks are between 1 and 2 GHz, and the peak-to-peak values are beand 4 GHz. A difference between the simulations and the actual experimental workpolarization independence of the simulation models.
4. Experimental assessment
4.1. Experimental setup
The experimental results were obtained using an integrated all-active three-portMZI wavelength converter from Alcatel, shown in Fig. 8. The wavelength converter c
38 I.T. Monroy et al. / Optical Fiber Technology 10 (2004) 31–49
e. The
r.
sensi-9. Them.
hlengthrter are
10ured atop-or
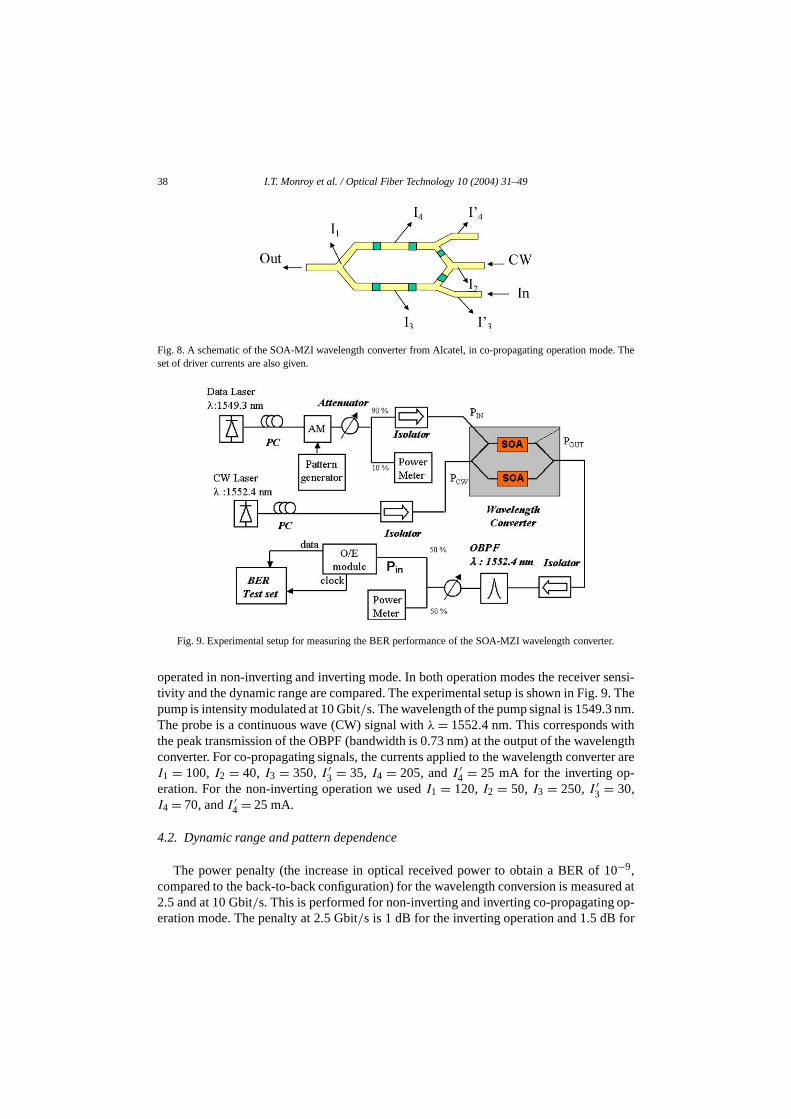
Fig. 8. A schematic of the SOA-MZI wavelength converter from Alcatel, in co-propagating operation modset of driver currents are also given.
Fig. 9. Experimental setup for measuring the BER performance of the SOA-MZI wavelength converte
operated in non-inverting and inverting mode. In both operation modes the receivertivity and the dynamic range are compared. The experimental setup is shown in Fig.pump is intensity modulated at 10 Gbit/s. The wavelength of the pump signal is 1549.3 nThe probe is a continuous wave (CW) signal withλ = 1552.4 nm. This corresponds witthe peak transmission of the OBPF (bandwidth is 0.73 nm) at the output of the waveconverter. For co-propagating signals, the currents applied to the wavelength conveI1 = 100, I2 = 40, I3 = 350, I ′
3 = 35, I4 = 205, andI ′4 = 25 mA for the inverting op-
eration. For the non-inverting operation we usedI1 = 120, I2 = 50, I3 = 250, I ′3 = 30,
I4 = 70, andI ′4 = 25 mA.
4.2. Dynamic range and pattern dependence
The power penalty (the increase in optical received power to obtain a BER of−9,compared to the back-to-back configuration) for the wavelength conversion is meas2.5 and at 10 Gbit/s. This is performed for non-inverting and inverting co-propagatingeration mode. The penalty at 2.5 Gbit/s is 1 dB for the inverting operation and 1.5 dB f
I.T. Monroy et al. / Optical Fiber Technology 10 (2004) 31–49 39
e duelimitswidth,evedng cur-Forting-backnalty,tivityengthHow-thatnon-
tio of
wave-power
nd in-ertingt. Theured tose for
asure-wernvert-givene best
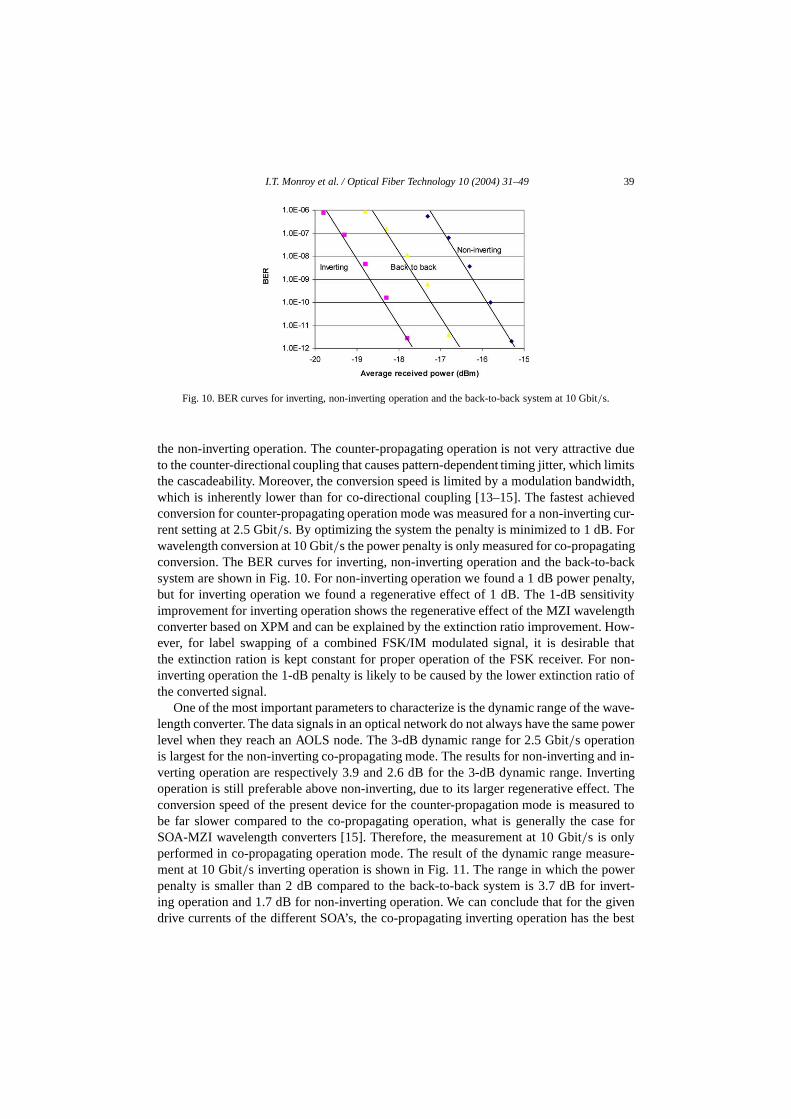
Fig. 10. BER curves for inverting, non-inverting operation and the back-to-back system at 10 Gbit/s.
the non-inverting operation. The counter-propagating operation is not very attractivto the counter-directional coupling that causes pattern-dependent timing jitter, whichthe cascadeability. Moreover, the conversion speed is limited by a modulation bandwhich is inherently lower than for co-directional coupling [13–15]. The fastest achiconversion for counter-propagating operation mode was measured for a non-invertirent setting at 2.5 Gbit/s. By optimizing the system the penalty is minimized to 1 dB.wavelength conversion at 10 Gbit/s the power penalty is only measured for co-propagaconversion. The BER curves for inverting, non-inverting operation and the back-tosystem are shown in Fig. 10. For non-inverting operation we found a 1 dB power pebut for inverting operation we found a regenerative effect of 1 dB. The 1-dB sensiimprovement for inverting operation shows the regenerative effect of the MZI wavelconverter based on XPM and can be explained by the extinction ratio improvement.ever, for label swapping of a combined FSK/IM modulated signal, it is desirablethe extinction ration is kept constant for proper operation of the FSK receiver. Forinverting operation the 1-dB penalty is likely to be caused by the lower extinction rathe converted signal.
One of the most important parameters to characterize is the dynamic range of thelength converter. The data signals in an optical network do not always have the samelevel when they reach an AOLS node. The 3-dB dynamic range for 2.5 Gbit/s operationis largest for the non-inverting co-propagating mode. The results for non-inverting averting operation are respectively 3.9 and 2.6 dB for the 3-dB dynamic range. Invoperation is still preferable above non-inverting, due to its larger regenerative effecconversion speed of the present device for the counter-propagation mode is measbe far slower compared to the co-propagating operation, what is generally the caSOA-MZI wavelength converters [15]. Therefore, the measurement at 10 Gbit/s is onlyperformed in co-propagating operation mode. The result of the dynamic range mement at 10 Gbit/s inverting operation is shown in Fig. 11. The range in which the popenalty is smaller than 2 dB compared to the back-to-back system is 3.7 dB for iing operation and 1.7 dB for non-inverting operation. We can conclude that for thedrive currents of the different SOA’s, the co-propagating inverting operation has th
40 I.T. Monroy et al. / Optical Fiber Technology 10 (2004) 31–49
egime
ic gain
thatchirpof theat,
enced on ablock
For theengthed toport
. The-peak,ter. Forg and
erved.ult of
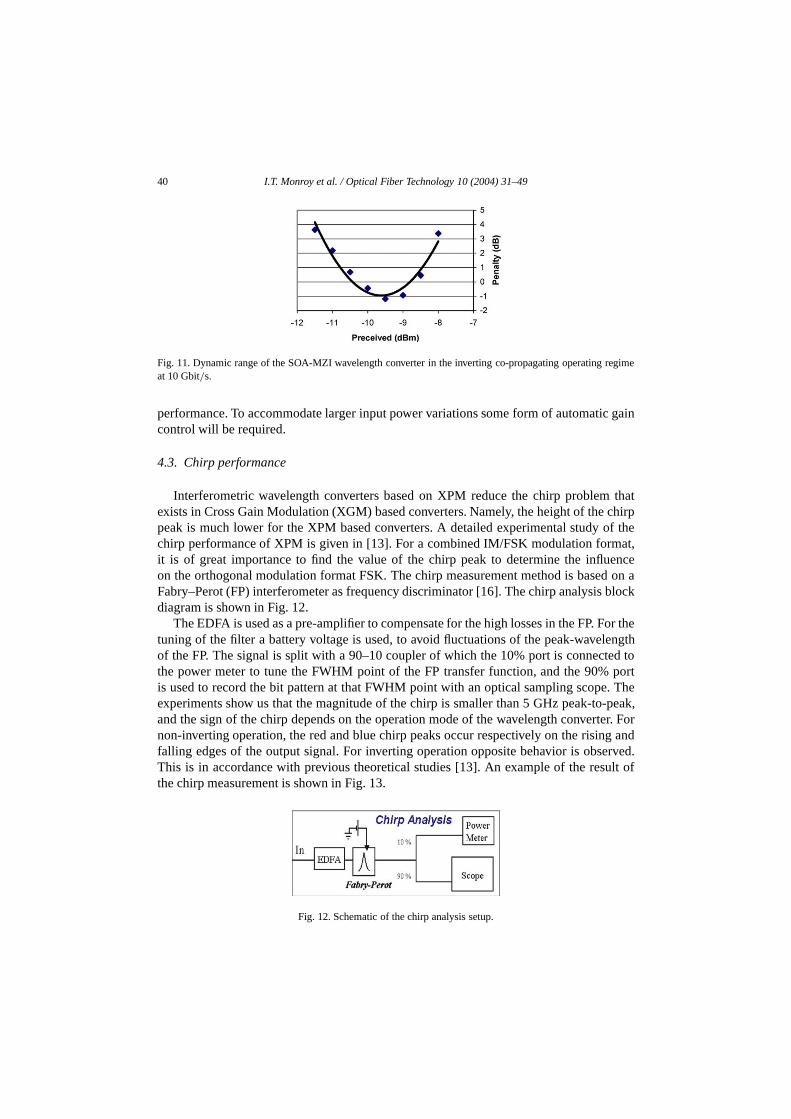
Fig. 11. Dynamic range of the SOA-MZI wavelength converter in the inverting co-propagating operating rat 10 Gbit/s.
performance. To accommodate larger input power variations some form of automatcontrol will be required.
4.3. Chirp performance
Interferometric wavelength converters based on XPM reduce the chirp problemexists in Cross Gain Modulation (XGM) based converters. Namely, the height of thepeak is much lower for the XPM based converters. A detailed experimental studychirp performance of XPM is given in [13]. For a combined IM/FSK modulation formit is of great importance to find the value of the chirp peak to determine the influon the orthogonal modulation format FSK. The chirp measurement method is baseFabry–Perot (FP) interferometer as frequency discriminator [16]. The chirp analysisdiagram is shown in Fig. 12.
The EDFA is used as a pre-amplifier to compensate for the high losses in the FP.tuning of the filter a battery voltage is used, to avoid fluctuations of the peak-wavelof the FP. The signal is split with a 90–10 coupler of which the 10% port is connectthe power meter to tune the FWHM point of the FP transfer function, and the 90%is used to record the bit pattern at that FWHM point with an optical sampling scopeexperiments show us that the magnitude of the chirp is smaller than 5 GHz peak-toand the sign of the chirp depends on the operation mode of the wavelength convernon-inverting operation, the red and blue chirp peaks occur respectively on the risinfalling edges of the output signal. For inverting operation opposite behavior is obsThis is in accordance with previous theoretical studies [13]. An example of the resthe chirp measurement is shown in Fig. 13.
Fig. 12. Schematic of the chirp analysis setup.
I.T. Monroy et al. / Optical Fiber Technology 10 (2004) 31–49 41
is tooied outasation,Thereth ofts weeen 3.5signalulateder. The
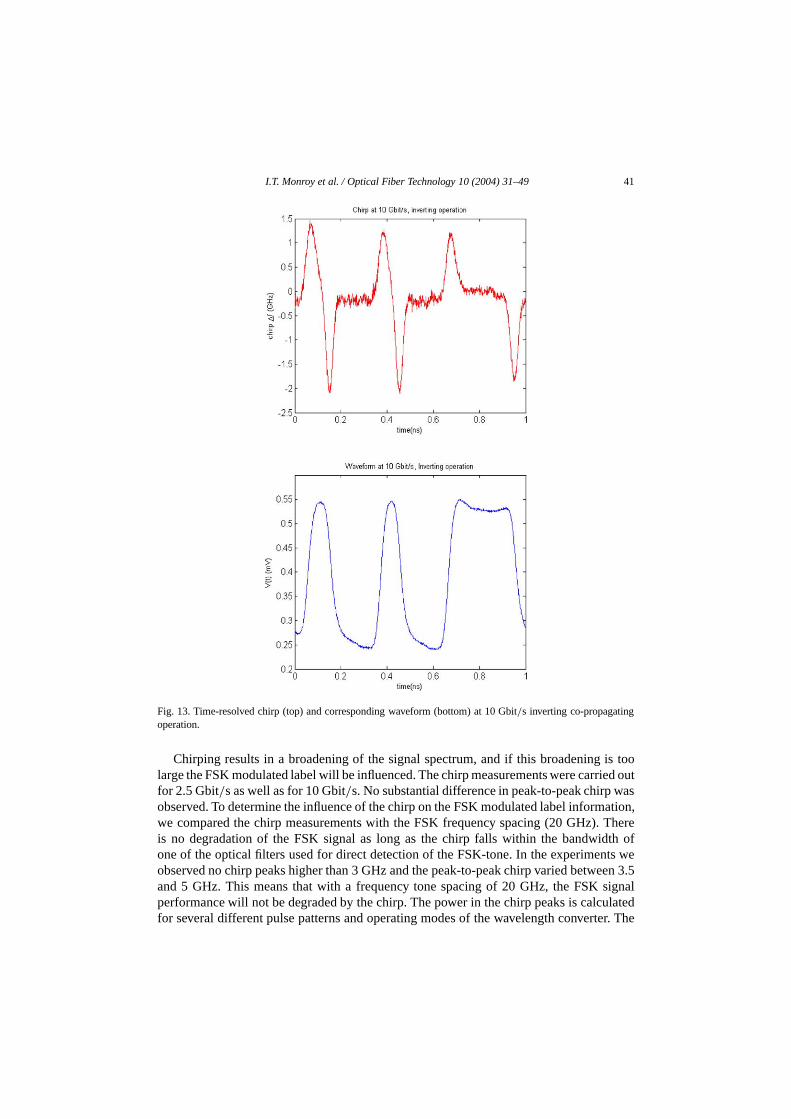
Fig. 13. Time-resolved chirp (top) and corresponding waveform (bottom) at 10 Gbit/s inverting co-propagatingoperation.
Chirping results in a broadening of the signal spectrum, and if this broadeninglarge the FSK modulated label will be influenced. The chirp measurements were carrfor 2.5 Gbit/s as well as for 10 Gbit/s. No substantial difference in peak-to-peak chirp wobserved. To determine the influence of the chirp on the FSK modulated label informwe compared the chirp measurements with the FSK frequency spacing (20 GHz).is no degradation of the FSK signal as long as the chirp falls within the bandwidone of the optical filters used for direct detection of the FSK-tone. In the experimenobserved no chirp peaks higher than 3 GHz and the peak-to-peak chirp varied betwand 5 GHz. This means that with a frequency tone spacing of 20 GHz, the FSKperformance will not be degraded by the chirp. The power in the chirp peaks is calcfor several different pulse patterns and operating modes of the wavelength convert
42 I.T. Monroy et al. / Optical Fiber Technology 10 (2004) 31–49
%,reof ae forearlier
stud-lmod-laserneousdula-ensityratedtage.
odu-o theavityed toI, the
on-ayloadctionreaseg the
ern ofe can
showsof the
ER ofves
a CWthe
posedwasFig. 16.
e
percentage of the power of the light wave with chirp peaks larger than|0.5| GHz is between30–50%. For chirp peaks larger than|1.0| GHz this percentage is in the range of 10–30while it is only 0–8% for chirp peaks large than|2.0| GHz. Chirp measurements wealso performed for a 2.5 Gbit/s data stream generated by direct current modulationDFB laser instead of using a low-chirp external modulator. No substantial differencthe chirp behavior was observed between these two cases. This is in accordance topublished results for a similar SOA-MZI device [17].
4.4. FSK/IM label swapping
The performance of the SOA-MZI based wavelength converter was experimentallyied for a payload rate at 10 Gbit/s and a FSK label rate at 312 Mbit/s. The experimentasetup for the label erasure and label insertion is depicted in Fig. 14. The optical FSKulation can be achieved simply by directly modulating the electrical current of a DFBdiode at 1549.3 nm. However, the drive current variation always results in a simultaintensity modulation of the emitted light. Obviously, such a residual intensity motion has a detrimental effect on the intensity-modulated payload. To remove the intvariation of the laser’s output, the inverse electrical data is injected into the integelectro-absorption modulator (EAM) with appropriate time delay and modulation volIn this way, a constant amplitude optical FSK signal is generated.
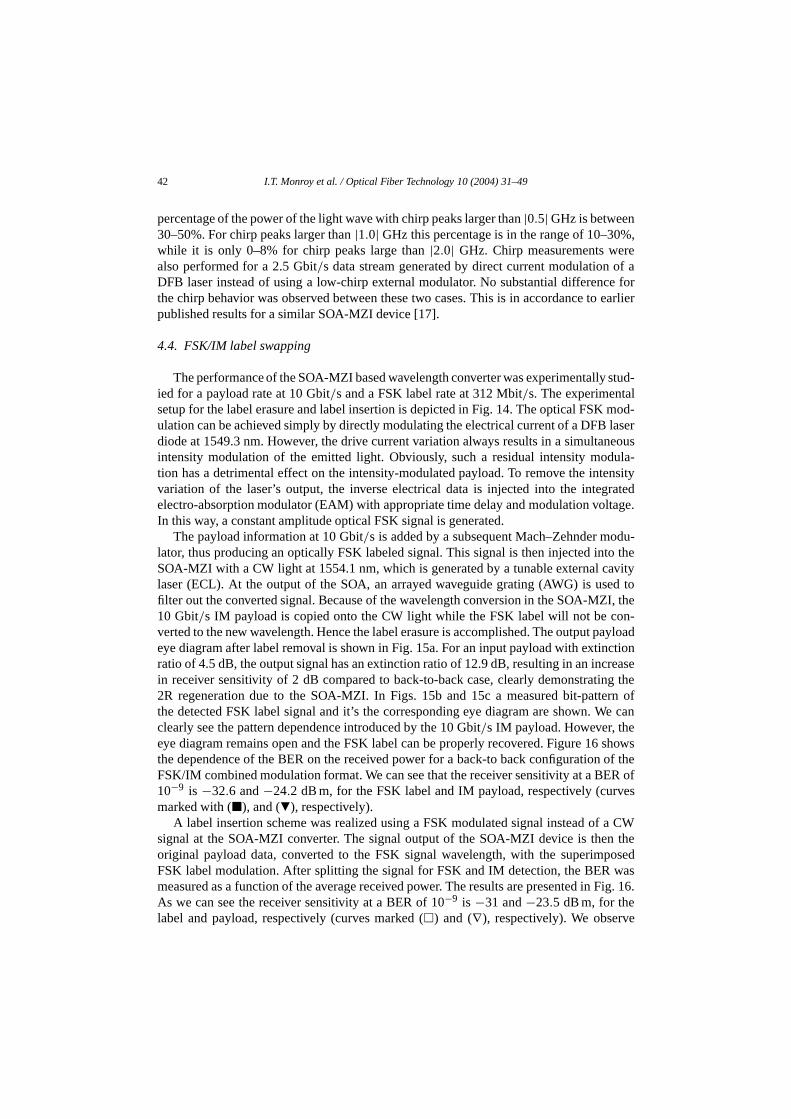
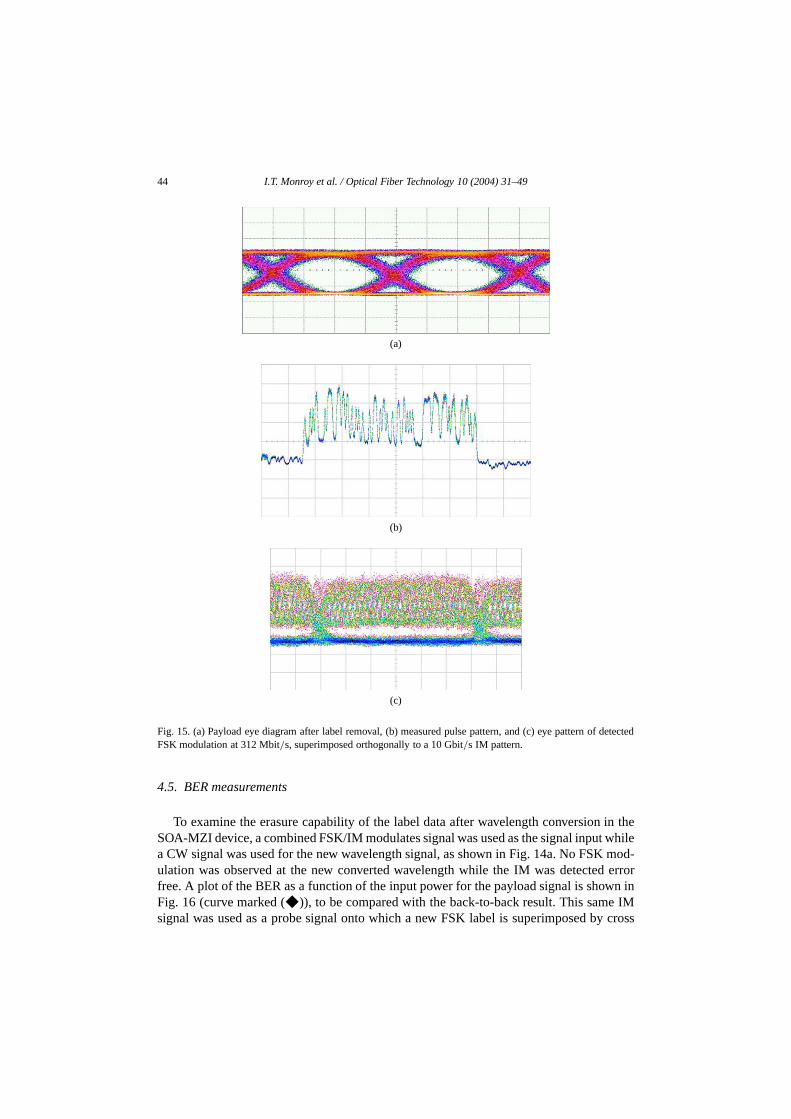
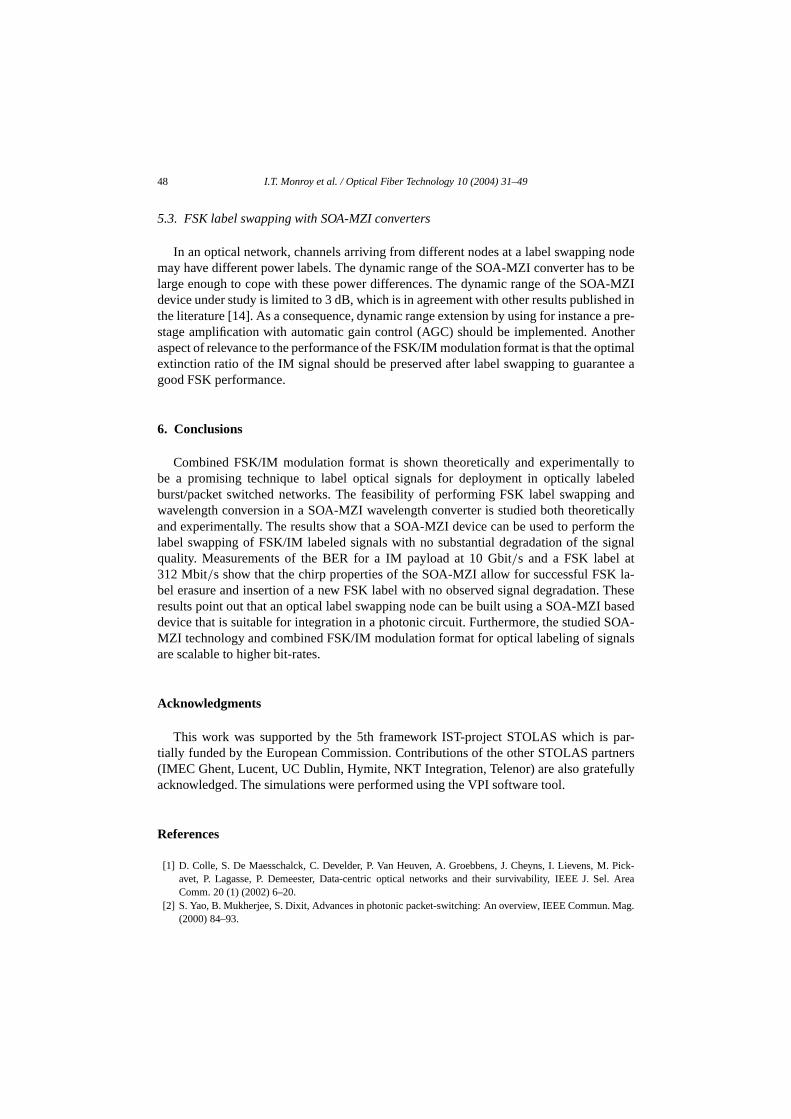
The payload information at 10 Gbit/s is added by a subsequent Mach–Zehnder mlator, thus producing an optically FSK labeled signal. This signal is then injected intSOA-MZI with a CW light at 1554.1 nm, which is generated by a tunable external claser (ECL). At the output of the SOA, an arrayed waveguide grating (AWG) is usfilter out the converted signal. Because of the wavelength conversion in the SOA-MZ10 Gbit/s IM payload is copied onto the CW light while the FSK label will not be cverted to the new wavelength. Hence the label erasure is accomplished. The output peye diagram after label removal is shown in Fig. 15a. For an input payload with extinratio of 4.5 dB, the output signal has an extinction ratio of 12.9 dB, resulting in an incin receiver sensitivity of 2 dB compared to back-to-back case, clearly demonstratin2R regeneration due to the SOA-MZI. In Figs. 15b and 15c a measured bit-pattthe detected FSK label signal and it’s the corresponding eye diagram are shown. Wclearly see the pattern dependence introduced by the 10 Gbit/s IM payload. However, theeye diagram remains open and the FSK label can be properly recovered. Figure 16the dependence of the BER on the received power for a back-to back configurationFSK/IM combined modulation format. We can see that the receiver sensitivity at a B10−9 is −32.6 and−24.2 dB m, for the FSK label and IM payload, respectively (curmarked with (2), and (a), respectively).
A label insertion scheme was realized using a FSK modulated signal instead ofsignal at the SOA-MZI converter. The signal output of the SOA-MZI device is thenoriginal payload data, converted to the FSK signal wavelength, with the superimFSK label modulation. After splitting the signal for FSK and IM detection, the BERmeasured as a function of the average received power. The results are presented inAs we can see the receiver sensitivity at a BER of 10−9 is −31 and−23.5 dB m, for thelabel and payload, respectively (curves marked (�) and (∇), respectively). We observ

I.T. Monroy et al. / Optical Fiber Technology 10 (2004) 31–49 43
nverter.
sertiontectionctionwas
xper-verter
(a)
(b)
Fig. 14. Experimental setups for FSK label (a) erasure and (b) insertion using a SOA-MZI wavelength coECL: external cavity laser, PM: power meter, PC: polarization controller.
that no substantial degradation of the receiver sensitivity takes place in the label inprocess. In fact, the SOA-MZI has a regenerative character. However, for a proper deof the FSK signal, a certain power level in the “zeros” bit should be present. The extinratio of the input signal was measured to be 5.1 dB and an extinction ratio of 4 dBobserved at the output of the SOA-MZI. The error free detection of the FSK data eimentally demonstrates that the chirp introduced by the SOA-MZI wavelength conhas no detrimental influence on the FSK detection.
44 I.T. Monroy et al. / Optical Fiber Technology 10 (2004) 31–49
detected
in thewhilemod-errorn inIM
y cross
(a)
(b)
(c)
Fig. 15. (a) Payload eye diagram after label removal, (b) measured pulse pattern, and (c) eye pattern ofFSK modulation at 312 Mbit/s, superimposed orthogonally to a 10 Gbit/s IM pattern.
4.5. BER measurements
To examine the erasure capability of the label data after wavelength conversionSOA-MZI device, a combined FSK/IM modulates signal was used as the signal inputa CW signal was used for the new wavelength signal, as shown in Fig. 14a. No FSKulation was observed at the new converted wavelength while the IM was detectedfree. A plot of the BER as a function of the input power for the payload signal is showFig. 16 (curve marked (F)), to be compared with the back-to-back result. This samesignal was used as a probe signal onto which a new FSK label is superimposed b

I.T. Monroy et al. / Optical Fiber Technology 10 (2004) 31–49 45
o-backtion
next
w FSKignaleconderter.evicenafterl setupd intothe
AM‘CW’
shed
e labelto-backnalty foreceivert there
ced byr freements
Fig. 16. BER versus receiver input power for the IM payload and the FSK label. (a) Label in the back-tconfiguration (2), (b) payload back-to-back (a), (c) payload after wavelength conversion and FSK label inser(e), (d) inserted FSK label (1), and (e) payload after label erasure (F).
absorption modulation (XAM) in EAM. This experiment is presented in detail in thesection.
4.6. FSK label swapping
The complete operation of label swapping (i.e., label erasure and insertion of a nelabel) can be performed with the SOA-MZI under study provided a second FSK sis available at a different wavelength than the old FSK label to be erased. This sFSK signal is then used instead of the CW input into the SOA-MZI wavelength convAlthough, a counter-propagation mode of operation could be used, the SOA-MZI dunder study shows insufficient performance for data rates above 5 Gbit/s, as discussed iSection 4.2. To study the chirp and linewidth properties of the IM converted signalFSK erasure, and to assess its suitability for FSK label re-insertion, the experimentashown in Fig. 17 was used. The output of the SOA-MZI wavelength converter was fean optical add drop multiplexer (OADM) to filter out the old wavelength signal. Thensignal is amplified and fed into an EAM where FSK label insertion took place by Xusing an FSK modulated pump signal. Experiments using a FSK pump signal at theport of the SOA-MZI (see Fig. 17) are under study and their results will be publielsewhere.
The results for the BER measurements for the FSK and IM signals after a completswapping stage are shown in Fig. 18. We can compare these results with the back-measurements presented in Fig. 16. As we can see, there is no substantial power peboth signals; instead we can observe a small regenerative effect of about 0.5 dB of rsensitivity enhancement. We may observe from the optical spectrum (see Fig. 19) thais no substantial spectrum broadening due to the label swapping. The chirp introduthe SOA-MZI has therefore no effect on the performance, as confirmed by the errodetection of the FSK signal. This is in accordance with the previous chirp measureand simulations results presented in Sections 3.3 and 4.3.

46 I.T. Monroy et al. / Optical Fiber Technology 10 (2004) 31–49
xer.
apping
/IMbols
hat an
Fig. 17. Setup for a complete label swapping of FSK/IM labeled signal. OADM: optical add drop multiple
Fig. 18. BER versus input power for a FSK/IM combined modulation scheme after a complete label swstage. The results are to be compared with the back-to-back curves of Fig. 16.
5. Discussion of results
5.1. FSK/IM modulation format
The extinction ratio of the IM is a crucial design parameter for a combined FSKsystem. Namely, there should be enough optical power in the IM “zero” binary symso that the FSK data still can be recovered. Experimentally, it has been shown t

I.T. Monroy et al. / Optical Fiber Technology 10 (2004) 31–49 47
output
t at
to theK bit
fectlyeffect ison may
ance,nfirm
(a) (b)
Fig. 19. (a) Optical spectra of the pure FSK signal and IM/FSK signal. (b) Received IM/FSK signal at theof the frequency discriminator.
Fig. 20. Example of a detected 10 Gbit/s IM bit pattern and eye diagram when the IM and the FSK bi312 Mbit/s are not perfectly synchronized.
extinction ratio (ER) of 4–5 dB gives proper performance. Another aspect relevantdesign of the combined modulation format is the synchronization between the FSand the IM bit. Figure 20 shows examples when the FSK and IM bits are not persynchronized. In this case the eye pattern is distorted and errors are detected. Thisaccumulative in the case of label swapping, as therefore the performance degradatibe severe.
5.2. Chirp performance
According to our experiments and simulations, for a system operating at 10 Gbit/s thechirp peaks introduced by the SOA-MZI are limited to a magnitude smaller than|3| GHz.Moreover, the signal power contents of these chirp frequency peaks larger than|2| GHz isless than 8% of the total optical power in a bit-time slot. This indicates that, for instFSK modulation with a frequency deviation of 10–20 GHz is feasible. Experiments cothat this is the case for a 312 Mb/s FSK signal with a frequency deviation of 20 GHz.
48 I.T. Monroy et al. / Optical Fiber Technology 10 (2004) 31–49
nodeto be-MZIed ina pre-
otherptimalntee a
ly toeledand
icallyrm theignaltla-
ThesebasedSOA-als
par-tnersully
. Pick-l. Area
Mag.
5.3. FSK label swapping with SOA-MZI converters
In an optical network, channels arriving from different nodes at a label swappingmay have different power labels. The dynamic range of the SOA-MZI converter haslarge enough to cope with these power differences. The dynamic range of the SOAdevice under study is limited to 3 dB, which is in agreement with other results publishthe literature [14]. As a consequence, dynamic range extension by using for instancestage amplification with automatic gain control (AGC) should be implemented. Anaspect of relevance to the performance of the FSK/IM modulation format is that the oextinction ratio of the IM signal should be preserved after label swapping to guaragood FSK performance.
6. Conclusions
Combined FSK/IM modulation format is shown theoretically and experimentalbe a promising technique to label optical signals for deployment in optically labburst/packet switched networks. The feasibility of performing FSK label swappingwavelength conversion in a SOA-MZI wavelength converter is studied both theoretand experimentally. The results show that a SOA-MZI device can be used to perfolabel swapping of FSK/IM labeled signals with no substantial degradation of the squality. Measurements of the BER for a IM payload at 10 Gbit/s and a FSK label a312 Mbit/s show that the chirp properties of the SOA-MZI allow for successful FSKbel erasure and insertion of a new FSK label with no observed signal degradation.results point out that an optical label swapping node can be built using a SOA-MZIdevice that is suitable for integration in a photonic circuit. Furthermore, the studiedMZI technology and combined FSK/IM modulation format for optical labeling of signare scalable to higher bit-rates.
Acknowledgments
This work was supported by the 5th framework IST-project STOLAS which istially funded by the European Commission. Contributions of the other STOLAS par(IMEC Ghent, Lucent, UC Dublin, Hymite, NKT Integration, Telenor) are also gratefacknowledged. The simulations were performed using the VPI software tool.
References
[1] D. Colle, S. De Maesschalck, C. Develder, P. Van Heuven, A. Groebbens, J. Cheyns, I. Lievens, Mavet, P. Lagasse, P. Demeester, Data-centric optical networks and their survivability, IEEE J. SeComm. 20 (1) (2002) 6–20.
[2] S. Yao, B. Mukherjee, S. Dixit, Advances in photonic packet-switching: An overview, IEEE Commun.(2000) 84–93.
I.T. Monroy et al. / Optical Fiber Technology 10 (2004) 31–49 49
ue on
rence,
104–
ment
ACTS
oshi,s and
-WDMr Th.L.
ization
ental
ing oftworks
ave-1213–
ersion
r
lation
A-MZI
[3] C. Qiao, M. Yoo, Optical burst switching (OBS)—a new paradigm for an optical internet, Special IssWDM Networks, J. High Speed Netw. 8 (1) (1999) 69–84.
[4] J.S. Turner, WDM burst switching for petabit data networks, in: Optical Fiber Communication ConfeVol. 2, 2000, pp. 47–49.
[5] C. Qiao, Labeled optical burst switching for IP-over-WDM integration, IEEE Commun. Mag. (2000)114.
[6] A. Banerjee, et al., Generalized multiprotocol label switching: An overview of routing and manageenhancements, IEEE Commun. Mag. (2001) 144–150.
[7] C. Guillemot, M. Renaud, P. Gambini, et al., Transparent optical packet switching: The EuropeanKEOPS project approach, J. Lightwave Technol. 16 (12) (1998) 2117–2134.
[8] D.J. Blumenthal, B.-E. Olsson, G. Rossi, T.E. Dimmick, L. Rau, M. Masanovic, O. Lavrova, R. DO. Jerphagnon, J.E. Bowers, V. Kaman, L.A. Coldren, J. Barton, All-optical label swapping networktechnologies, J. Lightwave Technol. 18 (12) (2000) 2058–2075.
[9] T. Koonen, G. Morthier, J. Jennen, H. de Waardt, P. Demeester, Optical packet routing in IP-overnetworks deploying two-level optical labeling, in: Proceedings of ECOC’01, Amsterdam, 2001, pape2.1.
[10] E.N. Lallas, N. Skarmoutsos, D. Syvridis, An optical FSK-based label coding technique for the realof the all-optical label swapping, IEEE Photon. Technol. Lett. 14 (10) (2002) 1472–1474.
[11] M. Hickey, L. Kazovsky, The STARNET coherent WDM computer communication network: Experimtransceiver employing a novel modulation format, J. Lightwave Technol. 12 (5) (1994) 876–884.
[12] A.M.J. Koonen, S. Sulur, I. Tafur Monroy, J.G.L. Jennen, H. de Waardt, Orthogonal optical labelpackets in IP-over-WDM networks, in: Proceedings of NOC 2002, 7th European Conference on Ne& Optical Communications, Darmstadt, Germany, 2002, pp. 82–89.
[13] H. Lee, H. Yoon, Y. Kom, J. Jeong, Theoretical study of frequency chirping and extinction ratio of wlength-converted optical signals by XGM and XPM using SOA’s, IEEE J. Quant. Electron. 35 (1999)1219.
[14] T. Durhuus, B. Mikkelsen, C. Joergensen, S.L. Danielsen, K.E. Stubkjaer, All-optical wavelength convby semiconductor optical amplifiers, J. Lightwave Technol. 14 (1996) 942–954.
[15] C. Joergensen, et al., All-optical wavelength conversion at bit rates above 10 Gb/s using semiconductooptical amplifiers, IEEE J. Sel. Top. Quant. 3 (5) (1997) 1168–1180.
[16] S. Tammela, H. Ludvigsen, T. Kajava, M. Kaivola, Characterization of the chirp and intensity moduproperties of an SOA-MZI wavelength converter, IEEE Photon. Technol. Lett. 9 (1997) 475–477.
[17] S.-C. Cao, J.C. Cartledge, Characterization of the chirp and intensity modulation properties of an SOwavelength converter, J. Lightwave Technol. 20 (4) (2002) 689–695.


![Programmable Silicon Photonic Optical Thresholder(MRR) and a coherent background pathway (MZI) [17], [18]. III. SIGNAL CONTRAST ENHANCEMENT EXPERIMENT AND RESULTS The experimental](https://static.fdocuments.us/doc/165x107/604e20b78adfe022a170ddad/programmable-silicon-photonic-optical-thresholder-mrr-and-a-coherent-background.jpg)