Performance of a Battery Electric Vehicle in the Cold...
37
A report by the University of Vermont Transportation Research Center Performance of a Battery Electric Vehicle in the Cold Climate and Hilly Terrain of Vermont Report # 08-002 | December 2008
Transcript of Performance of a Battery Electric Vehicle in the Cold...

A report by the University of Vermont Transportation Research Center
Performance of a Battery Electric Vehicle in the Cold Climate and Hilly Terrain of Vermont
Report # 08-002 | December 2008


UVM TRC Report # 08-002
i
Performance of a Battery Electric Vehicle in the Cold Climate and Hilly Terrain of Vermont-Final Report
Sponsoring Agency: UVM Transportation Research Center
December 23, 2008
Prepared by: Michael Cross
Keith Pelletier Walter Varhue University of Vermont School of Engineering Votey Hall 33 Colchester Avenue Burlington, VT 05405 Phone: (802) 656-0734
UVM TRC Report # 08-002
ii
i. Acknowledgements
The Project Team would like to thank the University of Vermont Transportation Research Center (TRC) and the Department of Transportation for funding. We thank Dr. Richard Watts of the TRC for assistance in various aspects of this project. We would also like to thank EVermont for providing the vehicle for this study and Mr. Stephen Miracle and Mr. Phil Girton for supporting the project throughout. The authors also thank Chase Pelletier, M.S. of EcoEnergy, LLC for GPS data analysis.
ii. Disclaimer The contents of this report reflect the views of the authors, who are responsible for the facts and the accuracy of the data presented herein. The contents do not necessarily reflect the official view or policies of the UVM Transportation Research Center. This report does not constitute a standard, specification, or regulation.
UVM TRC Report # 08-002
iii
Table of Contents
Acknowledgements & Disclaimer.............................................................................................................. ii List of Tables & Figures............................................................................................................................ iv 1. Introduction .............................................................................................................................................1 2. Research Methodology ............................................................................................................................2 2.1. Vehicle Description .................................................................................................................2 2.2. Data Collection ......................................................................................................................3 3. Results ....................................................................................................................................................5 3.1. Vehicle Performance ...............................................................................................................5 3.2. Battery Performance ...............................................................................................................5 3.3. Accessory Demand...................................................................................................................9 3.4. Electric Consumption..............................................................................................................9 4. Implementation/Tech Transfer.............................................................................................................10 5. Conclusions ............................................................................................................................................11 Appendix A - TRB Paper...........................................................................................................................12 Appendix B - PHEV Emissions Study......................................................................................................24
UVM TRC Report # 08-002
iv
List of Tables Table 3-1. Current demand from accessories in EVermont built Toyota Echo BEV.……… ...................9
List of Figures Figure 1-1. 2005 Toyota Echo BEV built by EVermont ............................................................................1 Figure 2-1. Elevation route data collected with the on-board GPS unit ..................................................3 Figure 2-2. Elevation profile for 22 mile commute from Monkton, VT to Burlington, VT......................4 Figure 3-1. Influence of internal battery temperature on vehicle range .................................................6 Figure 3-2. Influence of ambient air temperature on vehicle range.........................................................6 Figure 3-3. Comparison of vehicle range while using electric heat or kerosene heat .............................7 Figure 3-4. Available drive current during a commute from Burlington, VT to Monkton, VT...............8 Figure 3-5. Regenerative braking system effectiveness of the EVermont BEV ......................................8

UVM TRC Report # 08-002
1
1. Introduction
The goal of this research project was to determine the performance of a battery electric vehicle (BEV) in the cold climate and hilly terrain of Vermont. For this study, a 2005 Toyota Echo was converted from an internal combustion engine (ICE) vehicle to a BEV by EVermont and leased to the University of Vermont (UVM) for testing. A picture of the vehicle is shown below in Figure 1-1.
Figure 1-1. 2005 Toyota Echo sedan which was converted from an ICE to a BEV by EVermont. The vehicle in this study contains a new battery technology, called Zebra. The new battery system is a molten salt battery, which requires that the battery be operated at an elevated temperature of approximately 295 oC. These batteries offer both high energy and high power densities which are well suited for use in electric vehicles. If the temperature of the battery is allowed to drop below this temperature range, a lengthy start-up procedure taking a couple of days may be required. To avoid this, the car is designed with the battery in a well insulated enclosure that maintains its high temperature for several days. In addition to the insulation, the vehicle remains plugged in while not in use to keep the batteries warm.
UVM TRC Report # 08-002
2
2. Research Methodology
2.1. Vehicle Description
In 2003, EVermont’s board of directors approved a plan to design and assemble prototype electric vehicles using Federal Transit Administration funds that were awarded to EVermont for alternative transportation research. The EVermont project team’s design parameters included a comfortable sedan that could transport four commuters from their homes to a place of public transit, while at the same time accounting for the possibility of an 80 mile commute range. At the time, battery choices were limited and due to EVermont’s prior difficulties with thermal management issues, a battery with a self-contained thermal management system was desired. The selection of the Zebra battery satisfied this requirement and promised good energy density and long cycle life. One of the shortcomings of this battery is that it is “soft” in nature, which leads to a substantial voltage (power) drop when current is drawn from the battery.
The next component selected was the vehicle to convert. The first choice was to find a vehicle that would accommodate one large battery in the center of the vehicle under the floor. Such a vehicle was not able to be found. After learning that the Zebra battery could be obtained in two smaller modules, EVermont chose a 2005 Toyota Echo 4 door sedan for this project. This vehicle was relatively small but very comfortable and had correctly shaped compartments in the front and rear for battery placement. From the factory, this vehicle had a 1.5 L, 108 hp, 4 cylinder engine, with a curb weight of 2086 lbs. Weight and balance was closely studied throughout the design and build process. This vehicle does not have air conditioning, power windows, or power locks. The EPA mileage specifications for the base vehicle are 38 mpg highway and 30 mpg city (normalized to 2008 EPA testing practices). This vehicle has a five passenger seating capacity with ample interior space for a sub-compact car.
An Azure Dynamics drive system was chosen due to its robust AT-1200 gearbox coupled to the efficient AC-24 3 phase induction motor. This system also includes the Azure Digital Motor Controller/Inverter. The Zebra batteries were strapped in parallel and provided the digital motor controller (DMOC) with 285 volts and up to 120 amps. Azure Dynamics developed software so that a Mototron computer device could be incorporated into the system. This Mototron communicates with the Zebra Battery Management Interface via a common area network (CAN) bus and also provides precharge control for the DMOC. In addition it supplies the speedometer with a calibrated signal, controls the brake lights during regenerative braking, and powers up the Azure DC-DC converters once the battery initialization routine is completed. An electric power steering pump from a Toyota MR-2 was adapted for use in this vehicle and was powered with a Curtis pulse width modulated controller thus providing variable power assist. Two hydronic heaters were installed, one burning kerosene and the other electric giving the operator a choice of fuels for heat.This section should detail the research approach and methods of data collection and analysis.

UVM TRC Report # 08-002
3
2.2. Data Collection The day-to-day drivability, overall vehicle and battery performance, and electrical consumption were evaluated. A Campbell Scientific CR10 data logger was programmed to record the following data:
• Date and time • Drive current (Watt-hour while charging) • Battery heater current • Battery volts • Vehicle speed
In addition to this data, the Zebra Battery Management Interface (BMI) displays (but does not save in memory) the following data, which were recorded in a log book:
• Battery volts • Battery current • Battery temperature • State of charge • Charge current • Amp-hours used
Data was collected for both commuting and city travel. Commute data primarily consisted of a route from Monkton, VT (05469) to the University of Vermont in Burlington, VT (05405). The route consisted of non-highway roads covering a distance of approximately 22 miles, with an average speed of 35 mph. City data consisted of stop-and-go travel in Chittenden County VT, with an average distance of 9 miles and an average vehicle speed of 15 mph. A GeoStats GPS data logger was used to collect route data. An elevation view of the typical commute and city routes is shown in Figure 2-1.
Figure 2-1. Elevation route data collected with the on-board GPS unit. The commute route began in Monkton, VT (Addison County) and ended near Burlington, VT (Chittenden County). City data was collected for trips in Chittenden County.
UVM TRC Report # 08-002
4
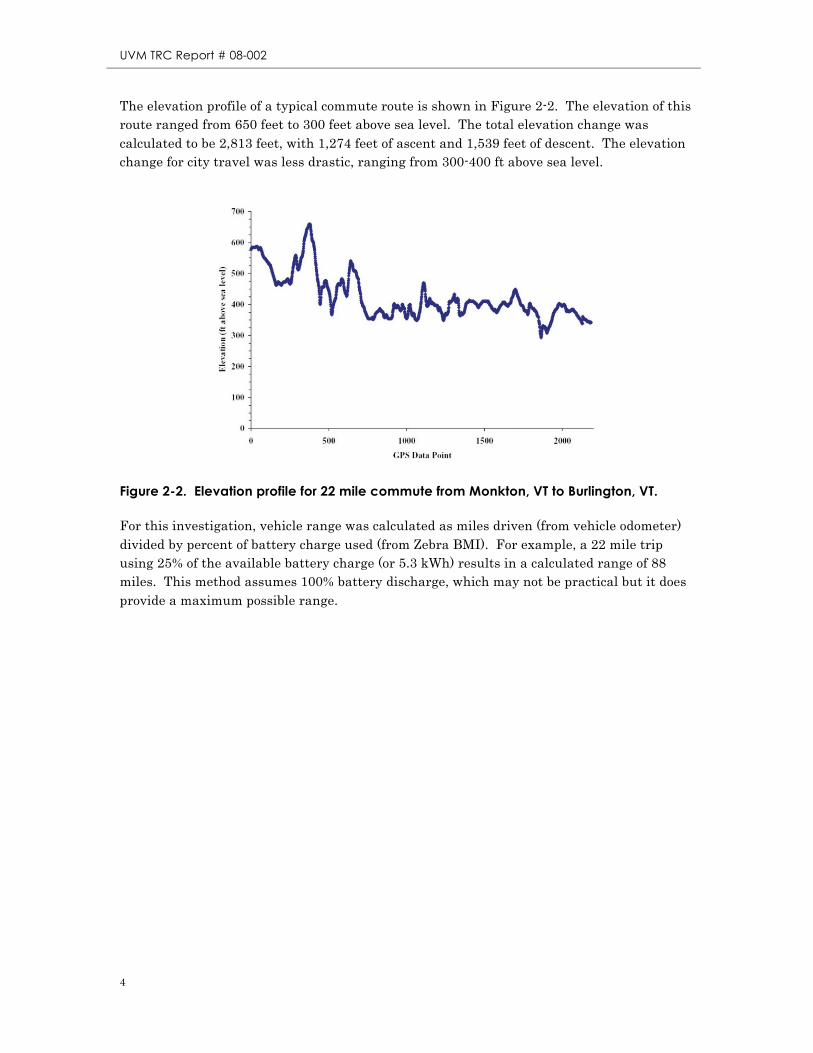
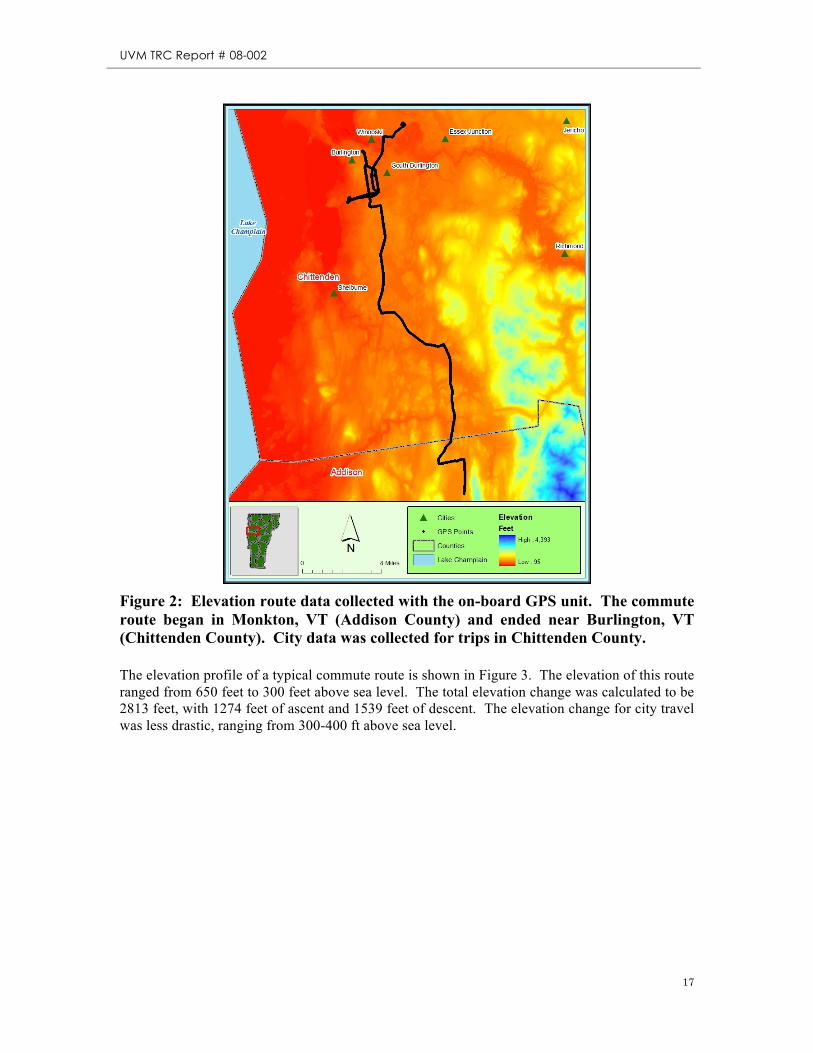
The elevation profile of a typical commute route is shown in Figure 2-2. The elevation of this route ranged from 650 feet to 300 feet above sea level. The total elevation change was calculated to be 2,813 feet, with 1,274 feet of ascent and 1,539 feet of descent. The elevation change for city travel was less drastic, ranging from 300-400 ft above sea level.
Figure 2-2. Elevation profile for 22 mile commute from Monkton, VT to Burlington, VT.
For this investigation, vehicle range was calculated as miles driven (from vehicle odometer) divided by percent of battery charge used (from Zebra BMI). For example, a 22 mile trip using 25% of the available battery charge (or 5.3 kWh) results in a calculated range of 88 miles. This method assumes 100% battery discharge, which may not be practical but it does provide a maximum possible range.

UVM TRC Report # 08-002
5
3. Results
3.1. Vehicle Performance
Overall, this vehicle has performed well during this investigation. A few minor issues occurred, but they were quickly corrected by EVermont. A list of minor issues encountered includes:
• Data logger/PC communication issues. Data acquisition software could not communicate with Windows XP operating system. A PC with Windows 95 solved this issue.
• Front battery heater cable became lose, causing the batteries to not charge. The cable was reattached and the vehicle is now performing as expected.
• Front battery cooling fan failed due to road salt contamination. The fan unit was replaced and the vehicle is now performing as expected.
• Occasional 50% power loss. Issue has been attributed to a failed/failing cell in one of the batteries. This battery is an early example received by EVermont.
The “occasional” 50% power loss turned into a major issue during the 10th month of this study. The battery located in the engine bay failed due to a large number of failed cells. EVermont corrected this issue, but the vehicle was out of commission for approximately one month. This was due to the fact that the casing around the new batch of batteries received by EVermont was approximately ¾” bigger than the existing batteries. Unfortunately, this meant that the batteries would not fit between the strut towers in the engine bay. To get around this issue, EVermont removed the battery from the rear of the vehicle and placed it in the engine bay. The new battery was installed into the trunk.
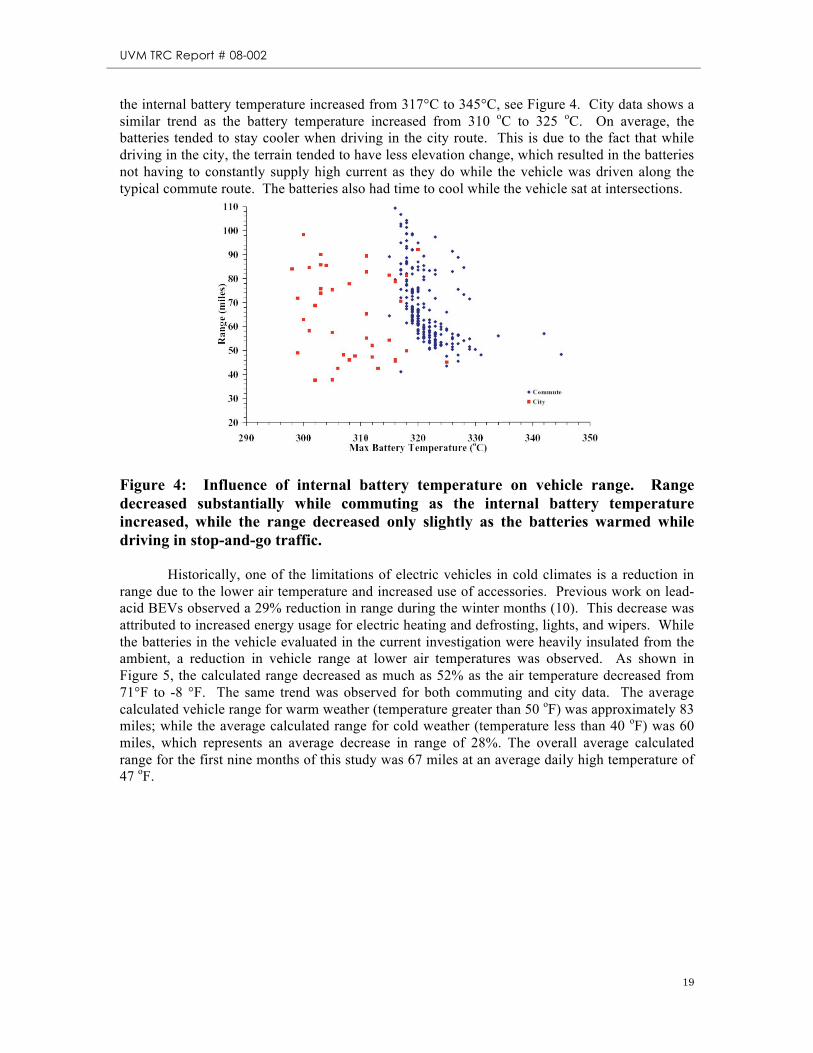
3.2. Battery Performance During this study, it was determined that battery efficiency is significantly affected by higher internal battery temperatures. While commuting, the vehicle range decreased by 56% as the internal battery temperature increased from 317°C to 345°C, see Figure 3-1. City data shows a similar trend as the battery temperature increased from 310 oC to 325 oC. On average, the batteries tended to stay cooler when driving in the city route. This is due to the fact that while driving in the city, the terrain tended to have less elevation change, which resulted in the batteries not having to constantly supply high current as they do while the vehicle was driven along the typical commute route. The batteries also had time to cool while the vehicle sat at intersections.

UVM TRC Report # 08-002
6
Figure 3-1. Influence of internal battery temperature on vehicle range. Range decreased substantially while commuting as the internal battery temperature increased, while the range decreased only slightly as the batteries warmed while driving in stop-and-go traffic.
Historically, one of the limitations of electric vehicles in cold climates is a reduction in range due to the lower air temperature and increased use of accessories. While the batteries in the vehicle evaluated in this study were heavily insulated from the ambient, a reduction in vehicle range at lower air temperatures was observed. As shown in Figure 3-2, the calculated range decreased as much as 52% as the air temperature decreased from 71°F to -8 °F. The same trend was observed for both commuting and city data. The average calculated vehicle range for warm weather (temperature greater than 50 oF) was approximately 83 miles; while the average calculated range for cold weather (temperature less than 40 oF) was 60 miles, which represents an average decrease in range of 28%. The overall average calculated range for this study was 71 miles at an average daily high temperature of 49 oF.
Figure 3-2. Influence of ambient air temperature on vehicle range. Range decreased substantially as air temperature decreased.
UVM TRC Report # 08-002
7
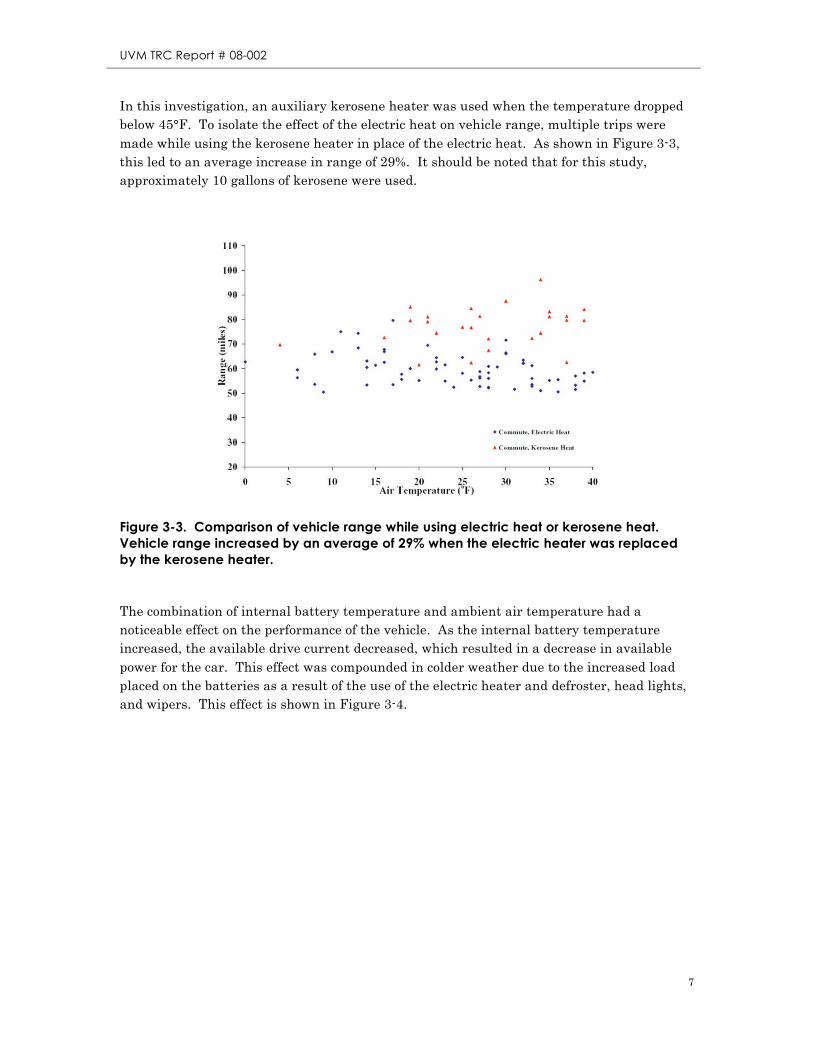
In this investigation, an auxiliary kerosene heater was used when the temperature dropped below 45°F. To isolate the effect of the electric heat on vehicle range, multiple trips were made while using the kerosene heater in place of the electric heat. As shown in Figure 3-3, this led to an average increase in range of 29%. It should be noted that for this study, approximately 10 gallons of kerosene were used.
Figure 3-3. Comparison of vehicle range while using electric heat or kerosene heat. Vehicle range increased by an average of 29% when the electric heater was replaced by the kerosene heater.
The combination of internal battery temperature and ambient air temperature had a noticeable effect on the performance of the vehicle. As the internal battery temperature increased, the available drive current decreased, which resulted in a decrease in available power for the car. This effect was compounded in colder weather due to the increased load placed on the batteries as a result of the use of the electric heater and defroster, head lights, and wipers. This effect is shown in Figure 3-4.
UVM TRC Report # 08-002
8
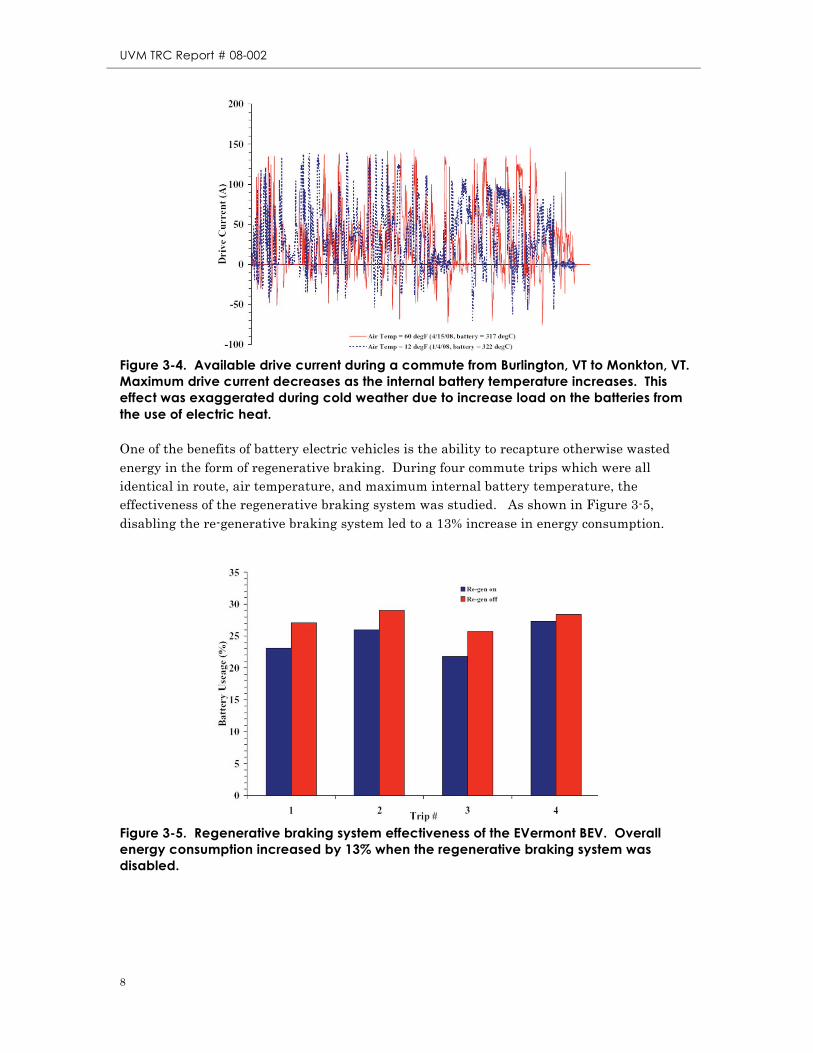
Figure 3-4. Available drive current during a commute from Burlington, VT to Monkton, VT. Maximum drive current decreases as the internal battery temperature increases. This effect was exaggerated during cold weather due to increase load on the batteries from the use of electric heat.
One of the benefits of battery electric vehicles is the ability to recapture otherwise wasted energy in the form of regenerative braking. During four commute trips which were all identical in route, air temperature, and maximum internal battery temperature, the effectiveness of the regenerative braking system was studied. As shown in Figure 3-5, disabling the re-generative braking system led to a 13% increase in energy consumption.
Figure 3-5. Regenerative braking system effectiveness of the EVermont BEV. Overall energy consumption increased by 13% when the regenerative braking system was disabled.

UVM TRC Report # 08-002
9
3.3. Accessory Demand To obtain a clear understanding of the impact that the accessories had on power consumption, the current draw of individual accessories was recorded, see Table 1. These values are also shown as the percentage of the average drive current, assumed to be 30A.
Table 3-1. Current demand from accessories in EVermont built Toyota Echo BEV.
Accessory Current (A) % of Average Drive Current Background Electronics 0.5 1.7 Parking Lights 0.2 0.7 Head Lights 0.6 2.0 Radio 0.0 0.0 Power Steering-Max 1.8 6.0 Power Steering-Typical 0.3 1.0 Blower-Speed 1 0.2 0.7 Blower-Speed 2 0.3 1.0 Blower-Speed 3 0.5 1.7 Blower-Speed Hi 0.8 2.7 Rear Defroster 0.9 3.0 Kerosene Heater 0.1 0.3 Electric Heater 10.7 36
Clearly, the largest impact on power demand resulted from the use of the electric heater. This directly correlates with the observed decrease in vehicle range while the electric heater was used during the cold months of this investigation (see Figure 3-2 above).
3.4. Electric Consumption In order to calculate the electric cost of this vehicle, a Watt-hour meter was used to measure the amount of energy required to recharge the batteries after a commute and then keep them warm once fully charged. At a rate of 0.12 $/kWh, a daily round-trip commute distance of 48 miles (12,500 miles annually), and a plug-in time of 23 hours per day, we calculate an operating cost of 0.055 $/mile for the BEV in this study. This value is comprised of two values: the cost of recharging the batteries after a commute and the cost of continually warming the batteries while not operating the vehicle. The batteries were recharged at a rate 0.24 kWh per % battery capacity, with an average daily usage of 72%. This equates to 0.043 $/mile. Keeping the batteries warm consumed 0.2 kW, which equates to a daily energy usage of 4.6 kWh. This equates to 0.012 $/mile. For comparison purposes, a gas powered Toyota Echo with a combined fuel economy of 33 mpg and an average fuel price of $2.00/gallon would cost 0.067 $/mile (including the cost of oil changes ($20) every 5000 miles), which represents a 22% increase over the BEV Echo in this study.

UVM TRC Report # 08-002
10
4. Implementation/Tech Transfer
From EVermont’s perspective, the results of this design/build effort were mixed. The goals of assembling a vehicle with an 80 mile range, capable of highway speeds, and comfortable seating for four were achieved. Vehicle weight was kept low enhancing the ride and handling performance. EVermont’s major disappointment with this vehicle has been the battery. By nature, it is a relatively soft battery. That translates into excessive voltage drop during high current draws while accelerating and during hill climbs. In addition, EVermont has experienced a high rate of module failure resulting from internal isolation faults. The manufacturer has provided some replacement modules but with lighter and stiffer lithium batteries now available EVermont is looking for funding to replace the sodium batteries. Ultimately, EVermont views this project as successful. It has provided EVermont with an invaluable R&D exercise but it’s greater benefit has been in illustrating to all those who have seen it the potential battery electric vehicles have in solving today’s transportation needs.

UVM TRC Report # 08-002
11
5.0 Conclusions
The goal of this investigation was to determine the effect that cold weather and hilly terrain has on a BEV. The vehicle was able to achieve the goals of a 71 mile range, capable of highway speeds, and comfortable seating for four. Although the vehicle range did decrease during the winter months, mostly due to the use of electric heat, the substitution of kerosene heat increased the range nearly to that obtained in the warmer months. The results of this study suggest that the Zebra battery technology is an appropriate choice for cold climates. However, due to the “soft” nature of the battery, it may not suit the needs of drivers in hilly terrain.
UVM TRC Report # 08-002
12
Appendix A – TRB Paper
Performance of a Battery Electric Vehicle in the Cold Climate and Hilly Terrain of Vermont Re-Submitted: November 14, 2008 Word Count: 3975 words plus 8 figures = 5975 words Corresponding Author: Michael Cross, Ph. D. Post-Doctoral Associate University of Vermont School of Engineering Electrical Engineering Program 33 Colchester Ave 373 Votey Hall Burlington, VT 05405 Phone: (802) 656-0734 Email: [email protected] Other Authors: Keith Pelletier Graduate Student University of Vermont School of Engineering Electrical Engineering Program 33 Colchester Ave 373 Votey Hall Burlington, VT 05405 Phone: (802) 656-0734 Email: [email protected] Stephen Miracle Project Engineer
EVermont 103 South Main Street Waterbury, VT 05671 Phone: (802) 223-3524 Email: [email protected] ABSTRACT Due to its hilly terrain and cold climate, Vermont offers a unique environment for testing the performance of electric and plug-in hybrid electric vehicles. In this study, the performance of a battery electric vehicle was evaluated. A 2005 Toyota Echo was converted from an internal combustion engine automobile to a battery powered electric vehicle by EVermont. The overall performance of this vehicle in daily use was examined. In particular, the influence of

UVM TRC Report # 08-002
13
air temperature and internal battery temperature on vehicle performance was investigated. Additionally the economic cost of operating this vehicle was also considered. Data was collected over a period of nine months and 260 trips totaling over 5,500 miles traveled. The average range of the vehicle during the first nine months of this study was found to be 67 miles, resulting in an estimated energy cost of 7.7 cents per mile. KEYWORDS Battery electric vehicle, BEV, electric vehicle, ZEBRA battery, alternative vehicle technology INTRODUCTION Global climate change is one of the greatest threats facing mankind today. Climate change can be attributed to increasing levels of carbon dioxide (CO2) in the Earth’s atmosphere. In fact, the level of CO2 in the atmosphere has increased by approximately 22% since 1958 (1). The burning of fossil fuels is the major contributor to the increase in CO2 levels. Today, fossil fuels account for 86% of man’s utilized energy source. Transportation accounts for nearly 68% of petroleum use in the US (2). Moving from fossil-fuel based energy sources to renewable sources for transportation can significantly reduce environmental impacts.
Hybrid electric and plug-in hybrid electric vehicles currently on the road and in development may offer some immediate and near term economic and environmental benefits. Fuel cell (FC) powered vehicles appear to be a possible long term solution to this issue, however they still require many years of development as well as the construction of a hydrogen delivery infrastructure prior to their widespread introduction. Battery electric vehicles (BEVs) require less development than fuel cell vehicles and the “fuel” delivery infrastructure is already in place (electric grid). With the shift toward a larger mix of renewable sources used in the production of electricity, BEVs may offer the greatest potential for realizing clean energy in transportation.
The goal of this research project was to determine the performance of a battery electric vehicle (BEV) in the cold climate and hilly terrain of Vermont. For this study, a 2005 Toyota Echo was converted from an internal combustion engine (ICE) vehicle to a BEV by EVermont and leased to the University of Vermont (UVM) for testing. A picture of the vehicle is shown below in Figure 1.
Figure 1: 2005 Toyota Echo sedan which was converted from an ICE to a BEV by EVermont.
The vehicle in this study contains a new battery technology, called Zebra. The new battery system is a molten salt battery, which requires that the battery be operated at an elevated temperature of approximately 295 oC. These batteries offer both high energy and high power

UVM TRC Report # 08-002
14
densities which are well suited for use in electric vehicles. Further, they are composed of sodium/nickel/chlorine (NaNiCl) which should not introduce environmental risks or require the use of rare or expensive materials. The electrolyte for the Zebra battery is molten sodium chloroaluminate, (NaAlCl4) which has a melting temperature of 160 oC. The electrodes for the battery are Ni for the anode and molten Na for the cathode. Proper operation of the battery requires that the battery be maintained at a temperature of about 295 oC when in stand-by mode. If the temperature of the battery is allowed to drop below this temperature range, a lengthy start-up procedure taking a couple of days may be required. To avoid this, the car is designed with the battery in a well insulated enclosure that maintains its high temperature for several days. In addition to the insulation, the vehicle remains plugged in while not in use to keep the batteries warm.
This paper analyzes the performance of a battery electric vehicle in Vermont. It begins by describing the mechanical and electrical nature of the BEV. Next, the influence of air temperature and internal battery temperature on vehicle performance is evaluated. The effectiveness of the regenerative braking system was also studied. Finally, the economic cost of operating this vehicle was considered. BACKGROUND Many consider fuel cell and/or battery powered vehicles to be the most promising long term solution to the growing economic and environmental transportation issues. Both of these technologies could rely on renewable energy sources. Eaves and Eaves (3) recently reviewed these two technologies by first looking at the energy efficiency rating of the two vehicles assuming the energy comes from renewable resources. The authors imposed performance requirements for the vehicles, namely 100 kW of peak power, 60 kWh total energy to the wheels, and a 300 mile range. The BEV was found to have a source-to-wheel efficiency of 76% (note that the authors began the efficiency calculation with the transmission of the energy, not the actual energy production). Using this calculated efficiency, 79 kWh of energy must be generated from renewable sources in order to obtain 60 kWh of useable energy. The fuel cell vehicle (FCV), on the other hand, was found to have a 30% source-to-wheel efficiency (again, original source efficiency was omitted). This lower efficiency was primarily a result of a 54% efficient on board conversion stage. The result of this study suggests that FCVs would require 2.6 times more energy produced in order to obtain the same amount of energy to the wheels as the BEV. The study went on to compare the weight, volume, and cost of each vehicle option, while meeting the afore mentioned performance constraints. This study found that the fuel cell vehicle (FCV) would weigh 721 kg, whereas the electric vehicle meeting the performance constraints would weigh 504 kg. In addition to the weight savings, the electric components in the BEV could potentially be packaged into a smaller vehicle. The authors concluded that the FCV components would require 14,651 L, while the electric vehicle only required 4,691 L. Finally, the authors compared the cost of producing the two vehicles. The FCV propulsion system totaled $29,147, while the BEV’s propulsion system totaled $19,951. From all the factors studied in the paper, the authors concluded that it would be far cheaper, in terms of production and refueling, to develop a BEV than a FCV. Recently, Henault et al. investigated the performance of a NiCd powered 1995 GM Geo Metro BEV (4). In this study, a fleet of 3 nickel cadmium (NiCd) BEVs were driven a distance of nearly 35,000 miles over an eight year time span. The NiCd batteries were chosen because they were expected to provide more reliable service than lead-acid batteries. The NiCd batteries were also selected because of their economic advantage over other advanced battery technologies. The particular batteries in the Henault study were rated at 100 Ah, had an expected lifetime of 65,000 miles, and had an operational temperature range of -4 oF to 104 oF. It is unclear if the NiCd battery technology would be adequate for cold climates, as the data in this current investigation was gathered at temperatures as low as -10 oF. The Zebra batteries evaluated in the
UVM TRC Report # 08-002
15
current investigation are rated from -40 oF to 122 oF. The total energy available in the NiCd battery packs was 15.6 kWh, compared to 21.2 kWh in the current investigation. The NiCd powered Geo Metros were found to have a spring and summer range of 79 miles (at 70% energy usage). The range decreased slightly to 74 miles in the fall and even further to 66 miles during the winter months. During a Phase II investigation, photovoltaic laminates were added to the vehicles in an attempt to capture solar energy. Multiple issues were encountered during the Phase II study which reduced vehicle range to 57 miles. The reduced charge capacity of the batteries was attributed to infrequent battery cycling and infrequent deep cycling of the batteries.
The battery in the BEV of this study is the Zebra battery, which was developed as a result of research findings by a South African scientist, Johan Coetzer in the 1970’s. Since that initial research, Zebra technology has generated considerable interest for both vehicular power storage and as a peak demand management scheme by utilities (5). The Zebra battery technology stores about three times the charge as a current lead acid battery, approximately 100 kWh/kg (6). Currently about 2000 Zebra batteries are manufactured per year by a Swiss owned corporation, MES-DEA in Derby, England. There are discussions to ramp-up this production at additional sites across the world (5). The performance of the NaNiCl battery has been well documented (7-9). RESEARCH METHODS Vehicle Description In 2003, EVermont’s board of directors approved a plan to design and assemble prototype electric vehicles using Federal Transit Administration funds that were awarded to EVermont for alternative transportation research. The EVermont project team’s design parameters included a comfortable sedan that could transport four commuters from their homes to a place of public transit, while at the same time accounting for the possibility of an 80 mile commute range. At the time, battery choices were limited and due to EVermont’s prior difficulties with thermal management issues, a battery with a self-contained thermal management system was desired. The selection of the Zebra battery satisfied this requirement and promised good energy density and long cycle life. The next component selected was the vehicle to convert. The first choice was to find a vehicle that would accommodate one large battery in the center of the vehicle under the floor. Such a vehicle was not able to be found. After learning that the Zebra battery could be obtained in two smaller modules, EVermont chose a 2005 Toyota Echo 4 door sedan for this project. This vehicle was relatively small but very comfortable and had correctly shaped compartments in the front and rear for battery placement. From the factory, this vehicle had a 1.5 L, 108 hp, 4 cylinder engine, with a curb weight of 2086 lbs. Weight and balance was closely studied throughout the design and build process. This vehicle does not have air conditioning, power windows, or power locks. The EPA mileage specifications for the base vehicle are 38 mpg highway and 30 mpg city (normalized to 2008 EPA testing practices). This vehicle has a five passenger seating capacity with ample interior space for a sub-compact car.
An Azure Dynamics drive system was chosen due to its robust AT-1200 gearbox coupled to the efficient AC-24 3 phase induction motor. This system also includes the Azure Digital Motor Controller/Inverter. The Zebra batteries were strapped in parallel and provided the digital motor controller (DMOC) with 285 volts and up to 120 amps. Azure Dynamics developed software so that a Mototron computer device could be incorporated into the system. This Mototron communicates with the Zebra Battery Management Interface via a common area network (CAN) bus and also provides precharge control for the DMOC. In addition it supplies the speedometer with a calibrated signal, controls the brake lights during regenerative braking, and powers up the Azure DC-DC converters once the battery initialization routine is completed. An electric power steering pump from a Toyota MR-2 was adapted for use in this vehicle and was powered with a Curtis pulse width modulated controller thus providing variable power assist.
UVM TRC Report # 08-002
16
Two hydronic heaters were installed, one burning kerosene and the other electric giving the operator a choice of fuels for heat.
The day-to-day drivability, overall vehicle and battery performance, and electrical consumption were evaluated. A Campbell Scientific CR10 data logger was programmed to record the following data:
• Date and time • Drive current (Watt-hour while charging) • Battery heater current • Battery volts • Temperature • Vehicle speed
In addition to this data, the Zebra Battery Management Interface (BMI) displays (but does not save in memory) the following data, which were recorded in a log book:
• Battery volts • Battery current • Battery temperature • State of charge • Charge current • Amp-hours used Data was collected for both commuting and city travel. Commute data primarily
consisted of a route from Monkton, VT (05469) to the University of Vermont in Burlington, VT (05405). The route consisted of non-highway roads covering a distance of approximately 22 miles, with an average speed of 35 mph. City data consisted of stop-and-go travel in Chittenden County VT, with an average distance of 9 miles and an average vehicle speed of 15 mph. A GeoStats GPS data logger was used to collect route data. An elevation view of the typical commute and city routes is shown in Figure 1.
UVM TRC Report # 08-002
17
Figure 2: Elevation route data collected with the on-board GPS unit. The commute route began in Monkton, VT (Addison County) and ended near Burlington, VT (Chittenden County). City data was collected for trips in Chittenden County. The elevation profile of a typical commute route is shown in Figure 3. The elevation of this route ranged from 650 feet to 300 feet above sea level. The total elevation change was calculated to be 2813 feet, with 1274 feet of ascent and 1539 feet of descent. The elevation change for city travel was less drastic, ranging from 300-400 ft above sea level.

UVM TRC Report # 08-002
18
Figure 3: Elevation profile for 22 mile commute from Monkton, VT to Burlington, VT.
For this investigation, vehicle range was calculated as miles driven (from vehicle odometer) divided by percent of battery charge used (from Zebra BMI). For example, a 22 mile trip using 25% of the available battery charge (or 5.3 kWh) results in a calculated range of 88 miles. This method assumes 100% battery discharge, which may not be practical but it does provide a maximum possible range.
RESEARCH RESULTS Vehicle Performance Overall, this vehicle has performed well during the first nine months of this investigation. A few minor issues have occurred, but they were quickly corrected by EVermont. A list of issues encountered to date includes:
• Data logger/PC communication issues. Data acquisition software could not communicate with Windows XP operating system. A PC with Windows 95 solved this issue.
• Front battery heater cable became lose, causing the batteries to not charge. The cable was reattached and the vehicle is now performing as expected.
• Front battery cooling fan failed due to road salt contamination. The fan unit was replaced and the vehicle is now performing as expected.
• Occasional (5 trips out of 260) 50% power loss. Issue has been attributed to a failed/failing cell in one of the batteries. This battery is an early example received by EVermont.
Battery Performance One of the hurdles for the widespread introduction of BEVs is battery technology. Current advanced battery options for electric vehicle power supplies include Li-ion (as used in the Tesla Roadster) and nickel metal hydride (as used in the Toyota Prius, Camry, and Highlander Hybrids). The performance of the batteries is a key metric in the overall performance of BEVs. Therefore, this study looked at the performance of the Zebra battery in the EVermont Toyota Echo BEV.
During this study, it was determined that battery efficiency is significantly affected by higher internal battery temperatures. While commuting, the vehicle range decreased by 56% as
UVM TRC Report # 08-002
19
the internal battery temperature increased from 317°C to 345°C, see Figure 4. City data shows a similar trend as the battery temperature increased from 310 oC to 325 oC. On average, the batteries tended to stay cooler when driving in the city route. This is due to the fact that while driving in the city, the terrain tended to have less elevation change, which resulted in the batteries not having to constantly supply high current as they do while the vehicle was driven along the typical commute route. The batteries also had time to cool while the vehicle sat at intersections.
Figure 4: Influence of internal battery temperature on vehicle range. Range decreased substantially while commuting as the internal battery temperature increased, while the range decreased only slightly as the batteries warmed while driving in stop-and-go traffic.
Historically, one of the limitations of electric vehicles in cold climates is a reduction in range due to the lower air temperature and increased use of accessories. Previous work on lead-acid BEVs observed a 29% reduction in range during the winter months (10). This decrease was attributed to increased energy usage for electric heating and defrosting, lights, and wipers. While the batteries in the vehicle evaluated in the current investigation were heavily insulated from the ambient, a reduction in vehicle range at lower air temperatures was observed. As shown in Figure 5, the calculated range decreased as much as 52% as the air temperature decreased from 71°F to -8 °F. The same trend was observed for both commuting and city data. The average calculated vehicle range for warm weather (temperature greater than 50 oF) was approximately 83 miles; while the average calculated range for cold weather (temperature less than 40 oF) was 60 miles, which represents an average decrease in range of 28%. The overall average calculated range for the first nine months of this study was 67 miles at an average daily high temperature of 47 oF.

UVM TRC Report # 08-002
20
Figure 5: Influence of ambient air temperature on vehicle range. Range decreased substantially as air temperature decreased.
As Sime (1999) found, this decrease was attributed to increased energy usage for the electric heater and defroster, lights, and wipers during the cold, snowy winter months (10). In the current investigation, an auxiliary kerosene heater was used when the temperature dropped below 40°F. To isolate the effect of the electric heat on vehicle range, six trips were made while using the kerosene heater in place of the electric heat. As shown in Figure 6, this led to an average increase in range of 20%. It should be noted that for the winter season (Nov 2007-March 2008), approximately 3 gallons of kerosene were used.
Figure 6: Comparison of vehicle range while using electric heat or kerosene heat. Vehicle range increased by 20% when the electric heater was replaced by the kerosene heater.
The combination of internal battery temperature and ambient air temperature had a noticeable effect on the performance of the vehicle. As the internal battery temperature

UVM TRC Report # 08-002
21
increased, the available drive current decreased, which resulted in a decrease in available power for the car. This effect was compounded in colder weather due to the increased load placed on the batteries as a result of the use of the electric heater and defroster, head lights, and wipers. This effect is shown in Figure 7.
Figure 7: Available drive current during a commute from Burlington, VT to Monkton, VT. Maximum drive current decreases as the internal battery temperature increases. This effect was exaggerated during cold weather due to increase load on the batteries from the use of electric heat.
One of the benefits of hybrid electric vehicles and battery electric vehicles is the ability to recapture otherwise wasted energy in the form of regenerative braking. During four commutetrips which were all identical in route, air temperature, and maximum internal battery temperature, the effectiveness of the regenerative braking system was studied. As shown in Figure 8, disabling the re-generative braking system led to a 13% increase in energy consumption.
UVM TRC Report # 08-002
22
Figure 8: Regenerative braking system effectiveness of the EVermont BEV. Overall energy consumption increased by 13% when the regenerative braking system was disabled. Electric Consumption In order to calculate the electric cost of this vehicle, a Watt-hour meter was used to measure the amount of energy required to recharge the batteries after a commute and then keep them warm once fully charged. At a rate of 12 cents/kWh, we calculate a “fuel” cost of 7.7 cents/mile for the BEV in this study. For comparison purposes, a gas powered Toyota Echo with a combined fuel economy of 33 mpg and an average fuel price of $4.00/gallon would cost 12.5 cents/mile (including the cost of oil changes ($20) every 5000 miles). Assuming 12,500 miles traveled per year, the BEV Echo would save the consumer approximately $600 in “fuel” costs compared to the gas-powered version.
CONCLUSIONS The goal of this investigation was to determine the effect that cold weather and hilly terrain has on a BEV. The vehicle was able to achieve the goals of a 67 mile range, capable of highway speeds, and comfortable seating for four. Although the vehicle range did decrease during the winter months, mostly due to the use of electric heat, the substitution of kerosene heat increased the range nearly to that obtained in the warmer months. The results of this study suggest that the Zebra battery technology is an appropriate choice for cold climates. This work also suggests that there is a substantial financial advantage of a BEV compared to an ICE. Finally, this project has provided EVermont with an invaluable R&D exercise but it’s greater benefit has been in illustrating to all those who have seen it the potential battery electric vehicles have in solving today’s transportation needs.
Future work could include repeating this study with a liquid cooling system installed on the batteries. Additionally, EVermont is currently looking for funding to test lithium batteries in place of the sodium batteries. Once retrofitted with the Li batteries, this investigation could be repeated to compare the two battery technologies. The impact that a fleet of battery electric vehicles would have on the electric grid in Vermont must also be considered. A related study at the UVM Transportation Research Center is currently examining the electric grid impacts of charging BEVs and PHEVs on the Vermont and New England electric grid. Finally, Central Vermont Public Service (CVPS) recently donated a plug in converted Toyota Prius to the University of Vermont. This vehicle will be driven along the identical commute route as the BEV in this study, allowing for a comparison of the economic and energy usage impacts of the PHEV versus the BEV. ACKNOWLEDGEMENT We would like to thank the University of Vermont Transportation Research Center and the Department of Transportation for funding. We also thank Dr. Richard Watts and Dr. Walter Varhue from UVM for assistance in various aspects of this project. The authors also thank Chase Pelletier, M.S. of EcoEnergy, LLC for GPS data analysis. REFERENCES 1. Tans, P., NOAA/ESRL report www.esrl.noaa.gov/gmd/cgg/trends 2. Farington R.Addicted to Oil: Where’s the Road Lead. NREL report, 2006 3. Eaves, S. and Eaves, J. A Cost Comparison of Fuel-Cell and Battery Electric Vehicles.
Journal of Power Sources, 130, 2004.

UVM TRC Report # 08-002
23
4. Henault, J. W., Sime, J. M., and Romano, F. J. The Connecticut Department of Transportation’s Evaluation of Nickel Cadmium Battery Electric Vehicles. Transportation Research Board, 2008.
5. http://tyler.blogware.com/blog/_archives/2006/7/11/2102930.html 6. http://www.nickelmagazine.org/index.cfm/ci_id/10121/la_id/1.htm 7. Coetzer and Sudworth Out of Africa, the story of the Zebra Battery. Beta Research &
Development Ltd, 2000. 8. Tilley, R. and Galloway, R. Design Changes to Improve the Specific Energy of the ZEBRA
Battery. Presented at Electric Vehicle Symposium 18, 2001. 9. Galloway and Dustmann ZEBRA Battery - Material Cost Availability and Recycling.
Presented at Electric Vehicle Symposium 19, 2003. 10. Sime, J. M. Evaluation of Electric Vehicles as an Alternative for Work-trip and Limited
Business Commutes (Lead Acid Batteries). Report no. CT-343-30-99-1, Connecticut Department of Transportation, Newington, CT, 1999.

UVM TRC Report # 08-002
24
Appendix B – PHEV Emissions Study
UVM TRC Report # 08-002
25
UVM TRC Report # 08-002
26

UVM TRC Report # 08-002
27
UVM TRC Report # 08-002
28
UVM TRC Report # 08-002
29

UVM TRC Report # 08-002
30

UVM TRC Report # 08-002
31