
PERFORMANCE MODELING AND DESIGN OF …digital.library.okstate.edu/etd/umi-okstate-1933.pdf · This...
114
PERFORMANCE MODELING AND DESIGN OF BACKSCATTER RFID SYSTEMS: A STATISTICAL APPROACH By JAYJEET M. GOVARDHAN Bachelor of Mechanical Engineering Walchand College of Engineering, Sangli Shivaji University India 2002 Submitted to the Faculty of the Graduate College of the Oklahoma State University in partial fulfillment of the requirements for the Degree of MASTER OF SCIENCE July, 2006
Transcript of PERFORMANCE MODELING AND DESIGN OF …digital.library.okstate.edu/etd/umi-okstate-1933.pdf · This...

PERFORMANCE MODELING AND DESIGN OF
BACKSCATTER RFID SYSTEMS: A
STATISTICAL APPROACH
By
JAYJEET M. GOVARDHAN
Bachelor of Mechanical Engineering
Walchand College of Engineering, Sangli
Shivaji University
India
2002
Submitted to the Faculty of the
Graduate College of the Oklahoma State University
in partial fulfillment of the requirements for
the Degree of MASTER OF SCIENCE
July, 2006

PERFORMANCE MODELING AND DESIGN OF
BACKSCATTER RFID SYSTEMS:
A STATISTICAL APPROACH
Thesis approved:
Dr. Satish Bukkapatnam
Thesis Advisor
Dr. Charlene A. Yauch
Dr. Charles F. Bunting
Dr. A. Gordon Emslie
Dean of the Graduate College

ii
Research Summary
This thesis provides a statistical framework for performance modeling and design of
backscatter Radio Frequency Identification (RFID) systems. The thesis also explores the
uncertainties associated with certain parameters like tag orientation, gain of tag antenna, and
power of reader antenna to ascertain a relationship between the measured and predicted values of
tag read-rate probabilities.
Starting from late 1990s, RFID systems are being increasingly adopted by the industry,
especially in the fields of supply chain management, transportation, asset management, etc., for
accurate tracking of inventories for real-time data management, reducing shrinkage, and
increasing the visibility of the supply chain as a whole. However, RFID systems come with
certain inherent limitations, such as degradation of system performance due to uncertainties in
system parameters, imprecision in performance specification and prediction, and deterioration of
operation in metallic and absorptive environments.
The current models for specifying and estimating performance are based purely on EM
theory (e.g., using Friis free space equations) or statistical experimental modeling principles.
Models based on EM theory are limited to specifying power received at the tag under certain
simple, idealized conditions, and do not provide estimates of read-rates, which are de-facto
industry quantifiers of an RFID system performance. The estimates of power levels do not
consider uncertainties inherent to an industrial RFID system. On the other hand, the statistical
models, being purely data-driven, suffer from lack of generalizability as their results cannot be
extrapolated. This thesis investigates a statistical approach for assessing the system performance
and proposes an analytical probabilistic model based on Friis free space expression that captures

iii
the uncertainties existing in gain of tag antenna, power of reader antenna, frequency hopping, etc.
A new term called propagation factor is introduced in the classical Friis free space equation to
make it suitable for determining read-rate probabilities of tags placed in certain commonly
occurring environmental conditions. Model was able to capture read rate probabilities for plastic
bottle stored in plastic bags with an average accuracy of 92.5%, plastic bottles containing organic
liquid have an average accuracy of 92%, and cardboard cartons containing plastic bags have
around 91%. While the average accuracy of the model to predict read-rate probabilities for plastic
bags containing organic solids is 90% and cardboard cartons containing metal cans is 88%
Finally the thesis suggests a set of techniques to increase read-rate probabilities of RFID
tags when placed on metal objects or in the presence of highly metallic environments. The
suggested set of techniques make the tag comparatively more stable in normal operating
conditions and increases its readability up to 100%.

iv
Acknowledgments
I would like to thank my mentor Dr. Satish Bukkapatnam to instill, sustain and encourage
research interests in me. His vision and belief helped me throughout my journey towards
completion of this thesis. It is Dr. Bukkapatnam who opened entirely new fields of simulation,
RFID and statistical analysis to me. Secondly, I would like to thank Dr. Charles Bunting for his
immense help and guidance with reverberation chamber experiments. I shall always remain
thankful to Dr. Charlene Yauch for her guidance in documenting the research work.
In closure, I would like to thank Vignesh Rajamani for his help regarding the
reverberation and anechoic chambers experimentation. My gratitude goes to Ms. Walter, Lauer
and Coleman who do so much at the backstage but their efforts are often overlooked. I would also
thank Dr. Ken Case for developing research ethics and leadership skills in me. I would like to
thank the most intelligent person who helped me through every facet of my research, Mr.
Prahalada Rao. I would like to thank my colleagues and friends Mr. Yatin Bhamare, Nikhil Joshi,
Nilesh Shimpi, Abhay Barapatre, Manoj Bachhav, Makrand Kalyankar, Sharethram Hariharan,
Brandon Gardner, and Vijay Munoli.
The generous financial help provided by the National Science Foundation (DMI
0427840) and NSF I/UCRC CELDi are kindly acknowledged.
Finally, I would like to thank my mother and my uncle Mr. Deepak Amalnerkar for being with me
during my moments of anxiety, and I therefore dedicate this thesis to them.

v
TABLE OF CONTENTS
Research Summary ii
Acknowledgments iv
Chapter 1
Introduction and Research Objectives 1
Chapter 2
Background and Literature Review 4
2.1 Hardware Enhancement for Increasing RFID System Efficiency 4
2.2 Experimental Specification of RFID System Parameters 10
Chapter 3
Research Gaps, Problem Description and Approach 23
Chapter 4
Statistical Analysis for Performance Measurement of RFID Systems 25
4.1 Introduction 25
4.2 Experimentation Details 34
4.3 Analysis of Experimental Results 38
4.4 Concluding Remarks 45
Chapter 5
Analytical Modeling Approach 46
5.1 Introduction 46
5.2 Experimentation Details Using Gen 1 RFID System 47
5.3 Results Using Gen 1 RFID System 49

vi
5.4 Experimentation Details Using Gen 2 RFID System 54
5.5 Results Using Gen 2 RFID System 57
5.6 Summary 86
5.7 Concluding Remarks 86
CHAPTER 6
Experiments to Improve Read-Rate Probabilities for RFID Tags in Metallic Environments 87
6.1 Key Results 87
6.2 Experimental Setup 88
6.3 Design of Experiments 90
6.4 Results 91
6.5 Concluding Remarks 93
CHAPTER 7
Contributions and Future Work 95
7.1 Contributions 95
7.2 Future Work 96
References 98

vii
LIST OF FIGURES
Figure 1: Working of a typical RFID system [5]............................................................................................ 1
Figure 2: Roadmap of the thesis ..................................................................................................................... 3
Figure 3: Read Range Dependence on Form Factor [14] ............................................................................. 15
Figure 4: Effect of Package Content on Total Reads [18] ............................................................................ 18
Figure 5: Effect of Tag Orientation on Total Reads [18].............................................................................. 18
Figure 6: Effect of Package Content on 100% Reads [18] ........................................................................... 19
Figure 7: Effect of Tag Orientation on 100% Reads [22]............................................................................. 19
Figure 8 : Tag Orientation (All angles at zero degrees)................................................................................ 27
Figure 9: Ishikawa Diagram ......................................................................................................................... 29
Figure 11: Tag-Antenna (AWID) Setup for Experimentation...................................................................... 36
Figure 12 : Reader to Computer System Connectivity ................................................................................. 36
Figure 13 : Interaction Plot of Read-rate (%) vs. Distance r for Different Reader Makes ........................... 40
Figure 14 : Interaction Plot of Read-rate (%) vs. Speed for different Reader Makes................................... 41
Figure 15 : Interaction Plot of Read-rate (%) vs. Tag Orientation ( yθ ) for different Reader Makes.......... 42
Figure 16 : Interaction Plot of Read-rate (%) vs. Distance for different tag orientations ( yθ ) ................... 43
Figure 17 : Interaction Plot of Read-rate (%) vs. tag orientation ( yθ ) at different speed settings ............... 43
Figure 18 : 3D Surface Plot of Read-rate (%) vs. Distance r and Speed ...................................................... 44
Figure 19: Variation of power received at tag ( rP ) with frequency (f) at r = 508 mm and yθ = 0º with
Propagation Factor α =3..................................................................................................................... 49
Figure 20 : Variation of power received at tag ( yθ = 0º) with frequency (f) at r = 508 mm and (a) at
Propagation Factor α =0 (b) Propagation Factor α =50..................................................................... 49
Figure 21: Comparison of read-rates obtained from the model with those from experiments (Tag: AWID®
Gen 1, Model: Prox-Linc (MT APT 1014), Reader: MPR 2010 BR, EIRP =1W and yθ = 0º) ......... 52
Figure 22: Variation of power received at tag ( rP ) with frequency (f) at r = 1270 mm and yθ = 90º......... 53

viii
Figure 23: Comparison of read-rates obtained from the modeling approach with those from experiments
(Tag: AWID® Gen 1, Model: Prox-Linc (MT APT 1014), Reader: MPR 2010 BR, EIRP =1W and
yθ = 90º) ............................................................................................................................................ 53
Figure 24: Placement of tag on plastic bag containing organic solid (noodles) stored in plastic bag and
metal cans in cardboard carton............................................................................................................ 54
Figure 25: Placement of tag on plastic bottle containing organic liquid (water) and plastic bottle stored in
plastic bag ........................................................................................................................................... 55
Figure 26: Placement of tag on cardboard carton containing organic solid (noodles).................................. 55
Figure 27: Read-rate measurement procedure .............................................................................................. 56
Figure 28: Comparison of read-rates obtained from the modeling approach with those from experiments for
plastic bottle stored in plastic bag with EIRP =1W and (a) yθ = 0º (b) yθ = 45º (c) yθ = 90º ...... 63
Figure 29: Comparison of read-rates obtained from the modeling approach with those from experiments for
plastic bottle stored in plastic bag with EIRP =0.398 W and (a) yθ = 0º (b) yθ = 45º (c) yθ = 90º
............................................................................................................................................................ 64
Figure 30: Comparison of read-rates obtained from the modeling approach with those from experiments for
plastic bottle stored in plastic bag with EIRP =0.158 W and (a) yθ = 0º (b) yθ = 45º (c) yθ = 90º
............................................................................................................................................................ 65
Figure 31: Comparison of read-rate obtained from the modeling approach with those from experiments for
organic liquid stored in plastic bottle with EIRP =1W and (a) yθ = 0º (b) yθ = 45º (c) yθ =90º ... 68
Figure 32: Comparison of read-rates obtained from the modeling approach with those from experiments for
organic liquid stored in plastic bottle with EIRP =0.398W and (a) yθ = 0º (b) yθ = 45º (c) yθ =
90º ....................................................................................................................................................... 69
Figure 33: Comparison of read-rate obtained from the modeling approach with those from experiments for
organic liquid stored in plastic bottle with EIRP =0.158W and (a) yθ = 0º (b) yθ = 45º (c) yθ =
90º ....................................................................................................................................................... 70
Figure 34: Comparison of read-rate obtained from the modeling approach with those from experiments for
organic solid stored in plastic bag with EIRP =1W and (a) yθ = 0º (b) yθ = 45º (c) yθ = 90º ...... 73

ix
Figure 35: Comparison of read-rate obtained from the modeling approach with those from experiments for
organic solid stored in plastic bag with EIRP =0.398W and (a) yθ = 0º (b) yθ = 45º (c) yθ = 90º74
Figure 36: Comparison of read-rate obtained from the modeling approach with those from experiments for
organic solid stored in plastic bag with EIRP =0.158W and (a) yθ = 0º (b) yθ = 45º (c) yθ = 90º75
Figure 37: Comparison of read-rate obtained from the modeling approach with those from experiments for
plastic bag stored in cardboard carton with EIRP =1W and (a) yθ = 0º (b) yθ = 45º (c) yθ = 90º 78
Figure 38: Comparison of read-rate obtained from the modeling approach with those from experiments for
plastic bag stored in cardboard carton with EIRP =0.398W and (a) yθ = 0º (b) yθ = 45º (c) yθ =
90º ....................................................................................................................................................... 79
Figure 39: Comparison of read-rate obtained from the modeling approach with those from experiments for
plastic bag stored in cardboard carton with EIRP =0.158W and (a) yθ = 0º (b) yθ = 45º (c) yθ =
90º ....................................................................................................................................................... 80
Figure 40: Comparison of read-rate obtained from the modeling approach with those from experiments for
metal cans stored in cardboard carton with EIRP =1W and (a) yθ = 0º (b) yθ = 45º (c) yθ = 90º 83
Figure 41: Comparison of read-rate obtained from the modeling approach with those from experiments for
metal cans stored in cardboard carton with EIRP =0.398W and (a) yθ = 0º (b) yθ = 45º (c) yθ =
90º ....................................................................................................................................................... 84
Figure 42: Comparison of read-rate obtained from the modeling approach with those from experiments for
metal cans stored in cardboard carton with EIRP =0.158W and (a) yθ = 0º (b) yθ = 45º (c) yθ =
90º ....................................................................................................................................................... 85
Figure 43: Reverberation Chamber .............................................................................................................. 89
Figure 44: LABVIEW® program for controlling the tuner speed................................................................ 89
Figure 45: RFID tag slapped on metal can using spacers............................................................................. 90
Figure 46: Placement of reader antennae in a reverberation chamber .......................................................... 90
Figure 47: 3D Surface Plot of Tag Read rate (%) vs. Tag Spacing and Tuner Speed .................................. 92

x
LIST OF TABLES
Table 1: List of PIVs .................................................................................................................................... 28
Table 2 : Selection of KPIVs- Phase 1 ......................................................................................................... 31
Table 3 : Selection of KPIVs - Phase 2 ........................................................................................................ 32
Table 4: Interrelationship Matrix of KPIVs................................................................................................. 33
Table 5 : Levels of Distances for each Reader ............................................................................................. 37
Table 6 : Coding Scheme of KPIVs ............................................................................................................. 38
Table 7 : Response Surface Regression Analysis Results ............................................................................ 39
Table 8: Levels of KPIVs for Gen 1 RFID System ...................................................................................... 48
Table 9: Summary of change in mean read-rate and its std. deviation with distance between tag and reader
at EIRP = 1 W based on modeling approach using GEN 1 RFID System.......................................... 51
Table 10: Combination of container and contained material used for read-rate measurements using Gen 2
RFID System....................................................................................................................................... 56
Table 11: Levels of KPIVs for Gen 2 RFID System .................................................................................... 57
Table 12: Value of Propagation factor for combination of containers and contained materials at all EIRPs
using Gen 2 RFID System .................................................................................................................. 58
Table 13: Mean percentage error in actual (experimental) and predicted (modeling) read-rates for all
combinations of outside container and inside material at different values of EIRP............................ 60
Table 14: Summary of change in mean read-rate and its standard deviation with distance between tag and
reader for plastic bottle stored in plastic bag based on results obtained from model .......................... 61
Table 15: Summary of change in mean read-rate and its standard deviation with distance between tag and
reader for organic liquid stored in plastic bottle based on results obtained from model ..................... 66
Table 16: Summary of change in mean read-rate and its standard deviation with distance between tag and
reader for organic solid stored in plastic bag based on results obtained from model.......................... 71
Table 17: Summary of change in mean read-rate and its standard deviation with distance between tag and
reader for plastic bag stored in cardboard carton based on results obtained from model.................... 76
Table 18: Summary of change in mean read-rate and its standard deviation with distance between tag and
reader for metal cans stored in cardboard carton based on results obtained from model.................... 81

xi
Table 19: Levels of KPIVs for Reverberation Chamber Experiments using Gen 2 RFID System............... 91
Table 20: Comparison of read-rate probabilities at different settings of tuner speed and tag spacing ......... 93

1
Chapter 1
Introduction and Research Objectives
RFID (Radio Frequency Identification) systems are being incorporated to replace
conventional automatic identification technologies including barcodes in several industrial sectors
to improve the efficiency and accuracy of data transfer from physical objects to resource planning
databases. Typical RFID applications include asset management, logistics, security, toll
collection, point of sale, supply chain management, etc. [1]. Low cost (<10¢), ease of use, and
thrust of EPC (Electronic Product Code) global standards [2], will make passive RFID tags more
suitable to adapt to many more applications [3]. A passive RFID system based on the backscatter
principle works in the following way (see Figure 1). The RFID reader transmits a signal in the
form of EM (Electromagnetic) waves. An RFID tag within the field of the RFID reader receives
the waves and converts the EM waves into voltage, to power the chip and electronic circuit in the
tag. The tag thus transmits back a modulated signal containing the RFID code.
Figure 1: Working of a typical RFID system [5]

2
An RFID system consists of three main components. The first one is the front end
system, which consists of the tags, readers and antennas. The second is the RFID middleware,
which consists of an event processor and a link to the central database where all the product
information is stored. The last part of the RFID system is the backend system, which consists of
the central database and an enterprise application which brings usefulness to the tag information
retrieved from the tagged objects by the RFID middleware.
The main applications of RFID systems integrated with enterprise applications are listed
as follows [1]:
1. supply chain automation
2. real-time inventory tracking
3. asset tracking
4. retail stock management
5. patient and accessory tracking in hospitals
6. manufactured item tracking
7. machine health monitoring (active RFID)
The industry is currently looking for new ways to design RFID systems and predict their
performance for various applications. Currently most approaches are rooted in EM
(electromagnetic) theory, or purely empirical and statistical foundations. Integration of these two
approaches is necessary for effective RFID system design and performance prediction. The thesis
addresses the development of models that are based on EM theory and statistical principles for
design and prediction of RFID systems. The specific tasks addressed in this thesis are as follows
(also see Figure 2):
1. documentation of current industrial best practices in RFID system design and operations
2. experimental studies varying tag and reader parameters

3
3. analytical model development and validation
4. experimental studies in a reverberation chamber
5. statistical analysis approach for developing practical models
6. extensions of analytical model to capture experimental effects
7. experimental validation
8. experimental setup and benchmarking of read-rate probabilities in metallic environments
Experimental
Study
Statistical
Modeling
EM based
Analytical
Modeling
Validation
Figure 2: Roadmap of the thesis
The remainder of this thesis is arranged as follows: Review of experimental studies in
Chapter 2 and research gaps, problem description and approach in Chapter 3, statistical approach
in Chapter 4, EM theory based analytical modeling in Chapter 5, benchmarking experiments for
increasing read-rate probabilities in metallic environments is explained in Chapter 6, while
Chapter 7 summarizes the contributions of thesis towards RFID research and the future work.
4
Chapter 2
Background and Literature Review
The studies on RFID system design have taken the following two broad approaches:
1. hardware enhancement for increasing the RFID system efficiency
2. experimental specification of RFID system parameters for various domains
2.1 Hardware Enhancement for Increasing RFID System Efficiency
In the first category, research is being done in the fields of antenna development,
firmware development for readers, studies related to RF physics and alternative technology
development. The communication between a tag and a reader is achieved by two basic methods,
namely, inductive or near-field coupling and backscatter or far field coupling [4]. When the tag is
located at a very close distance from the base station antenna, the data exchange from the tag to
the antenna occurs due to the voltage induced in the tag coil through the antenna coil. This system
behaves like a transformer type coupling, wherein the reader antenna acts as a primary coil and
the tag’s coil as a secondary coil of the transformer. This kind of coupling exists only at short
distances, which, practically speaking, is approximately 0.16 times the wavelength of the RF
wave [3].
Outside the inductive coupling range, there exists a communication between the tag and
the base station antenna through the electromagnetic waves reflected by the tags. This kind of
communication is called the backscatter coupling. Most of the RFID systems use the principle of
backscattering of modulated waves to communicate between the tag and the reader. A backscatter

5
type RFID system consists of a tag, reader, antenna and a computer controller. Whenever the tag
receives a signal from the base station, a voltage is sensed by a chip embedded in the tag. The DC
voltage helps to charge a capacitor in the same circuit. This capacitor in turn operates a diode,
which causes the chip information to be sent in the form of an electrical signal to the tag antenna.
The antenna transmits the chip information in the form of modulated RF waves. This response of
the tag is determined by an induced voltage, which can be computed by using the radar equation.
The induced voltage depends on the field produced by the antenna (both transmitter and receiver)
and the effective antenna height (form factor) of the tag. The chip in the tag helps in responding
to the commands sent by the reader through the antenna obeying a definite protocol. The induced
voltage causes a change in the RF impedance in the tag which causes a production of a
backscatter signal that is detected by the base station antenna [5].
The power density (P) of the incident electromagnetic wave at a distance r from the
reader is given by,
2 4 r
GPP tt
π= (1)
where, Pt is the power transmitted by the reader antenna (transmitter antenna), and tG is the gain
of the reader antenna.
The read range of an UHF based RFID system can be calculated by the Friis free space
equation as follows [6],
th
rtt
P
sGGPyr
)1(
4
cos2
−=
π
θλ 10 2
≤≤ s (2)
where, rG is the gain of the tag antenna, λ is the wavelength of the EM RF waves, thP is the
minimum threshold power required to power an RFID tag, yθ is the angle made by the tag with

6
the reader plane, and 2s is the power reflection coefficient, which is the ratio of reflected power
to incident power by the tag [7].
It can be noticed that the power received by the tag is inversely proportional to the square
of the distance between the tag and the base antenna. Studies reveal that the orientation of tag in
the RF field affects its read range. A perfectly parallel tag, relative to the base station antenna,
yields maximum read range, while a tag perpendicular to the base station antenna’s field has
minimum to zero read range.
Thus, efforts are made to make the tag parallel to the base station antenna by deploying
one or more of the following measures:
1. change in orientation of base station antenna to suit the orientation of the tag antenna
2. use of redundant antennas for ensuring proper alignment of at least one antenna base station
to the tag antenna
3. increase in base station antenna power to negate the effect of tag orientation
4. increase in polling rate of the antenna to make more reads in the same sampling time
As discussed earlier, the size and shape (form factor) of the tag antenna have a significant
effect on tag read-rates regardless of the coupling used for communication. There are various
types of antennas available, among which the most commonly used are dipole, folded dipole,
printed dipole, printed patch, squiggle and log-spiral. Among these, the dipole, folded dipole and
squiggle antennas are omni-directional, thus allowing them to be read in all possible tag
orientations, relative to the base antenna. On the other hand, directional antennas have good read
range due to their good resistance to radiation patterns. Care must be taken while choosing an

7
antenna because the antenna impedance must match to the ASIC (application-specific integrated
circuit) and to free space [8]. The four major considerations done while choosing an antenna are:
1. type of antenna
2. antenna impedance
3. nature of the tagged object and
4. vicinity of structures around the tagged object
Another major consideration while designing RFID systems is that the tags get damaged
in real world scenarios. Under such conditions, it is required that the tag must be read
comfortably by the base antenna. Antennas might get distorted due to bending, for example, if
placed on flexible materials like polythene bags or wrappers. The bending might occur due to
loosening of the glue below the tag or due to mishandling of the tagged object. It is quite possible
that the read range is affected by the distortions in tag antenna. It is observed that if a dipole
antenna is bent at the point where it is fed with signals, its input return losses increase. It is also
observed that the read range decreases by up to 40% if the antenna is bent by 90° at the feed
point.
In the power equation stated earlier, in cases of no tag distortion, the tag gain may be
given as,
rr DG = (3)

8
where rD is directivity*. In the case of a distorted antenna, there will be a change in directivity as
well as impedance mismatch. For a folded dipole antenna, the performance degradation due to
antenna distortion is evaluated conveniently using the following equation,
r
r
D
D
r
r'
2'
)1( ⋅Γ−= (4)
where rr and ' are the operating ranges with and without distortion, respectively, and Γ is the
reflection coefficient due to mismatch. It is also possible to predict the reduction in read range
due to possible antenna distortion from the above equation [9].
Every reader has a finite space within which it communicates with the tags. Such a finite
space is called an interrogation zone. It often occurs that the interrogation zones of two or more
readers intersect with each other. This is an example of reader collision. Such collisions may lead
to a tag being read more than once or the tag not being read at all. While designing RFID
systems, it is necessary to minimize the number and frequency of reader collisions [10]. This can
be achieved by allocation of frequencies over time to various readers, which is similar to the
working of cellular phone network systems. But, the inherent difference between a cellular phone
and an RFID tag network is that cell phones are themselves capable of communicating to the right
base station, while RFID tags are low functionality devices that depend on the base station itself
to get themselves powered. Thus, the RFID tags are fundamentally incapable of determining the
right base station (reader antenna) and aiding the communication process with the right reader
[10]. Therefore, changing the reader controls is the only way to avoid reader collision. One
method of doing this is to assign different times or different frequencies to individual readers. The
problem in allotting different frequencies to different readers is the existence of a small
* The directivity of an antenna is defined as the ratio of the maximum value of the power radiated per unit solid angle, to the average power radiated per unit solid angle.

9
bandwidth for frequency available for a particular range. Thus, re-using the frequency bands i.e.,
allotting the same frequencies for readers located far from each other can be one of the practical
solutions to avoid reader collision.
When the number of fixed frequencies allotted to a set of readers is considerably less than
the number of readers, the method of Time Division Multiple Access (TDMA) is deployed. Here,
readers are allotted a particular time interval for communicating with the tag. The interference in
an RFID system can be classified into reader-to-reader interference and tag-to-reader interference.
In the first case, there is interference of frequency transmitted by one reader with that of the other
reader. While in the latter case, the interference is due to the communication of more than one
reader with the same tag at the same time. All the above problems of interferences can be tackled
by the use of optimized algorithms for reader sequencing using frequency allocation or TDMA
techniques. A possible solution may be to vary the power transmitted by the reader. This will vary
the interrogation zone of the reader and will avoid collisions with other readers, though
algorithms to vary the power transmitted by the reader have not been developed yet [10] .
When individual system performance is not satisfactory, it is advisable to bring
redundancy to the system. Low read rates of RFID systems make the deployment of redundant
antennas and tags to identify the same object an imperative. Redundant tags are those tags that
carry identical information performing identical functions. Dual tags are tags connected to each
other having one or two antennas and with/without individual or shared memory, n tags serving
the same purpose as that of dual tags can be used for beneficial use of multiple tags in product
identification.
It is observed that both the inductive coupling and backscatter based tags have a
dependency on the angle of orientation of tag relative to the reader. Placement of two tags in two

10
flat planes, three tags in the three dimensional axes four tags along the faces of a regular
tetrahedron, and so on, can help in achieving the above mentioned goals.
In the case of both induced coupling as well as backscatter based tags, it is observed that
the absolute increase in voltage factor increases with an increase in the number of tags, though
the backscatter based tags have higher increases as compared to the inductive coupling based tags
[11]. Even though adding one extra tag or two may be beneficial in increasing the induced
voltage on a tag, adding four or more tags does not guarantee a substantial increase in angle of
incidence and in turn, increase in the induced voltage on a tag. Multi tag RFID systems help
increase the fraction of maximum power by 0.88 times and increase the read distance by up to
1.63 times [3]. This method has practically no effect on the binary and binary tree walking
algorithms used by the RFID readers for “tag singulation” but requires twice as much time for
singulation if the reader uses the randomized tree walking, slotted-terminating adaptive collection
(STAC) and slotted Aloha algorithm based readers.
2.2 Experimental Specification of RFID System Parameters
The second category of studies concentrates on the increase in application feasibility of
RFID systems through an industrial engineering perspective. In such studies, the RFID hardware
is treated as a black box and the environmental factors or factors that can be tuned without
changing the system hardware are optimized to improve RFID system performance. Such studies
usually involve the performance measurement of RFID systems under different test conditions
and optimizing the results obtained for increasing the system performance. There are many
approaches to perform such studies, but the most favorable one is the approach of statistical
analysis using tools such as ANOVA, Design of Experiments, Two Key Testing, SPC, pre-
control, etc. [12].

11
The most important issue in conducting experiments with RFID systems using the above
tools is the lack of proper methodology, without which it is quite difficult to delineate inferences
from the data available through the studies. One of the approaches is to conduct laboratory
experiments using various endurance and performance tests and trying to replicate the same
results in real world environments. A diligent approach [12] used for laboratory testing of RFID
systems involves the following tests,
1. Capture Zone Test
2. Tag Separation Test
3. Tag Orientation Test
4. Multiple Tags in Antenna’s Capture Zone Test
5. Single Tag in Motion at Low Speed
6. Single Tag in Motion at High Speed
In real world applications the following tests are conducted:
1. Single Tag Mounted on Empty Container
2. Single Tag Mounted on Filled Container
3. Multiple Tags Mounted on Filled Containers on Pallet
4. Plastic Shrink Wrap
5. Forklift Transport
6. Conveyor Test
The capture test consists of testing a single RFID tag in the 180° circumference of the
base antenna. Tag read-rates is tested in X-Y, Y-Z, and X-Z planes. Each plane is divided into
eight zones of 45° each. The output is measured in terms of distance at which the read rate
(number of successful reads/number of read samples) is 100%.

12
The separation test is conducted to find out the minimum distance between two tags, such
that both the tags get read at a 100% read rate. In the measurement, one tag is fixed at an arbitrary
position, and another tag is kept directly over it. Then, the tag is moved circumferentially over the
fixed tag at eight different angles. The moment the read rate falls below 100%, the movable tag is
moved away from the fixed tag by a distance of 1cm and again the read rates at eight different
locations are found out. This procedure is conducted until the read rate of 100% is achieved or
until the distance between the tags exceeds 5 cm.
The tag orientation test consists of tilting the tag circumferentially along the three planes
X-Y, Y-Z, and X-Z. The maximum number of tags that can be present within an antenna’s
capture zone, without any drop in performance is found. The transmitting antenna is kept at a
maximum distance obtained from the capture zone test. Tags are added, one by one, to a
cardboard mounting surface which is positioned in the X-Z plane. The distance between two tags
is obtained from the tag separation test.
The read-rates of tags under the influence of speed is found out through a single tag in
motion at low speed test. Here, the tag is mounted on a drum rotated at a speed of less than 10
kmph. The base antenna is mounted at a position corresponding to a distance obtained from the
capture test. The drum is rotated along the X-Y plane, and the base antenna is placed
perpendicular to the X-Z plane. The drum is rotated with increases in speeds from 0 kmph to 10
kmph, and tests are conducted until the read rate falls below 100%
After this test, the tag is tested at higher rotational speeds using the same methodology as
above, except that the base antenna is positioned at half the maximum distance recorded in the

13
capture zone test. The drum is initially started at 10 kmph, and its speed is increased in the
increments of 10 kmph until the read rate falls below 100%.
In real world environmental testing, a single tag is first placed on an empty container, and
various sizes and types of materials are tested. Tests are conducted on containers made up of
cardboard, steel, plastic, aluminum, and glass. The sizes of the containers are fixed either to be
cubical or cylindrical. A tag is mounted on a cubical container on one of the faces and presented
in six different orientations, while a tag is placed on a cylindrical container and rotated in
increments of 45°.
In the filled container test, the container is filled with liquids like formaldehyde or
hydraulic fluids and packed in packaging material like bubble wrap, perlite, and item in
containers like aluminum cans, cardboard boxes, etc. The filled containers are initially placed at
half the distance achieved in the capture zone test. The case of multiple tags mounted on filled
containers is the same as that of the multiple tag test done in the laboratory experiments, except
the tagged containers are placed on pallets and at randomized orientations, and each pallet is
tested in four different orientations. The pallet is then wrapped with plastic wrap and then
transported by a forklift, and the containers are tested on a conveyor.
It is observed that when the tag is parallel to the reader antenna, it yields maximum read
rates, while the read rate decreases when the tag orientation changes. One way to overcome this
problem is to develop a scan tunnel that can hold multiple antennas (perpendicular to each other)
so that the tag is always parallel to at least one antenna. Tags placed directly on metals or on
liquid filled containers have large reductions in read rate. This is caused due to reflection of RF
waves in erratic directions by metal surfaces. To counteract this problem, one needs to place the
tag at a slightly offset (increasing the air gap between the tag and metal) from the metal container

14
or liquid filled containers. The maximum number of tags that could be read when placed close to
one another is seven, which means that a pallet with not more than seven (7) tags on it will be
read consistently by the current RFID system [12]. This is a very specific answer to the multiple
tags scenario, and the results might vary with changes in environmental factors. RFID systems
have a maximum read range of 559 to 610 mm under any environmental factors.
Another study revealed that a consistent 100% read rate can be obtained when the tag
density is four, and as the tag density increases, the read rate decreases to as low as 96% for a tag
density of 60 tags [13]. A fairly consistent read rate of around 99% is observed until the number
of tags is below 30. The authors also suggest that the running time in tag identification for a set of
60 tags close to each other but well inside the optimized field coverage of the antenna, is 6000
milliseconds. The theoretical read time is almost the same [13]. The tests were conducted in an
absorbing environment.
Apart from field strength, type of modulation, number of tags, speed, and environmental
factors, read range is also dominated largely by the design of the antenna coil of an RFID tag. As
shown in Figure 3, the graph of identification distance vs. diameter of antenna coil of the tag,
though not linear, shows that the form factor (size of the tag) does play an important role in
determining the read range of any tag [14].

15
Figure 3: Read range dependence on form factor [14]
Tests suggest that a tag with an antenna diameter of 18 mm has an identification distance
or read range just above 500 mm when tested in real world environments like hospitals and
warehouses. Under such conditions, there is a substantial effect of metals and liquids on read rate.
Quite often the protective layers or wrappings around a tag affect its read range. It is also
possible that the presence of metals, plastics, foam, etc., has an adverse effect on the read rate as
well as read range. It is observed that tags covered with wooden blocks from all sides have zero
read-rates. A possible reason for this drop in read rates is because wood block most of the
incident RF waves. Proximity of metals reduces the tag read-rates by more than 50% as compared
with non-occluded tags. Tags placed under ceramics have reduced accuracy and less read-rate as
compared to non-occluded tags. Even in static environments, the mean read-rate of the RFID
system has high standard deviation which shows that the system has low precision. Any line of
sight occlusion (involving metal) between a tag and any of the receivers results in the occluded
receiver not even detecting the tag. Hardened plastic, foam and plastic wrap have little effect on
tag read-rate probabilities [15]. It is suggested that the precision and accuracy of tag read-rate
probabilities and positioning can be improved by deploying one or more of the following
measures:

16
1. additional tagging
2. higher frequency ranges
3. additional receivers
4. improvement in post processing of data
A study was conducted by researchers at the Spokane Research Laboratory to reduce the
number of accidents in a metal/nonmetal mine in Washington [16]. Experiments were conducted
with different safety tools and ways to increase the safety at the site. Some of the potential
devices considered were RFID systems, radars, close circuit (CC) TVs and backup alarms. The
use of RFID systems seems to be the most promising solution to the above mentioned problem. A
properly designed RFID system can solve many problems associated with the use of radars, CC
TVs and backup alarms. It has a minimal chance of false alarm. If a pedestrian worker possessing
a tag is in the vicinity of the mining equipment, readers mounted on the equipment will alert the
operator. An active RFID system is used in this application. First, a spectral analyzer was used to
find the approximate read range of the RFID system, and then actual experiments conducted
revealed that 100% read rate was achieved up to a range of 7 ft. Detection of tag also depends on
the physical orientation of the tag [16].
Apart from the above criteria, the data transmitting speed of a tag also, affects its read
rate. A 64-bit tag with a data transmitting capacity of 16 kbps has higher read range and read rate
even at higher tag speeds as compared to a tag with a transmitting speed of 32 kbps and 64 kbps.
Furthermore, the average access time for a tag also increases with increase in data carrying
capacity of tag [17].
Tests are also conducted to assess the performance of RF systems placed in the proximity
of different materials, like foam, plastic, liquids, consumable solids, etc. One such study [18]

17
gives interesting insights on case level tagging. Tags were tested to find out the effect of tag
orientation and product variation on tag read-rate probabilities. Four basic tests were conducted,
which are:
1. Package Content – Total Reads
2. Tag Orientation – Total Reads
3. Package Content – Trials with 100% Reads
4. Tag Orientation – Trials with 100% Reads
Each test was conducted using empty cases, Foam-In-Place (FIP) cases, rice cases, empty
bottle cases, and water bottle cases. Tags were placed each time in four different orientations on
the cases, viz., outward, inward, forward, and downward. Outward location means the tags are
placed on the front row of the pallet and so on for all other orientations. Each test was conducted
for 25 times with the reader placed on wooden portals and the cases placed on a pallet unitized
using a single layer of stretch wrap. A truck would carry the pallet at a top speed of 3.5 mph.
When conducting the tests, the pallet truck, facing forward, was brought to full speed before
entering the RFID systems, read range. Rice bottles had some headspace in the cases while the
bottle cases did not. Firstly, a read range test was conducted on the readers to validate the effect
of tag orientation at different read ranges, and a spectrum of range was plotted.
Observations from the first (Package Content –Total Reads) test are summarized in
Figure 4, those from the tests on Tag Orientation vs. Total Reads are summarized in Figure 5,
those regarding package contents are shown in Figure 6, and the effects of tag orientation are
observed in Figure 7.

18
Package Content - Total Reads
0.00%
20.00%
40.00%
60.00%
80.00%
100.00%
120.00%
Empty
Cases
FIP
Cases
Empty
Bottle
Cases
Rice
Cases
Filled
Bottle
Cases
Test Product
Readability
Figure 4: Effect of package content on total reads [18]
Tag Orientation - Total Reads
0.00%20.00%
40.00%60.00%80.00%
100.00%120.00%
Outward
Inward
Forward
Upward
Downward
Outward
Inward
Forward
Upward
Downward
Outward
Inward
Forward
Upward
Downward
Outward
Inward
Forward
Upward
Downward
Outward
Inward
Forward
Upward
Downward
Empty
Cases
FIP Cases Empty
Bottle
Rice Cases Filled Bottle
Cases
Tag Orientation
Readability
Figure 5: Effect of tag orientation on total reads [18]

19
Package Content- Trials with 100%
Reads
0.00%20.00%
40.00%60.00%
80.00%100.00%
Empty
Cases
FIP
Cases
Empty
Bottle
Cases
Rice
Cases
Filled
Bottle
Cases
Test Product
Percentage of 100 %
Reads
Figure 6: Effect of package content on 100% reads [18]
Tag Orientation - Trials with 100%
Reads
0.00%
20.00%
40.00%
60.00%
80.00%
100.00%
120.00%
Outward
Inward
Forward
Upward
Downward
Outward
Inward
Forward
Upward
Downward
Outward
Inward
Forward
Upward
Downward
Outward
Inward
Forward
Upward
Downward
Outward
Inward
Forward
Upward
Downward
Empty
Cases
FIP Cases Empty
Bottle
Rice
Cases
Filled
Bottle
Tag Orientation
Percentage of 100 %
Readability
Figure 7: Effect of tag orientation on 100% reads [22]
The above results are summarized as follows:
1. empty cases and empty bottle cases have practically no effect on read-rate probabilities under
orientation
2. rice bottles and filled bottles largely affect the tag read-rate probabilities

20
3. the lower the layer of cases on a stacked pallet, the lower is the tag read-rate probabilities
4. the closer the tag is to the pallet jack, the lower is its read-rate probabilities
5. read-rate probabilities of cases with filled water bottles can be increased by changing the tag
orientation to “forward”
6. strategic tag orientation and/or location can minimize the limitations of RF physics
The study is limited by the inconsistency of tag quality, individual properties of the
material inside the cases, and tag detuning due to interferences.
Until this stage, we only considered the effect of individual tags on tag readability of
other tags in their vicinity. But, this is not the case when two or more tags are used to serve the
same purpose. Multiple tags can be used to identify the same product, thereby increasing the
induced voltage on a tag, increased read range, increased product memory, and increased
reliability, availability and durability of the system [11] .
Transient market conditions and upcoming mandates drive the requirement of
benchmarking the RFID techniques for comparing the performance of various RFID systems
[19]. One such study says that there must be two benchmarking techniques: one for reading and
the other for writing of passive UHF tags. The study measures the tag performance under various
test conditions like [19]:
1. read range
2. orientation
3. tag quality
4. read speeds in isolation
5. read speeds in population
6. frequency response

21
The benchmarking in writing a tag is measured under the following test parameters
1. reliability
2. write speed
The response rate is measured against the attenuation of transmitted power, and it is found that
the response rate falls below 100% after the end of the “strong field zone”, which occurs at an
attenuation of 12 dB and at a distance of 11.7 ft. The tag stops responding after a distance of 18.5
ft or power attenuation levels above 16 dB. It is also observed that a good quality tag is readable
in the strong field zone even at high attenuations.
The time required to first read a tag is higher for a Class 1 tag than a Class 0 tag. The first
few tags are read quickly. About 2/3rd of the n tags are read linearly with time, and the remaining
1/3rd tags require exponential amounts of time to get read. Its is also observed that for an
individual tag in a population, the read rate reduces exponentially with the number of tags for the
Class 1 category, and the same is observed for a Class 0 tag but with much higher ranges of read
rate.
In the proximity of metals, the tag performance is based on the separation distance from
the tag and the metal surface. All tags become unreadable, even if the separation distance is
reduced below 2.5 mm. Tags in proximity of water have an erratic behavior as compared to the
same tag placed in free air. The read distance increases almost linearly with the increase in
separation distance.
As the UHF frequency hops between its bandwidth when the tag is placed in front of
metals, the read range also changes. An increase in the separation results in increase in read

22
range. As the separation is decreased, the performance decreases rapidly at higher frequencies
(e.g. 955 MHz) as compared to that at lower frequencies (e.g., 902 MHz).
In spite of all these significant improvement measures, none of the papers try to develop a
link between EM based theoretical advances and practical/statistical tools to develop and validate
a generalized model for measuring RFID system performance.

23
Chapter 3
Research Gaps, Problem Description and Approach
The EM based design approaches aim at improving hardware and the antenna to
maximize the power available at the tag. The Friis free space power model is extensively used as
the basis for most of these design approaches. However, the models used for design purposes
have limitations for estimating RFID system performance in complex fields. Hence,
computational and statistical approaches are commonly used.
Further, the analytical and deterministic computational models do not predict the
performance metrics such as read rates that are emerging as industry standards for evaluating
RFID systems. Elaborate experimentation and testing are usually employed for benchmarking the
performance of an RFID system. Experimental approaches have the following shortcomings for
performance estimation: (1) large sets of experiments consisting of several replications are
necessary to estimate ordinate performance variables such as read rates, and (2) the resulting
models have limited generalizability, i.e., the results cannot be extrapolated to the parameter
value beyond the chosen experimental ranges. The model structures are not physically motivated;
hence, little insights in the underlying EM phenomena may be gathered from experimentation
results.
The presented approach tries to overcome the predictability limitations of largely
deterministic, current analytical models, as well as the generalizability limitations of the
experimental models. The approach is based on considering the uncertainties prevailing in the

24
various tag and reader circuit properties, as well as electromagnetic (EM) propagation parameters
and incorporating these as part of an extended Friis free-space model.
The objective of this thesis is to derive a statistical approach towards systematically
designing an effective RFID system for warehouse applications. This study has a three step
approach:
1. formulation of a RFID system performance model to predict read-rates at different read
ranges, tag orientation relative to reader antenna, and relative tag-reader motions
2. validating the model developed in step one using physical experiments
3. development of an advanced and more generalized model that takes into account the effect of
antenna attenuation along with all other factors as in steps 1 and 2
Formulation of RFID system performance has been carried out using two different
approaches. A statistical multiple regression approach to model RFID system performance is
presented in Chapter 4. A new approach based on combining EM theory with statistical modeling
is presented in Chapter 5. The limitations of tags affixed on metals not being read are addressed
by a new set of techniques in Chapter 6.

25
Chapter 4
Statistical Analysis for Performance Measurement of RFID
Systems*
4.1 Introduction
Design of Experiments (DOE) is a systematic approach for investigation of a system or
process. It is a structured, organized method for determining the relationship between factors (Xs)
affecting a process and the output of that process (Y). The Xs will henceforth be called as Key
Process Input Variables (KPIVs) and Ys will be called as Key Process Output Variables
(KPOVs). For each KPIV, a number of levels are defined that represent the range for which the
effect of that variable is desired to be known. An experimental plan is produced that tells the
experimenter where to set each test parameter for each run of the test. The KPOV is then
measured for each run. The method of analysis is to look for differences between KPOV readings
for different groups of the KPIV changes. These differences are then attributed to the KPIVs
acting alone (called a single effect) or in combination with another input variable (called an
interactions).
We use the following procedure from identification of KPIVs to drawing conclusions
based on DOE studies:
1. Determine all process input variables (PIVs) that affect the performance of RFID systems
* This portion of the document is an extension of [20] Govardhan, J.M., et al., Statistical Analysis and Design of RFID Systems for Monitoring Vehicle Ingress/Egress in Warehouse Environments. International Journal for Radio Frequency Identification Technology and Applications (IJRFITA), 2006 Sent for Review.

26
2. Segregate the PIVs into categories like reader parameters, tag parameters, environment,
protocols, etc. by developing an Ishikawa diagram
3. Filter the PIVs to get a small chunk of input variables that are measurable as well as may
have maximum impact on the readability through a quality function deployment matrix
4. Decide the coding scheme, measurement details and levels of KPIVs
5. Decide the level of factorial experiments to be done depending on the nature of KPIVs, time
constraint, and methods for measurement of the KPIVs
6. Analyze the results by using ANOVA for identifying the most significant KPIVs
7. Perform a stepwise regression analysis to identify the effect of each KPIV over the KPOV(s)
8. Perform a response surface analysis for developing the model
9. Plot surface plots wherever there is an interaction between continuous KPIVs and interaction
plots for discrete KPIVs
An RFID system is influenced by many factors or Process Input Variables (PIVs). It is
important that correct factors are chosen to yield designs for successful implementation of the
vehicle monitoring systems. The current EM theoretical models are not tractable for capturing the
effects of these factors on the readability in real world environments. Statistical approaches are
therefore imperative for effective design of the RFID systems [19]. Further, different factors will
have significantly diverse influence on readability W only a select set of factors have major
influence. Therefore, for facilitating tractable statistical analysis, these PIVs need to be filtered to
extract a more compact set of KPIVs.
• The tags used for this application must be durable, inexpensive and the user must be able to
use its conventions to write relevant data on the tag. So, we propose to use two types of tags EPC
Class 1 [21] and ISO 18000-6 compliant tags [22].
• Orientation of tag is the relative placement of the tag w.r.t. the field of polarization of the
reader’s antenna. This may be parallel and perpendicular or oblique to the EM field along various

27
planes of references as shown in Figure 8. The orientation is specified in terms of
angles )180 (0, and )90 (0, ),90 ,0( °∈°∈°∈ zyx θθθ .
Z
X
Y Reader
Tag
Figure 8 : Tag orientation (all angles at zero degrees)
• Form Factor refers to the size and shape of the tag antenna. It wields a significant influence
on the EM field envelope generated in presence of a reader and the tags, which in turn is the main
determinant of read-rates.
• Tag Collision is the effect of one or more tags responding to the reader signal at the same
time. This confuses the reader and requires complex algorithms such as binary tree method, etc.,
to distinguish between individual tags.
• Operating environment holds significant influence on read-rate probabilities. For example,
metal parts of a vehicle can hinder the free flow of information from the tag to the reader and vice
versa, by reflecting the waves in all directions. There are different tags for different purposes. A
θy
θx
θz

28
tag created exclusively for metallic environments, such as AWID’s ISO 18000-6 tag [23], works
better in such environments than a general-purpose tag. In addition, the presence of other tags and
reader antennas may cause an adverse effect on the EM field. Thus, the presence of more than
one reader antenna may become a PIV in the experimentation. All the PIVs dicussed above are
summarized in Table 1.
Table 1: List of PIVs
Sr. No. PIVs
Controllable(C) / Non
Economical or Difficult to
Change(N) / Fixed(F)
1 Orientation of tag (θy,(θz) C
2 Placement of tag (θx) C
3 Weather N
4 Vehicle type N
5 Frequency range F
6 Speed of vehicle C
7 Reader placement C
8 Reader make C
9 Tag make C
10 Form factor F
11 Electronics installed in the vehicle N
12 Tag collision N
13 Metallic environment N
14 Number of reader antennas C
15 Frequency used F
16 Standard compliance C
17 Tag functionality C

29
Similar to the input variables, we selected four output variables as shown in the Ishikawa
diagram in Figure 9. Tag read-rate probability is the most important output variable followed by
robustness to environmental conditions (taken as noise), compatibility with the common RFID
standards and lastly the cost of conducting this study.
Figure 9: Ishikawa diagram
A quality function deployment approach [24] was applied towards selecting the
appropriate KPIVs. The selection is done in two phases based on matrix based filtering common
to Quality Function Deployment (QFD).
In the Phase 1 matrix, PIVs are listed on the top row of the matrix. KPOVs are listed
along the first column, and their relative importance (one for least important and four for highly
important) is listed in column 2. Among these, tag read-rate, is defined in terms of the probability
that a given tag is read in a specified environment, of particular interest. Tag read-rate is
determined by the fraction of the times a tag is read in a designed experiment. The KPIVs are

30
weighted according to their influence on each of the KPOVs on a 9,3,1,0 scale (9 is the highest
and 0 is the lowest influence) [24]. The absolute technical importance is calculated by the
following formula,
∑=
×=ni 1 importance sKPOV' valueinfluence Importance Technical
Then, the PIVs are ranked in ascending order relative to their technical importance and
the PIVs with rank seven or less are chosen from the Phase 1 matrix (see Table 2). An arbitrary
cut off rank of 8 is chosen to eliminate all KPIVs higher than rank 8. KPIVs are further filtered in
Table 3.
Also, the interrelationship matrix (as shown in Table 4) is built in the following manner.
If the relationship between two PIVs is very strong, we say it as a highly positive relationship,
which is denoted by the symbol “▲” in the interrelationship chart. A loosely positive relationship
is denoted by “+”. If the relationship is weak, it is denoted by “W”; the case of no relationship is
denoted by “▼”.

31
Table 2 : Selection of KPIVs- Phase 1
TAG READER ENVIRONMENT
KPOVs
Importance(W
eight)
Form
Factor
Tag Placement/Position
(θx)
Tag Orientation
(θy,(θz)
Tag Protocol
Reader frequency
Reader M
ake
Number of Antennae
Reader-Tag Distance
EMI
Tag Density
Weather
Vehicle type
Vehicle Speed
Read-rate
(READ)
4 3[25] 9[1] 9[13] 9[15] 9[1] 9[1] 9[25] 9[25] 9[1] 9[25] 3[13] 3[1] 9[13]
Robust to Noise 2 1[4] 3[13] 3[1] 3[15] 9[25] 3[25] 9[25] 9[13] 3[1] 9[25] 9[13] 9[1] 3[1]
Compatibility (with
most common RFID
standards and
systems)
3 3[25] 3[1] 3[1] 9[15] 9[25] 9[13] 3[25] 1[25] 1[1] 1[25] 1[13] 1[1] 3[1]
Cost of study 1 3[25] 3[13] 3[1] 1[1] 1[25] 1[1] 1[1] 1[1] 3 1[25] 9[1] 1[1] 1[1]
Technical Importance 26 54 54 72 84 70 55 57 48 58 42 36 52
Rank
12 7 7 2 1 3 6 5 9 4 10 11 8
In Phase 2, we found that certain KPIVs are either fixed or not economical to change like reader frequency, and electromagnetic
interferences, while the number of read antennas already at their maximum number (two antennas). Hence all these KPIVs were eliminated
leaving us with seven KPIVs listed after the interrelationship diagram.

32
Table 3 : Selection of KPIVs - Phase 2
TAG READER ENVIRONMENT
KPOVs
Importance(W
eight)
Tag Placement/Position
(θx)
Tag Orientation
(θy,(θz)
Tag Protocol
Reader frequency
Reader M
ake
Number of Antennas
Reader-Tag Distance
EMI
Tag Density
Vehicle Speed
Read-rate (READ) 4 9 9 9 9 9 9 9 9 9 9
Robust to Noise 2 3 3 3 9 3 9 9 9 9 3
Compatibility (with most common
RFID standards and systems) 3 3 3 9 9 9 0 1 1 1 3
Cost of study 1 3 3 1 1 1 1 1 9 1 1
Technical Importance 54 54 70 84 70 55 58 66 58 52
Rank
7 7 2 1 2 5 4 3 4 6
Controllable [C] - Fixed [F] -Fixed
Maximum [M] – Not Economical to
Change [N]
C C C F C M C N N C

33
Table 4: Interrelationship Matrix of KPIVs
Highly Positive (▲),
Loosely Positive (+), No
relationship (▼), Weak
Relationship (K)
Form factor
Form
factor
Tag Placement/Position ▼[25]
Tag Placement/Position
(θx)
Tag Orientation +[4] ▼[4]
Tag Orientation
(θy, θz)
Tag Protocol ▼[26] ▼[25] +[13]
Tag Protocol
Reader frequency ▼[25] ▲[25] W[13] ▼[26]
Reader frequency
Reader Make ▼[25] ▲[4] +[13] ▲[27] ▼[26]
Reader M
ake
Number of Antennas +[25] +[13] W[25] ▼[15] W[25] ▲[26]
Number of Antennas
Reader-Tag Distance ▲[25] +[4] +[4] +[25] ▲[21] ▲[26] ▲[26]
Reader-Tag Distance
EMI +[1] ▼[1] +[13] +[1] +[25] +[13] ▲[25] ▼[25]
EMI
Tag Density W[13] +[4] ▲[26] +[9] W[25] ▲[26] +[14] ▼[27] W[1]
Tag Density
Weather W[4] ▼[25] W[13] ▼[25] +[25] W[26] +[15] ▼[13] +[25] ▼[26]
Weather
Vehicle type ▼[26] ▼[26] +[26] ▼[26] ▼[26] ▼[26] W[26] W[26] W[26] W[26] ▼[26]
Vehicle type
Vehicle Speed W[15] +[26] ▲[26] W[1] +[25] +[26] ▲[26] ▲[26] W[26] ▼[26] ▼[26] ▼[26]
Vehicle Speed

34
Tables 2 and 3 along with the interrelationship matrix summarized in Table 4, lead to a
conclusion on deciding seven KPIVs for the experimentation which are listed below:
1. Reader make
2. Tag make
3. Distance between tag and reader
4. Tag Placement angle (θx)
5. Tag Orientation angle (θy)
6. Tag Orientation angle (θz)
7. Speed of the vehicle
4.2 Experimentation Details
Experiments were conducted on an open space at the entry of a parking lot at Oklahoma
State University. The objective of these experiments is the following:
a) statistically quantify the relative influence of various KPIVs on tag read-rate probabilities,
b) propose the optimal combination of KPIVs that will enhance read-rate probabilities, and
c) propose a mathematical relationship connecting tag read-rate probabilities to the various
combinations of the KPIVs
Figure 10 shows an Alien reader held tag a distance of 508 mm from the EPC Class 1 tag,
mounted on the vehicle’s windshield.

35
Figure 11 shows an AWID reader held at a distance of 508 mm from the ISO 18000-6
tag. This setup is one of the various combinations of levels of KPIVs, required for the design of
experiments. Figure 12 shows an Alien reader connected to a computer system required to
extract the tag information from the reader. The connection from the reader to the backend
computer is accomplished through an RS 232 or an Ethernet port.
Alien® Reader
EPC Class 1 Tag
Figure 10 : Tag-Antenna (Alien) setup for experimentation

36
Figure 11: Tag-Antenna (AWID) Setup for Experimentation
Figure 12 : Reader to Computer System Connectivity
Some of the KPIVs were either insignificant or their interactions do not comply with their
hardware configurations. Lab experiments revealed that, the effects of tag placement (θx) and tag
orientation (θz) (the tag flipping) on read-rate probabilities are insignificant (hence, they were
ISO 18000-6 Tag AWID Reader

37
eliminated from the study). Furthermore, Alien® reader is incompatible with the ISO protocol
and the AWID reader works well, only with the ISO protocol, so tag make as cannot be used as a
potential KPIV. Hence a full factorial multi-level experiment was conducted with the following
KPIVs:
1. Reader Make
2. Distance between tag and reader
3. Speed of the vehicle
4. Tag Orientation (θy)
With reference to the datasheets of individual readers, and lab experiments, we confirmed
the read range distances for each reader. The levels of distance for each reader were determined
based on prior lab experiments. The details of the various KPIVs and their ranges are summarized
in Table 5 and 6. It is noteworthy that the reader make ‘R’ is ordinal, in that it is coded as 1 and 2
depending on whether the Alien or AWID reader is used. The distance ‘ r ’ is coded between
levels 1- 10, corresponding to the actual distances ranging from 508 mm to 4572 mm, as
summarized in Table 6. The speed ‘S’ is coded at three levels for 0, 16 and 32 kmph. θy is coded
in two levels, for 0° and 90°. A full factorial multi-level experiment with eight replicates was
conducted.
Table 5 : Levels of Distances for each Reader
Alien AWID
Distance (mm)
1270 508
2159 1143
2921 1828
3683 2540
4572 3175

38
Table 6 : Coding Scheme of KPIVs
KPIV Symbol Type
Range of
Interest
Level Coding
How
Measured
Alien® 1 Reader
Make R Ordinal
AWID®
2
2
Visual
508 1
1143 2
1270 3
1828 4
2159 5
2540 6
2921 7
3175 8
3683 9
Distance
(mm) r Continuous
4572
10
10
Measuring
Tape
0 1
16 2
Speed
(kmph)
S Continuous
32
3
3
Vehicle
Speedometer
0 1 θy
(degrees)
θy Continuous
90
2
2
Visual
4.3 Analysis of Experimental Results
Analysis of the experimental results is done in two parts. Stepwise regression analysis
was performed to identify the main factors. Next, a response surface regression analysis was

39
done, to facilitate detailed identification of significant main and interaction effects, and determine
optimal settings. The regression model is shown in the following equation,
ySrRySrRREAD θθ ⋅+⋅+−−−−= 14375.0 06869.0 45833.0 38125.0 16755.0 87778.004236.3 (5)
The model captures 78% (R-Sq (adj)) of variation in read-rate probabilities observed
during our experiments (See Table 7). Reader make (R) and the tag orientation (θy) seem to have
a strong influence on read-rate probabilities based on examining their relative magnitudes of all
KPIVs. Significantly, the joint effects of the reader make (R) and distances (r), as well as that of
speed (S) and tag orientation (θy), have a major effect on read-rate probabilities.
Table 7 : Response Surface Regression Analysis Results
Term Coefficient P
Constant 3.04236 0.000
R -0.87778 0.000
r -0.16755 0.000
S -0.38125 0.000
θy -0.45833 0.000
R*r 0.06869 0.000
S*θy 0.14375 0.001
S = 0.1934 R-Sq =79.4% R-Sq(adj) =78.3%

40
Distance r (mm)Distance r (mm)
Read-Rate (%)
457236833175292125402159182812701143508
90
80
70
60
50
40
30
20
10
0
Figure 13 : Interaction plot of read-rate (%) vs. distance r for different Reader Makes
Figure 13 summarizes the joint effect of reader make R and the distance r on tag read-rate
probabilities. The read-rate probabilities of the AWID reader to ISO compliant tags sharply drop
after 1143 mm (around 4 feet). The Alien Reader is able to read EPC compliant tags beyond 2540
mm. This might be because of the power level of the system. The higher the power radiated, the
larger will be its read range.
Alien
AWID

41
Speed (kmph)Speed (kmph)
Read-Rate (%)
32160
80
70
60
50
40
30
20
10
0
Figure 14 : Interaction plot of read-rate (%) vs. Speed for different Reader Makes
Figure 14 depicts the effect of reader make R and speed S of the vehicle on tag read-rate
probabilities. It can be inferred that the tag read-rate probabilities for the Alien reader with EPC
compliant tags drops consistently with the increase in speed from 0 to 32 kmph whereas the tag
read-rate probabilities for the AWID reader with the ISO compliant tags drops sharply after 0
kmph. There exists no significant nonlinearity between read-rate probabilities and speed of the
vehicle for both the read makes. It can be inferred that speed is a function of rate of change of yθ
relative to distance r (dt
ydθand
dt
dr).
AWID
Alien

42
Read-Rate (%)
900
70
60
50
40
30
20
10
0
Figure 15 : Interaction plot of read-rate (%) vs. tag orientation ( yθ ) for different Reader Makes
The effect of reader make R and yθ over tag read-rate probabilities is shown in Figure
15. Here we see that the tag read-rates for the Alien make reader with EPC compliant tags is
higher at °= 0yθ than at °= 90yθ . The AWID reader with ISO compliant tags has the same
effect as above when yθ changes from °° 90 to0 , but in the latter case, the tag read-rate is
considerably lower than in the case of the Alien reader. This is because when °= 0yθ , the tag is
oriented parallel to the reader antenna, while at °= 90yθ , the tag is oriented perpendicular to the
reader antenna. There is a maximum coupling when the tag is oriented in parallel than when it is
oriented perpendicular with respect to the reader antenna. The difference in tag read-rates for
different reader makes is due to the difference in power supplied by each reader to its antennas.
AWID
Alien
θy

43
Distance r (mm)Distance r (mm)
Read-Rate (%)
457236833175292125402159182812701143508
80
70
60
50
40
30
20
10
0
Figure 16 : Interaction plot of read-rate (%) vs. distance for different tag orientations ( yθ )
Figure 16 shows the combined effect of distance r and yθ over tag read-rates. The tag
read-rates decrease consistently with the change in yθ from °° 90 to0 for each distance level.
Tag read-rate is inversely proportional to the distance; hence, there is a polynomial fall in read-
rate probabilities with increase in distance.
Read-Rate (%)
900
70
60
50
40
30
20
10
Figure 17 : Interaction plot of read-rate (%) vs. tag orientation ( yθ ) at different speed settings
θy = 0°
θy = 90°
θy
0 kmph
16 kmph
32 kmph

44
Figure 17 shows the effect of Speed S and yθ over tag read-rate probabilities. It can be
inferred that the tag read-rates are highest at 0 kmph speed and lowest at 32 kmph speed. It can be
also concluded that the tag read-rate percentage decreases when yθ changes from °° 90 to0 .
There is a relationship between the speed at which the vehicle is moving and yθ . This is also
reflected in the regression model (Interaction between speed S and yθ ). This is because when the
vehicle is moving, yθ changes (i.e., at every position of the vehicle, yθ is different).
0
1
Read-rate (%)
0.00
0.5
1.0
0 20 Speed (kmph)1500303000
4500
Distance r (mm)
Figure 18 : 3D surface plot of read-rate (%) vs. distance r and speed
The surface plot of tag read-rate (%) vs. distance r and speed S is depicted in Figure 18.
The tag read-rate (%) decreases consistently with increase in speed and distance. At a speed of 16
kmph, when the tag is placed at a distance of 0 to 1828 mm from the reader, the read-rate (%)
does not vary much with respect to the distance. This region corresponds to a plateau in the
surface plot of Figure 18. The optimal value of tag read-rate can be achieved when the speed is 16
kmph and the distance is 2540 mm.

45
4.4 Concluding Remarks
The study focuses on deriving statistical characterization and models that lead to an
optimal design of an RFID system for a specific application of vehicle ingress/egress monitoring
in a warehouse environment. All the PIVs that are known to influence the tag read-rates of an
RFID system are considered, and a method based on quality function deployment (QFD) [24] is
used to systematically determine a compact set of KPIVs. From the study, the influence of
distance, tag orientation, speed of the vehicle, and reader make has been clearly delineated and
rationalized based on electromagnetism. It has been shown that the read-rate undergoes a
polynomial decrement with increase in distance (i.e., read range). In addition, the read-rate
decreases almost linearly with increase in speed. Maximum read rate is obtained when the tag is
placed in parallel with respect to the reader antenna, i.e., when °= 0yθ . Thus, statistical analysis
helps in determining an optimal value of distance, speed, orientation, and other KPIVs for a
particular implementation of an RFID system for ingress/egress monitoring.

46
Chapter 5
Analytical Modeling Approach
5.1 Introduction
According to the Friis free space model, power received at the tag antenna rP is given by
2
222
)4(
cos)1(
r
ySGGPP rttr
π
θλ−= (6)
where tP is the power transmitted by the reader antenna, tG is the gain of reader antenna, rG is the gain
of tag antenna, 2S is the power reflection coefficient, λ is the wavelength of in EM waves, yθ is the
angle made by tag antenna with reader antenna, r is distance between tag antenna and reader antenna.
Here, the maximum value of the effective isotropic radiated power (EIRP) of the reader antenna, where
ttGPEIRP = is provided by the manufacturer. The FCC regulations limit the upper bound of EIRP to 1W.
It is assumed that a tag is readable if rP exceeds a power threshold thP . When rP < thP , not enough power
is available for the tag to respond.
A typical reader antenna frequency is set to hop between 902 MHz to 928 MHz in channels, each
of bandwidth equal to 0.5MHz [28]. Over this frequency range, the values of 2S , λ , and thP are known to
undergo only a slight variation [29]. Significant uncertainty exists in the value of rG due to unknown tag
circuit parameter variations (e.g., detuning) due to uncertainties in the ambient media. It has been noted
previously that the value of rG is not deterministic and is known to vary between -6 dBi to +7 dBi [30].
Due to the nonplanar geometries of tag and reader antennae, as well as measurement methods affordable
in read world applications, uncertainty also exists in the determination of the value of yθ . It was further

47
observed that changes in the EIRP settings contribute to uncertainty in the gain of transmitter antenna tG .
Within each frequency hop we estimate rP using 5 samples. A band of +/-5% of the set value is taken
into account for uncertainty in measuring yθ . Additionally, propagation medium that encapsulates the tag
and the reader, which constitutes a non-ideal free space, has a significant influence on read-rate. To
account for the aggregation of uncertainties in rG and propagation medium, we assume a zero mean
normal distribution of rG with a +/- 4σ level set at a 7dBi and include a propagation factor α as a gain on
the variance to account for propagation uncertainty. Roughly α captures the observed variation in rP over
multiple reader scan cycles, each involving frequency hops over the range between 902-928 MHz as
further elaborated in the following section.
5.2 Experimentation Details Using Gen 1 RFID System
Experiments were conducted similar to those explained in Section 4.2 but using just one reader
(AWID MPR 2010 BR) and corresponding ISO 18000-6 tag. The KPIVs are explained in Table 8.

48
Table 8: Levels of KPIVs for Gen 1 RFID System
KPIV Symbol Type
Range of
Interest
Level Coding
How
Measured
508 1
1143 2
1270 3
1828 4
2159 5
2540 6
2921 7
3175 8
3683 9
Distance
(mm) r Continuous
4572
10
10
Measuring
Tape
0 1 θy
(degrees)
θy Continuous
90
2
2
Protractor

49
5.3 Results Using Gen 1 RFID System
Figure 19: Variation of power received at tag ( rP ) with frequency (f) at r = 508 mm and yθ = 0º with
Propagation Factor α =3
(a) (b)
Figure 20 : Variation of power received at tag ( yθ = 0º) with frequency (f) at r = 508 mm and (a) at
Propagation Factor α =0 (b) Propagation Factor α =50
Figure 19 shows the model’s prediction of variation of rP over the frequency range of 902 to 928
MHz at r = 508 mm and yθ = 0º. A tag is read only when value of rP values exceeds thP . The fraction of

50
times a rP value exceeds thP determines the probability of that tag is read at a given r and yθ , over the
specified operating conditions (e.g. levels of tag and propagation uncertainties, tag and reader parameters,
and the frequency hops). Table 9 compares mean read-rates obtained from the model with those measured
from the experiments at different value of r and yθ . It is observed that the tag read-rate decreases with
increase in distance r in both the model as well as experimental observations. Figure 20 supports the
concept of including a propagation factor α in the Friis free space expression. The figure (a) shows how a
Friis expression predicts the tag read-rate probabilities of 100 % at propagation factor α =0 while figure
(b) shows the tag read-rate probabilities of 74% at propagation factor α =50, within the given band of
frequencies and for a given setting. A comparison of the patterns decrement of tag read-rate with distance
r between the model and experiments is shown in Figure 21. It is observed that the mean read-rates
obtained through the experiments fall within the statistical band of read-rates as determined by the model.

51
Table 9: Summary of change in mean read-rate and its std. deviation with distance between tag and reader at EIRP = 1 W based on modeling approach
using GEN 1 RFID System
EIRP=1W
yθ = 0º yθ = 90º
Experiments Model Experiments Model Distance
(mm) Mean
Read-rate
Std.
Deviation
of Read-
rate
Mean Read-
rate
Std.
Deviation of
Read-rate
Mean
Read-rate
Std.
Deviation of
Read-rate
Mean
Read-rate
Std.
Deviation of
Read-rate
508 100 0 99.11 0.54 87.5 12.71 3.6238 1.1657
1143 84.17 11.94 82.5 1.83 0 0 0 0
1270 61.25 19.24 76.50 3.07 0 0 0 0
1829 49.17 21.51 55.25 4.71 0 0 0 0
2159 37.5 17.06 45.42 6.11 0 0 0 0
2540 51.25 17.17 37.79 3.51 0 0 0 0
2921 37.5 19.7 30.04 7.09 0 0 0 0
3175 27.92 12.58 28.04 7.11 0 0 0 0
3683 15.42 10.22 17.48 3.21 0 0 0 0
4572 0 0 7.30 2.22 0 0 0 0

52
0
20
40
60
80
100
120
508 1143 1270 1829 2159 2540 2921 3175 3683 4572Distance r (mm)
Read-rate (%)
UCL (Model) LCL (Model)
Mean (Experimental) Mean (Model)
Figure 21: Comparison of read-rates obtained from the model with those from experiments (Tag: AWID®
Gen 1, Model: Prox-Linc (MT APT 1014), Reader: MPR 2010 BR, EIRP =1W and yθ = 0º)
It is evident from Figure 22 that the tag read-rate at yθ =90 º, is close to zero due to the fact that
rP values have fallen well below the threshold power limit of the tag i.e., thP for almost all frequencies.
This is further verified from second part of Table 9. The presence of uncertainties in the propagation
media, the tag and reader parameters, and angle of orientation cause the tag to respond thus to the reader
signal, which the deterministic models fail to recognize. Figure 23 is comparison of mean read-rate from
model with those from experiments at yθ =90º. The model is able to capture read-rate variations for r >
508 mm. The possible presence of side lobes near yθ =90 º tends to make the model less predictive for r <
1000 mm.

53
Figure 22: Variation of power received at tag ( rP ) with frequency (f) at r = 1270 mm and yθ = 90º
0
10
20
30
40
50
60
70
80
90
100
508 1143 1270 1829 2159 2540 2921 3175 3683 4572Distance r (mm)
Read-rate (%)
UCL (Model) LCL (Model)
Mean (Experimental) Mean (Model)
Figure 23: Comparison of read-rates obtained from the modeling approach with those from experiments
(Tag: AWID® Gen 1, Model: Prox-Linc (MT APT 1014), Reader: MPR 2010 BR, EIRP =1W and yθ = 90º)

54
5.4 Experimentation Details Using Gen 2 RFID System
Additional experiments were conducted at the COMMSENS Lab, located in the Advanced
Technology and Research Center of Oklahoma State University using a Generation 2 RFID system.
These experiments were aimed at investigating tag read-rates under more complex sets of material
combinations in the ambient medium. The RFID system used Alien® Gen 2 reader ALR 9800. Here, the
RFID tag (from Alien Gen 2 squiggle tags ALL 9440 (98.2 mm x 12.3 mm) [31] was placed on plastic,
metal and cardboard containers that encapsulated plastic, metal, organic solids or organic liquids,
respectively, as summarized in Table 10. The EIRP of the reader was varied by changing the power
attenuation levels through Alien® Gateway Software. A full factorial experiment was designed using the
KPIVs and their respective levels shown in Table 11. See Figures 24 through 27 for the placement of tag
on different objects and the read-rate measurement procedure. Reader antennas are placed on a metallic
support and the whole setup is placed on the measurement table. The object to be tracked is first tagged
and then placed on a non metallic platform as seen in the pictures.
Figure 24: Placement of tag on plastic bag containing organic solid (noodles) stored in plastic bag and metal
cans in cardboard carton

55
Figure 25: Placement of tag on plastic bottle containing organic liquid (water) and plastic bottle stored in
plastic bag
Figure 26: Placement of tag on cardboard carton containing organic solid (noodles)
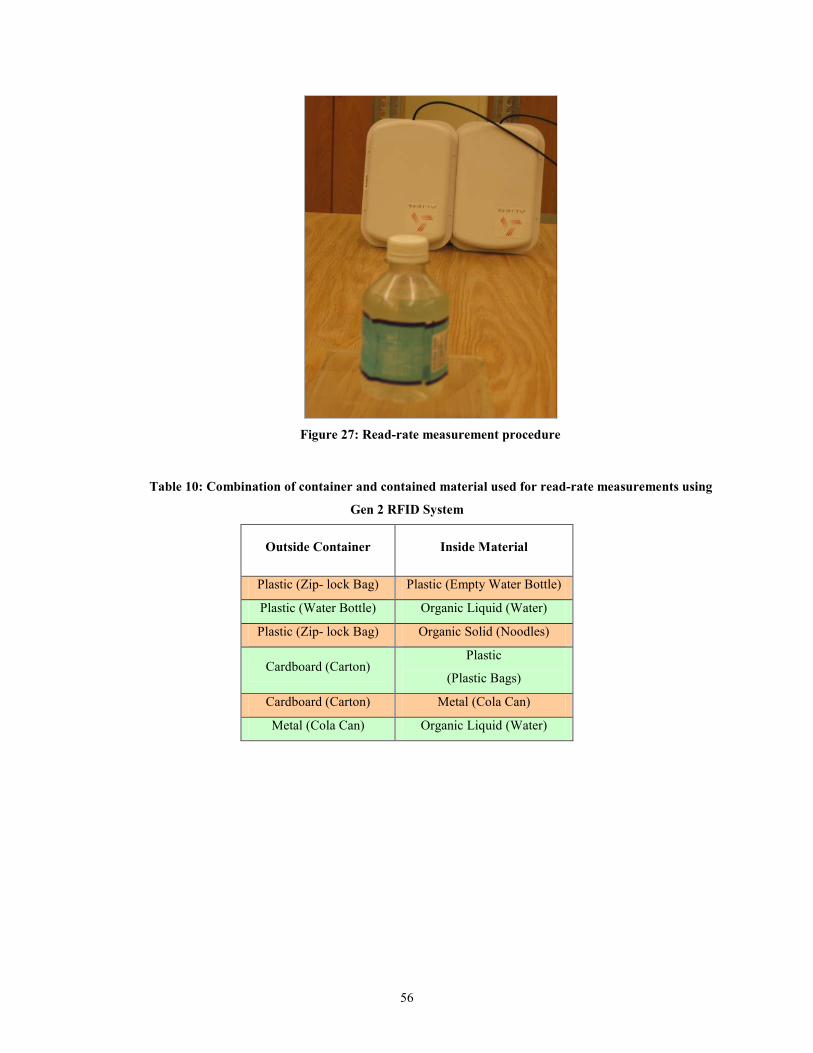
56
Figure 27: Read-rate measurement procedure
Table 10: Combination of container and contained material used for read-rate measurements using
Gen 2 RFID System
Outside Container Inside Material
Plastic (Zip- lock Bag) Plastic (Empty Water Bottle)
Plastic (Water Bottle) Organic Liquid (Water)
Plastic (Zip- lock Bag) Organic Solid (Noodles)
Cardboard (Carton) Plastic
(Plastic Bags)
Cardboard (Carton) Metal (Cola Can)
Metal (Cola Can) Organic Liquid (Water)

57
Table 11: Levels of KPIVs for Gen 2 RFID System
KPIV Symbol Type Range of
Interest Levels Coding
How
Measured
1 1
0.398 2 EIRP (W) ttGP Continuous
0.158
3
3
Alien®
Gateway
Software
508 1
1016 2
2032 3
Distance
(mm) r Continuous
3048
4
4
Measuring
Tape
0 1
45 2 Orientation
(degrees) yθ Continuous
90
3
3
Protractor
Metal 1
Plastic 2 Outside
Material
OM
Ordinal
Cardboard
3
3
Visual
Organic
Liquid 1
Organic
Solid 2
Metal 3
Inside
Material IM Ordinal
Plastic
4
4
Visual
5.5 Results Using Gen 2 RFID System
The model discussed earlier is able to predict read-rate probabilities of RFID systems under
certain environmental conditions. A single value of propagation factor α is able to justify the variations
in read-rate probabilities irrespective of EIRP, tag orientation and distance levels. Individual values of
propagation factor α for each environmental condition (outside container and inside material) which can
be seen in Table 12.

58
Table 12: Value of Propagation factor for combination of containers and contained materials at all EIRPs
using Gen 2 RFID System
Outside Container Inside Material
Value of Propagation
factor for all EIRPs
(α )
Plastic (Zip- lock Bag) Plastic (Empty Water Bottle) 22
Plastic (Water Bottle) Organic Liquid (Water) 10
Plastic (Zip- lock Bag) Organic Solid (Noodles) 4
Cardboard (Carton) Plastic
(Plastic Bags) 8
Cardboard (Carton) Metal (Cola Can) 20
The read-rates measured from the experiments, with a tag affixed to a plastic bag that contained a
plastic bottle, at different r, yθ and EIRP values are compared with the corresponding results from the
model in Table 14. As seen in Table 12, the α value is set at 22 for all EIRP values. The results show that
the model correctly captures both the mean read-rates and the standard deviation of the read rates with
and average 92% accuracy for mean read-rates. The experimental read-rate measurements were within the
3σ read-rate estimates from the model as summarized in Figures 28 through 30.
In the second case, RFID tag was placed on plastic bottle containing organic liquid (water) and
read-rates were measured for different values of r, yθ and EIRP. Table 12 shows the α value set at 10 for
all EIRP values. The experimental mean read-rates had an accuracy of 92% when compared with the
mean read-rates obtained from the model as summarized in Table 15 . Almost all the experimental read-
rate measurements were within the 3σ read-rate estimates from the model as summarized in Figures 31
through 33.
Thirdly, a tag were placed on plastic bag containing organic solids (noodles) and tested for
different values r, yθ and EIRP as seen in Table 16. The α value is set at 4 for all EIRP values. The
accuracy of experimental results and modeling data is reduced to 90% in this case. Experimental results

59
at EIRP of 0.398 W and 0.158 W falls within the 3σ read-rate estimates from the model as summarized in
Figures 34 through 36.
Fourthly, a tag was placed on cardboard box containing plastic bags at different values of r,
yθ and EIRP as seen in Table 17. As seen in Table 12 the α value is set at 8 for all EIRP values. Results
show that the model correctly captures both the mean read-rates and the standard deviation of the mean
read-rates with average 92.5% accuracy for mean read-rates. The experimental read-rate measurements
were within the 3σ read-rate estimates from the model as summarized in Figures 37 through 39.
Lastly, a tag was affixed on cardboard boxes containing metal can and tested at changing values
of r, yθ and EIRP as seen in Table 18. The α value is set at 20 for all EIRP values. Experimental mean
read-rates showed an unusual increase in read-rates at higher distances. The model was able to justify this
increase which is evident from Figures 40 through 42. The model predicted an accuracy of close to 88%,
which is seen prominently from the experimental results at an EIRP of 0.398 and 0.158 W. The model
was able to capture the experimental results within its 3σ limits.
Table 13 gives a summary of RMS errors in the predicted read-rates obtained from the model and
actual read-rate percentages from the experiments. It is quite evident that the model is able to capture
more than 90% of the variation in the actual read-rates. The table also shows that even at higher
attenuations or lower power ratings, the model is able to predict the read-rates with an overall accuracy of
91.58% and the model has a high degree of accuracy while predicting the read-rates for plastic bottles
stored in plastic bags (average accuracy =91.62%), plastic bottles containing organic liquids (average
accuracy =90.71%) and plastic bags stored in cardboard cartons (average accuracy =92.5%).

60
Table 13: Mean percentage error in actual (experimental) and predicted (modeling) read-rates for all
combinations of outside container and inside material at different values of EIRP
Root Mean Square (RMS)
error in actual
(experimental) and
predicted (model) read-rate
percentages
EIRP (W)
Outside
Container
Inside
Material
1 0.398 0.158
Average
Percentage
Accuracy
Plastic (Zip- lock
Bag)
Plastic (Empty Water Bottle)
7.56 8 9.6 91.61
Plastic (Water Bottle)
Organic Liquid (Water)
7.15 9.78 10.96 90.70
Plastic (Zip- lock
Bag)
Organic Solid
(Noodles) 18.16 4.15 8.98 89.57
Cardboard (Carton)
Plastic (Zip-Lock Bags)
9.45 10.61 2.44 92.50
Cardboard (Carton)
Metal (Cola Can)
11.74 12.6 10.1 88.52

61
Table 14: Summary of change in mean read-rate and its standard deviation with distance between tag and reader for plastic bottle stored in plastic bag
based on results obtained from model
EIRP=1W
yθ =0º yθ =45º yθ =90º
Experiments Model Experiments Model Experiments Model Distance
(mm) Mean Read-rate
Std. Deviation of Read-
rate
Mean Read-rate
Std. Deviation of Read-
rate
Mean Read-rate
Std. Deviation of Read-
rate
Mean Read-rate
Std. Deviation of Read-
rate
Mean Read-rate
Std. Deviation of Read-
rate
Mean Read-rate
Std. Deviation of Read-
rate
508 100.0 0.0 99.8 0.2 100.0 0.0 98.6 0.7 40.5 10.5 41.0 3.5
1016 95.8 2.3 96.9 1.0 54.3 8.2 73.3 4.9 22.9 2.1 32.6 4.5
2032 92.5 3.0 92.9 3.1 60.0 0.0 60.5 3.4 33.1 6.3 23.4 4.7
3048 85.6 4.5 87.1 4.2 40.0 0.0 45.5 2.9 22.5 1.9 17.4 2.1
EIRP=0.398W
yθ =0º yθ =45º yθ =90º
Experiments Model Experiments Model Experiments Model Distance (mm) Mean
Read-rate
Std. Deviation of
Read-rate
Mean Read-rate
Std. Deviation of
Read-rate
Mean Read-rate
Std. Deviation of
Read-rate
Mean Read-rate
Std. Deviation of
Read-rate
Mean Read-rate
Std. Deviation of
Read-rate
Mean Read-rate
Std. Deviation of
Read-rate
508 94.4 3.2 83.9 4.2 83.3 5.6 76.1 3.7 25.2 5.6 25.3 3.1
1016 95.2 3.3 82.0 4.5 56.4 14.9 43.5 4.4 14.8 5.7 17.2 3.0
2032 60.0 0.0 68.8 4.7 47.3 3.6 42.0 4.0 20.0 0.0 16.0 2.6
3048 59.5 4.5 52.1 4.0 40.0 0.0 32.9 4.1 2.8 2.3 8.4 2.5

62
EIRP=0.158W
yθ =0º yθ =45º yθ =90º
Experiments Model Experiments Model Experiments Model Distance (mm) Mean
Read-rate
Std. Deviation of
Read-rate
Mean Read-rate
Std. Deviation of
Read-rate
Mean Read-rate
Std. Deviation of
Read-rate
Mean Read-rate
Std. Deviation of
Read-rate
Mean Read-rate
Std. Deviation of
Read-rate
Mean Read-rate
Std. Deviation of
Read-rate
508 56.5 2.9 43.9 6.0 72.6 2.9 62.2 3.7 10.0 7.8 19.2 5.2
1016 51.7 1.6 38.9 5.0 13.9 9.8 25.0 4.8 1.5 1.8 14.8 4.5
2032 42.2 3.1 34.8 7.0 18.5 2.1 22.9 4.8 2.4 2.5 10.3 2.6
3048 20.8 3.8 33.6 4.8 20.8 2.2 22.1 3.6 1.9 2.3 1.3 0.7

63
0
20
40
60
80
100
120
508 1016 2032 3048Distance r (mm)
Read-rate (%)
UCL (Model) LCL (Model)
Mean (Experimental) Mean (Model)
0
20
40
60
80
100
120
508 1016 2032 3048Distance r (mm)
Read-rate (%)
UCL (Model) LCL (Model)
Mean (Experimental) Mean (Model) (a) (b)
0
10
20
30
40
50
60
508 1016 2032 3048Distance r (mm)
Read-rate (%)
UCL (Model) LCL (Model)
Mean (Experimental) Mean (Model) (c)
Figure 28: Comparison of read-rates obtained from the modeling approach with those from experiments for plastic bottle stored in plastic bag with
EIRP =1W and (a) yθ = 0º (b) yθ = 45º (c) yθ = 90º

64
0
10
20
30
40
50
60
508 1016 2032 3048Distance r (mm)
Read-rate (%)
UCL (Model) LCL (Model)
Mean (Experimental) Mean (Model)
0
10
20
30
40
50
60
70
80
90
100
508 1016 2032 3048Distance r (mm)
Read-rate (%)
UCL (Model) LCL (Model)
Mean (Experimental) Mean (Model) (a) (b)
0
5
10
15
20
25
30
35
40
508 1016 2032 3048Distance r (mm)
Read-rate (%)
UCL (Model) LCL (Model)
Mean (Experimental) Mean (Model) (c)
Figure 29: Comparison of read-rates obtained from the modeling approach with those from experiments for plastic bottle stored in plastic bag with
EIRP =0.398 W and (a) yθ = 0º (b) yθ = 45º (c) yθ = 90º

65
0
10
20
30
40
50
60
70
508 1016 2032 3048Distance r (mm)
Read-rate (%)
UCL (Model) LCL (Model)
Mean (Experimental) Mean (Model)
0
10
20
30
40
50
60
70
80
508 1016 2032 3048Distance r (mm)
Read-rate (%)
UCL (Model) LCL (Model)
Mean (Experimental) Mean (Model) (a) (b)
-5
0
5
10
15
20
25
30
35
40
508 1016 2032 3048Distance r (mm)
Read-rate (%)
UCL (Model) LCL (Model)
Mean (Experimental) Mean (Model) (c)
Figure 30: Comparison of read-rates obtained from the modeling approach with those from experiments for plastic bottle stored in plastic bag with
EIRP =0.158 W and (a) yθ = 0º (b) yθ = 45º (c) yθ = 90º

66
Table 15: Summary of change in mean read-rate and its standard deviation with distance between tag and reader for organic liquid stored in plastic
bottle based on results obtained from model
EIRP = 1W
yθ =0º yθ =45º yθ =90º
Experiments Model Experiments Model Experiments Model Distance (mm) Mean
Read-rate
Std. Deviation of Read-
rate
Mean Read-rate
Std. Deviation of Read-
rate
Mean Read-rate
Std. Deviation of Read-
rate
Mean Read-rate
Std. Deviation of Read-
rate
Mean Read-rate
Std. Deviation of Read-
rate
Mean Read-rate
Std. Deviation of Read-
rate
508 88.9 0.0 77.0 4.1 59.6 6.7 72.1 5.2 56.3 4.4 25.0 4.7
1016 55.6 0.0 71.4 4.5 55.8 1.6 55.4 4.5 41.8 1.7 29.3 7.3
2032 52.9 3.1 53.7 3.0 31.6 7.0 41.1 4.6 37.3 1.6 21.8 5.2
3048 37.4 2.1 45.6 3.6 21.2 4.7 34.9 4.4 1.3 1.4 6.3 1.9
EIRP = 0.398 W
yθ =0º yθ =45º yθ =90º
Experiments Model Experiments Model Experiments Model Distance (mm) Mean
Read-rate
Std. Deviation of Read-
rate
Mean Read-rate
Std. Deviation of Read-
rate
Mean Read-rate
Std. Deviation of Read-
rate
Mean Read-rate
Std. Deviation of Read-
rate
Mean Read-rate
Std. Deviation of Read-
rate
Mean Read-rate
Std. Deviation of Read-
rate
508 63.6 4.5 59.6 5.5 50.8 4.9 54.2 4.5 28.7 2.5 34.4 3.9
1016 52.5 7.6 46.7 7.0 25.8 5.4 36.7 5.5 30.5 1.9 27.5 7.7
2032 1.4 1.2 22.9 6.6 0.0 0.0 10.8 2.8 21.1 1.0 10.4 1.8
3048 0.0 0.0 14.7 6.4 0.0 0.0 3.6 2.5 0.0 0.0 3.3 1.3

67
EIRP=0.158 W
yθ =0º yθ =45º yθ =90º
Experiments Model Experiments Model Experiments Model Distance (mm) Mean
Read-rate
Std. Deviation of
Read-rate
Mean Read-rate
Std. Deviation of
Read-rate
Mean Read-rate
Std. Deviation of
Read-rate
Mean Read-rate
Std. Deviation of
Read-rate
Mean Read-rate
Std. Deviation of
Read-rate
Mean Read-rate
Std. Deviation of
Read-rate
508 56.7 2.9 49.3 7.5 40.0 2.5 38.2 4.1 16.0 3.9 16.0 3.9
1016 21.3 6.4 34.9 5.1 1.4 1.3 23.1 4.4 0.0 0.0 2.2 2.0
2032 0.0 0.0 14.2 4.5 0.0 0.0 15.2 4.8 0.0 0.0 3.7 0.9
3048 0.0 0.0 12.8 4.0 0.0 0.0 10.3 7.8 0.0 0.0 2.4 0.8

68
0
10
20
30
40
50
60
70
80
90
100
508 1016 2032 3048Distance r (mm)
Read-rate (%)
UCL (Model) LCL (Model)
Mean (Experimental) Mean (Model)
0
10
20
30
40
50
60
70
80
90
100
508 1016 2032 3048Distance r (mm)
Read-rate (%)
UCL (Model) LCL (Model)
Mean (Experimental) Mean (Model) (a) (b)
0
10
20
30
40
50
60
508 1016 2032 3048Distance r (mm)
Read-rate (%)
UCL (Model) LCL (Model)
Mean (Experimental) Mean (Model) (c)
Figure 31: Comparison of read-rate obtained from the modeling approach with those from experiments for organic liquid stored in plastic bottle with
EIRP =1W and (a) yθ = 0º (b) yθ = 45º (c) yθ =90º

69
-10
0
10
20
30
40
50
60
70
80
508 1016 2032 3048Distance r (mm)
Read-rate (%)
UCL (Model) LCL (Model)
Mean (Experimental) Mean (Model)
-10
0
10
20
30
40
50
60
508 1016 2032 3048Distance r (mm)
Read-rate (%)
UCL (Model) LCL (Model)
Mean (Experimental) Mean (Model) (a) (b)
-10
0
10
20
30
40
50
60
70
80
508 1016 2032 3048Distance r (mm)
Read-rate (%)
UCL (Model) LCL (Model)
Mean (Experimental) Mean (Model) (c)
Figure 32: Comparison of read-rates obtained from the modeling approach with those from experiments for organic liquid stored in plastic bottle with
EIRP =0.398W and (a) yθ = 0º (b) yθ = 45º (c) yθ = 90º

70
0
10
20
30
40
50
60
70
80
508 1016 2032 3048Distance r (mm)
Read-rate (%)
UCL (Model) LCL (Model)
Mean (Experimental) Mean (Model)
-20
-10
0
10
20
30
40
50
60
508 1016 2032 3048Distance r (mm)
Read-rate (%)
UCL (Model) LCL (Model)
Mean (Experimental) Mean (Model) (a) (b)
-10
-5
0
5
10
15
20
25
30
508 1016 2032 3048Distance r (mm)
Read-rate (%)
UCL (Model) LCL (Model)
Mean (Experimental) Mean (Model) (c)
Figure 33: Comparison of read-rate obtained from the modeling approach with those from experiments for organic liquid stored in plastic bottle with
EIRP =0.158W and (a) yθ = 0º (b) yθ = 45º (c) yθ = 90º

71
Table 16: Summary of change in mean read-rate and its standard deviation with distance between tag and reader for organic solid stored in plastic bag
based on results obtained from model
EIRP = 1W
yθ =0º yθ =45º yθ =90º
Experiments Model Experiments Model Experiments Model Distance
(mm) Mean Read-rate
Std. Deviation of Read-
rate
Mean Read-rate
Std. Deviation of Read-
rate
Mean Read-rate
Std. Deviation of Read-
rate
Mean Read-rate
Std. Deviation of Read-
rate
Mean Read-rate
Std. Deviation of Read-
rate
Mean Read-rate
Std. Deviation of Read-
rate
508 100.0 0.0 97.2 2.8 82.1 4.8 86.7 2.8 15.1 9.7 34.5 7.3
1016 76.7 1.3 77.9 3.3 26.5 8.8 72.6 4.1 32.4 9.9 33.8 3.8
2032 83.5 2.0 78.1 3.8 81.5 2.9 77.3 4.2 62.1 6.6 27.3 4.8
3048 71.8 3.6 70.6 4.3 55.8 4.0 68.5 4.9 7.2 5.2 6.3 2.2
EIRP = 0.398 W
yθ =0º yθ =45º yθ =90º
Experiments Model Experiments Model Experiments Model Distance
(mm) Mean Read-rate
Std. Deviation of Read-
rate
Mean Read-rate
Std. Deviation of Read-
rate
Mean Read-rate
Std. Deviation of Read-
rate
Mean Read-rate
Std. Deviation of Read-
rate
Mean Read-rate
Std. Deviation of Read-
rate
Mean Read-rate
Std. Deviation of Read-
rate
508 100.0 0.0 99.5 0.7 74.4 6.0 77.1 5.6 37.3 10.9 44.2 3.1
1016 100.0 0.0 93.8 4.4 57.5 10.3 68.9 4.4 32.0 5.7 35.3 2.3
2032 87.5 0.0 80.2 3.8 79.7 3.1 54.1 6.0 35.9 7.6 33.7 3.2
3048 57.1 5.1 56.8 6.0 43.9 3.0 45.7 1.4 1.9 2.0 0.2 0.2

72
EIRP = 0.158 W
yθ =0º yθ =45º yθ =90º
Experiments Model Experiments Model Experiments Model Distance (mm) Mean
Read-rate
Std. Deviation of Read-
rate
Mean Read-rate
Std. Deviation of Read-
rate
Mean Read-rate
Std. Deviation of Read-
rate
Mean Read-rate
Std. Deviation of Read-
rate
Mean Read-rate
Std. Deviation of Read-
rate
Mean Read-rate
Std. Deviation of Read-
rate
508 100.0 0.0 91.5 4.5 92.4 2.1 88.6 2.2 47.8 6.5 60.2 4.2
1016 98.6 1.4 86.8 4.3 76.4 3.7 82.6 0.8 60.7 4.6 49.5 4.4
2032 100.0 0.0 82.1 7.7 81.0 3.7 79.1 3.1 37.9 5.4 34.5 2.2
3048 90.4 4.1 82.1 4.7 68.3 3.7 70.1 4.1 0.0 0.0 4.1 1.5

73
0
20
40
60
80
100
120
508 1016 2032 3048Distance r (mm)
Read-rate (%)
UCL (Model) LCL (Model)
Mean (Experimental) Mean (Model)
0
10
20
30
40
50
60
70
80
90
100
508 1016 2032 3048Distance r (mm)
Read-rate (%)
UCL (Model) LCL (Model)
Mean (Experimental) Mean (Model) (a) (b)
-10
0
10
20
30
40
50
60
70
508 1016 2032 3048Distance r (mm)
Read-rate (%)
UCL (Model) LCL (Model)
Mean (Experimental) Mean (Model) (c)
Figure 34: Comparison of read-rate obtained from the modeling approach with those from experiments for organic solid stored in plastic bag with
EIRP =1W and (a) yθ = 0º (b) yθ = 45º (c) yθ = 90º

74
0
20
40
60
80
100
120
508 1016 2032 3048Distance r (mm)
Read-rate (%)
UCL (Model) LCL (Model)
Mean (Experimental) Mean (Model)
0
10
20
30
40
50
60
70
80
90
100
508 1016 2032 3048Distance r (mm)
Read-rate (%)
UCL (Model) LCL (Model)
Mean (Experimental) Mean (Model) (a) (b)
-10
0
10
20
30
40
50
60
508 1016 2032 3048Distance r (mm)
Read-rate (%)
UCL (Model) LCL (Model)
Mean (Experimental) Mean (Model) (c)
Figure 35: Comparison of read-rate obtained from the modeling approach with those from experiments for organic solid stored in plastic bag with
EIRP =0.398W and (a) yθ = 0º (b) yθ = 45º (c) yθ = 90º

75
0
20
40
60
80
100
120
508 1016 2032 3048Distance r (mm)
Read-rate (%)
UCL (Model) LCL (Model)
Mean (Experimental) Mean (Model)
0
20
40
60
80
100
120
508 1016 2032 3048Distance r (mm)
Read-rate (%)
UCL (Model) LCL (Model)
Mean (Experimental) Mean (Model) (a) (b)
-10
0
10
20
30
40
50
60
70
80
508 1016 2032 3048Distance r (mm)
Read-rate (%)
UCL (Model) LCL (Model)
Mean (Experimental) Mean (Model) (c)
Figure 36: Comparison of read-rate obtained from the modeling approach with those from experiments for organic solid stored in plastic bag with
EIRP =0.158W and (a) yθ = 0º (b) yθ = 45º (c) yθ = 90º

Table 17: Summary of change in mean read-rate and its standard deviation with distance between tag and reader for plastic bag stored in cardboard
carton based on results obtained from model
EIRP = 1W
yθ =0º yθ =45º yθ =90º
Experiments Model Experiments Model Experiments Model Distance
(mm) Mean Read-rate
Std. Deviation of Read-
rate
Mean Read-rate
Std. Deviation of Read-
rate
Mean Read-rate
Std. Deviation of Read-
rate
Mean Read-rate
Std. Deviation of Read-
rate
Mean Read-rate
Std. Deviation of Read-
rate
Mean Read-rate
Std. Deviation of Read-
rate
508 100.0 0.0 93.0 2.1 89.0 1.4 92.3 1.8 97.1 2.1 52.7 3.6
1016 88.9 3.7 89.9 2.6 84.4 3.5 84.8 2.1 55.3 4.4 47.3 9.8
2032 78.1 2.1 65.8 4.4 59.6 4.9 53.6 3.0 45.0 4.5 41.9 4.3
3048 64.9 5.2 45.3 6.9 30.8 2.0 35.4 5.6 38.6 2.8 30.1 4.1
EIRP = 0.398 W
yθ =0º yθ =45º yθ =90º
Experiments Model Experiments Model Experiments Model Distance (mm) Mean
Read-rate
Std. Deviation
of Read-rate
Mean Read-rate
Std. Deviation
of Read-rate
Mean Read-rate
Std. Deviation
of Read-rate
Mean Read-rate
Std. Deviation
of Read-rate
Mean Read-rate
Std. Deviation
of Read-rate
Mean Read-rate
Std. Deviation
of Read-rate
508 100.0 0.0 85.8 4.7 100.0 0.0 81.0 6.0 43.0 7.8 33.1 5.7
1016 83.4 3.8 66.5 5.9 71.4 2.0 57.3 4.9 26.2 8.5 21.0 2.3
2032 52.1 4.3 48.1 3.8 40.6 2.0 33.2 4.8 7.6 5.2 4.7 1.8
3048 37.5 0.0 30.3 3.7 1.6 1.6 8.7 3.2 0.0 0.0 0.4 0.2

77
EIRP = 0.158 W
yθ =0º yθ =45º yθ =90º
Experiments Model Experiments Model Experiments Model Distance (mm) Mean
Read-rate
Std. Deviation
of Read-rate
Mean Read-rate
Std. Deviation
of Read-rate
Mean Read-rate
Std. Deviation
of Read-rate
Mean Read-rate
Std. Deviation
of Read-rate
Mean Read-rate
Std. Deviation
of Read-rate
Mean Read-rate
Std. Deviation
of Read-rate
508 100.0 0.0 82.9 6.7 100.0 0.0 78.7 6.7 79.5 2.6 75.0 4.4
1016 100.0 0.0 77.9 5.2 80.7 2.6 76.2 6.4 74.5 4.2 70.4 3.3
2032 83.4 4.7 73.5 6.9 66.7 5.4 72.0 4.3 48.0 2.6 50.1 3.1
3048 44.5 3.1 46.8 3.5 23.8 4.5 24.6 1.8 0.0 0.0 1.6 0.7

78
0
20
40
60
80
100
120
508 1016 2032 3048Distance r (mm)
Read-rate (%)
UCL (Model) LCL (Model)
Mean (Experimental) Mean (Model)
0
20
40
60
80
100
120
508 1016 2032 3048Distance r (mm)
Read-rate (%)
UCL (Model) LCL (Model)
Mean (Experimental) Mean (Model) (a) (b)
0
20
40
60
80
100
120
508 1016 2032 3048Distance r (mm)
Read-rate (%)
UCL (Model) LCL (Model)
Mean (Experimental) Mean (Model) (c)
Figure 37: Comparison of read-rate obtained from the modeling approach with those from experiments for plastic bag stored in cardboard carton with
EIRP =1W and (a) yθ = 0º (b) yθ = 45º (c) yθ = 90º

79
0
20
40
60
80
100
120
508 1016 2032 3048Distance r (mm)
Read-rate (%)
UCL (Model) LCL (Model)
Mean (Experimental) Mean (Model)
-20
0
20
40
60
80
100
120
508 1016 2032 3048Distance r (mm)
Read-rate (%)
UCL (Model) LCL (Model)
Mean (Experimental) Mean (Model) (a) (b)
-10
0
10
20
30
40
50
60
508 1016 2032 3048Distance r (mm)
Read-rate (%)
UCL (Model) LCL (Model)
Mean (Experimental) Mean (Model) (c)
Figure 38: Comparison of read-rate obtained from the modeling approach with those from experiments for plastic bag stored in cardboard carton with
EIRP =0.398W and (a) yθ = 0º (b) yθ = 45º (c) yθ = 90º

80
0
20
40
60
80
100
120
508 1016 2032 3048Distance r (mm)
Read-rate (%)
UCL (Model) LCL (Model)
Mean (Experimental) Mean (Model)
0
20
40
60
80
100
120
508 1016 2032 3048Distance r (mm)
Read-rate (%)
UCL (Model) LCL (Model)
Mean (Experimental) Mean (Model) (a) (b)
0
20
40
60
80
100
120
508 1016 2032 3048Distance r (mm)
Read-rate (%)
UCL (Model) LCL (Model)
Mean (Experimental) Mean (Model) (c)
Figure 39: Comparison of read-rate obtained from the modeling approach with those from experiments for plastic bag stored in cardboard carton with
EIRP =0.158W and (a) yθ = 0º (b) yθ = 45º (c) yθ = 90º

81
Table 18: Summary of change in mean read-rate and its standard deviation with distance between tag and reader for metal cans stored in cardboard
carton based on results obtained from model EIRP = 1 W
yθ =0º yθ =45º yθ =90º
Experiments Model Experiments Model Experiments Model Distance (mm) Mean
Read-rate
Std. Deviation
of Read-rate
Mean Read-rate
Std. Deviation
of Read-rate
Mean Read-rate
Std. Deviation
of Read-rate
Mean Read-rate
Std. Deviation
of Read-rate
Mean Read-rate
Std. Deviation
of Read-rate
Mean Read-rate
Std. Deviation
of Read-rate
508 100.0 0.0 97.3 4.9 100.0 0.0 89.9 2.5 54.9 7.5 47.8 3.5
1016 81.4 1.5 95.8 4.2 54.6 4.6 48.8 5.2 43.1 4.6 44.9 5.5
2032 100.0 0.0 92.7 4.3 48.3 7.8 45.8 4.7 9.7 2.5 33.3 4.1
3048 100.0 0.0 89.9 4.3 54.5 2.8 45.3 4.0 45.1 4.2 30.1 6.2
EIRP = 0.398 W
yθ =0º yθ =45º yθ =90º
Experiments Model Experiments Model Experiments Model Distance (mm) Mean
Read-rate
Std. Deviation
of Read-rate
Mean Read-rate
Std. Deviation
of Read-rate
Mean Read-rate
Std. Deviation
of Read-rate
Mean Read-rate
Std. Deviation
of Read-rate
Mean Read-rate
Std. Deviation
of Read-rate
Mean Read-rate
Std. Deviation
of Read-rate
508 100.0 0.0 86.9 4.3 100.0 0.0 73.3 4.8 83.1 2.8 63.0 1.1
1016 89.5 2.9 77.3 5.3 71.2 2.6 66.6 4.2 49.8 5.7 49.4 2.5
2032 64.9 1.5 63.7 4.1 35.6 8.4 46.6 6.1 20.1 2.6 32.3 4.1
3048 68.1 5.0 59.2 3.8 31.2 1.8 27.8 3.2 19.9 5.4 11.1 3.2
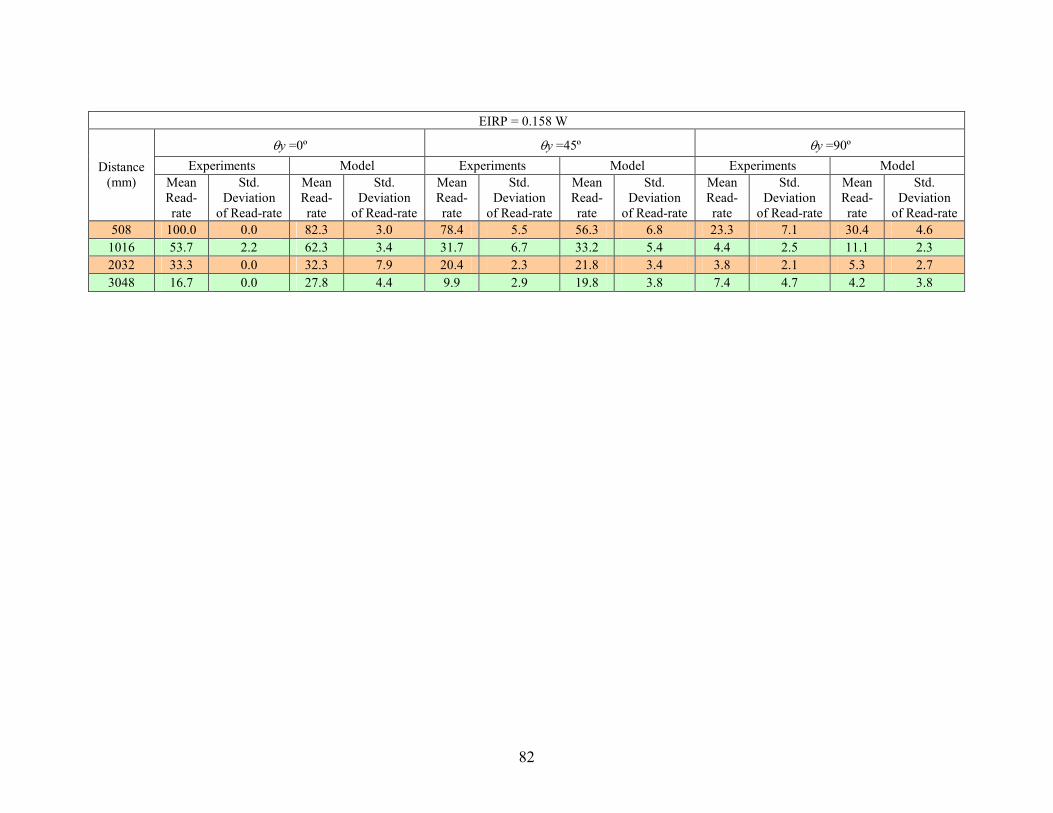
82
EIRP = 0.158 W
yθ =0º yθ =45º yθ =90º
Experiments Model Experiments Model Experiments Model Distance (mm) Mean
Read-rate
Std. Deviation
of Read-rate
Mean Read-rate
Std. Deviation
of Read-rate
Mean Read-rate
Std. Deviation
of Read-rate
Mean Read-rate
Std. Deviation
of Read-rate
Mean Read-rate
Std. Deviation
of Read-rate
Mean Read-rate
Std. Deviation
of Read-rate
508 100.0 0.0 82.3 3.0 78.4 5.5 56.3 6.8 23.3 7.1 30.4 4.6
1016 53.7 2.2 62.3 3.4 31.7 6.7 33.2 5.4 4.4 2.5 11.1 2.3
2032 33.3 0.0 32.3 7.9 20.4 2.3 21.8 3.4 3.8 2.1 5.3 2.7
3048 16.7 0.0 27.8 4.4 9.9 2.9 19.8 3.8 7.4 4.7 4.2 3.8

83
0
20
40
60
80
100
120
508 1016 2032 3048Distance r (mm)
Read-rate (%)
UCL (Model) LCL (Model)
Mean (Experimental) Mean (Model)
0
20
40
60
80
100
120
508 1016 2032 3048Distance r (mm)
Read-rate (%)
UCL (Model) LCL (Model)
Mean (Experimental) Mean (Model) (a) (b)
0
20
40
60
80
100
120
508 1016 2032 3048Distance r (mm)
Read-rate (%)
UCL (Model) LCL (Model)
Mean (Experimental) Mean (Model) (c)
Figure 40: Comparison of read-rate obtained from the modeling approach with those from experiments for metal cans stored in cardboard carton with
EIRP =1W and (a) yθ = 0º (b) yθ = 45º (c) yθ = 90º

84
0
20
40
60
80
100
120
508 1016 2032 3048Distance r (mm)
Read-rate (%)
UCL (Model) LCL (Model)
Mean (Experimental) Mean (Model)
0
20
40
60
80
100
120
508 1016 2032 3048Distance r (mm)
Read-rate (%)
UCL (Model) LCL (Model)
Mean (Experimental) Mean (Model) (a) (b)
0
10
20
30
40
50
60
70
80
90
508 1016 2032 3048Distance r (mm)
Read-rate (%)
UCL (Model) LCL (Model)
Mean (Experimental) Mean (Model) (c)
Figure 41: Comparison of read-rate obtained from the modeling approach with those from experiments for metal cans stored in cardboard carton with
EIRP =0.398W and (a) yθ = 0º (b) yθ = 45º (c) yθ = 90º

85
0
20
40
60
80
100
120
508 1016 2032 3048Distance r (mm)
Read-rate (%)
UCL (Model) LCL (Model)
Mean (Experimental) Mean (Model)
-10
0
10
20
30
40
50
508 1016 2032 3048Distance r (mm)
Read-rate (%)
UCL (Model) LCL (Model)
Mean (Experimental) Mean (Model) (a) (b)
-10
0
10
20
30
40
50
508 1016 2032 3048Distance r (mm)
Read-rate (%)
UCL (Model) LCL (Model)
Mean (Experimental) Mean (Model) (c)
Figure 42: Comparison of read-rate obtained from the modeling approach with those from experiments for metal cans stored in cardboard carton with
EIRP =0.158W and (a) yθ = 0º (b) yθ = 45º (c) yθ = 90º

5.6 Summary
An approach based on including uncertainty associated with the various components of an RFID
system as well as the ambient propagation medium, as part of the Friis free space model was able to
effectively predict read-date probabilities. As succinctly summarized in Table 13 it is evident that the
model is able to capture about 91.6% of the variations in the actual read-rates. The table also shows the
results hold for different attenuations or lower power ratings. The model has a high degree of accuracy
while predicting the read-rates for plastic bottles stored in plastic bags (average accuracy =91.62%),
plastic bottles containing organic liquids (average accuracy =90.71%) and plastic bags stored in
cardboard cartons (average accuracy =92.5%).
It is noteworthy that the complete trends of how read-rate probabilities vary with distance,
orientation and power levels for a given setting of materials, RFID system components and environment
can be captured using a Friis free space model with an appropriately chosen propagation factor. Based on
these results, it is evident that a combination of statistical approaches with analytical EM models
improves the extrapolation of RFID read-rates in a given environment. Only the propagation factor value
needs to be calibrated as one changes the operating conditions. The model approach is but a step towards
developing a robust methodology to predict RFID tag read-rates in complex industrial environments.
5.7 Concluding Remarks
Results obtained through the probabilistic analytical modeling of read rate based on the Friis free
space equation through a quantification of uncertainties provides new insights on the nature of tag read-
rates. This is not possible using the deterministic approaches to quantify tag read-rates done so far in the
literature. Furthermore, the verification of the closeness of the modeling approach with the experimental
observations described in Chapter 5 establishes the validity of the new modeling approach.

87
CHAPTER 6
Experiments to Improve Read-Rate Probabilities for RFID Tags in
Metallic Environments
6.1 Key Results
Perfect (i.e., 100 %) read-rate probabilities for tracking metal objects using RFID systems can be
achieved by placing a tag on the metal surface under the following conditions:
1 there exists an air gap of at least 1.5 mm between the tag and the metal surface and
2 the reader and the object being tracked are placed in a reverberation chamber with the tuner
rotating at a speed of 0.0145 revolutions per second.
The air gap with which we were able to achieve such perfect read-rates is at least 41-233 % less than the
thickness of air-gaps or isolators reported in the current literature and industry claims [32, 33]. It is
observed that for air gaps over 2 mm (33% more than what is suggested in this thesis), the tags tend to
bend or peel-off and the RFID system becomes unreliable.
Little success has been reported towards improving the read-rates of tags placed on metal objects
or tag present in highly metallic environments. The reason for this shortcoming of RFID systems in
metallic environments is that metals reflect incident electromagnetic (EM) waves and scatter them in all
directions [34]. This causes the tags in the vicinity of metals not to get enough power to respond to the
reader requests. It is required that the tag receives power ≥ thP , which is the threshold power to make
circuits in the tag to activate and respond back to the reader signals [30]. Some studies show that
including an isolator of 2.54 mm thickness between the tag and the metal surface can increase the read-
rate probabilities [33]. A recent research studies done at the University of Kansas suggest that a

88
specialized tag with a metal ground plate of 5 mm thickness is necessary to isolate the tag from the metal
surface for achieving higher read-rates [32]. Efforts are also being made to construct a large RFID tag to
nullify the effect of metals in the vicinity of the tags, for increasing the read-rate probabilities [35]. Using
such a thick isolator makes the tag unstable and vulnerable to bend and peel-off during normal operating
conditions. To improve the tag read-rate probabilities it is imperative to develop a set of techniques that
promotes read-rate probabilities of tags in such environments.
Experiments to investigate improvements in tag read-rate probabilities in metallic environments
were conducted by placing an Alien ALR9800 reader and Alien Gen 2 Squiggle tags (from the
COMMSENS lab) in a reverberation chamber located at the department of Electrical Engineering at
Oklahoma State University, Stillwater.
6.2 Experimental Setup
The reverberation chamber used in our experiments consisted of a metal enclosure in the shape of
a cuboid of dimensions 2133 x 762 x 1219 mm3. It has a tuner which is connected to a stepper motor. The
motor operation is controlled by a LabVIEW® program. The tuner has a maximum speed of 2000
steps/second with a 48000 steps circumferential sweep distance. The reverberation chamber has a useable
volume of 914 x 457 x 914 mm3 which is at a distance of 889 mm from the place where the reader is
placed. A top view of the reverberation chamber is shown below.
Reverberation Chamber
Usable Volume
889 mm

89
RFID tag (Alien Gen 2 Squiggle) is affixed on a metal cola can with the help of spacers (poster
tapes) so as to create an air gap of 1.5 mm between the tag and the metal surface (See Figure 45). The
reader antennas are placed in the reverberation chamber as shown in Figure 46. The metal can is placed
on a cardboard box so that there should not be a direct metal-to-metal contact between the metal can and
the floor of the reverberation chamber.
Figure 43: Reverberation Chamber
Figure 44: LABVIEW® program for controlling the tuner speed

90
Figure 45: RFID tag slapped on metal can using spacers
Figure 46: Placement of reader antennae in a reverberation chamber
6.3 Design of Experiments
The objective of these experiments is to study the variation of the read-rate probabilities of a tag
when affixed to a metal object and placed in a highly metallic environment of a reverberation chamber.
Screening experiments were conducted using five KPIVs, namely, EIRP of the reader, tag spacing,
distance between the tag and the reader, tag orientation, and tuner speed. As shown in Table 19, a full
factorial design of experiment study was conducted with each KPIV varying in three levels It was
Spacer
Tuner Reader
Antennas
Reverberation Chamber

91
observed that the distance, EIRP and tag orientation have little effect on variations in read-rate
probabilities. So the main experiments were conducted using only tag spacing and tuner speed as KPIVs,
each varying at three levels.
Table 19: Levels of KPIVs for Reverberation Chamber Experiments using Gen 2 RFID System
KPIV Symbol Type
Range
of
Interest
Level Coding How
Measured
1 1
0.398 2 EIRP (W) R Continuous
0.158
3
3
Alien Gateway Software
1 1
1.5 2
Tag Spacing
(mm) T Continuous
3
3
3
Vernier Caliper
889 1
1270 2 Distance
(mm) r Continuous
1778
3
3
Measuring Tape
0 1
45 2
Tag Orientation (degrees)
θy Continuous
90
3
3
Protractor
100 1
1000 2
Tuner Speed
(steps/sec) S Continuous
2000
3
3
LabVIEW Program
6.4 Results
It is observed that read-rate probabilities of a tag are zero percent in normal environmental
conditions. Figure 47 shows the variation of read rate probabilities with tag spacing and tuner speed
(rotations). It can be noticed that read rate probabilities reduce drastically when the tag spacing is reduced
below 1.5mm. It is also observed that a tuner speed of 2000 step/sec and a tag spacing of 1.5 mm ensure
consistent read-rate probabilities close to 100%. There is little effect of EIRP of the reader on read rate
probabilities. Direct contact or tag spacing below 1.5 mm makes the tag almost unreadable even at the
highest speed of tuner rotation and the highest EIRP setting. This effect of reduction in tag read-rates is
caused by the generation of eddy currents in the vicinity of the reader and tag. These eddy currents absorb

92
RF energy thus reducing the RF field on the tag. Moreover, these eddy currents are perpendicular to the
metal surface which further reduces the RF field [34]. Also, at some frequencies the energy reflected by
metals interfere with the RF field at the tag and the reader [34]. Experiments were also conducted at zero
tuner speed and the read-rate probabilities were found to be close to zero percent.
Table 21 shows that tag spacing below 1.5 mm yields zero read-rate probabilities even at the
highest tuner speeds, whereas tag spacing above 3 mm gives good (100%) read-rate probabilities even at
1000 steps/sec of tuner speed. It was also observed that a tag gets increasingly unstable and vulnerable to
peel off and wear at tag spacing more than 1.5 mm. There is no effect of changes in distance, tag
orientation and power setting.
Read-rate (%)
0.0
0.5
1.0
032
100010Tag Spacing (mm) 2000 Tuner Speed (steps/sec)
Figure 47: 3D Surface Plot of Tag Read rate (%) vs. Tag Spacing and Tuner Speed
Tuner Rotations =100 steps/sec

93
After the initial experiments, the tag was tested with just two KPIVs i.e., tuner speed and tag
spacing with lower denominations of tag spacing like 0, 0.5, 1, 1.5, and 3 mm (see Table 21). It is noted
that a tag spacing of at least 1.5 mm is required for getting the tag read in the reverberation chamber and a
tag spacing of 3 mm can yield perfect read-rates even at lower tuner speeds.
Table 20: Comparison of read-rate probabilities at different settings of tuner speed and tag spacing
Tag Spacing (mm)
Tuner Speed (steps/sec)
Read Rate (%)
0
0.5
1
100-2000 0
100 22
1000 94 1.5
2000 100
100 31
1000 3
2000 100
6.5 Concluding Remarks
The approach explained above gives a solution to the non readability of RFID tags in metallic
conditions or when used in tracking metal objects. It is imperative to use an isolating medium between the
tag and the reader but is not a complete solution to achieve 100% read rates. The use of a reverberation
chamber with tuner speed of 2000 steps/sec and an isolating medium of at least 1.5 mm thickness is
required. It is economically more viable to use a simple RFID tag with 1.5 mm thick spacers and slight
modifications in the conveyor to convert it into a reverberation chamber with a tuner than using isolator
based tags or large tags costing $14.83 [33] apiece which is at least 50 times more than the solution
suggested in this chapter. This technique, if implemented properly, will yield great industrial benefits and

94
long-term savings to by reducing shrinkage of inventories of metal objects and high value assets in major
industries like aviation and defense.

95
CHAPTER 7
Contributions and Future Work
7.1 Contributions
The thesis develops a statistical approach for designing RFID systems. It uses the classical design
of experiments approach to delineate interactions between individual system components including
distance and speed. The thesis also applied this approach for monitoring goods in a vehicle ingress/egress
monitoring systems in warehouse and manufacturing systems. This approach will serve as a useful tool
during the design of RFID systems in complex environments where analytical and computational models
often are inaccurate in capturing the prevailing fields.
An analytic modeling approach to predict read-rate probabilities of RFID systems in given
conditions is explained in this thesis. The approach modifies the Friis free space with the help of a single
factor (called propagation factorα ) that can be credited to be responsible for the uncertainties existing in
the ambient media, tag orientations, and effects of frequency hopping and power attenuation on the gain
of tag antenna. The thesis for the first time develops a link between the power calculated from the Friis
expression and the industry need for specifying performance in terms of whether a tag is read or not in a
given set of conditions. The resulting models were able to predict tag read-rates with an accuracy as high
as 92.5% (plastic objects stored in plastic bags) with a minimum accuracy of 88% (metal cans stored in
cardboard cartons) when compared to the experimental results.

96
To overcome the problem of non-readability of tags in metallic environments or when affixed to
metal objects, the thesis tries to explore the concept of reverberation of EM waves for the first time in
RFID system design. Following a series of statistically designed experiments, a technique to achieve
perfect read-rates from tags affixed to metals was specified. It consists of: an air gap of 1.5 mm between
the tag and the metal surface and the reader and the metal object being tracked are placed in a
reverberation chamber with the tuner rotating at a speed of 0.0145 revolutions per second. This result can
lead to more durable metal object tracking systems thereby reducing the operating costs by more than 50
times of the current costs incurred by the industries.
7.2 Future Work
The statistical methods and modeling approach discussed so far can be made more accurate for
RFID system performance estimation through the consideration of the following factors/concepts in the
Friis free space equation:
1 Physical determination of the values of the propagation factor
The model developed in the thesis is based on propagation factor values which are found out
through trial and error. It is required that the value of the propagation factor be determined through a
physical way or through a definite expression just like the Friis free space equation. This will give a
revolutionary boost for implementing the model developed in Chapter 5 to be effectively implemented in
the industry.
2 Manifestation of EM principles in a reverberation chamber
A reverberation chamber being a complex environment, the manifestation of EM field in the
presence of RFID tag and reader is required. The Friis free space equation discussed in Chapter 5 holds
good in a free space or an environment which is similar to an anechoic chamber (An anechoic chamber is
a room that is isolated from external sound or electromagnetic radiation sources, sometimes using sound

97
proofing, and prevents the reflection of wave phenomena (reverberation) [36]. The concepts of
reverberation chamber are exactly opposite to that of an anechoic chamber, thus making it imperative to
modify the model discussed in the thesis for reverberating environments.
3 Use of actual value of thP
Using actual value of threshold power thP of a tag, (found to be -26.5 dBm from the primary
experiments conducted in the anechoic chamber) in the model discussed in Chapter 4, will make the
model more realistic and accurate in predicting read-rate probabilities in various environments. A realistic
value of thP will facilitate in direct implementation of the model in industries, thereby alleviating the need
of extensive experimentation and analysis on the site of implementation.

98
References
1. Finkenzeller, K., RFID Handbook. 2nd edition ed. 2003: Wiley.
2. Roberti, M., Understanding the EPC Gen 2 Protocol, in RFID Journal. 2005.
3. Sarma, S., D. Brock, and K. Ashton, The Networked Physical World, A.I. Center, Editor. 2000, MIT Auto ID Center: Cambridge.
4. Hussain, A., Performance and reliability of Radio Frequency Identification (RFID), in Information and Communication Technology, Faculty of Engineering and Science. 2004, Agder University College: Grimstad, Norway.
5. Rao, K.V.S. An Overview of Backscattered Radio Frequency Identification. in IEEE Microwave
Conference Asia Pacific. 1999.
6. Balanis, C.A., Antenna Theory – Analysis and Design. 3rd ed. 2005: Wiley Interscience.
7. Rao, K.V.S., P.V. Nikitin, and S.F. Lam, Antenna Design for UHF RFID Tags: A Review and a Practical Application. IEEE Transactions on Antenna and Propagation, 2005. 53(12).
8. Foster, P.R. and R.A. Burberry, Antenna Problems in RFID Systems. The Institution of Electrical Engineers, 1999.
9. Siden, J., et al. Performance Degradation of RFID system due to the Distortion in RFID Tag Antenna. in 11th International Conference "Microwave & Telecommunication Technology" 2001. Crimea, Ukraine: IEEE.
10. Engels, D.W. and S. Sarma, The Reader Collision Problem. IEEE SMC, 2002.
11. Bolotnyy, L. and G. Robins. Multi-Tag Radio Frequency Identification Systems. in IEEE Workshop on Automatic Identification Advanced Technologies. 2005. Buffalo.
12. Porter, D., R. Billo, and M. Mickle, A Standard Test Protocol for Evaluation of Radio Frequency Identification Systems for Supply Chain Applications. Journal of Manufacturing Systems, 2004. 23(1): p. 46.
13. Vogt, H., Multiple Object Identification with Passive RFID Tags. IEEE SMC, 2002.
14. Hosaka, R., Feasibility Study of Convenient Automatic Identification System of Medical Articles
Using LF-Band RFID in Hospital. Systems and Computers in Japan, 2004. 35(10).

99
15. Balch, T., A. Feldman, and W. Wilson, Assessment of an RFID System for Animal Tracking. 2004, The BORG Lab, Georgia Institute of Technology: Atlanta, Georgia 30332.
16. Ruff, T.M. and D. Hession-Kunz, Application of Radio-Frequency Identification Systems to Collision Avoidance in Metal/Nonmetal Mines. IEEE Transactions on Industry Applications, 2001. 37(1).
17. Chon, H.D., et al., Using RFID for Accurate Positioning. Journal of Global Positioning Systems, 2004. 3(1-2).
18. Tazelaar, J., The Effect of Tag Orientation and Package Content on the Readability of Radio Frequency Identification (RFID) Transponders, in School of Packaging. 2004, Michigan State University: Ann Arbor.
19. Ramakrishnan, K.N.M., Performance Benchmarks for Passive UHF RFID Tags, in Electrical Engineering and Computer Sciences. 2005, University of Kansas.
20. Govardhan, J.M., et al., Statistical Analysis and Design of RFID Systems for Monitoring Vehicle
Ingress/Egress in Warehouse Environments. International Journal for Radio Frequency Identification Technology and Applications (IJRFITA), 2006 Sent for Review.
21. EPCglobal. Specifications & Ratified Standards. 2006 [cited May 2006]; Available from: http://www.epcglobalinc.org/standards_technology/specificationsRatifiedStandards.html.
22. ISO/IEC18000-6. Parameters for Air Interface Communications at 860 to 930 MHz. 2006 [cited May 2005].
23. AWID. MPR-2010AN (915 MHz) Readers Data Sheet. 2005 [cited May 2005]; Available from: www.awid.com.
24. Forrest, B., Implementing Six Sigma - Smarter Solutions Using Statistical Methods. 2nd ed. 2003, New Jersey: John Wiley & Sons Inc.
25. AVANTE. Comment on the test data of 13.56 MHz (HF) RFID System and that of 915 MHz
RFID System. 2005 [cited May 2005].
26. Navale, V., J.M. Govardhan, and S. Bukkapatnam, COMMSENS White Paper Series -Towards
RFID System Design Guidelines. 2005, COMMSENS Lab, Oklahoma State University, Stillwater OK.
27. Chatterjee, R., et al., Evaluation of using RFID passive tags for monitoring product location / ownership. 2004, Department of Electrical Engineering, Arizona State University: Tempe, AZ 85287, USA.

100
28. Alien. ALR-9774 Data Sheet. 2005 August 2005 [cited May 2005]; Available from: www.alientechnology.com.
29. Nikitin, P.V. and K.V.S. Rao. Measurement of Backscattering from RFID Tags. in Antennas Measurement Techniques Association Symposium. 2005. Newport, RI.
30. Nikitin, P.V., K.V.S. Rao, and S. Lam, Antenna Design for UHF RFID Tags: a Review and a Practical Application. IEEE Transactions on Antennas and Propagation, 2005. 53(12): p. 3870-3876.
31. Alien. Alien Squiggle Family for EPC RFID Tags. 2005 November 2005 [cited May 2006]; Available from: www.alientechnology.com.
32. Swedberg, C., University of Kansas' Tag for Metal, Liquids. RFIDJournal, 2006. 2775(1): p. 1.
33. ECCOPAD® Smart Tag Isolators- Read on Metal RFID. Emerson & Cumming Microwave Products 2006 [cited June 2006].
34. Adams, D. How RFID will work in metal environments. 2005 [cited June 2006].
35. Collins, J., Avery Designs Passive UHF Tag for Metal. RFIDJournal, 2005. 1436(1).
36. Wikipedia. Antenna Terminology. 2006 [cited June 2006]; Available from: http://en.wikipedia.org/wiki/Category:Antenna_terminology.

VITA
Jayjeet Manik Govardhan
Candidate for the Degree of
Master of Science
Thesis: PERFORMANCE MODELING AND DESIGN OF BACKSCATTER RFID SYSTEMS: A STATISTICAL APPROACH Major Field: Industrial Engineering and Management
Biographical:
Personal Data: Son of Mr. Manik N Govardhan and Mrs. Madhuri M. Govardhan, born on July 6th, 1980 in Solapur, Maharashtra State, India. Education: Aug. 2002 Granted the Bachelor of Engineering (Production) degree from Veermata Walchand (Govt.) College of Engineering, Sangli- Shivaji University, Kohlapur – India on passing the university examinations in First Class with Distinction.
July 2006, Competed the requirements for the Master of Science (Industrial Engineering) degree
from Oklahoma State University, Stillwater, Oklahoma – USA with cumulative GPA 3.72. Experience: July 2006, Joining as a Quality Engineer at F W Murphy Inc., Tulsa Aug 2002 – Dec. 2004, Quality Manager, Cummins India Ltd., Pune. June 2005 – July 2006, Graduate Research Assistant, Laboratory for Sensor Networks and Complex Manufacturing Research, Advanced Technology Research Center (ATRC), Oklahoma State University. Professional Memberships and Certifications: President of American Society of Quality at OSU (ASQ - since 2006) American Production and Inventory Control Society (APICS – since 2005) Alpha Pi Mu, Industrial Engineering Honor Society (APM – since 2006) ASQ, Certified Quality Process Analyst (CQPA – Jun. 2005)

Name: Jayjeet Manik Govardhan Date of Degree: July 2006
Institution: Oklahoma State University Location: Stillwater, Oklahoma Pages in Study: 100 Candidate for the Degree of Master of Science
Title of Study: PERFORMANCE MODELING AND DESIGN OF BACKSCATTER RFID SYSTEMS: A STATISTI CAL APPROACH Major Field: Industrial Engineering and Management
Scope and Method of Study: The current models for specifying and estimating performance of RFID systems are based purely on EM theory (e.g., using Friis free space equations) or statistical experimental modeling principles. Models based on EM theory are limited to specifying power received at the tag under certain simple, idealized conditions, and do not provide estimates of read-rates, which are de-facto industry quantifiers of an RFID system performance. The estimates of power levels do not consider uncertainties inherent to an industrial RFID system. On the other hand, the statistical models, being purely data-driven, suffer from lack of generalizability as their results cannot be extrapolated. This thesis investigates a statistical approach for assessing the system performance and proposes an analytical probabilistic model based on Friis free space expression that captures the uncertainties existing in gain of the tag antenna, power of the reader antenna, frequency hopping, etc. Finally the thesis suggests a set of techniques to increase read-rate probabilities of RFID tags when placed on metal objects or in the presence of highly metallic environments.
Findings and Conclusions:
1. A statistical approach to design RFID systems for ingress/egress monitoring for warehouse and manufacturing environments has been developed. It has been shown that the tag read-rate probabilities undergo a polynomial decrement with increase in distance (i.e., read range).
2. An analytical model based on Friis Free Space Equation to predict read-rate probabilities of RFID systems for a given set of conditions is developed. A new term called propagation factor is introduced in the classical Friis free space equation to make it suitable for determining read-rate probabilities of tags placed in certain commonly occurring environmental conditions
3. The thesis explains the use of a reverberation chamber environment for the first time in the field of RFID system development. An approach that uses a reverberation chamber to achieve perfect (100%) read-rate probabilities for tracking metal objects is validated.
ADVISER’S APPROVAL: Dr. Satish Bukkapatnam