PERFORMANCE MEASUREMENTS OF MULTIMEDIA TRANSMISSIONS …
93
PERFORMANCE MEASUREMENTS OF MULTIMEDIA TRANSMISSIONS IN IP OVER ATM NETWORKS by Milan Nikolić B.Sc., Faculty of Technical Sciences, University of Novi Sad, Yugoslavia, 1995 A THESIS SUBMITTED IN PARTIAL FULFILLMENT OF THE REQUIREMENTS FOR THE DEGREE OF MASTER OF APPLIED SCIENCE in the School of Engineering Science © Milan Nikolic 2002 SIMON FRASER UNIVERSITY December 2002 All rights reserved. This work may not be reproduced in whole or in part, by photocopy or other means, without permission of the author.
Transcript of PERFORMANCE MEASUREMENTS OF MULTIMEDIA TRANSMISSIONS …
PERFORMANCE MEASUREMENTS OF MULTIMEDIA TRANSMISSIONS IN IP OVER ATM NETWORKS
by
Milan Nikolić
B.Sc., Faculty of Technical Sciences, University of Novi Sad,
Yugoslavia, 1995
A THESIS SUBMITTED IN PARTIAL FULFILLMENT OF
THE REQUIREMENTS FOR THE DEGREE OF
MASTER OF APPLIED SCIENCE
in the School
of
Engineering Science
© Milan Nikolic 2002
SIMON FRASER UNIVERSITY
December 2002
All rights reserved. This work may not be
reproduced in whole or in part, by photocopy or other means, without permission of the author.

ii
Approval
Name: Milan Nikolić
Degree: Master of Applied Science
Title of thesis: Performance measurements of multimedia
transmissions in IP over ATM networks
Examining Committee: Prof. Bill Gruver, Committee-Chair
Prof. Ljiljana Trajković Senior Supervisor School of Engineering Science
Prof. Stephen Hardy Supervisor School of Engineering Science
Prof. Dan Hoffman External Examiner School of Computing Science University of Victoria
Date approved: December 9, 2002.

iii
ABSTRACT
We have built an ATM testbed comprised of two ATM edge switches
(Newbridge MainStreet 36150), and two Pentium III workstations
connected to the ATM network via Ethernet cards. We used the MBone
and NetMeeting multimedia conferencing systems to measure and
evaluate the performance of audio and video transmissions in an IP over
ATM network. Using Spirent's SmartBits 600 load generator, and in
compliance with RFC 2544, we measured and analyzed throughput and
packet delay as the main parameters for measuring forwarding
performance and quality of service in multimedia applications.
The ATM Traffic Monitor tool, a simple network management graphical
user interface written in Tcl, Tk, and Expect scripting languages,
provided an easy graphical capture of the aggregate traffic sent through
Ethernet cards of the ATM switches. We also used the MBone to
multicast the Open Forum session at the IFSA/NAFIPS 2001 conference,
held in Vancouver on July 25-28, 2001. Audio and video signals were
sent using the MBone multimedia conferencing tools (running on
Windows OS) to the MBone network using DVMRP tunnelling through an
ADSL line, via the SFU campus network, to the BCnet GigaPOP.

iv
Dedication
I dedicate this thesis to my parents Slobodanka and Tomislav for their
endless love and support, to my brother Aleksandar for his heartening and
protection, to my two great aunts Ljiljana and Ljubica for their
encouragement and belief in me, and to my very special friend Jim for
filling my heart with love. I love you all so much.

v
Acknowledgments
I would like to give my special thanks to my advisor, Dr. Ljiljana
Trajković, for her guidance, support, and encouragement during my
studies at Simon Fraser University. Thank you for your trust, kindness,
and wonderful friendship.
I would like to thank Dr. Bill Gruver, Dr. Stephen Hardy, and Dr. Daniel
Hoffman for serving on my examining committee.
Thank you also to all the people who helped me in the course of the
project and without whom this project would not have been finished:
Daniel Hoffman, Peter VanEpp, Burkhard Krass, Rob Balantyne, Calvin
Ling, Edward Yan, IFSA/NAFIPS conference chairs Michael Smith and
Bill Gruver, Fred Kyba, Frank Campbell, Daniel Ciobanu, and Zoran
Ćorić.
My sincere thanks goes to the founding members of the Communication
Networks Laboratory: Nazy Alborz, Maryam Keyvani, Michael Jiang, and
Velibor Markovski, for being my good friends and colleagues.

vi
Table of Contents
Approval ................................................................................................ ii
Abstract................................................................................................ iii
Dedication ............................................................................................ iv
Acknowledgements ................................................................................ v
Table of Contents.................................................................................. vi
List of Tables ...................................................................................... viii
List of Figures....................................................................................... ix
1 Introduction………………………………………………………………………..1
2 Monitoring of the Asynchronous Transfer Mode (ATM) network..........3
2.1 ATM network .............................................................................3 2.2 ATM LAN configuration..............................................................5 2.3 Switch interface cards ...............................................................7
2.3.1 Ethernet card..................................................................9 2.3.2 OC3 ATM card ................................................................9
2.4 4-Port switching card ..............................................................10 2.5 ATM Traffic Monitor script .......................................................10
3 Testing the forwarding performance.................................................15
3.1 SmartBits................................................................................15 3.2 Measurements.........................................................................18 3.3 Throughput and delay tests .....................................................19
3.3.1 Throughput test ............................................................19 3.3.2 Delay tests ....................................................................24
3.4 MBone and NetMeeting measurements ....................................37 3.4.1 Testing with MBone application tools ............................38 3.4.2 Testing with NetMeeting application tools......................42
3.5 Hub delay measurements ........................................................46 3.5.1 Linksys hub..................................................................46 3.5.2 3Com hub.....................................................................46 3.5.3 Telesyn hub ..................................................................49
4 Multimedia conferencing .................................................................51
4.1 MBone.....................................................................................51 4.2 Multicasting ............................................................................53 4.3 Test session in the Communication Networks Laboratory
(CNL) at Simon Fraser University (SFU) ...................................55

vii
4.3.1 Network setup...............................................................57 4.3.2 The MBone test session setup .......................................61
4.4 Test session at the IFSA/NAFIPS conference site .....................61 4.4.1 Network setup...............................................................64 4.4.2 The MBone test session.................................................67
4.5 Live MBone multicast session of the Open Forum workshop at IFSA/NAFIPS 2001 conference ............................................69 4.5.1 Network setup...............................................................71 4.5.2 The MBone live session .................................................74
5 Conclusion………………………………………………………………………..77

viii
List of Tables
3.1: Single burst test results..............................................................23

ix
List of Figures
2.1: The ATM cell is a fixed-length packet with a 5-byte header and
48-byte payload that carries data. ................................................4 2.2: Communication Networks Laboratory ATM testbed. It consists
of two Newbridge Networks 36150 MainStreet ATM network (ATMnet) access switches, two Pentium III PC workstations, and one UNIX Ultra 5-270 workstation. ........................................6
2.3: Newbridge Networks 36150 MainStreet ATM network (ATMnet) access switch (8-port DC system). Interface cards are located in the upper shelf. Switching cards are located in the lower shelf…….......................................................................................8
2.4: ATM Traffic Monitor GUI. It has start, stop, pause, continue, go to, and reset buttons, and four windows for visualizing traffic on the Ethernet card in real time. .....................................13
2.5: ATM Traffic Monitor with collected data log and corresponding line graphs. 300 samples are collected at 1-second intervals......14
3.1: SmartBits 600 (SMB-600) Traffic Generator/Protocol Analyzer shown with two 6-ports 10/100 Mbps Ethernet modules. ...........16
3.2: Test setup with the tester connected to a single networking device (DUT)……………………………………..…... ...........................17
3.3: Test setup with the tester connected to two identical networking devices (DUTs). .........................................................17
3.4: Throughput vs. packet size. ........................................................19 3.5: Test setup for the throughput and delay measurements..............20 3.6: Packet rate vs. packet size. .........................................................21 3.7: Delay of single burst vs. time. Only a zoom-in interval of 10
seconds is shown........................................................................24 3.8: Delay of single burst vs. time. Utilization is 46.03 % and
packet size is 96 bytes. ...............................................................26 3.9: Delay of single burst vs. time. Utilization is 46.03 % and
packet size is 96 bytes. Only a zoom-in interval of 10 seconds is shown.....................................................................................26
3.10: Delay of single burst vs. time. Utilization is 41.06 % (5 % lower than at the throughput rate) and packet size is 96 bytes....27
3.11: Delay of single burst vs. time. Utilization is 41.06 % (5 % lower than at the throughput rate) and packet size is 96 bytes. Only a zoom-in interval of 10 seconds is shown. .........................27
3.12: Delay of single burst vs. time. Utilization is 51.10 % (5 % higher than at the throughput rate) and packet size is 96 bytes…….. ..................................................................................28
3.13: Delay of single burst vs. time. Utilization is 51.10 % (5 % higher than at the throughput rate) and packet size is 96 bytes. Only a zoom-in interval of 10 seconds is shown. ..............28

x
3.14: Delay of single burst vs. time. Utilization is 77.04 % and packet size is 552 bytes. .............................................................30
3.15: Delay of single burst vs. time. Utilization is 77.04 % and packet size is 552 bytes. Only a zoom-in interval of 10 seconds is shown…………........................................................... 30
3.16: Delay of single burst vs. time. Utilization is 72.04 % (5 % lower than at the throughput rate) and packet size is 552 bytes…….. ..................................................................................31
3.17: Delay of single burst vs. time. Utilization is 72.04 % (5 % lower than at the throughput rate) and packet size is 552 bytes. Only a zoom-in interval of 10 seconds is shown. ...............31
3.18: Delay of single burst vs. time. Utilization is 82.01 % (5 % higher than at the throughput rate) and packet size is 552 bytes…….. ..................................................................................32
3.19: Delay of single burst vs. time. Utilization is 82.01 % (5 % higher than at the throughput rate) and packet size is 552 bytes. Only a zoom-in interval of 10 seconds is shown. ..............32
3.20: Delay of single burst vs. time. Utilization is 84.02 % and packet size is 1,518 bytes. ..........................................................34
3.21: Delay of single burst vs. time. Utilization is 84.02 % and packet size is 1,518 bytes. Only a zoom-in interval of 10 seconds is shown........................................................................34
3.22: Delay of single burst vs. time. Utilization is 79.01 % (5 % lower than at the throughput rate) and packet size is 1,518 bytes…….. ..................................................................................35
3.23: Delay of single burst vs. time. Utilization is 79.01 % (5 % lower than at the throughput rate) and packet size is 1,518 bytes. Only a zoom-in interval of 10 seconds is shown. ..............35
3.24: Delay of single burst vs. time. Utilization is 89.00 % (5 % higher than at the throughput rate) and packet size is 1,518 bytes…….. ..................................................................................36
3.25: Delay of single burst vs. time. Utilization is 89.00 % (5 % higher than at the throughput rate) and the packet size is 1,518 bytes. Only a zoom-in interval of 10 seconds is shown. ...36
3.26: Network setup in CNL laboratory at SFU for forwarding performance measurements using the MBone and NetMeeting application tools. SmartBits traffic generator was used to generate delay probes. ................................................................37
3.27: Delay of single burst vs. time during an MBone session. Only MBone audio application tool was used in the session. ...............39
3.28: Delay of single burst vs. time during an MBone session. Only MBone audio application tool was used in the session. Only a zoom-in interval of 10 seconds is shown. ....................................39
3.29: Delay of single burst vs. time during an MBone session. Only MBone video application tool was used in the session. ................40

xi
3.30: Delay of single burst vs. time during an MBone session. Only MBone video application tool was used in the session. Only a zoom-in interval of 10 seconds is shown. ....................................40
3.31: Delay of single burst vs. time during an MBone session. Both audio and video application tools were used in the session. ........41
3.32: Delay of single burst vs. time during an MBone session. Both audio and video application tools were used in the session. Only a zoom-in interval of 10 seconds is shown. .........................41
3.33: Delay of single burst vs. time during a NetMeeting session. Only NetMeeting audio tool was used in the session. ..................43
3.34: Delay of single burst vs. time during a NetMeeting session. Only NetMeeting audio tool was used in the session. Only a zoom-in interval of 10 seconds is shown. ....................................43
3.35: Delay of single burst vs. time during a NetMeeting session. Only NetMeeting video tool was used in the session. ...................44
3.36: Delay of single burst vs. time during a NetMeeting session. Only NetMeeting video tool was used in the session. Only a zoom-in interval of 10 seconds is shown. ....................................44
3.37: Delay of single burst vs. time during a NetMeeting session. Both NetMeeting audio and video tools were used in the session….. ..................................................................................45
3.38: Delay of single burst vs. time during a NetMeeting session. Both NetMeeting audio and video tools were used in the session. Only a zoom-in interval of 10 seconds is shown.............45
3.39: Test setup for the measurements of delay in the presence of the Ethernet hub in the network.................................................46
3.40: Delay of single burst vs. time. Delay in the network is created by Linksys hub with no additional traffic. ...................................47
3.41: Delay of single burst vs. time. Delay in the network is created by Linksys hub with no additional traffic. Only a zoom-in interval of 10 seconds is shown. .................................................47
3.42: Delay of single burst vs. time. Delay in the network is created by 3Com hub with no additional traffic. ......................................48
3.43: Delay of single burst vs. time. Delay in the network is created by 3Com hub with no additional traffic. Only a zoom-in interval of 10 seconds is shown. .................................................48
3.44: Delay of single burst vs. time. Delay in the network is created by Telesyn hub with no additional traffic. Delay probes are size 64 bytes… ..................................................................................49
3.45: Delay of single burst vs. time. Delay in the network is created by Telesyn hub with no additional traffic. Delay probes are size 64 bytes. Only a zoom-in interval of 10 seconds is shown....50
3.46: Delay of single burst vs. time. Delay in the network is created by Telesyn hub with no additional traffic. Delay probes are size 1,518 bytes. ...............................................................................50

xii
4.1: Network setup for the MBone test session in the Communication Networks Laboratory at SFU..............................58
4.3: TCP/IP settings on the MBone machine. .....................................59 4.4: The /etc/rc.conf file................................................................60 4.5: The /etc/rc.local file..............................................................60 4.6: The /etc/mrouted.conf file. .....................................................60 4.7: The MBone tools used in the test session from the CNL
laboratory at SFU. ......................................................................61 4.8: The MBone tools started from the command line interface. .........61 4.9: Network setup for the MBone test session at the IFSA/NAFIPS
conference site............................................................................63 4.10: The /etc/rc.conf file....................................................................64 4.11: Assigned IP addresses. ...............................................................65 4.12: Routing table..............................................................................65 4.13: The /etc/rc.local file..............................................................66 4.14: The /etc/mrouted.conf file. .....................................................66 4.15: The edited /etc/rc.conf file. ........................................................66 4.16: TCP/IP settings on the MBone machine. .....................................67 4.17: The MBone tools used in the test session at the IFSA/NAFIPS
conference site............................................................................68 4.18: The MBone tools started from the command line interface. .........68 4.19: Network setup for the MBone webcast session at the
IFSA/NAFIPS 2001 conference....................................................70 4.20: The /etc/rc.conf file................................................................71 4.21: Assigned IP addresses. ...............................................................71 4.22: Routing table..............................................................................72 4.23: The /etc/rc.local file..............................................................72 4.24: The /etc/mrouted.conf file. .....................................................73 4.25: The edited /etc/rc.conf file. ........................................................73 4.26: The MBone tools used in the webcast session. ............................74 4.27: The MBone tools started from the command line interface. .........74 4.28: The sdr, rat, and vic MBone application tools setup for the
live session at the IFSA/NAFIPS 2001 conference. ......................75 4.29: The audio/video and measurement equipment setup for the
live webcast session....................................................................76
All figures, expect Figure 2.3, are created by the author using Visio 2000 and MATLAB 6. Figure 2.3 is taken from the “Newbridge Networks 36150 MainStreet ATMnet Technical Practices” [18].

1
1 Introduction
In order to ensure that networks perform properly, they need to be
tested. The standard testing procedure for Local Area Networks (LANs)
and Wide Area Networks (WANs) is network monitoring, which can help
manage the network performance. For example, monitoring the network
traffic and load over time provides insight into network load patterns and
helps predict when the network traffic will surpass the packet forwarding
rate of networking devices (e.g., switches and routers) [7]. This is called
traffic congestion. Good traffic engineering should ensure that
congestion does not occur even when networks are fully utilized.
The primary goal of this project is to measure and evaluate the
performance of multimedia transmissions in Internet Protocol (IP) over
Asynchronous Transfer Mode (ATM) networks. In the Communication
Networks Laboratory (CNL) at Simon Fraser University (SFU), we have
built an ATM testbed comprised of two Newbridge Networks 36150
MainStreet ATMnet access switches, two Pentium III PC workstations,
and one UNIX Ultra 5-270 workstation. We used the MBone and
NetMeeting multimedia conferencing applications to generate traffic
during audio and video transmissions between two PCs. The ATM Traffic
Monitor tool, a simple network management graphical user interface
written in Tcl/Tk and Expect scripting languages, enabled efficient
2
graphical capture of the aggregate traffic sent through Ethernet cards of
the ATM switches. We used a Spirent Communications' SmartBits 600
load generator to measure and analyze throughput and packet delay, as
the two main parameters for measuring forwarding performance and
quality of service in multimedia applications.
We also organized the multicasting session of the Open Forum workshop
held at the 2001 International Fuzzy Systems Association and the North
American Fuzzy Information Processing Society (IFSA/NAFIPS)
conference, held in Vancouver on July 25-28, 2001. Audio and video
signals from the session were sent using MBone multimedia conferencing
tools to the Internet Multicast Backbone (MBone) network using Distance
Vector Multicast Routing Protocol (DVMRP) tunnelling through an
Asymmetric Digital Subscriber Line (ADSL) to the BCnet Gigabit-capacity
Point of Presence (GigaPoP), via the SFU campus network. The ADSL line
was provided by Telus. Genuine traffic traces were collected during the
multicast and were later used to analyze the impact of traffic on network
performance.
The thesis is organized as follows. In Chapter 2, we describe the
Communication Networks Laboratory ATM testbed and the ATM Traffic
Monitor tool developed in Tcl/Tk and Expect scripting languages. In
Chapter 3, we describe the measurement experiments conducted using a
Spirent Communications’ SmartBits 600 load generator and protocol
analyzer in the CNL ATM testbed running MBone and NetMeeting
videoconferencing tools. Chapter 4 provides an overview of MBone
software tools and details of MBone test sessions, as well as the webcast
of the workshop at IFSA/NAFIPS 2001 conference. We describe the
multicast session and the difficulties that were encountered during the
webcast setup. We conclude and give possible future research directions
in Chapter 5.

3
2 Monitoring of the Asynchronous Transfer Mode (ATM) network
In this Chapter we describe the Communication Networks Laboratory
ATM testbed and the ATM Traffic Monitor tool.
2.1 ATM network
Asynchronous Transfer Mode (ATM) is a network technology designed to
meet the needs of future broadband networks.
ATM networks employ cell switching, based on fixed-size packets called
cells. The ATM standards were developed in 1984 by the International
Telecommunication Union (ITU) as the set of international standards for
the Broadband Integrated Services Digital Networks (B-ISDN). The ATM
Forum, a consortium of ATM service providers and equipment vendors,
was founded in 1991 to further foster the development of ATM standards.
The ATM set of standards defines transmission formats, switching
techniques, addressing methods, signalling protocols, and the service
provision [4].
Data transfer in ATM networks is accomplished via the transmission of
ATM cells. Each ATM cell is a 53-byte packet, with 5 bytes of header and

4
48 bytes of payload, as shown in Figure 2.1. Specially designed ATM
switches transfer incoming cells to the corresponding output ports based
on the Virtual Channel Identifier (VCI) field contained in the cell header.
ATM is a connection-oriented protocol that requires connection setup
before transmitting data between two users (workstations). To transmit
data to a particular destination, a workstation must request that a
virtual channel be established by transmitting a setup request message
to its local ATM switch, specifying the source and destination addresses.
The ATM switches then determine a path between the two workstations,
associate a VCI with this path, and populate their switching tables in
order to pass data along the path [4].
Figure 2.1 The ATM cell is a fixed-length packet with a 5-byte header and 48-byte payload that carries data.
Data packets longer than 48 bytes must be first segmented by the source
workstation into 48-byte data segments. These segments are
transmitted within ATM cells to the destination workstation (along a

5
previously defined virtual channel) where they are reassembled into the
original data packet.
The use of cells gives ATM switching technology several advantages over
the frame switching technology:
• ATM switches operate at much higher data transmission speeds, using fixed-size buffers.
• Average queueing delays within the switch are greatly reduced
because all cell have identical size and, hence, require equal transmission times.
• ATM switches guarantee low end-to-end delay and low delay
variation (jitter) necessary for the support of isochronous services, such as digitized voice and video streams [12].
Over the last decade, carriers of wide-area telecommunications services
have adopted ATM as a preferred technology that efficiently carries voice,
data, and video, and can provide distinct Quality of Service (QoS) to its
customers [1].
2.2 ATM LAN configuration
The ATM testbed, shown in Figure 2.2, consists of two Newbridge
Networks 36150 MainStreet Asynchronous Transfer Mode network
(ATMnet) access switches, two Pentium III PC workstations running
(Windows 2000), and a UNIX Ultra 5-270 workstation (Solaris 2.7).

6
Figure 2.2: Communication Networks Laboratory ATM testbed. It consists of two Newbridge Networks 36150 MainStreet ATM network (ATMnet) access switches, two Pentium III PC workstations, and one UNIX Ultra 5-270 workstation.
The ATM switches are interconnected over an OC3 link using multimode
fiber optics cable. There is only one virtual circuit defined between the
switches with 155.52 Mbps bandwidth available. Each PC is connected
to the switches (one PC to one switch) with Cat5 UTP cables using 10
Mbps connections to the Ethernet interface cards. A UNIX workstation,
acting as the network management station, is connected to the ATM
switch via an RS-232 serial port. It can monitor only one switch at a
time. To monitor a second switch, the cable connection setup needs to
be performed manually.
The 36150 MainStreet ATMnet access switch is an 8-port DC system that
supports eight interface cards and requires six switching cards. It can

7
be configured as an 8-port redundant system with six additional
switching cards. The redundant system, in case of a primary switching
fabric malfunction, switches to the backup fabric and continues to
operate. Our ATM testbed system is not redundant and has only six
primary switching fabrics.
The network management station can be any VT-100 type terminal or a
workstation running terminal emulation software. The management
station in the ATM testbed is connected to the switch directly, although it
can be connected to the console port through a LAN (via Ethernet
interface).
One 8-port DC switch needs 48 V DC at 8.0 A power supply. The power
supply used with our switches is an Argus Technologies’ RST 48/30
switched mode rectifier that provides regulated and isolated 48 V DC
output (at 30.0 A) from the 120 V AC main power supply [3].
2.3 Switch interface cards
There are two types of interface cards: transmission interface and
adaptation interface cards.
The transmission interface cards include:
• Local ATM (LATM) card
• Optical Carrier 3 (OC3) ATM card
• T3 ATM/Physical Layer Convergence Protocol (PLCP) card.
Transmission interface cards receive and transmit cells from the ATM
fabric without performing ATM adaptation.

8
The adaptation interface cards include:
• Ethernet Card
• T1 Time Division Multiplexing (TDM) card
• NTSC/JPEG Video card.
These cards perform ATM adaptation of incoming and outgoing signals.
Figure 2.3: Newbridge Networks 36150 MainStreet ATM network (ATMnet) access switch (8-port DC system). Interface cards are located in the upper shelf. Switching cards are located in the lower shelf.
Interface cards
Switching cards

9
2.3.1 Ethernet card
The Ethernet card is a service adaptation card that provides a point-to-
point interface between an Ethernet unit and an ATM format signal
interface [18].
The Ethernet card monitors all transmitted frames on the Local Area
Network (LAN). If it receives an Ethernet frame destined for a station
that is not local to the LAN, it segments the frame into ATM cells, and
transmits the cells to the switching fabric. The ATM switching fabric
then routes the cells to the remote Ethernet card that reassembles the
cells to recreate the original Ethernet frame and delivers it to the station
belonging to the remote LAN.
The Ethernet card complies with the IEEE 802.3 standard and provides
data rate of 10 Mbps and frame forwarding rate of 9,500 frames/second.
The IEEE 802.3 standard specifies the Ethernet LAN protocol. The
Ethernet card has an MAU (DA-15) connector, and, hence, requires a
transceiver to the RJ45 type connector. MAU and RJ45 are connectors
used in Ethernet networks.
2.3.2 OC3 ATM card
The Optical Carrier 3 (OC3) ATM Card is a transmission line interface
card that provides a point-to-point interface between the ATM switching
fabric and the serial optical Synchronous Optical Network (SONET)
signal at OC3 rate (155.52 Mbps) [18].
The OC3 ATM Card translates and remaps the Virtual Channel Identifier
(VCI) fields of incoming ATM cells with routing information through the

10
ATM switching fabric. It provides a transmission rate of 155.52 Mbps
and a bandwidth of 149.76 Mbps for unchannelized ATM payload. The
card has an optical FC-PC type connector.
2.4 4-Port switching card
The 4-port ATM switching card provides ATM cell routing and contention
resolution [18]. It is a four-input, four-output, ATM cell switch. It has
only 16-cell buffers and each buffer stores up to 16 ATM cells for each
input-output pair. Cells received by the card are buffered and routed
according to a round-robin equal priority routing mechanism. The 4-port
switching card provides a cell rate of 160 Mbps or 363,636
cells/second/port.
2.5 ATM Traffic Monitor script
In order to monitor traffic through an ATM node, we developed the ATM
Traffic Monitor script (ATMscript): a simple network management
graphical user interface (GUI) system [14]. The script provides an easy
graphical representation of data flow: ATM transmitted and received cells
and frames. The script is a tool that can be used, enhanced, or modified
for various studies of ATM traffic.
The MBone multimedia videoconferencing software [16], which was
installed on both PCs, was used to generate traffic through the ATM
testbed. We captured aggregate traffic through the Ethernet card of the
ATM switch. The captured number of frames (sent and received) and
cells (sent and received), together with a time stamp, was written into a
file. Each line in the file represents a time stamp and a number of
frames and cells from the beginning of the capturing session. The time

11
stamp is in the form of clock-clicks, where 10,000 clock-clicks is roughly
equal to 1 second. Selecting the number of lines we wish to capture,
prior to starting the script, predetermines the length of a trace. Each
line represents a 0.9 sec increment on a time scale.
The ATMscript is written using three scripting languages: Tcl, Tk, and
Expect. Tcl performs the main functions of the script. Expect and Tk
are required for additional functionality [20].
Tcl is the main scripting language used. It is used throughout the script
to bring the data collected from the Expect communications to the Tk
GUI. The following is a list of Tcl responsibilities:
• A system test must be performed to count how many computer clock ticks are created per second. This value is used to calculate time stamps.
• Collected data must be processed to properly update the graphs.
The user’s text input must be included in the data processing. • A time stamp must be calculated for each collected data. • User commands from the GUI must be translated to procedure
calls in the script such as: Start, Stop, Pause, Continue, Export, Search, and Quit.
Expect is used for communication with the ATM switch by spawning a
shell and running the Node Management Terminal Interface (NMTI) to
collect the raw data from the ATM switch. There is only one section of
the script that requires Expect and it resides within the start_atm
procedure [14]. This code executes the following processes and events:
• Spawn a shell process
• Run the NMTI for the ATM node
• Wait for the login and enter level
• Wait for the password request and enter password

12
• Send input commands to go through the menu structure to the statistics window that displays the Tx/Rx cells and frames
• Collect data from NMTI. The following two entries on the list are repeated until the Stop/Pause procedure is called or until the number of samples required for collection is completed:
o Refresh NMTI screen
o Collect data again
• Exit NMTI.
Tk provides the tool for creating a GUI that gives a control panel and
displays collected data in a form of text, line graphs, and bar graphs.
The portion of the code that involves creating and updating the GUI uses
Tk. The initial portion of the code creates the basic structure of the GUI
and is broken into separate frames [14]. The groups of Tk code define:
• The general background frame, title, and menu bar
• Start, Stop, Continue, and Pause buttons
• Radio buttons for selection of bar or line graphs
• Entry boxes and labels for the entry boxes
• Search count button, entry box, and label
• Received frames graph
• Transmitted frames graph
• Received cells graph
• Transmitted cells graph
• Raw data text output.
The Tk code updates the GUI depending on user input and collected
data. The interpreter required for running the ATMscript is called
Expectk.
In order to run the ATMscript, the workstation must be connected to the
ATM node through a serial connection. The NMTI must be installed on

13
the workstation and must be able to run and connect to the ATM node
through a terminal session. Once the script is activated, the GUI, shown
in Figure 2.4, will appear on the monitor screen.
Figure 2.4: ATM Traffic Monitor GUI. It has start, stop, pause, continue, go to, and reset buttons, and four windows for visualizing traffic on the Ethernet card in real time.
Through the ATMscript GUI, the user can start, stop, or reset the capture
of traffic. The user can also pause and resume the traffic collection. The
four windows are used for visualizing incoming and outgoing traffic on
the Ethernet card in real time. The option to display bar or line graphs is
included.

14
Figure 2.5 shows the ATM Traffic Monitor GUI after collecting 300
samples at 1-second intervals.
Figure 2.5: ATM Traffic Monitor with collected data log and corresponding line graphs. 300 samples are collected at 1-second intervals.

15
3 Testing the forwarding performance
In this Chapter, we describe measurement experiments on the CNL ATM
testbed running MBone and Netmeeting videoconferencing application
tools. The measurements were conducted using the Spirent
Communications’ SmartBits load generator and protocol analyzer.
3.1 SmartBits
Packet forwarding devices, such as switches and routers, comprise the
backbone of the global Internet and of every current TCP/IP based
computer network. These devices are constantly being redesigned. They
are evolving in order to provide new functionalities needed to
accommodate ever-increasing number of applications and the growing
amount of traffic delivered via packet networks.
In order to verify the network's functionality, there is a need to measure
the performance of the network and it's components. To evaluate the
performance of packet forwarding devices, special equipment such as
traffic generators and analyzers is required. There are currently several
tools available on the market, including RouterTester from Agilent

16
Technologies, Optixia from Ixia, and SmartBits from Spirent
Communications.
SmartBits 600 (SMB-600), shown in Figure 3.1, is a portable and
compact network performance analysis system that holds up to two
modules. It supports up to sixteen 10/100 Mbps Ethernet ports, four
Gigabit Ethernet ports, four Fibre Channel ports, or a mixture of these
port types [21]. The SMB-600 is controlled by a PC through a 10/100
Mbps Ethernet connection. It uses a Windows-based interface named
the SmartWindow application.
SmartBits 600 P erformanc e Analys is S ys temR
10/100 Ethernet SmartMetrics MiniModuleTX/PAUSERX/ERROR
TRIG/COLDUPLEX/SPEED
1 2 3 4 5 6
1
1
LA N -3101A
1
2
1
3
1
4
1
5
1
6
10/100 Ethernet SmartMetrics MiniModuleTX/PAUSERX/ERROR
TRIG/COLDUPLEX/SPEED
1 2 3 4 5 6
1
1
LA N -3101A
1
2
1
3
1
4
1
5
1
6
Figure 3.1: SmartBits 600 (SMB-600) Traffic Generator/Protocol Analyzer shown with two 6-ports 10/100 Mbps Ethernet modules.
The tester has both transmitting and receiving ports. Therefore, the
connections are made from the sending ports of the tester to the
receiving ports of the device under test (DUT), and from the sending ports
of the DUT back to the receiving ports of the tester. In this manner the
tester can verify that all transmitted packets are correctly received after
the traffic has been forwarded by the DUT. Test setup with the tester
connected to a single networking device (DUT) is shown in Figure 3.2.

17
Figure 3.2: Test setup with the tester connected to a single networking device (DUT).
A more complex test setup is when the tester is connected to two
identical DUTs, as shown in Figure 3.3.
Figure 3.3: Test setup with the tester connected to two identical networking devices (DUTs).

18
This setup may more accurately simulate the scenario in real-world
networks because genuine networks are not isolated systems and the
interconnecting devices affect each other.
Configuration of the DUT and test setup should not be altered during
tests. The detailed DUT configuration, including the software version
and all specific functions that are enabled or disabled, must be included
in the report of the results [5]. Test results need to be consistently
presented via graphs and tables to make comparison easier.
3.2 Measurements
The Internet Engineering Task Force (IETF) Network Working Group
Request for Comments, RFC 2544 “Benchmarking Methodology for
Network Interconnect Devices” [5], provides guidance for forwarding
performance tests. (RFC 2544 replaces and obsoletes the RFC 1944 [6].)
This standard describes how to measure and report performance
characteristics in order to be able to compare and evaluate various
network devices from different vendors. It defines a suite of tests
including: throughput and delay, frame loss rate, back-to-back frame
handling, system recovery speed, and reset recovery speed. By
combining these basic performance measurements, it is possible to
investigate a device’s performance under more realistic conditions. In our
study, we performed only the throughput and delay testing.

19
3.3 Throughput and delay tests
In this test we performed two measurements: throughput and delay, as
described in RFC 2544, Sections 26.1 and 26.2, respectively [5].
Throughput and delay measurements are often initial tests that lead to
more complex tests. The test first finds the maximum rate at which the
system under test (SUT) (the CNL ATM testbed) can forward fixed size
packets without any packet loss. It then measures the delay of the
forwarded packets at this maximum rate.
64 256 552 768 1024 1280 151830
40
50
60
70
80
90
Packet size (byte)
Util
izat
ion
(%)
Figure 3.4: Utilization vs. packet size.
3.3.1 Throughput test
We created a single traffic stream from one source port to one destination
port, with initial offered load set to the maximum rate supported by the
Ethernet interface in the ATM switch. Fixed size packets are sent from
the SmartBits source port, through the SUT, to the tester’s destination
port. For each trial, we measured the number of packets transmitted

20
and received. If packet loss occurred, we reduced the offered load and
repeated the trial. Again, we measured the number of packets
transmitted and received. If during the trial no loss occurred, we
increased the load and repeated the test. We continued the search until
the maximum packet rate without loss was found. This packet rate
represents the zero-loss throughput rate.
After the last test iteration, we measured the delay. The delay test
should be observed for a certain period of time (several seconds) to
ensure that the device’s output buffers are not being filled. Otherwise, if
the test duration is too short, it may happen that previously measured
zero-loss throughput rate actually causes a packet loss in the steady
state. Because we were interested to observe delay patterns, we
measured the delay for utilizations ±5 %.
Figure 3.5: Test setup for the throughput and delay measurements.

21
The throughput and delay tests should be performed for a range of
packet sizes. RFC 2544 suggests that the following IP packet sizes
should be used: 40, 64, 128, 256, 512, 1,024, 1,280, and 1,518 bytes [5].
In addition to these values, we also used packet sizes of 96 (UDP audio),
200 (UDP), and 552 (TCP) bytes.
64 256 552 768 1024 1280 15180
1000
2000
3000
4000
5000
6000
7000
Packet size (byte)
Pac
ket r
ate
(pac
kets
per
sec
ond)
Figure 3.6: Packet rate vs. packet size.
In February 2001, the Measurements and Operations Analysis Team
from the National Library for Applied Network Research (NLANR) project
collected data from real Internet measurements [23]. During the
measurement period, 342 millions packets were sampled and recorded at
the Merit Network monitor. The average packet size was 402.7 bytes. In
the collected data, the following packet sizes occurred more frequently:
• 40 bytes: TCP packets with only 20 bytes of IP header and 20
bytes of TCP header, without payload. This type of packets is typically sent at the start of a new TCP session. They account for 35 % of the Internet packets measured, and represent only 3.5 % of the entire traffic.

22
• 576 bytes: TCP packets. These packets account for 11.5 % of all packets, and represent 16.5 % of the Internet traffic.
• 1,500 bytes: These packets correspond to the Maximum
Transmission Unit (MTU) size of an Ethernet connection. Full-size Ethernet frames are the most common in the Internet. They account for approximately 10 % of the packets and for 37 % of the traffic.
Other packet sizes, that occurred more than 0.5 % of all packets, were
52, 1420, 44, 48, 60, 628, 552, 64, 56, and 1,408 bytes [23].
The following definitions apply to the terminology used in our
measurement tests. Throughput is defined as the number of bits per
second transferred between two stations in the network. The maximum
throughput is restricted by the bit rate and the protocol(s). Throughput
is the maximum bit rate for the given packet size. The ratio between the
actual and the maximum network throughput is called utilization.
Line rate depends on the packet size. At a particular packet size, the
50 % utilization implies 50 % less packets per second than at line rate.
For the fixed packet size (constant bit rate streams), lowering the
utilization increases the interpacket gap. Hence, utilization = actual
packet rate/line rate. Throughput graphs show actual packet rate
versus packet size.
Results of the throughput test with a single burst of 100,000 IP packets
of various packet sizes is shown in Table 3.1.

23
Packet size Burst duration(second)
Utilization(%)
Packet rate(pps)
Tx packets Rx packets
15.60 43.08 100,000 99,823 64 16.00 42.00 6,250.00 100,000 100,000 19.72 47.06 100,000 99,795 96 20.16 46.03 4,960.32 100,000 100,000 19.72 60.04 100,000 99,793 128 20.04 59.08 4,990.02 100,000 100,000 27.92 63.04 100,000 99,711 200 28.36 62.06 3,526.09 100,000 100,000 32.44 68.06 100,000 99,792 256 32.92 67.07 3,037.67 100,000 100,000 53.84 79.05 100,000 99,495 512 54.56 78.01 1,832.85 100,000 100,000 58.64 78.04 100,000 99,997 552 59.40 77.04 1,683.50 100,000 100,000 79.00 79.04 100,000 99,506 768 80.00 78.02 1,250.00 100,000 100,000 101.00 82.01 100,000 99,990 1024 103.00 81.02 970.87 100,000 100,000 122.00 85.02 100,000 99,000 1280 123.00 84.01 813.01 100,000 100,000 144.00 85.02 100,000 99,658 1518 146.00 84.02 684.93 100,000 100,000
Table 3.1: Single burst test results.

24
3.3.2 Delay tests
We first measured the delay in the system incurred by the continuous
stream of 64 bytes delay probes (tagged with time stamps) with packet
rate 10 packets per second without any traffic load.
0 2 4 6 8 10360
370
380
390
400
410
420
Time (second)
Del
ay (
mic
rose
cond
)
Figure 3.7: Delay of single burst vs. time. Only a zoom-in interval of 10 seconds is shown.
25
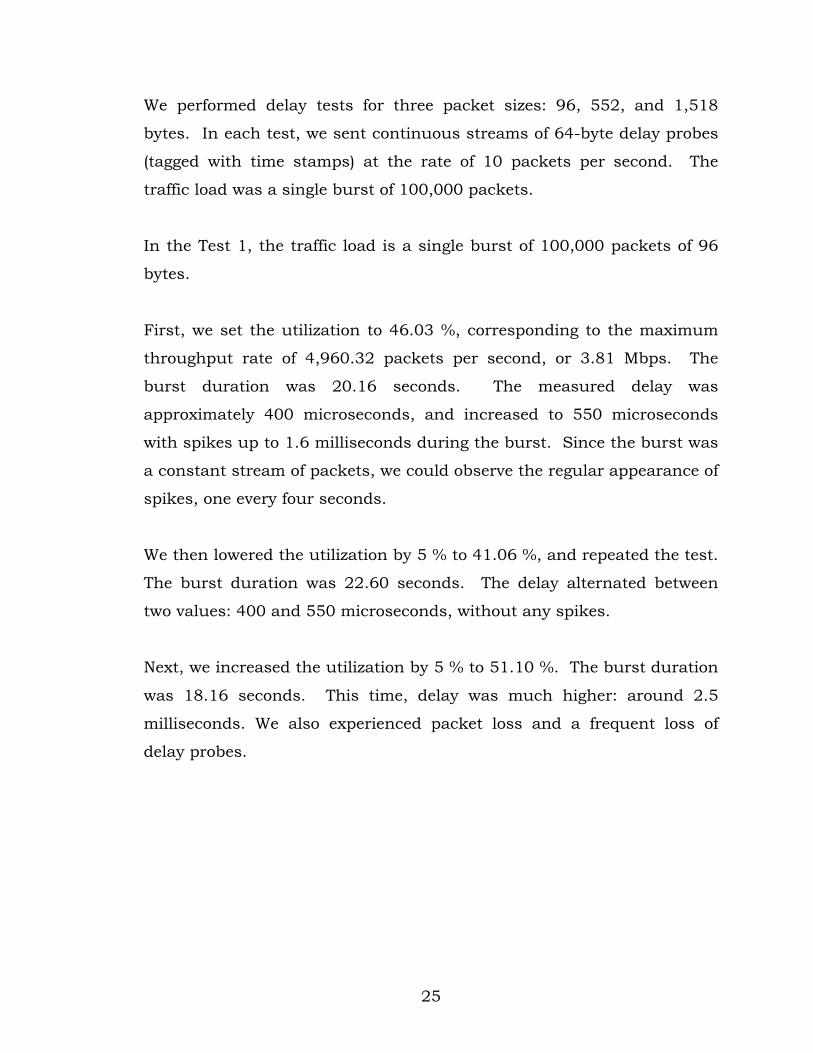
We performed delay tests for three packet sizes: 96, 552, and 1,518
bytes. In each test, we sent continuous streams of 64-byte delay probes
(tagged with time stamps) at the rate of 10 packets per second. The
traffic load was a single burst of 100,000 packets.
In the Test 1, the traffic load is a single burst of 100,000 packets of 96
bytes.
First, we set the utilization to 46.03 %, corresponding to the maximum
throughput rate of 4,960.32 packets per second, or 3.81 Mbps. The
burst duration was 20.16 seconds. The measured delay was
approximately 400 microseconds, and increased to 550 microseconds
with spikes up to 1.6 milliseconds during the burst. Since the burst was
a constant stream of packets, we could observe the regular appearance of
spikes, one every four seconds.
We then lowered the utilization by 5 % to 41.06 %, and repeated the test.
The burst duration was 22.60 seconds. The delay alternated between
two values: 400 and 550 microseconds, without any spikes.
Next, we increased the utilization by 5 % to 51.10 %. The burst duration
was 18.16 seconds. This time, delay was much higher: around 2.5
milliseconds. We also experienced packet loss and a frequent loss of
delay probes.

26
0 5 10 15 20 25 30200
400
600
800
1000
1200
1400
1600
Time (second)
Del
ay (
mic
rose
cond
)
Figure 3.8: Delay of single burst vs. time. Utilization is 46.03 % and packet size is 96 bytes.
10 12 14 16 18 20200
400
600
800
1000
1200
1400
1600
Time (second)
Del
ay (
mic
rose
cond
)
Figure 3.9: Delay of single burst vs. time. Utilization is 46.03 % and packet size is 96 bytes. Only a zoom-in interval of 10 seconds is shown.

27
0 5 10 15 20 25 30200
400
600
800
1000
1200
1400
1600
Time (second)
Del
ay (
mic
rose
cond
)
Figure 3.10: Delay of single burst vs. time. Utilization is 41.06 % (5 % lower than at the throughput rate) and packet size is 96 bytes.
10 12 14 16 18 20200
400
600
800
1000
1200
1400
1600
Time (second)
Del
ay (
mic
rose
cond
)
Figure 3.11: Delay of single burst vs. time. Utilization is 41.06 % (5 % lower than at the throughput rate) and packet size is 96 bytes. Only a zoom-in interval of 10 seconds is shown.

28
0 5 10 15 20 25 300
0.5
1
1.5
2
2.5
3x 10
4
Time (second)
Del
ay (
mic
rose
cond
)
Figure 3.12: Delay of single burst vs. time. Utilization is 51.10 % (5 % higher than at the throughput rate) and packet size is 96 bytes.
10 12 14 16 18 202.5
2.505
2.51
2.515
2.52
2.525
2.53x 10
4
Time (second)
Del
ay (
mic
rose
cond
)
Figure 3.13: Delay of single burst vs. time. Utilization is 51.10 % (5 % higher than at the throughput rate) and packet size is 96 bytes. Only a zoom-in interval of 10 seconds is shown.

29
In the Test 2, the traffic load is a single burst of 100,000 packets of 552
bytes.
First, we set the utilization to 77.04 %, corresponding to the maximum
throughput rate of 1,683.50 packets per second, or 7.43 Mbps. The
burst duration is 59.40 seconds. Measured delay was approximately 400
microseconds. It increased to 1,650 microseconds with spikes up to 3
milliseconds during the burst. Because the burst was a constant stream
of packets, we could observe the regular appearance of spikes, one every
four seconds.
We then lowered the utilization by 5 % to 72.04 %, and we repeated the
test. The burst duration was 63 seconds. The measured delay was
again around 400 microseconds without traffic load. It increased to
1,650 microseconds, with spikes up to 2.5 milliseconds during the burst.
We could observe less appearance of spikes, which occurred in groups.
Next, we increased the utilization by 5 % to 82.01 %. The burst duration
was 55.80 seconds. This time, the delay was much higher, around 7.5
milliseconds with a small variation up to 7.7 milliseconds. Again, there
was packet loss, but less than in Test 1 when the packet size was 96
bytes. The reason is the packet segmentation and re-assembly in the
ATM switch.

30
0 10 20 30 40 50 60 70 800
500
1000
1500
2000
2500
3000
Time (second)
Del
ay (
mic
rose
cond
)
Figure 3.14: Delay of single burst vs. time. Utilization is 77.04 % and packet size is 552 bytes.
40 42 44 46 48 501500
1600
1700
1800
1900
2000
2100
2200
2300
2400
2500
2600
Time (second)
Del
ay (
mic
rose
cond
)
Figure 3.15: Delay of single burst vs. time. Utilization is 77.04 % and packet size is 552 bytes. Only a zoom-in interval of 10 seconds is shown.

31
0 10 20 30 40 50 60 70 800
500
1000
1500
2000
2500
3000
Time (second)
Del
ay (
mic
rose
cond
)
Figure 3.16: Delay of single burst vs. time. Utilization is 72.04 % (5 % lower than at the throughput rate) and packet size is 552 bytes.
40 42 44 46 48 501500
1600
1700
1800
1900
2000
2100
2200
2300
2400
2500
2600
Time (second)
Del
ay (
mic
rose
cond
)
Figure 3.17: Delay of single burst vs. time. Utilization is 72.04 % (5 % lower than at the throughput rate) and packet size is 552 bytes. Only a zoom-in interval of 10 seconds is shown.

32
0 10 20 30 40 50 60 70 800
1
2
3
4
5
6
7
8x 10
4
Time (second)
Del
ay (
mic
rose
cond
)
Figure 3.18: Delay of single burst vs. time. Utilization is 82.01 % (5 % higher than at the throughput rate) and packet size is 552 bytes.
40 42 44 46 48 507.45
7.5
7.55
7.6
7.65
7.7
7.75x 10
4
Time (second)
Del
ay (
mic
rose
cond
)
Figure 3.19: Delay of single burst vs. time. Utilization is 82.01 % (5 % higher than at the throughput rate) and packet size is 552 bytes. Only a zoom-in interval of 10 seconds is shown.

33
In the Test 3, the traffic load is a single burst of 100,000 packets of
1,518 bytes.
First, we set the utilization to 84.02 %, corresponding to the maximum
throughput rate of 684.93 packets per second or 8.32 Mbps. The burst
duration is 146 seconds. The measured delay was approximately 400
microseconds without traffic load and increased to 2.9 milliseconds with
spikes up to 4 milliseconds during the burst. Because the burst was a
constant stream of packets, we could again observe the regular
appearance of spikes, one every four seconds.
Then, we lowered the utilization by 5 % to 79.01 % and repeated the test.
The burst duration was 155 seconds. The measured delay was again
approximately 400 microseconds without traffic load and increased to
2.9 milliseconds with a few spikes up to 3.5 milliseconds during the
burst. We could observe a fewer number of isolated spikes.
Next we increased the utilization by 5 % to 89.00 %. The burst duration
was 138 seconds. This time, the delay was much higher: approximately
184 milliseconds with a small variation between 183 and 186
milliseconds. Again, delay probes were lost, but less than in the case of
Tests 1 and 2 when the packet sizes were 96 and 552 bytes, respectively.

34
0 30 60 90 120 150 1800
500
1000
1500
2000
2500
3000
3500
4000
4500
Time (second)
Del
ay (
mic
rose
cond
)
Figure 3.20: Delay of single burst vs. time. Utilization is 84.02 % and packet size is 1,518 bytes.
90 92 94 96 98 1002700
2900
3100
3300
3500
3700
3900
4100
Time (second)
Del
ay (
mic
rose
cond
)
Figure 3.21: Delay of single burst vs. time. Utilization is 84.02 % and packet size is 1,518 bytes. Only a zoom-in interval of 10 seconds is shown.

35
0 30 60 90 120 150 1800
500
1000
1500
2000
2500
3000
3500
4000
4500
Time (second)
Del
ay (
mic
rose
cond
)
Figure 3.22: Delay of single burst vs. time. Utilization is 79.01 % (5 % lower than at the throughput rate) and packet size is 1,518 bytes.
90 92 94 96 98 1002700
2900
3100
3300
3500
3700
3900
4100
Time (second)
Del
ay (
mic
rose
cond
)
Figure 3.23: Delay of single burst vs. time. Utilization is 79.01 % (5 % lower than at the throughput rate) and packet size is 1,518 bytes. Only a zoom-in interval of 10 seconds is shown.

36
0 30 60 90 120 150 1800
0.25
0.5
0.75
1
1.25
1.5
1.75
2x 10
5
Time (second)
Del
ay (
mic
rose
cond
)
Figure 3.24: Delay of single burst vs. time. Utilization is 89.00 % (5 % higher than at the throughput rate) and packet size is 1,518 bytes.
90 92 94 96 98 1001.82
1.825
1.83
1.835
1.84
1.845
1.85
1.855
1.86x 10
5
Time (second)
Del
ay (
mic
rose
cond
)
Figure 3.25: Delay of single burst vs. time. Utilization is 89.00 % (5 % higher than at the throughput rate) and the packet size is 1,518 bytes. Only a zoom-in interval of 10 seconds is shown.

37
3.4 MBone and NetMeeting measurements
In this Section, we describe the performance measurements tests with
the MBone and NetMeeting conferencing applications conducted using
the CNL ATM testbed and the Spirent SmartBits 600 box.
Network setup for all performed experiments using the MBone and
NetMeeting application tools is shown in Figure 3.26.
Figure 3.26: Network setup in CNL laboratory at SFU for forwarding performance measurements using the MBone and NetMeeting application tools. SmartBits traffic generator was used to generate delay probes.

38
3.4.1 Testing with MBone application tools
The MBone application tools are described in Chapter 4, Section 4.1.
First test with MBone application:
Audio settings: DVI standard.
Video settings: 3,072 kbps, 30 frames per second, quality set to 1 (the
best quality). Single burst of 64-byte delay probes (IP packets tagged
with time stamps) with packet rate of 10 packets per second.
Second test with MBone application:
Audio settings: DVI standard, 127 TTL, 1 sec.
199.60.7.69, port 29910/11
199.60.7.70, port 29910/11
Video settings: 199.60.7.69, port 1086
199.60.7.70, port 1081
vic 239.255.247.99 port 55552
rat 239.255.170.48 port 29910/11
tcpdump 363,484 packets in video test
369,861 packets captured in video and audio test
9,748 packets captured in audio test.
Maximum rate: 1,024 kbps
30 frames per second
Video size: CIF
Quality: 1
Bandwidth: 125,000 bytes – 1 Mbps.

39
0 100 200 300 400 500 600200
600
1000
1400
1800
2200
Time (second)
Del
ay (
mic
rose
cond
)
Figure 3.27: Delay of single burst vs. time during an MBone session. Only MBone audio application tool was used in the session.
400 420 440 460 480 500200
600
1000
1400
1800
2200
Time (second)
Del
ay (
mic
rose
cond
)
Figure 3.28: Delay of single burst vs. time during an MBone session. Only MBone audio application tool was used in the session. Only a zoom-in interval of 10 seconds is shown.

40
0 100 200 300 400 500 6000
0.5
1
1.5
2
2.5
3x 10
4
Time (second)
Del
ay (
mic
rose
cond
)
Figure 3.29: Delay of single burst vs. time during an MBone session. Only MBone video application tool was used in the session.
400 420 440 460 480 5000
0.5
1
1.5
2
2.5x 10
4
Time (second)
Del
ay (
mic
rose
cond
)
Figure 3.30: Delay of single burst vs. time during an MBone session. Only MBone video application tool was used in the session. Only a zoom-in interval of 10 seconds is shown.

41
0 100 200 300 400 500 6000
0.5
1
1.5
2
2.5
3x 10
4
Time (second)
Del
ay (
mic
rose
cond
)
Figure 3.31: Delay of single burst vs. time during an MBone session. Both audio and video application tools were used in the session.
400 420 440 460 480 5000
0.5
1
1.5
2
2.5x 10
4
Time (second)
Del
ay (
mic
rose
cond
)
Figure 3.32: Delay of single burst vs. time during an MBone session. Both audio and video application tools were used in the session. Only a zoom-in interval of 10 seconds is shown.

42
3.4.2 Testing with NetMeeting application tools
NetMeeting is Microsoft’s conferencing tool that enables PC users to
communicate with other users over the Internet or on a local Intranet. It
enables users to do audio/video conferencing sessions, share
applications and documents, draw in a shared whiteboard, and send files
and messages [17]. Unlike MBone application, NetMeeting was designed
for point-to-point conferencing sessions.
Test with Netmeeting version 3.0:
Audio Netmeeting 199.60.7.69.49608 udp 36
199.60.7.70.49608 udp 36
Video Netmeeting 199.60.7.69.49606 udp variable size
199.60.7.70.49606 udp variable size
tcpdump 78,739 packets in video test
103,374 packets captured in video and audio test
33,077 packets captured in audio test.
Test 1: Full-duplex audio conversation and video transmission disabled.
Test 2: Large window and high-quality video with audio transmission
disabled.
Test 3: Full-duplex audio and large window with high-quality video
transmission.

43
0 100 200 300 400 500 600200
300
400
500
600
700
800
900
1000
Time (second)
Del
ay (
mic
rose
cond
)
Figure 3.33: Delay of single burst vs. time during a NetMeeting session. Only NetMeeting audio tool was used in the session.
200 220 240 260 280 300250
300
350
400
450
500
550
600
Time (second)
Del
ay (
mic
rose
cond
)
Figure 3.34: Delay of single burst vs. time during a NetMeeting session. Only NetMeeting audio tool was used in the session. Only a zoom-in interval of 10 seconds is shown.

44
0 100 200 300 400 500 6000
500
1000
1500
2000
2500
3000
3500
4000
4500
Time (second)
Del
ay (
mic
rose
cond
)
Figure 3.35: Delay of single burst vs. time during a NetMeeting session. Only NetMeeting video tool was used in the session.
200 220 240 260 280 3000
500
1000
1500
2000
2500
3000
3500
Time (second)
Del
ay (
mic
rose
cond
)
Figure 3.36: Delay of single burst vs. time during a NetMeeting session. Only NetMeeting video tool was used in the session. Only a zoom-in interval of 10 seconds is shown.

45
0 100 200 300 400 500 6000
500
1000
1500
2000
2500
3000
3500
4000
4500
Time (second)
Del
ay (
mic
rose
cond
)
Figure 3.37: Delay of single burst vs. time during a NetMeeting session. Both NetMeeting audio and video tools were used in the session.
200 220 240 260 280 3000
500
1000
1500
2000
2500
3000
3500
Time (second)
Del
ay (
mic
rose
cond
)
Figure 3.38: Delay of single burst vs. time during a NetMeeting session. Both NetMeeting audio and video tools were used in the session. Only a zoom-in interval of 10 seconds is shown.

46
3.5 Hub delay measurements
The presence of hubs in the network increases the overall network delay.
In this Section, we describe the measurements of delay performed using
hubs from three different vendors: Linksys, 3Com, and Telesyn.
Figure 3.39: Test setup for the measurements of delay in the presence of the Ethernet hub in the network.
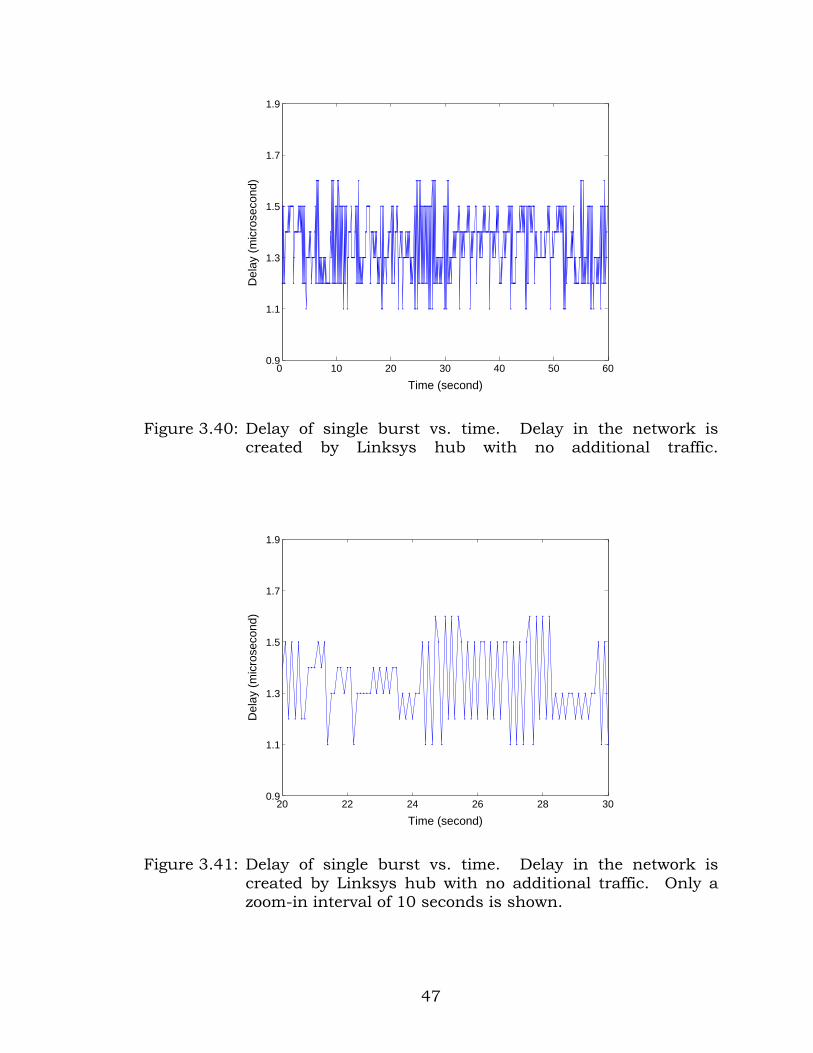
3.5.1 Linksys hub We sent single burst of 600 delay probes (size of 64 bytes, tagged with
time stamps) with packet rate 10 packets per second without traffic load.
3.5.2 3Com hub We sent single burst of 600 delay probes (size of 64 bytes, tagged with
time stamps) with packet rate 10 packets per second without traffic load.
47
0 10 20 30 40 50 600.9
1.1
1.3
1.5
1.7
1.9
Time (second)
Del
ay (
mic
rose
cond
)
Figure 3.40: Delay of single burst vs. time. Delay in the network is created by Linksys hub with no additional traffic.
20 22 24 26 28 300.9
1.1
1.3
1.5
1.7
1.9
Time (second)
Del
ay (
mic
rose
cond
)
Figure 3.41: Delay of single burst vs. time. Delay in the network is created by Linksys hub with no additional traffic. Only a zoom-in interval of 10 seconds is shown.

48
0 10 20 30 40 50 600.9
1.1
1.3
1.5
1.7
1.9
Time (second)
Del
ay (
mic
rose
cond
)
Figure 3.42: Delay of single burst vs. time. Delay in the network is created by 3Com hub with no additional traffic.
20 22 24 26 28 300.9
1.1
1.3
1.5
1.7
1.9
Time (second)
Del
ay (
mic
rose
cond
)
Figure 3.43: Delay of single burst vs. time. Delay in the network is created by 3Com hub with no additional traffic. Only a zoom-in interval of 10 seconds is shown.

49
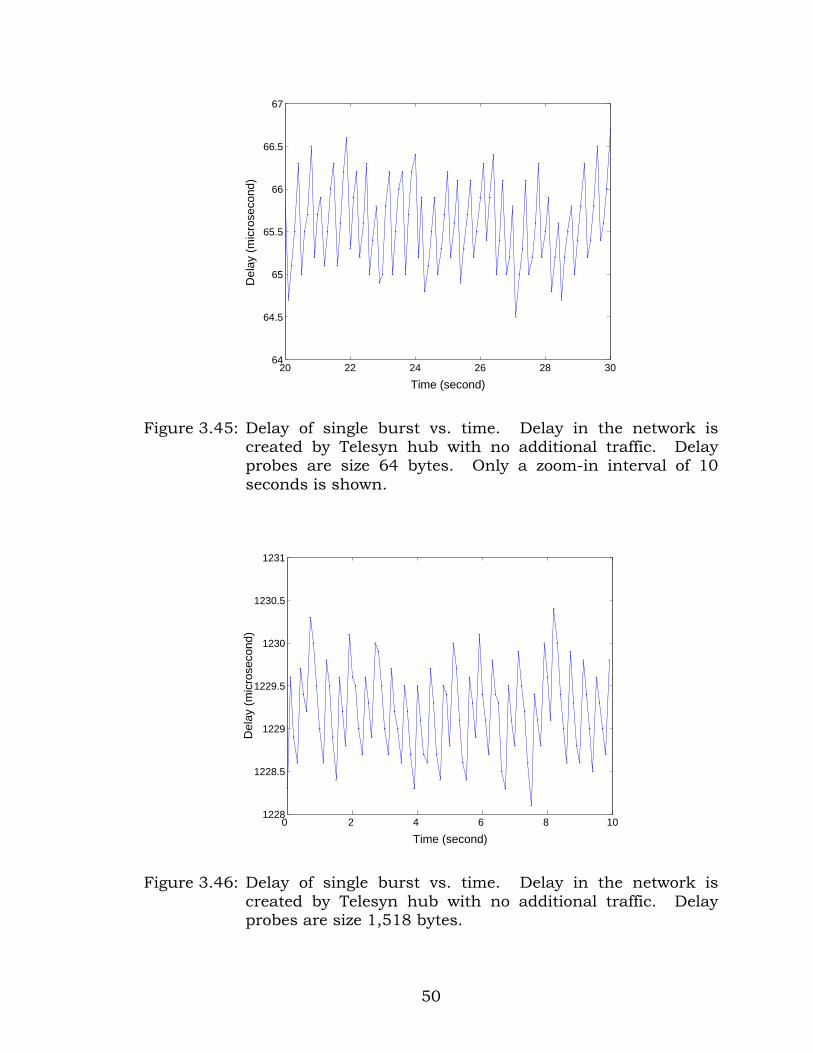
3.5.3 Telesyn hub
While testing with Telesyn hub we discovered that it exhibits much
higher delays compared to Linksys and 3Com hubs. The Telesyn hub
has delay values similar to those of an Ethernet switch. Two tests were
performed using the Telesyn hub:
1. Single burst of 600 delay probes (size of 64 bytes, tagged with
time stamps) with packet rate 10 packets per second without traffic load, shown in Figures 3.44 and 3.45.
2. Single burst of 100 delay probes (size of 1,518 bytes, tagged
with time stamps) with packet rate 10 packets per second without traffic load, shown in Figure 3.46.
0 10 20 30 40 50 6064
64.5
65
65.5
66
66.5
67
Time (second)
Del
ay (
mic
rose
cond
)
Figure 3.44: Delay of single burst vs. time. Delay in the network is created by Telesyn hub with no additional traffic. Delay probes are size 64 bytes.
50
20 22 24 26 28 3064
64.5
65
65.5
66
66.5
67
Time (second)
Del
ay (
mic
rose
cond
)
Figure 3.45: Delay of single burst vs. time. Delay in the network is created by Telesyn hub with no additional traffic. Delay probes are size 64 bytes. Only a zoom-in interval of 10 seconds is shown.
0 2 4 6 8 101228
1228.5
1229
1229.5
1230
1230.5
1231
Time (second)
Del
ay (
mic
rose
cond
)
Figure 3.46: Delay of single burst vs. time. Delay in the network is created by Telesyn hub with no additional traffic. Delay probes are size 1,518 bytes.

51
4 Multimedia conferencing
In this Chapter, we provide an overview of the Internet Multicast
Backbone (MBone) multimedia application tools. We give details of
MBone test sessions and the webcast of the workshop at the 2001
International Fuzzy Systems Association and the North American Fuzzy
Information Processing Society (IFSA/NAFIPS) conference [13], which we
organized. We describe the multicast session as well as details of the
webcast setup.
4.1 MBone
The Internet Multicast Backbone (MBone) is the multicast-capable
backbone of the Internet. It is a virtual network built on top of the
Internet. It shares the same physical media with the Internet, while
using a parallel system of multicast enabled routers connected via high-
bandwidth tunnels. Even though the MBone was originally envisioned as
an experimental network, it currently consists of more than 4,200
multicast routers [19].

52
Before users can participate in an MBone session, they need to launch
the multicast Session Directory tool (sdr). sdr is a tool that helps users
set up and join the multicast sessions [16].
It takes several minutes before names of advertised sessions appear in
the sdr's main window. Once a session has been announced to other
users on sdr, they may join the particular session.
Each session contains the following advertisement:
• Session title
• Session description
• Details about media types used (audio, video, whiteboard, and/or text editor)
• Link to a web page that contains additional information about the session
• Contact details with the identity of the person who created the session
• Time and date when session will take place.
After joining the session, the sdr automatically launches the application
tool corresponding to the media type (audio, video, whiteboard, and/or
text editor) selected for participation in the multicast event. The sdr
ensures that the MBone tools start with the correct multicast IP
addresses and with the right parameters.
If sdr is not available, multicast addresses, port numbers, and TTL
values must be announced through an e-mail, phone, or posting on a
web page. In this case, the appropriate tools can be started manually by
typing the following command for each tool:
name -t ttl address/port,

53
where name corresponds to the tool name (rat, vic, wbd, or nte), ttl
corresponds to the Time-to-Live (TTL) value, and address/port
corresponds to the multicast address and the port number. Variable
port is a User Datagram Protocol (UDP) number, unique to the
broadcast session. It is automatically assigned by the sdr together with
the multicast address. The address used for multicast conferencing
should be in the range from 224.0.0.0 to 239.255.255.255 [8]. The TTL
value determines how far multicast packets can travel across the
Internet. The higher the TTL is, the further destination the packet will
reach. Standard values for TTL are: 15 for the local area network, 63 for
the region, and 127 for the world.
rat (Robust Audio Tool) provides access to audio data. vic
(Videoconferencing Tool) provides access to video data, wbd displays
whiteboard, while nte opens the Network Text Editor. The MBone tools
that we used were developed by researchers at University College of
London (UCL) [16].
vat (Visual Audio Tool), nv (Network Video), wb (Whiteboard), and sd
(Session Directory) are older versions of audio, video, whiteboard, and
session directory tools, respectively [19]. They are the original MBone
tools, developed at the Lawrence Berkeley Laboratory (LBL).
4.2 Multicasting Multicasting is a way of sending data packets across the Internet from a
host computer to a set of hosts that belong to different sub-networks. It
is used for applications, such as videoconferencing, corporate
communications, or distance learning, where many destination hosts

54
choose to receive data from a particular source. The source host sends
data to a specific multicast IP address called a multicast group. Multicast
groups are identified by a Class D IP address in the range from 224.0.0.0
to 239.255.255.255 [8]. Unicast or broadcast transmissions make copies
of a packet while sending it to multiple destinations. The multicast
source sends a packet only once, and, thus, makes the multicast
transmission more efficient [15].
Multicast aware MBone routers use multicast routing protocols to deliver
packets across the Internet to dispersed sub-networks whose member
hosts belong to a specific multicast group. A multicast routing protocol
is responsible for building the multicast distribution trees and for
forwarding the multicast traffic. The most frequently used multicast
routing protocols are the Distance Vector Multicast Routing Protocol
(DVMRP) [25], Protocol Independent Multicast (PIM) [11], and Internet
Group Management Protocol (IGMP) [8].
Many IP routers on the Internet do not support multicast routing for
various reasons. Some organizations do not support multicast to avoid
security problems. Furthermore, some local area networks have
multicast traffic disabled to avoid unnecessary traffic that may cause
performance degradation. This blocking of multicast traffic across
networks prohibits the use of MBone in such environments.
Tunneling is a scheme used for forwarding multicast packets among the
islands of MBone sub-networks (multicast domains) through IP routers
that do not support multicast. This is achieved by encapsulating the IP
multicast datagrams into unicast IP packets and by addressing them to
the routers that support multicast routing. Multicast enabled routers
use the DVMRP protocol that provides connectionless datagram delivery
to multicast group members [9]. Multicast routing capabilities are

55
usually implemented on UNIX workstations running the mrouted
program [10].
4.3 Test session in the Communication Networks Laboratory (CNL) at Simon Fraser University (SFU)
In this Section, we describe the MBone test session performed in the
Communication Networks Laboratory (CNL) at Simon Fraser University
(SFU).
In order to establish an MBone multicast session, it is essential that all
routers between two end points have enabled multicast functionality.
Neither the Centre for Systems Science network (CSSnet) nor the
Academic Computing Services network (ACSnet) at SFU, support
multicast routing outside their respective domains. It is not possible to
establish an MBone session between a machine in the CSSnet (or the
ACSnet) and the outside world. This implies that it is impossible to
establish an MBone conference session between a machine that belongs
to the CSSnet and a machine that belongs to the ACSnet. It is possible,
however, to have an MBone session between two different machines
within the CSSnet or within the ACSnet alone.
One approach to establishing MBone sessions originating from the SFU
campus is tunnelling: i.e., creating a tunnel from a source machine to the
BCnet point of presence and, then, multicasting from there to the
Internet MBone. The source machine needs to have an appropriate video
capture board, video camera, an audio input, and the MBone tools to
create the MBone feed. It also requires a DVMRP tunnel to the machine
(named jade.bc.net) in the BCnet.

56
The DVMRP tunnel, which tunnels IGMP in IP, needs to be established
between the two end points. The tunnel’s end points may be two
workstations running the Unix operating system and the mrouted
program. The mrouted program is loaded with the standard installation
of FreeBSD. In our tests, we used two FreeBSD PCs, one at each end of
the tunnel.
To test the setup on the SFU campus, a machine at the tunnel
termination in Harbour Centre (BCnet POP) was required. The test plan
was to setup the DVMRP tunnel from the CNL laboratory, over the
campus links, to the BCnet and then to the MBone. Upon the successful
test completion, moving equipment to the conference site and connecting
it to the Asynchronous Digital Subscriber Line (ADSL) modem would only
reduce available bandwidth, but the machines would not notice any
operational difference.
We planned to use two different subnets on the CSSnet. The idea was to
have the PC with MBone tools on one subnet sending the multicast
traffic via the DVMRP tunnel to a machine on the other subnet that
terminated the tunnel and routed the multicast to the local network.
This was needed to ensure that the local multicast did not travel through
the local router. In order to verify that the multicast could be received,
the third machine would be used as an MBone client on the remote
subnet where the tunnel terminates.
We subsequently had to change the test plan because the CSSnet does
not have two different subnets. The CSSnet is one network and the
machines within it can join MBone sessions without the tunnel. That
was not the scenario that we wished to test.
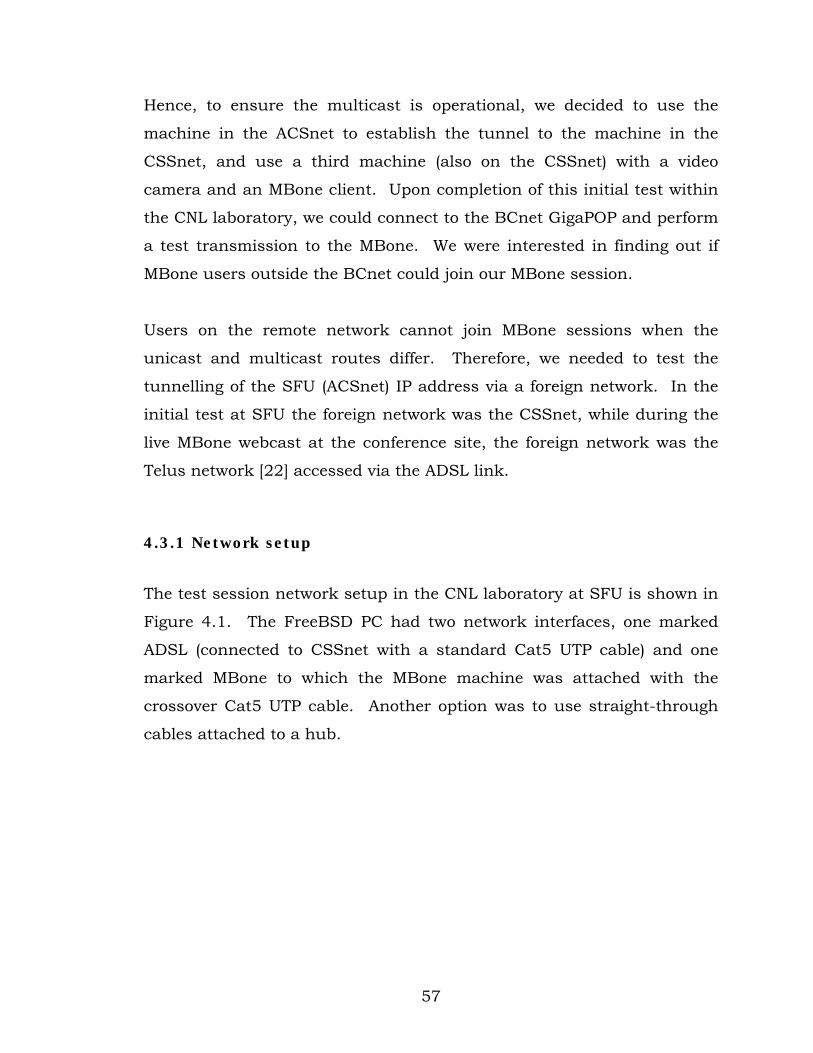
57
Hence, to ensure the multicast is operational, we decided to use the
machine in the ACSnet to establish the tunnel to the machine in the
CSSnet, and use a third machine (also on the CSSnet) with a video
camera and an MBone client. Upon completion of this initial test within
the CNL laboratory, we could connect to the BCnet GigaPOP and perform
a test transmission to the MBone. We were interested in finding out if
MBone users outside the BCnet could join our MBone session.
Users on the remote network cannot join MBone sessions when the
unicast and multicast routes differ. Therefore, we needed to test the
tunnelling of the SFU (ACSnet) IP address via a foreign network. In the
initial test at SFU the foreign network was the CSSnet, while during the
live MBone webcast at the conference site, the foreign network was the
Telus network [22] accessed via the ADSL link.
4.3.1 Network setup
The test session network setup in the CNL laboratory at SFU is shown in
Figure 4.1. The FreeBSD PC had two network interfaces, one marked
ADSL (connected to CSSnet with a standard Cat5 UTP cable) and one
marked MBone to which the MBone machine was attached with the
crossover Cat5 UTP cable. Another option was to use straight-through
cables attached to a hub.

58
Figure 4.1: Network setup for the MBone test session in the Communication Networks Laboratory at SFU.

59
Internet protocol (TCP/IP) settings on the FreeBSD machine used for
testing at SFU are shown in Figure 4.2. The FreeBSD machine had IP
address 199.60.6.131, subnet mask 255.255.240.0, and default gateway
199.60.1.254.
IP Address: 199.60.6.131
Subnet Mask: 255.255.240.0
Default Gateway: 199.60.1.254
DNS Server: 199.60.1.1
DNS Server: 142.58.103.1
Figure 4.2: TCP/IP settings on the FreeBSD machine.
The Internet protocol (TCP/IP) settings on the MBone machine are shown
in Figure 4.3. The MBone client machine had the IP address
142.58.29.34, subnet mask 255.255.255.248, and default gateway
142.58.29.35.
IP Address: 142.58.29.34
Subnet Mask: 255.255.255.248
Default Gateway: 142.58.29.35
DNS Server: 199.60.1.1
DNS Server: 142.58.103.1
Figure 4.3: TCP/IP settings on the MBone machine.
The rc.conf file, which resides in /etc, for the test session in the CNL
laboratory at SFU is shown in Figure 4.4.
# -- sysinstall generated deltas -- #
# Enable network daemons for user convenience.
# This file now contains just the overrides from /etc/defaults/rc.conf
# please make all changes to this file.
gateway_enable="YES"
defaultrouter="142.58.29.17"

60
hostname="mbone1.ensc.sfu.ca"
ifconfig_gif0="inet 142.58.29.18 netmask 255.255.255.248 142.58.29.17"
ifconfig_xl0="inet 199.60.6.131 netmask 255.255.240.0"
ifconfig_rl0="inet 142.58.29.35 netmask 255.255.255.248"
inetd_enable="NO"
kern_securelevel="2"
kern_securelevel_enable="YES"
nfs_server_enable="NO"
portmap_enable="NO"
sendmail_enable="NO"
sshd_enable="YES"
Figure 4.4: The /etc/rc.conf file.
The rc.local file for the test session at SFU is shown in Figure 4.5. The
static route for the 142.58.50.0 network was directed to 199.60.1.254 in
order for the tunnel traffic to reach the ACSnet.
gifconfig gif0 inet 199.60.6.131 142.58.50.1
route add -net 142.58.50.0 199.60.1.254 255.255.255.0
mrouted
Figure 4.5: The /etc/rc.local file.
The DVMRP tunnel was configured in file named mrouted.conf, as:
tunnel 142.58.29.35 128.189.4.1
Figure 4.6: The /etc/mrouted.conf file.
The dual port FreeBSD box in the CNL laboratory (connected to the
CSSnet) acted as a router, an mrouted host, and a tunnel starting point,
all at once. One interface provided the IP address 142.58.29.17 and
accepted the multicast traffic coming from the attached MBone machine.
The second interface was connected to the CSSnet and it routed
multicast traffic to the ACSnet. The CSSnet FreeBSD machine created
an IP in IP tunnel to 142.58.200.252, and an mrouted DVMRP tunnel to

61
jade.bc.net (in the BCnet) with the IP address 128.189.4.1. The second
FreeBSD machine was located in the ACSnet. Its role was to terminate
the IP in IP tunnel and forward the multicast traffic to the BCnet
GigaPOP.
4.3.2 The MBone test session setup
The MBone test session from CNL laboratory at SFU was entitled: "Test
from SFU". The details of used media are shown in Figure 4.7.
PROTOCOL FORMAT ADDRESS/PORT TTL
AUDIO rtp pcm 224.2.218.26/20856 127
VIDEO rtp h.261 224.2.173.55/64872 127
Figure 4.7: The MBone tools used in the test session from the CNL laboratory at SFU.
In the test session announcement, recommended MBone conferencing
tools were rat for audio and vic for video signals. rat and vic should
be started using sdr. If sdr was not available, the audio and video tools
could be started manually with the commands shown in Figure 4.8.
rat -t 127 224.2.218.26/20856
vic -t 127 224.2.173.55/64872
Figure 4.8: The MBone tools started from the command line interface.
4.4 Test session at the IFSA/NAFIPS conference site
In this Section, we describe the test session at the IFSA/NAFIPS
conference site. The goal was to reproduce the test performed at the SFU
campus, described in Section 4.3, and to successfully establish a tunnel

62
to the MBone and create an advertised MBone test session in order to
confirm that the network setup was fully functional for the live webcast.
The test session network setup at the conference site is shown in Figure
4.9. Two tunnels were required for a successful webcast: DVMRP tunnel
and an IP in IP tunnel. The DVMRP tunnel was needed because the
multicast route has to be identical to the unicast route. Users on the
remote network cannot join MBone sessions when the unicast and
multicast routes differ. An additional IP in IP tunnel from the conference
site, over the ADSL line, to SFU (ACSnet) was needed to mask the Telus
IP address so that the conference site appears to be in the SFU address
space. This setup was first tested on the SFU campus by tunnelling the
CSSnet address to the ACSnet, as described in Section 4.3.
The FreeBSD box with the mrouted program installed was used for both
tunnels. The FreeBSD PC had two interface cards: one card connected to
the MBone PC (mbone1.ensc.sfu.ca with address 142.58.29.17) and one
card connected to the CSSnet. The second interface was connected to
the ADSL modem at the conference site. It was necessary to boot the
FreeBSD machine while it was connected to the ADSL modem, in order
for it to accept the addresses assigned by the Dynamic Host
Configuration Protocol (DHCP) server. The appropriate Ethernet MAC
address was already registered with the Telus server that provided the
Telus IP address. The assigned DHCP addresses were then manually
configured on the two FreeBSD boxes on both sides of the IP tunnel to
establish a connection to the ACSnet Cisco router. The IP addresses had
to be changed to match the IP addresses assigned by the ADSL line, and
to enable establishment of the DVMRP tunnel to the BCnet machine
(jade.bc.net).

63
Figure 4.9: Network setup for the MBone test session at the IFSA/NAFIPS conference site.

64
To connect to the commodity MBone network (described in Section 4.3),
the DVMRP tunnel endpoint at the BCnet was configured with the IP
address of the local FreeBSD machine.
4.4.1 Network setup
The rc.conf file, which resides in /etc, for the test session at the
IFSA/NAFIPS conference site is shown in Figure 4.10. The default router
line was commented in order to allow DHCP to set the default route to
the Telus network via ADSL.
# -- sysinstall generated deltas -- #
# Enable network daemons for user convenience.
# This file now contains just the overrides from /etc/defaults/rc.conf
# please make all changes to this file.
gateway_enable="YES"
# defaultrouter="142.58.29.17"
hostname="mbone1.ensc.sfu.ca"
ifconfig_gif0="inet 142.58.29.18 netmask 255.255.255.248 142.58.29.17"
ifconfig_xl0="DHCP"
ifconfig_rl0="inet 142.58.29.35 netmask 255.255.255.248"
inetd_enable="NO"
kern_securelevel="2"
kern_securelevel_enable="YES"
nfs_server_enable="NO"
portmap_enable="NO"
sendmail_enable="NO"
sshd_enable="YES"
Figure 4.10: The /etc/rc.conf file.
The FreeBSD machine was booted while it was connected to the ADSL
modem, in order to accept the addresses assigned by the DHCP server.
The assigned IP addresses are shown in Figure 4.11.

65
IP address: 64.180.53.167
Subnet Mask: 255.255.254.0
Default Gateway: 64.180.52.254
Figure 4.11: Assigned IP addresses.
Routing table was obtained using the command netstat -r: Network Address Netmask Gateway Address Interface
0.0.0.0 0.0.0.0 64.180.52.254 64.180.53.167
64.180.52.0 255.255.254.0 64.180.53.167 64.180.53.167
64.180.53.167 255.255.255.255 127.0.0.1 127.0.0.1
64.255.255.255 255.255.255.255 64.180.53.146 64.180.53.167
127.0.0.0 255.0.0.0 127.0.0.1 127.0.0.1
224.0.0.0 224.0.0.0 64.180.53.167 64.180.53.167
255.255.255.255 255.255.255.255 64.180.53.167 0.0.0.0 Active Connections
Figure 4.12: Routing table.
The routing table, shown in Figure 4.12, provided information about the
assigned IP address (64.180.53.167), default gateway (64.180.52.254),
and subnet mask (255.255.254.0), that were needed to configure the
rc.local file. The IP address of the Telus default gateway
(64.180.52.254) was deleted, and the IP address of the local gateway
(142.58.29.17) was added. The static route for the 142.58.200.0 network
was directed to 64.180.52.254, so that the tunnel traffic could reach the
ACSnet.
The rc.local file for the test session at the conference site is shown in
Figure 4.13.

66
route delete default 64.180.52.254
route add default 142.58.29.17
gifconfig gif0 inet 64.180.53.167 142.58.200.252
route add –net 142.52.200.0 64.180.52.254 255.255.254.0
route add –host 128.189.4.1 142.58.29.17
mrouted
Figure 4.13: The /etc/rc.local file.
The DVMRP tunnel was configured in the mrouted.conf file, as:
tunnel 142.58.29.35 128.189.4.1
Figure 4.14: The /etc/mrouted.conf file.
The default router line in /etc/rc.conf, shown in Figure 4.10, was
uncommented to force a new default route (142.58.29.17), which
represented the tunnel’s starting point. We also changed the tunnel
addresses in /etc/rc.local to match the IP addresses obtained from
the routing table. The edited /etc/rc.conf file is shown in Figure 4.15.
sysinstall generated deltas -- #
# Enable network daemons for user convenience.
# This file now contains just the overrides from /etc/defaults/rc.conf
gateway_enable="YES"
defaultrouter="142.58.29.17"
hostname="mbone1.encs.sfu.ca"
ifconfig_gif0="inet 142.58.29.18 netmask 255.255.255.248 142.58.29.17"
ifconfig_xl0="DHCP"
ifconfig_rl0="inet 142.58.29.35 netmask 255.255.255.248"
inetd_enable="NO"
kern_securelevel="2"
kern_securelevel_enable="YES"
nfs_server_enable="NO"
portmap_enable="NO"
sendmail_enable="NO"
sshd_enable="YES"
Figure 4.15: The edited /etc/rc.conf file.

67
On the other side of the IP in IP tunnel, identical changes had to be
implemented in the ACSnet FreeBSD machine. (The details of the setup
are not available because they were implemented locally by the ACSnet
system administrators.)
In the test session network setup at the conference site, shown in Figure
4.9, the local FreeBSD machine had the IP address 64.180.53.167,
subnet mask 255.255.254.0, and default gateway 64.180.52.254. It
created an IP in IP tunnel to 142.58.200.252, and an mrouted DVMRP
tunnel to jade.bc.net with the IP address 128.189.4.1.
The MBone client machine (mbone1.ensc.sfu.ca) connected to the
FreeBSD box had the IP address 142.58.29.34, subnet mask
255.255.255.248, and default gateway 142.58.29.35. The Internet
protocol (TCP/IP) settings on the MBone machine are shown in Figure
4.16.
IP Address: 142.58.29.34
Subnet Mask: 255.255.255.248
Default Gateway: 142.58.29.35
DNS Server: 199.60.1.1
DNS Server: 142.58.103.1
Figure 4.16: TCP/IP settings on the MBone machine.
4.4.2 The MBone test session At the IFSA/NAFIPS conference site, the MBone client machine was
connected to the FreeBSD box. The test performed at the SFU campus
was repeated to create an advertised session and to verify that MBone
users on the remote networks (outside the BCnet) could join our webcast
session.

68
The MBone test session from the conference site was entitled: "Test
session for IFSA/NAFIPS 2001 Open Forum". The details of used media
are shown in Figure 4.17.
PROTOCOL FORMAT ADDRESS/PORT TTL
AUDIO rtp dvi 224.2.221.255/24026 127
VIDEO rtp h.261 224.2.134.125/56722 127
Figure 4.17: The MBone tools used in the test session at the IFSA/NAFIPS conference site.
In the test session announcement, the recommended MBone
conferencing tools were rat for audio and vic for video signals. rat and
vic should be started using sdr. If sdr was not available the audio and
video tools could be started manually with the commands shown in
Figure 4.18.
rat -t 127 224.2.221.255/24026
vic -t 127 224.2.134.125/56722
Figure 4.18: The MBone tools started from the command line interface.
Two sessions with different administrative scope parameters were
created. The first session had time-to-live parameter TTL = 127 (world
coverage) and the second had TTL = 63 (regional coverage). Both settings
were sufficient to reach machines connected to the CA*net 3/Internet2
MBone network.
Our advertised session was seen in the USA only. This proved that there
is no connection between CA*net 3/Internet2 and the commodity MBone.
In order to access both MBone networks, additional changes needed to
be made in the tunnel and the ACSnet router configuration setup.

69
4.5 Live MBone multicast session of the Open Forum workshop at IFSA/NAFIPS 2001 conference
In this Section, we describe the live webcast MBone session of the Open
Forum workshop held at the IFSA/NAFIPS 2001 conference in Vancouver
on July 25-28, 2001. We describe here the network setup and the
collection of the genuine audio and video traffic traces during the
multicast.
The webcast session network setup is shown in Figure 4.19. The dual
port FreeBSD machine at the IFSA/NAFIPS conference site was routing
between the 142.58.29.32/29 interface and the 142.58.29.16/29
interface. The MBone machine (mbone1.ensc.sfu.ca with IP address
142.58.29.34) was connected to FreeBSD machine on the interface
142.58.29.35. 142.58.29.17 was the default route for the FreeBSD
machine at the conference site and the tunnel’s starting point. mrouted
on the same FreeBSD machine created a DVMRP tunnel to jade.bc.net
(the MBone machine at the BCnet GigaPOP). This machine (jade.bc.net)
had an additional DVMRP tunnel to the commodity MBone.
The IP in IP tunnel routed traffic arriving at the physical interface of the
FreeBSD box to the ADSL line, and from the Telus network to the
machine 142.58.50.1 on the ACSnet at SFU. The FreeBSD PC in the
ACSnet had a connection to an Ethernet port on the SFU Cisco 7505
interface router to the BCnet via an OC3 ATM network connection. That
router is the termination point of the IP in IP tunnel. The purpose of this
tunnel was to hide the Telus ADSL link from the unicast routing path, so
that the multicast route from jade.bc.net matches the unicast route from
MBone machine (142.58.29.34) at the conference site.

70
Figure 4.19: Network setup for the MBone webcast session at the IFSA/NAFIPS 2001 conference.

71
4.5.1 Network setup
The rc.conf file for the IFSA/NAFIPS 2001 webcast session at the
conference site is shown in Figure 4.20. The default router line was
commented in order to allow the DHCP to set the default route to the
Telus network via ADSL.
# -- sysinstall generated deltas -- #
# Enable network daemons for user convenience.
# This file now contains just the overrides from /etc/defaults/rc.conf
# please make all changes to this file.
gateway_enable="YES"
# defaultrouter="142.58.29.17"
hostname="mbone1.ensc.sfu.ca"
ifconfig_gif0="inet 142.58.29.18 netmask 255.255.255.248 142.58.29.17"
ifconfig_xl0="DHCP"
ifconfig_rl0="inet 142.58.29.35 netmask 255.255.255.248"
inetd_enable="NO"
kern_securelevel="2"
kern_securelevel_enable="YES"
nfs_server_enable="NO"
portmap_enable="NO"
sendmail_enable="NO"
sshd_enable="YES"
Figure 4.20: The /etc/rc.conf file.
The FreeBSD machine was booted while it was connected to the ADSL
modem in order to accept the addresses assigned by the DHCP server.
The assigned IP addresses are shown in Figure 4.21.
IP address: 64.180.52.169
Subnet Mask: 255.255.254.0
Default Gateway: 64.180.52.254
Figure 4.21: Assigned IP addresses.

72
Routing table was obtained using the command netstat -rn:
Routing tables
Internet:
Destination Gateway Flags Refs Use Netif
default 64.180.52.254 UGSc 2 21 xl0
64.180.52/23 link #1 UC 0 0 gif0
127.0.0.1 127.0.0.1 UH 0 2 l0
142.58.29.32/29 link #2 UC 0 0 rl0
Figure 4.22: Routing table.
The routing table, shown in Figure 4.22, provided information about the
assigned IP address (64.180.52.169), default gateway (64.180.52.254),
and subnet mask (255.255.254.0), that were needed to configure the
rc.local file. The IP address of the Telus default gateway
(64.180.52.254) was deleted, and the IP address of the local gateway
(142.58.29.17) was added. The static route for the 142.58.50.0 network
was directed to 64.180.52.254, so that the tunnel traffic could reach the
ACSnet.
The rc.local file for the IFSA/NAFIPS 2001 webcast session is shown in
Figure 4.23.
route delete default 64.180.52.254
route add default 142.58.29.17
gifconfig gif0 inet 64.180.52.169 142.58.50.1
route add -net 142.58.50.0 64.180.52.254 255.255.255.0
route add -net 142.58.103.0 64.180.52.254 255.255.255.0
mrouted
Figure 4.23: The /etc/rc.local file.

73
The DVMRP tunnel was configured in the mrouted.conf file, as:
tunnel 142.58.29.35 128.189.4.1
Figure 4.24: The /etc/mrouted.conf file.
The default router line in the /etc/rc.conf file, shown in Figure 4.20,
was uncommented to force a new default route (142.58.29.17), which is
the tunnel’s starting point. We also changed tunnel addresses in the
/etc/rc.local file to match the IP addresses obtained from the routing
table. The edited /etc/rc.conf file is shown in Figure 4.25.
sysinstall generated deltas -- #
# Enable network daemons for user convenience.
# This file now contains just the overrides from /etc/defaults/rc.conf
# please make all changes to this file.
gateway_enable="YES"
defaultrouter="142.58.29.17"
hostname="mbone1.encs.sfu.ca"
ifconfig_gif0="inet 142.58.29.18 netmask 255.255.255.248 142.58.29.17"
ifconfig_xl0="DHCP"
ifconfig_rl0="inet 142.58.29.35 netmask 255.255.255.248"
inetd_enable="NO"
kern_securelevel="2"
kern_securelevel_enable="YES"
nfs_server_enable="NO"
portmap_enable="NO"
sendmail_enable="NO"
sshd_enable="YES"
Figure 4.25: The edited /etc/rc.conf file.
On the other side of the IP in IP tunnel, identical changes had to be
implemented in the ACSnet FreeBSD machine. (The details of the setup
are not available because they were implemented locally by the ACSnet
system administrators.)

74
During the webcast session network setup at the conference site, shown
in Figure 4.19, the local FreeBSD machine had the IP address
64.180.52.169, subnet mask 255.255.254.0, and default gateway
64.180.52.254. It created an IP in IP tunnel to 142.58.50.1, and an
mrouted DVMRP tunnel to jade.bc.net (BCnet) with the IP address
128.189.4.1.
4.5.2 The MBone live session
The MBone webcast session from the conference was entitled:
“IFSA/NAFIPS 2001 Open Forum session”. The details of the media used
are shown in Figure 4.26.
PROTOCOL FORMAT ADDRESS/PORT TTL
AUDIO rtp pcm 224.2.160.30/20038 127
VIDEO rtp h.261 224.2.152.112/65504 127
Figure 4.26: The MBone tools used in the webcast session.
In the webcast session announcement, the recommended MBone
conferencing tools were rat for audio and vic for video signals. rat and
vic tools should be started using sdr. If sdr was not available, the
audio and video tools could be started manually with the commands
shown in Figure 4.27.
rat -t 127 224.2.160.30/20038
vic -t 127 224.2.152.112/65504
Figure 4.27: The MBone tools started from the command line interface.

75
Figure 4.28: The sdr, rat, and vic MBone application tools setup for the live session at the IFSA/NAFIPS 2001 conference.
The sdr, rat, and vic MBone tools setup, before the live MBone webcast
session at the IFSA/NAFIPS conference had started, is shown in Figure
4.28.

76
Figure 4.29: The audio/video and measurement equipment setup for the live webcast session.
The audio/video and measurement equipment setup used for the live
MBone webcast session at the IFSA/NAFIPS conference is shown in
Figure 4.29. The video signal was captured with a Sony Hi8 video
camera and converted to a digital signal by Hauppauge WinTV - USB
video capture. Audio signals were captured with four PZM microphones
and an audio mixer. Genuine traffic traces were captured using
tcpdump on two laptop PCs.
Video-recorded webcast was processed using Adobe Premiere 6.0 [24].
Archived webcast has been posted on the IFSA/NAFIPS web page and it
is available in Real Player and Windows Media Player format [2].

77
5 Conclusion
The main purpose of this project was to measure and evaluate the
performance of multimedia transmissions in IP over ATM networks. In
this Chapter, we present a summary of our achievements and give
possible future research directions.
To measure the performance of multimedia transmissions in an IP over
ATM network, we built an ATM testbed in the Communication Networks
Laboratory at SFU. The ATM testbed is comprised two Newbridge
Networks 36150 MainStreet ATMnet access switches, two Pentium III PC
workstations, and one UNIX Ultra 5-270 workstation.
To monitor the CNL ATM testbed and to capture genuine traffic traces,
we created the ATM Traffic Monitor tool (ATMscript), a simple network
management graphical user interface written in the Tcl/Tk and Expect
scripting languages. The ATMscript enabled efficient graphical capture
of the aggregate traffic sent through the Ethernet cards of the ATM
switches.
The main parameters for measuring forwarding performance and quality
of service in multimedia applications are throughput, packet loss, and
delay. To measure and analyze throughput and packet delay, we used a

78
Spirent Communications' SmartBits 600 load generator and protocol
analyzer connected to the CNL ATM testbed. We executed a set of tests
using the MBone and NetMeeting multimedia conferencing applications
to generate traffic during audio and video transmissions between two
PCs connected to the CNL ATM network.
We performed several test multicasts to the Internet Multicast Backbone
(MBone) and organized the multicasting session of the Open Forum
workshop held at the IFSA/NAFIPS 2001 conference, held in Vancouver.
Archived webcast has been posted on the IFSA/NAFIPS web page and it
is available in Real Player and Windows Media Player format. The MBone
is a virtual network built on top of the Internet, which comprises
multicast enabled routers connected with virtual links called tunnels.
Connection to the MBone network was established using DVMRP
tunnelling through the ADSL link (provided by Telus) to the BCnet
GigaPoP, via the SFU campus network. Audio and video signals from the
session were sent to the MBone using the sdr, rat, and vic MBone
multimedia conferencing tools. Genuine traffic traces were collected
during the multicast and were later used to analyze the impact of traffic
on network performance.

79
References
[1] A. Alles, “ATM Internetworking,” May 1995. http://www.cisco.com/warp/public/614/12.html [December 1,
2002].
[2] Archived webcast of the IFSA/NAFIPS 2001 Open Forum: http://morden.csee.usf.edu/Nafipsf/openforumIfsaNafips2001.html [December 1, 2002].
[3] Argus Technologies, “RST 48/30 switched mode rectifier/battery eliminator,” Instruction manual, 1988.
[4] ATM User-Network Interface (UNI) Specification, Version 3.1. Upper Saddle River, NJ: Prentice Hall Inc., 1995.
[5] S. Bradner and J. McQuaid, “Benchmarking Methodology for Network Interconnect Devices,” Request for Comments 2544, Internet Engineering Task Force, March 1999.
http://www.ietf.org/rfc/rfc2544.txt [December 1, 2002].
[6] S. Bradner and J. McQuaid, “Benchmarking Methodology for Network Interconnect Devices,” Request for Comments 1944, Internet Engineering Task Force, May 1996.
http://www.ietf.org/rfc/rfc1944.txt [December 1, 2002].
[7] C. F. Coombs, Jr. and C. A. Coombs, Communications Network Test and Measurement Handbook. New York, NY: McGraw-Hill, 1998.

80
[8] S. Deering, “Host extensions for IP multicasting,” Request for Comments 1112, Internet Engineering Task Force, August 1989. http://www.ietf.org/rfc/rfc1112.txt [December 1, 2002].
[9] Distance Vector Multicast Routing Protocol (DVMRP) Overview, Juniper. http://www.juniper.net/techpubs/software/junos50/swconfig50-multicast/html/dvmrp-overview.html [December 1, 2002].
[10] H. Eriksson, “MBone: The Multicast Backbone,” Communications of the ACM, Vol.37, No.8, August 1994.
[11] D. Estrin et al., “Protocol Independent Multicast - Sparse Mode (PIM-SM): Protocol Specification,” Request for Comments 2362, Internet Engineering Task Force, June 1998.
http://www.ietf.org/rfc/rfc2362.txt [December 1, 2002].
[12] M. Fester, “Performance issues for high-end video over ATM,” August 1995.
http://www.cisco.com/warp/public/cc/so/neso/vvda/atm/ vidat_wp.htm [December 1, 2002].
[13] International Fuzzy Systems Association and the North American Fuzzy Information Processing Society (IFSA/NAFIPS) conference,
Vancouver, July 25-28, 2001. http://morden.csee.usf.edu/Nafipsf/ifsanafips2001/home.html
[December 1, 2002].
[14] C. Ling, “ATM Traffic Monitor,” ENSC 494 Special Project Laboratory, July 2001.
[15] V. Kumar, “Real-time multimedia broadcasts with the Internet Multicast Backbone,” February 1997. http://www.microsoft.com/ Mind/0297/mbone/mbone.htm [December 1, 2002].
[16] MBone conferencing applications: http://www-mice.cs.ucl.ac.uk/multimedia/software/ [December 1,
2002].

81
[17] Netmeeting conferencing application: http://www.microsoft.com/windows/netmeeting/ [December 1,
2002].
[18] Newbridge Networks 36150 MainStreet ATMnet Technical Practices, 1994.
[19] K. Savetz, N. Randall, and Y. Lepage, MBONE: Multicasting Tomorrow's Internet. Foster City, CA: IDG Books Worldwide, Inc., 1996.
[20] Scriptics, “Tcl/Tk software,” http://www.scriptics.com [December 1, 2002].
[21] Spirent Communications, “Portable High-Density Network Performance Analysis System: SmartBits 600.”
http://www.spirentcom.com [December 1, 2002].
[22] telus.net: Internet service provider. http://www.telus.net/ [December 1, 2002].
[23] Test Automation for Network Routing Devices, Agilent Technologies, 2001.
[24] E. Yan, “Video Transmission over ATM Network Simulation,” CMPT 894 Directed Reading, December 2001.
[25] D. Waitzman, C. Partridge, and S. Deering, “Distance Vector Multicast Routing Protocol,” Request for Comments 1075, Internet Engineering Task Force, November 1988.
http://www.ietf.org/rfc/rfc1075.txt [December 1, 2002].