Performance Measure Recommendations Greg Pierce – Chair, Performance Measures Task Force...
21
Performance Measure Performance Measure Recommendations Recommendations Greg Pierce – Chair, Performance Measures Task Force Compliance and Certification Committee Meeting September 8-9, 2010
-
Upload
wilfrid-burns -
Category
Documents
-
view
215 -
download
0
Transcript of Performance Measure Recommendations Greg Pierce – Chair, Performance Measures Task Force...

Performance Measure Performance Measure RecommendationsRecommendations
Greg Pierce – Chair, Performance Measures Task Force
Compliance and Certification Committee Meeting
September 8-9, 2010

2TopicsTopics
PMTF Tasks and Status
Performance Measure Recommendations
Performance Measure Trends
Next Steps

3TasksTasks
Establish an open, consistent and repeatable metric development process to identify and evaluate metrics
Develop compliance improvement measures at the highest levels to provide insight in terms of a set of compliance principles
Coordinate and work with Regional Entities, RMWG, OC, PC and CIPC to ensure agreement
Recommend how to benefit from the compliance improvement measures

4StatusStatus
Adopted RMWG’s open metric development process
Reviewed data source on compliance and other key input factors
Proposed a set of performance measures at high levels
Gathered data and validated preliminary trends
Received feedback from CCC, OC/PC, RMWG, Regional Entities and NERC staff since June 2010
The final report is available at http://www.nerc.com/docs/compliance/pmtf/Compliance_Performance_Measure_Recommendations_Final.pdf

5Performance Measure RecommendationsPerformance Measure Recommendations
Self Disclosure Compare self disclosed versus discovered violations
Timeliness of CVI/CIQ Resolutions
Average duration of CVI/CIQ and number of lessons learned issued
Mitigation Plan Average duration for mitigation plan implementation
Violation Risk Risk factor and severity level weighted average based on unmitigated violations
Feedback Timeliness and Effectiveness
Actionable lessons learned guidance from audits, operating experience, violations and disturbances
Feedback to Standards Direct input to standards development, including results-based standards initiative
Audit Results Timeliness Average duration for no-violation audit report completion
Enforcement Results Timeliness
Average duration for audit reports with potential violations
.

6Self DisclosureSelf Disclosure
0
100
200
300
400
500
2007 2008 2009 2007 2008 2009 2007 2008 2009
Self-Report Compliance Audit Self-Certification
Co
un
t
Reported Violation Trend By Discovery Method and Submission Year(June 18, 2007 - December 31, 2009)
OTHER PRC005 CIP001

7Self Disclosure (cont’d)Self Disclosure (cont’d)
2007 2008 2009
Total 575 1121 797
Dismissed 327 441 117
Self Certification 111 154 183
Self Report 137 526 497
0
200
400
600
800
1000
1200
Co
un
tSelf Disclosed Violations - Including Dismissed
(June 18, 2007 - December 31, 2009)

8Timeliness of CVI/CIQTimeliness of CVI/CIQ
0 10 20 30 40
NERC CIQs
NERC CVIs
Regional CIQs
Regional CVIs
Count
Status of NERC/Regional CIQs and CVIs(June 18, 2007 - June 30, 2010)
Open
Closed
CIQ - Compliance Inquiry CVI - Compliance Violation Investigation

9Timeliness of CVI/CIQ (cont’d)Timeliness of CVI/CIQ (cont’d)
0
200
400
600
800
1000
2007 2008 2009 2008 2009 2008 2009 2008 2009
REGIONAL CVI REGIONAL CIQ NERC CVI NERC CIQ
Aver
age
Dur
ation
(Day
s)
Average Duration for Closed CVIs and CIQs(June 18, 2007 - December 31, 2009)

10
Average Duration of Average Duration of Mitigation Plan CompletionMitigation Plan Completion
0
50
100
150
200
250
1Q2008 2Q2008 3Q2008 4Q2008 1Q2009 2Q2009 3Q2009 4Q2009
Ave
rag
e D
ura
tio
n (
Day
s)
Average Duration for Completing Mitigation by Quarter (1Q2008 - 4Q2009)

11Violation Risk IndexViolation Risk Index
1Q 2008 2Q 2008 3Q 2008 4Q 2008 1Q 2009 2Q 2009 3Q 2009 4Q2009 1Q 2010 2Q2010
CIP-007 0.0 0.0 0.1 2.4 2.4 2.4 2.2 3.4 4.0 4.1
FAC-001 4.4 4.4 4.4 4.2 3.6 3.5 3.2 3.0 2.6 2.0
EOP-005 5.4 5.3 4.1 3.9 3.7 1.9 1.8 4.3 3.1 2.0
PER-002 6.5 6.1 5.3 5.1 4.1 4.0 2.4 4.4 4.4 3.4
PRC-005 26.4 25.6 24.6 22.6 20.9 19.5 16.3 16.1 13.5 13.0
Other Standards 57.2 66.2 64.9 68.6 65.8 61.0 61.3 44.2 45.5 46.2
0
20
40
60
80
100
120
Viol
atio
n R
isk
Inde
x
Top 5 High Risk Violation Trend by Quarter (1Q 2008 - 2Q 2010)

12
Timeliness of Lessons-LearnedTimeliness of Lessons-Learned
02468
10121416
0 0 12 14 13 10 4 0 0 0 2 2 1 12 4 0 0 5
2008 2009 2010 2008 2009 2010 2008 2009 2010 2008 2009 2010 2008 2009 2010 2008 2009 2010
Lessons Learned Advisories Recommendations Compliance Analysis Public Notice Compliance Application Notices
Co
un
t
Availability of Lessons Learned and Guidance (June 18, 2007- July 31, 2010)
Special Considerations: The speed by which the lessons learned are completed and issued may also relate to whether a particular lesson is common to the industry or some segment of the industry. The complete data to measure the Timeliness of Lessons Learned is currently not available.

13
Feedback to StandardsFeedback to Standards
Number of SARsNumber of
InterpretationsNumber of
Suggestions
2009 9 20 39
2008 9 7 13
2007 15 15 9
Cou
nts
Direct Input to Standards Development(June 18, 2007 - December 31, 2009)

14
Average Duration of Audit Report Average Duration of Audit Report Completion w/ No ViolationsCompletion w/ No Violations
0
30
60
90
120
150
180
210
240
3Q 4Q 1Q 2Q 3Q 4Q 1Q 2Q 3Q 4Q 1Q 2Q
2007 2008 2009 2010
Avera
ge D
ura
tio
n (
Days)
Year and Quarter
Average Duration for No-Violation Audit Report Completion(3Q2007 - 2Q2010)

15
Average Duration of Audit Report Average Duration of Audit Report Completion w/ Possible ViolationsCompletion w/ Possible Violations
0
100
200
300
400
500
600
700
800
3Q 4Q 1Q 2Q 3Q 4Q
2007 2008
Ave
rage
Dur
atio
n (D
ays)
Year and Quarter
Average Duration for Audit Report Completion with Possible Violations (3Q2007 - 4Q2008)

16
Scope for the Performance Measures Working Group
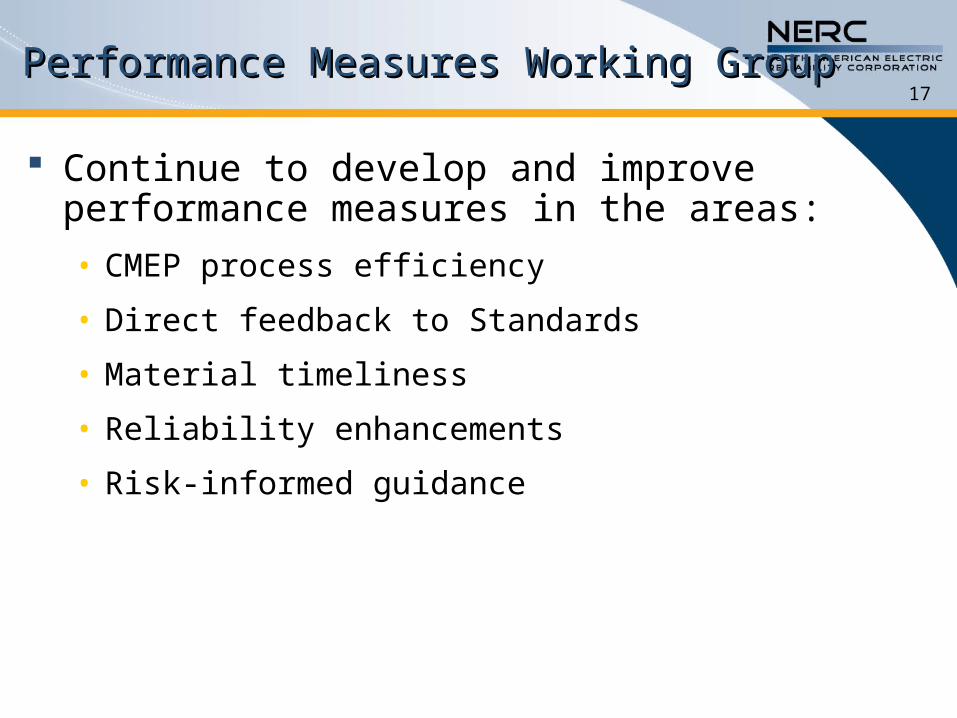
17Performance Measures Working GroupPerformance Measures Working Group
Continue to develop and improve performance measures in the areas:
• CMEP process efficiency
• Direct feedback to Standards
• Material timeliness
• Reliability enhancements
• Risk-informed guidance
18Scope (cont’d)Scope (cont’d)
Define data collection and reporting guidelines
Publish quarterly website updates on compliance performance measures
Provide relevant prioritized feedback to enhance the performance under the compliance program and standards development programs, as well as enhance the reliability of the bulk power system
Provide an annual report assesses trends and recommendations.

19
Recommended Action by CCC

20Recommended Action by CCC Recommended Action by CCC
The PMTF recommends that the Compliance and Certification Committee
• Approve the report “Compliance Performance Measure Recommendations”
• Approve the scope of the Performance Measures Working Group

21
Questions & Answers