
Performance Matters: A Framework for Technical Assistance ...Performance Matters: A Framework for...
1
Performance Matters: A Framework for Technical Assistance in HIV Testing Elizabeth Ortiz, Maureen Malavé, Amanda Moy, Benjamin Tsoi New York City Department of Health and Mental Hygiene, Queens, NY Issue Project Lessons Learned Results FSU Contact: Maureen Malavé [email protected] 347-396-7714 Figure 4. Proportion Ever Linked to Care Among Newly Diagnosed Positives for Outreach and SNS HIV Testing Contracts, 2012–2014* Setting • Site: The DOHMH HIV Testing Program funds 26 agencies to implement priority population testing through social network strategy (SNS) and outreach testing. • Staffing: A team of six Master’s level public health professionals provides TA to HIV testing programs in clinical and community settings. The team consists of a Director, a Data Analyst and 4 Project Officers (POs). • Management: The DOHMH works closely with an administrative contractor to manage fee-for-service contracts with agencies. • Goal: To build agency capacity to meet outcome expectations that focus on identifying, confirming and promptly linking newly diagnosed clients to care. • New York City (NYC) has one of the largest HIV epidemics in the United States; with an estimated 117,000 people diagnosed and living with HIV. • Among the 2,832 new HIV diagnoses in 2013, 1,609 (56.8%) were among men who had sex with men (MSM) and 42 (1%) were among transgender women (TG). • To reach populations at high risk and improve outcomes along the care continuum, the NYC Department of Health and Mental Hygiene (DOHMH) funds and provides technical assistance (TA) to HIV testing programs. Since 2009, POs have provided TA to NYC DOHMH-funded HIV testing programs focusing on 4 areas (Figure 1): 1) Build Capacity • Conduct trainings on testing models, outreach strategies and linkage to care (LTC). • Provide updates and guidance on testing technologies and combination prevention methods. • Coordinate workshops and trainings on reporting and data utilization. • Provide one-to-one TA sessions tailored to agency needs. 2) Improve Data Quality • Compile reports to identify incomplete, inaccurate, or missing data and provide data management recommendations to agencies. • Make changes to the data reporting system to better track services. 3) Review Performance • Evaluate performance against outcome expectations for HIV positivity and LTC on a quarterly basis, highlighting program strengths and areas for improvement. • Monitor targeted testing for priority populations (MSM and TG clients) and provide TA on increasing testing in these populations. • Work with underperforming agencies to develop program improvement plans. 4) Provide Access to Resources, Tools and Information • Provide updates on policy and resources for program planning. • Organize bi-annual provider meetings to share best practices. • Build and strengthen partnerships among agencies. • Data quality has improved across contracts as a result of TA and data management activities. • The percentage of HIV-positive individuals classified as newly or previously diagnosed verses missing diagnosis classification increased over time (Figure 2). • For both the outreach and SNS contracts, the newly diagnosed positivity rate exhibited an upward trend over time (Figure 3). • LTC among outreach contracts exhibited an upward trend over time, however LTC among SNS contracts did not (Figure 4). • The proportion of MSM and TG among all clients tested by outreach and SNS contracts increased between 2012–2014 (Figure 5). Acknowledgements • The DOHMH receives support from the CDC and HRSA to provide TA to agencies to implement outreach and SNS HIV testing. • We would like to acknowledge our NYC DOHMH colleagues for their feedback and review. Capacity Building: • Building management capacity for monitoring programs and conducting quality assurance is critical for improving performance. • Because there is high staff turnover at many agencies, on-going trainings and booster sessions are necessary. Data Utilization: • Data quality checks and performance reviews facilitate progress toward outcome expectations. • Developing and monitoring improvement plans are key interventions for agencies that need additional support to meet targets. Responsive Programming: • Reaching high risk populations requires an innovative, culturally sensitive and dynamic approach. o Agencies that were able to reach young MSM of color recruited clients at kiki parties, which are house balls for young MSM and TG individuals. o Outreach at sex clubs and private parties yielded a high number of newly diagnosed positive clients. Focus: • Initially SNS agencies focused on finding positives; now that this has been achieved, they are shifting focus to improving LTC. LTC is still a challenge for SNS, in part because the people reached may be more marginalized. • Moving forward, we will build on our robust TA model and support agencies to integrate combination HIV prevention strategies, including pre- and post-exposure prophylaxis. Figure 5. Proportion of MSM and TG among all Clients Tested through Outreach and SNS HIV Testing Contracts, 2012–2014 Figure 3. Newly Diagnosed Positivity Rate for Outreach and SNS HIV Testing Contracts, 2012–2014 Figure 2. Classification of Preliminary Positives for Outreach and SNS HIV Testing Contracts, 2012–2014* Figure 1. Conceptual Framework: Iterative Technical Assistance Model for HIV Testing Programs 76.4% 99.6% 100% 0% 10% 20% 30% 40% 50% 60% 70% 80% 90% 100% 2012 2013 2014 Confirmed positives (%) Calendar Year Newly Diagnosed Previously Diagnosed Positive, Missing Diagnosis Classification *Determined at screening. Those classified as negative, indeterminate, invalid, or have no result/missing at screening test are not included (n=34). (n=288) (n=201) (n=235) 63.2% 70.4% 74.4% 0.0% 10.0% 20.0% 30.0% 40.0% 50.0% 60.0% 70.0% 80.0% 90.0% 100.0% 2012 2013 2014 Linked to care (%) Calendar Year Outreach Poster Session B CP53 0.36% 0.55% 0.64% 1.01% 1.30% 1.97% 0.00% 0.50% 1.00% 1.50% 2.00% 2.50% 2012 2013 2014 Positivity (%) Calendar Year Outreach SNS 2012 2013 2014 Outreach Testing Newly Diagnosed 95 98 86 All Screened 26,164 17,851 13,511 SNS Testing Newly Diagnosed 61 64 66 All Screened 6,034 4,912 3,346 Outreach 2012 2013 2014 Ever linked 60 69 64 All Newly Diagnosed 95 98 86 73.8% 78.1% 72.7% 0.0% 10.0% 20.0% 30.0% 40.0% 50.0% 60.0% 70.0% 80.0% 90.0% 100.0% 2012 2013 2014 Linked to care (%) Calendar Year *Includes newly diagnosed confirmed positives clients ever linked to care. SNS 2012 2013 2014 Ever linked 45 50 48 All Newly Diagnosed 61 64 66 Outreach 0.00% 5.00% 10.00% 15.00% 20.00% 25.00% 30.00% 35.00% 2014 2013 2012 MSM* Transgender* (MTF and FTM) *Each figure=1% SNS 0.00% 5.00% 10.00% 15.00% 2014 2013 2012 Proportion of Clients Tested (%) SNS
Transcript of Performance Matters: A Framework for Technical Assistance ...Performance Matters: A Framework for...
Performance Matters: A Framework for Technical Assistance in HIV Testing
Elizabeth Ortiz, Maureen Malavé, Amanda Moy, Benjamin Tsoi New York City Department of Health and Mental Hygiene, Queens, NY
Issue
Project
Lessons Learned
Results
FSU
Contact: Maureen Malavé
347-396-7714
Figure 4. Proportion Ever Linked to Care Among Newly Diagnosed
Positives for Outreach and SNS HIV Testing Contracts, 2012–2014*
Setting
• Site: The DOHMH HIV Testing Program funds 26 agencies to implement priority population testing through social network strategy (SNS) and outreach testing.
• Staffing: A team of six Master’s level public health professionals provides TA to HIV testing programs in clinical and community settings. The team consists of a Director, a Data Analyst and 4 Project Officers (POs).
• Management: The DOHMH works closely with an administrative contractor to manage fee-for-service contracts with agencies.
• Goal: To build agency capacity to meet outcome expectations that focus on identifying, confirming and promptly linking newly diagnosed clients to care.
• New York City (NYC) has one of the largest HIV epidemics in the United States; with an estimated 117,000 people diagnosed and living with HIV.
• Among the 2,832 new HIV diagnoses in 2013, 1,609 (56.8%) were among men who had sex with men (MSM) and 42 (1%) were among transgender women (TG).
• To reach populations at high risk and improve outcomes along the care continuum, the NYC Department of Health and Mental Hygiene (DOHMH) funds and provides technical assistance (TA) to HIV testing programs.
Since 2009, POs have provided TA to NYC DOHMH-funded HIV testing programs focusing on 4 areas (Figure 1):
1) Build Capacity • Conduct trainings on testing models, outreach strategies and linkage
to care (LTC). • Provide updates and guidance on testing technologies and
combination prevention methods. • Coordinate workshops and trainings on reporting and data
utilization. • Provide one-to-one TA sessions tailored to agency needs. 2) Improve Data Quality • Compile reports to identify incomplete, inaccurate, or missing data
and provide data management recommendations to agencies. • Make changes to the data reporting system to better track services. 3) Review Performance • Evaluate performance against outcome expectations for HIV
positivity and LTC on a quarterly basis, highlighting program strengths and areas for improvement.
• Monitor targeted testing for priority populations (MSM and TG clients) and provide TA on increasing testing in these populations.
• Work with underperforming agencies to develop program improvement plans.
4) Provide Access to Resources, Tools and Information • Provide updates on policy and resources for program planning. • Organize bi-annual provider meetings to share best practices. • Build and strengthen partnerships among agencies.
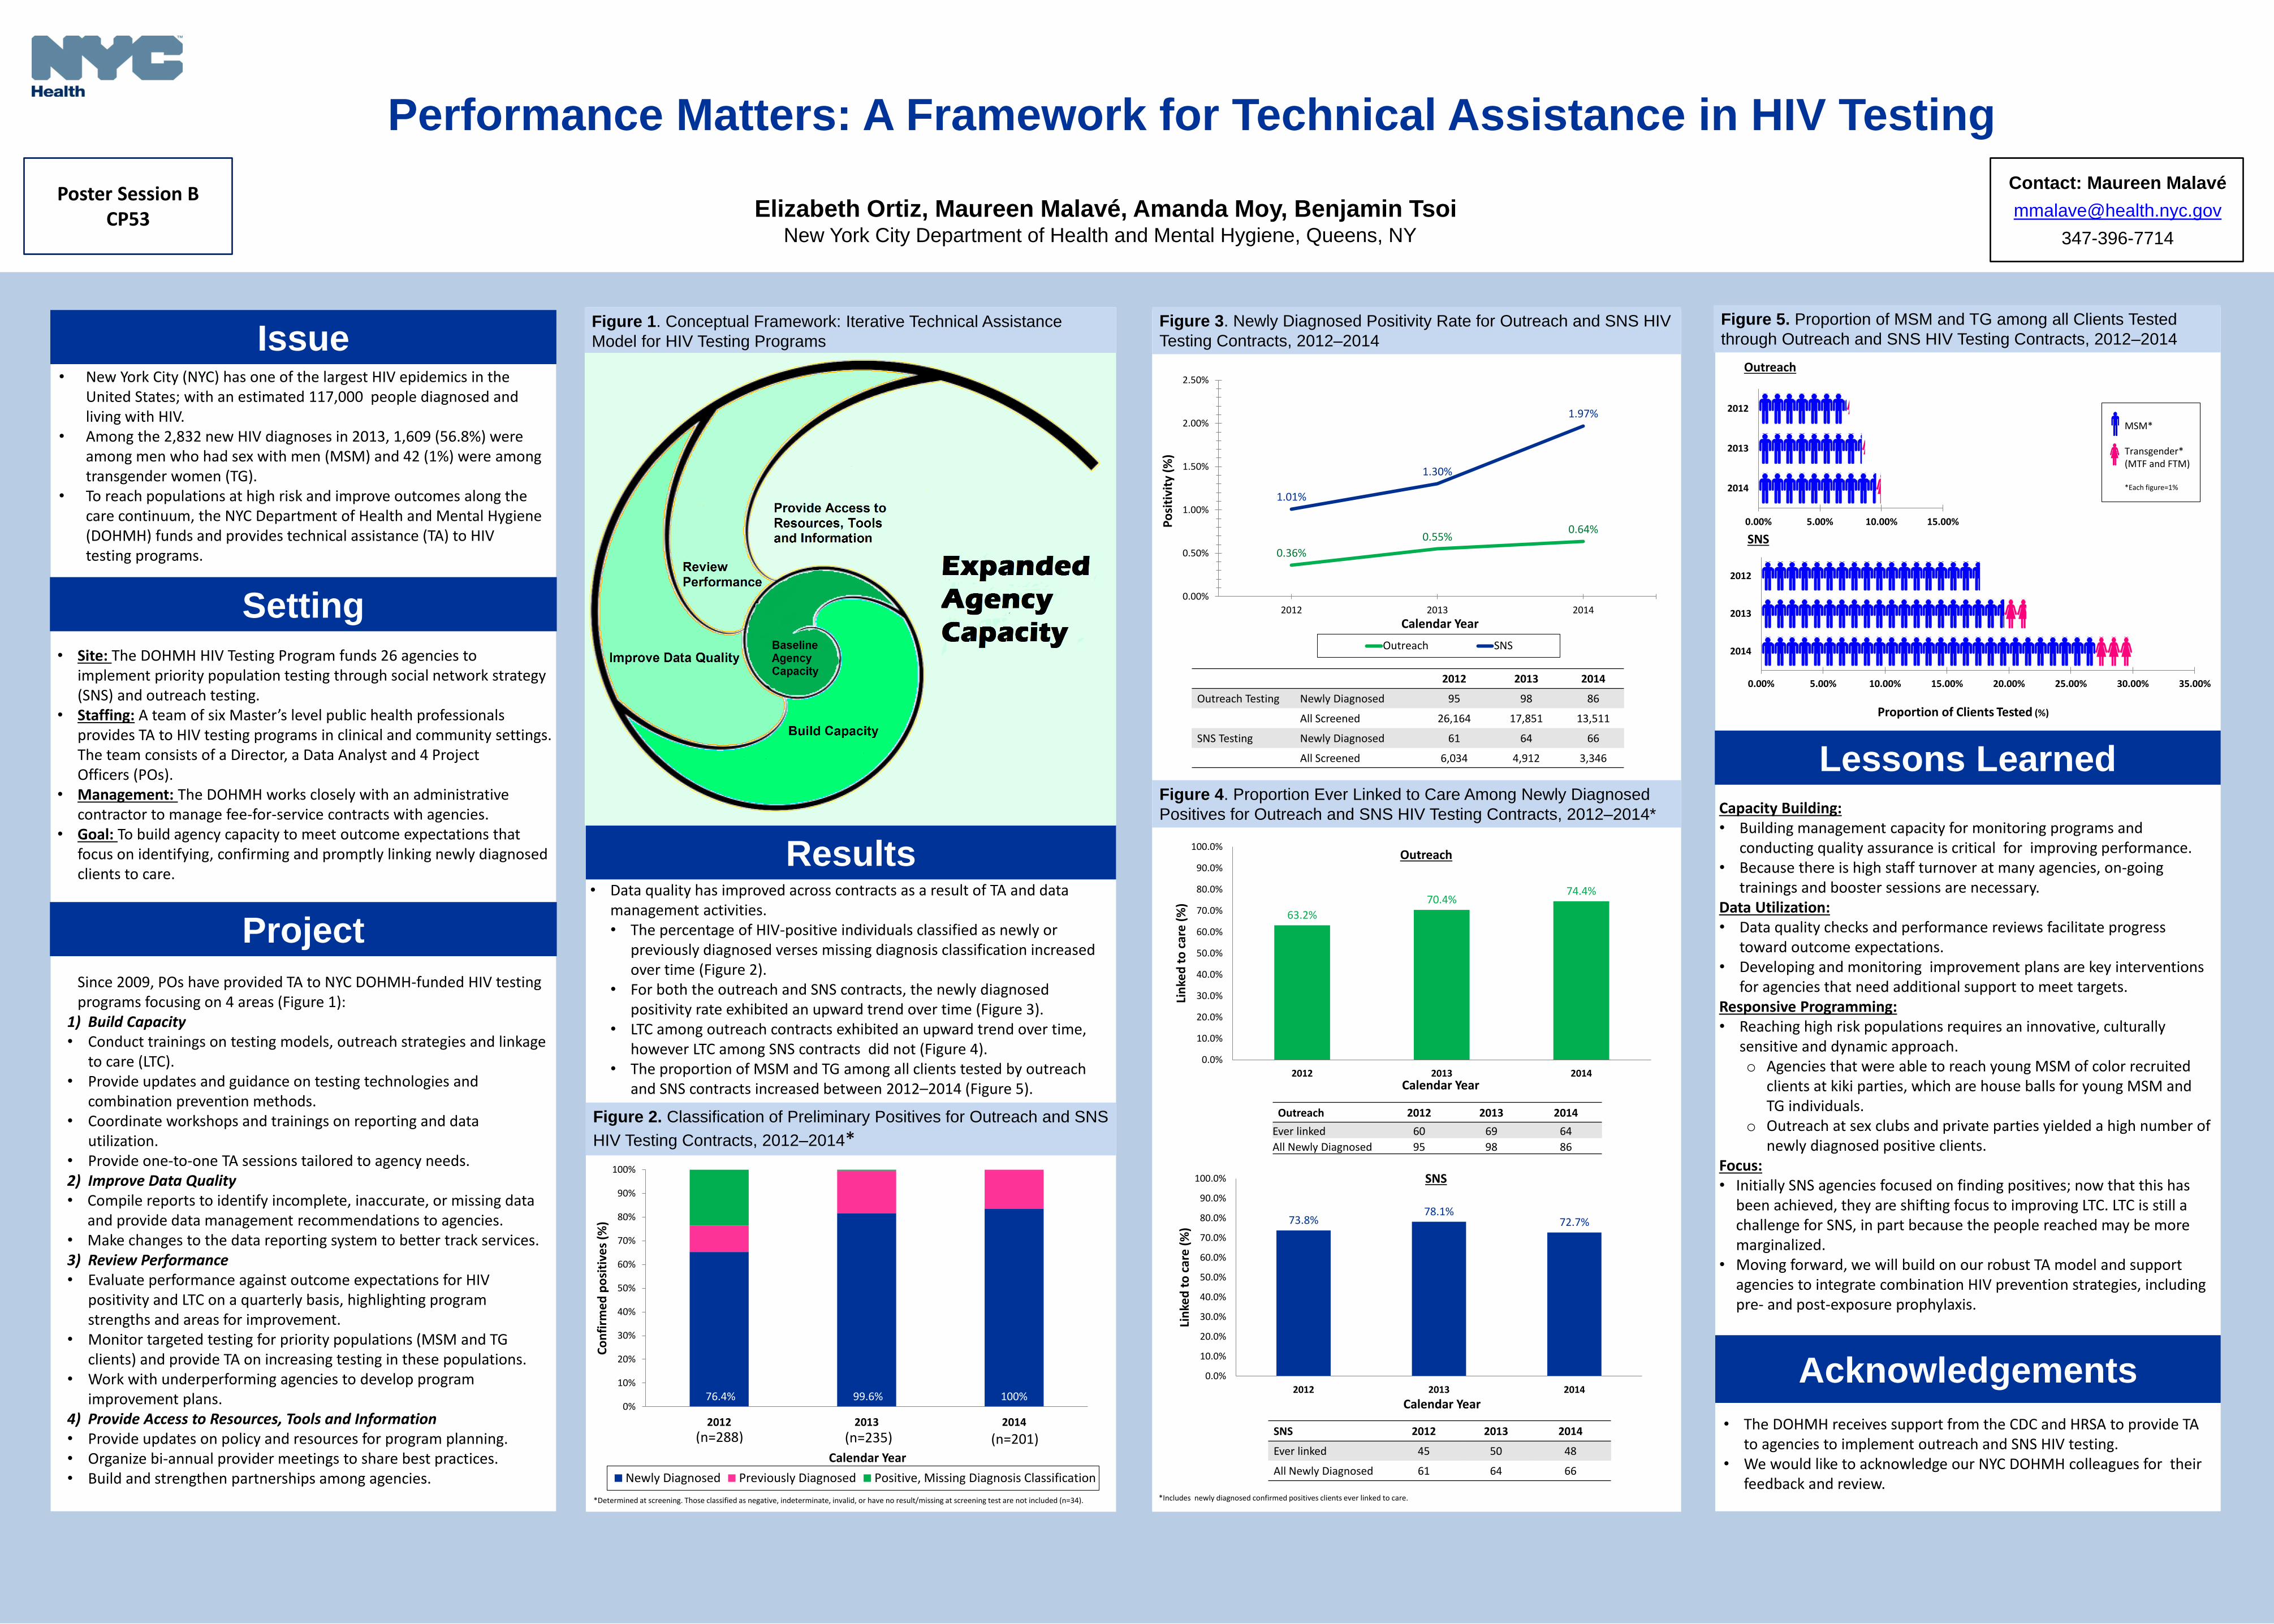
• Data quality has improved across contracts as a result of TA and data management activities. • The percentage of HIV-positive individuals classified as newly or
previously diagnosed verses missing diagnosis classification increased over time (Figure 2).
• For both the outreach and SNS contracts, the newly diagnosed positivity rate exhibited an upward trend over time (Figure 3).
• LTC among outreach contracts exhibited an upward trend over time, however LTC among SNS contracts did not (Figure 4).
• The proportion of MSM and TG among all clients tested by outreach and SNS contracts increased between 2012–2014 (Figure 5).
Acknowledgements
• The DOHMH receives support from the CDC and HRSA to provide TA to agencies to implement outreach and SNS HIV testing.
• We would like to acknowledge our NYC DOHMH colleagues for their feedback and review.
Capacity Building: • Building management capacity for monitoring programs and
conducting quality assurance is critical for improving performance. • Because there is high staff turnover at many agencies, on-going
trainings and booster sessions are necessary. Data Utilization: • Data quality checks and performance reviews facilitate progress
toward outcome expectations. • Developing and monitoring improvement plans are key interventions
for agencies that need additional support to meet targets. Responsive Programming: • Reaching high risk populations requires an innovative, culturally
sensitive and dynamic approach. o Agencies that were able to reach young MSM of color recruited
clients at kiki parties, which are house balls for young MSM and TG individuals.
o Outreach at sex clubs and private parties yielded a high number of newly diagnosed positive clients.
Focus: • Initially SNS agencies focused on finding positives; now that this has
been achieved, they are shifting focus to improving LTC. LTC is still a challenge for SNS, in part because the people reached may be more marginalized.
• Moving forward, we will build on our robust TA model and support agencies to integrate combination HIV prevention strategies, including pre- and post-exposure prophylaxis.
Figure 5. Proportion of MSM and TG among all Clients Tested
through Outreach and SNS HIV Testing Contracts, 2012–2014 Figure 3. Newly Diagnosed Positivity Rate for Outreach and SNS HIV
Testing Contracts, 2012–2014
Figure 2. Classification of Preliminary Positives for Outreach and SNS
HIV Testing Contracts, 2012–2014*
Figure 1. Conceptual Framework: Iterative Technical Assistance
Model for HIV Testing Programs
76.4% 99.6% 100% 0%
10%
20%
30%
40%
50%
60%
70%
80%
90%
100%
2012 2013 2014
Co
nfi
rme
d p
osi
tive
s (%
)
Calendar Year
Newly Diagnosed Previously Diagnosed Positive, Missing Diagnosis Classification
*Determined at screening. Those classified as negative, indeterminate, invalid, or have no result/missing at screening test are not included (n=34).
(n=288) (n=201) (n=235)
63.2%
70.4% 74.4%
0.0%
10.0%
20.0%
30.0%
40.0%
50.0%
60.0%
70.0%
80.0%
90.0%
100.0%
2012 2013 2014
Lin
ked
to
car
e (
%)
Calendar Year
Outreach
Poster Session B CP53
0.36%
0.55% 0.64%
1.01%
1.30%
1.97%
0.00%
0.50%
1.00%
1.50%
2.00%
2.50%
2012 2013 2014
Po
siti
vity
(%
)
Calendar Year
Outreach SNS
2012 2013 2014
Outreach Testing Newly Diagnosed 95 98 86
All Screened 26,164 17,851 13,511
SNS Testing Newly Diagnosed 61 64 66
All Screened 6,034 4,912 3,346
Outreach 2012 2013 2014
Ever linked 60 69 64
All Newly Diagnosed 95 98 86
73.8% 78.1%
72.7%
0.0%
10.0%
20.0%
30.0%
40.0%
50.0%
60.0%
70.0%
80.0%
90.0%
100.0%
2012 2013 2014
Lin
ked
to
car
e (
%)
Calendar Year
*Includes newly diagnosed confirmed positives clients ever linked to care.
SNS 2012 2013 2014
Ever linked 45 50 48
All Newly Diagnosed 61 64 66
Outreach
0.00% 5.00% 10.00% 15.00% 20.00% 25.00% 30.00% 35.00%
2014
2013
2012
MSM* Transgender* (MTF and FTM) *Each figure=1%
SNS
0.00% 5.00% 10.00% 15.00%
2014
2013
2012
Proportion of Clients Tested (%)
SNS