![DOCUMENT TEMATIC PRIVIND OPTIMIZAREA ......1 Document tematic nr. 2 [decembrie 2009] DOCUMENT TEMATIC PRIVIND OPTIMIZAREA SISTEMELOR DE DISTRIBUȚIE SISTEMELE DE DISTRIBUȚIE ÎN SECTORUL](https://static.fdocuments.us/doc/165x107/60b77c8c5179b31b4d2d5fc1/document-tematic-privind-optimizarea-1-document-tematic-nr-2-decembrie.jpg)
Performance Management and Business … Intelligence: A Power Combination ... within the managerial...
51
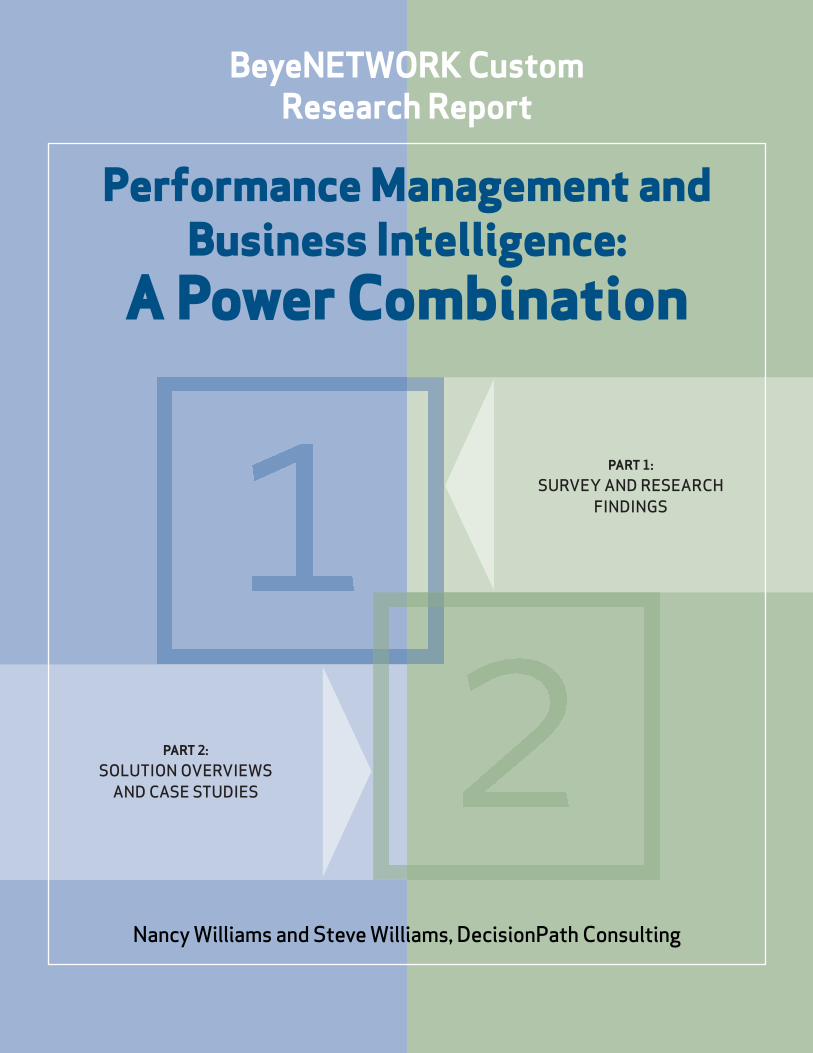
I BeyeNETWORK Custom Research Report Performance Management and Business Intelligence: A Power Combination Nancy Williams and Steve Williams, DecisionPath Consulting PART 2: SOLUTION OVERVIEWS AND CASE STUDIES PART 1: SURVEY AND RESEARCH FINDINGS
Transcript of Performance Management and Business … Intelligence: A Power Combination ... within the managerial...
I
BeyeNETWORK Custom Research Report
Performance Management andBusiness Intelligence:
A Power Combination
Nancy Williams and Steve Williams, DecisionPath Consulting
PART 2:SOLUTION OVERVIEWS AND CASE STUDIES
PART 1:SURVEY AND RESEARCH
FINDINGS
PART 1:SURVEY AND
RESEARCH FINDINGS
PART 2:SOLUTION
OVERVIEWS AND CASE STUDIES
AUTHORINFORMATION
II
PART
1SURVEY AND RESEARCH
FINDINGS
Background and Key Findings
BPM and BI: A Power Combination
Methods and Tools for BPM and BI Alignment
BPM and BI in Action
Conclusion
PART
1SURVEY
AND RESEARCH FINDINGS
COPYRIGHT © 2010 TECHTARGET P PERFORMANCE MANAGEMENT AND BUSINESS INTELLIGENCE 1
PART 1:SURVEY AND
RESEARCH FINDINGS
PART 2:SOLUTION
OVERVIEWS AND CASE STUDIES
AUTHORINFORMATION
HE HISTORY OF businessmanagement reflectscontinuous improve-ment in the methods
and tools used to drive companyperformance. Since the beginning ofthe industrial age, company leadersand managers have sought to pre-dict, plan and control company per-formance—in part to satisfy share-holders and in part to advance theirown careers. Just about any leverthat affects business performancehas been studied, and disciplinesranging from industrial engineeringto industrial psychology haveinformed and influenced how man-agers go about the central task ofachieving targeted performance.
Today, in the face of intense globalcompetition, the pressures on man-agers to perform are high, and thusit is increasingly important thatcompanies capitalize on the bestavailable methods and tools. In thiscontext, our research shows thatmore and more companies are
adopting business performancemanagement (BPM) and businessintelligence (BI) to drive perform-ance and profits. In concert withBeyeNETWORK and with the sup-port of Host Analytics, Infor andTeradata, we conducted a survey inwhich 200 people from a widerange of industries participated,sharing their experiences with BIand BPM and their insights into theresults BPM and BI initiatives havehad for their companies. The com-panies ranged in size, with 18%being very large (>$5 billion annualrevenue) and 74% being small andmedium-sized businesses. Key findings follow.
BPM/BI ALIGNMENT FINDINGS 1. Sixty-six percent (66%) of com-
panies that have both BPM and BIinitiatives underway are attempt-ing to formally align and coordi-nate these efforts.
Background and Key Findings
T

PART
1SURVEY
AND RESEARCH FINDINGS
COPYRIGHT © 2010 TECHTARGET P PERFORMANCE MANAGEMENT AND BUSINESS INTELLIGENCE 2
PART 1:SURVEY AND
RESEARCH FINDINGS
PART 2:SOLUTION
OVERVIEWS AND CASE STUDIES
AUTHORINFORMATION
2. Seventy-eight percent (78%) ofcompanies seeking alignment statethat their BI initiative is aligned tosupport the business focus of theirBPM initiative.
3. Companies with coordinated BPMand BI initiatives are three times aslikely to have achieved major busi-ness performance improvementscompared to organizations withuncoordinated efforts.
4. Companies that have exploitedavailable BI and BPM technologiesto support their business improve-ment initiatives have had higher success rates in achieving businessobjectives than those who have not exploited them.
BPM FINDINGS1. There is widespread adoption ofBPM: 41% of respondent companieshave BPM initiatives, 23% are consid-ering or planning one, and 18% recog-nize that their company would benefitfrom a BPM initiative. Based on thisdata, it is reasonable to conclude thatBPM has become a mainstream toolwithin the managerial toolkit.
2. Of the companies that are usingBPM:
pSeventeen percent (17%) reportthat BPM has delivered major per-formance enhancement, another
28% report moderate perform-ance enhancement, and 16%report minor performance en-hancement. In total, 61% reportthat BPM has had a positive performance impact.
pThe predominant uses of BPM arefor planning, budgeting, forecast-ing and generation of scorecardsand dashboards. More than half of companies with BPM initiativesreporting the use of these keyBPM capabilities. This suggeststhat companies are attracted tothe basic BPM value proposition—the systematic use of advancedplanning and control methods andtools. In effect, BPM provides aclosed-loop performance controlsystem with the ability to align,measure, manage and improve allcore aspects of business perform-ance—which ultimately improvesprofits.
pFifty-five percent (55%) haveinvested in BPM products/tools,which provide scalable core func-tionality to efficiently and effec-tively execute recurring plan-ning/budgeting, control andbusiness improvement processesfor organizations of all sizes. Atthe same time, 27% have notinvested in BPM products/tools,and 37% report that they rely onmanual processes, static reportsand Excel spreadsheets to gener-
PART
1SURVEY
AND RESEARCH FINDINGS
COPYRIGHT © 2010 TECHTARGET P PERFORMANCE MANAGEMENT AND BUSINESS INTELLIGENCE 3
PART 1:SURVEY AND
RESEARCH FINDINGS
PART 2:SOLUTION
OVERVIEWS AND CASE STUDIES
AUTHORINFORMATION
ate performance measures andkey performance indicators(KPIs). This suggests there is alarge value creation opportunityfor companies that have notinvested in BPM products/tools,given that the cost of manualprocesses for generating perform-ance measurement informationoften exceeds $100,000 per yearand sometimes exceeds $1 millionper year.
pThere is widespread use of BPMto measure business performanceafter the fact (63%), to analyzeand correct the root causes ofunder performance (49%) and touse past performance to predictfuture performance (35%). In thefuture, there will be an increasedemphasis on using BPM to correctperformance problems and pre-dict future performance as com-panies mature in their use of BPM.
BI FINDINGS1. There also is widespread adop-tion of BI: 67% of respondent com-panies have BI initiatives, 15% areconsidering or planning one, and6% recognize that their companywould benefit from a BI initiative.Based on this data, it is reasonableto conclude that BI also has becomea mainstream tool within the mana-gerial toolkit.
2. Of the companies that are using BI:
pTwenty percent (20%) report thatBI has delivered major perform-ance enhancement, another 41%report moderate performanceenhancement, and 19% reportminor performance enhancement.In total, 80% report that BI hashad a positive performanceimpact.
pThe predominant uses of BI are to improve core processes thatdrive performance and profits,including financial management(64%), sales and marketing(59%), business performancemanagement (47%), operations/supply chain (42%) and customerservice (37%). It is interesting tonote that 47% of respondentcompanies are using BI for BPMpurposes—most likely for score-carding and dashboarding butpossibly for budgeting (historicalfinancial data), root cause analy-sis of performance problems(trend data) and predicting future
The predominant uses of BI are to improve coreprocesses that driveperformance andprofits . . .

PART
1SURVEY
AND RESEARCH FINDINGS
COPYRIGHT © 2010 TECHTARGET P PERFORMANCE MANAGEMENT AND BUSINESS INTELLIGENCE 4
PART 1:SURVEY AND
RESEARCH FINDINGS
PART 2:SOLUTION
OVERVIEWS AND CASE STUDIES
AUTHORINFORMATION
performance. This suggests anoverlap and confluence betweenBI and BPM capabilities and meth-ods as well as the need to coordi-nate BI and BPM investments andexecution.
pEighty-eight percent (88%) haveinvested in BI products/tools,which provide scalable core func-tionality to deliver business infor-mation and analytic applicationsthat are used to measure, manageand improve the performance ofkey business processes and tothereby drive profit improve-ments. Over 50% have used BI formore than 3 years, 26% have usedBI for between 1 and 3 years, and19% are just getting started. Interms of scope, over 50% reportthat BI is used by many or all func-tions within their companies.
Viewed as a whole, the surveyresults clearly demonstrate that BPMand BI are widely adopted and, usedindividually, they have had very posi-tive impacts on business perform-ance. More importantly, surveyresults indicate that superior busi-
ness results can be achieved whenBPM and BI are aligned, supported bytechnology, and managed as a powercombination. Given the complexityand information intensity of modernbusiness, it is easy to see why leadersand managers would want to have
the best possible tools for drivingperformance and enhancing theirown professional success. In the nextsection of our research report, weexamine key challenges and barriersto successful use of BPM and BI inconcert to drive business perform-ance. p
Viewed as a whole, thesurvey results clearlydemonstrate that BPMand BI are widely adoptedand, used individually,they have had very posi-tive impacts on businessperformance.
PART
1SURVEY
AND RESEARCH FINDINGS
COPYRIGHT © 2010 TECHTARGET P PERFORMANCE MANAGEMENT AND BUSINESS INTELLIGENCE 5
PART 1:SURVEY AND
RESEARCH FINDINGS
PART 2:SOLUTION
OVERVIEWS AND CASE STUDIES
AUTHORINFORMATION
O EFFECTIVELY discusshow BPM and BI can be used in concert, it isimportant to have a
useful working definition of terms.For purposes of our survey, wedefined BPM and BI as follows:
Business performance manage-ment (BPM) is a systematicmanagement process for plan-ning and budgeting enterpriseperformance, measuring per-formance against financial andoperational targets, and takingcorrective actions.
The BPM process can leveragemodern tools for planning, budget-ing, forecasting, predictive analysis,and financial reporting and consoli-dation. Full-function BPM imple-mentations typically use:
1. Strategy mapping, cascading and balanced scorecards to estab-lish and communicate performance
targets across functions and up anddown organizational levels.
2. Historical transactional data forbudgeting, forecasting and predic-tive analysis.
3. Workflow technology to coordi-nate budget formulation andapproval processes.
4. Current period and year-to-datefinancial and operational data toreport performance against targets,often using scorecards and dash-boards but also using standardfinancial reports.
5. Recurring variance analysis andcorrective action planning tech-niques to identify and correct theroot causes of unfavorable perform-ance variances.
Business intelligence (BI) is a sys-tematic approach to deliveringand leveraging business informa-
BPM and BI: A Power Combination
T
PART
1SURVEY
AND RESEARCH FINDINGS
COPYRIGHT © 2010 TECHTARGET P PERFORMANCE MANAGEMENT AND BUSINESS INTELLIGENCE 6
PART 1:SURVEY AND
RESEARCH FINDINGS
PART 2:SOLUTION
OVERVIEWS AND CASE STUDIES
AUTHORINFORMATION
tion and analytical applications toimprove business performance.
BI can leverage modern data inte-gration, data quality, data presenta-tion, data analysis and decision sup-port tools to provide leaders andmanagers with a powerful tool fordriving process improvement, busi-ness performance and profit improve-ment. Full-function BI environmentstypically deliver high quality, timelybusiness information and analyticalapplications that enable companies toclearly understand the specific factorsthat drive their performance, recog-nize opportunities for performanceimprovement, analyze the root causesof performance issues, and predict
the financial and operational outcomeof corrective actions.
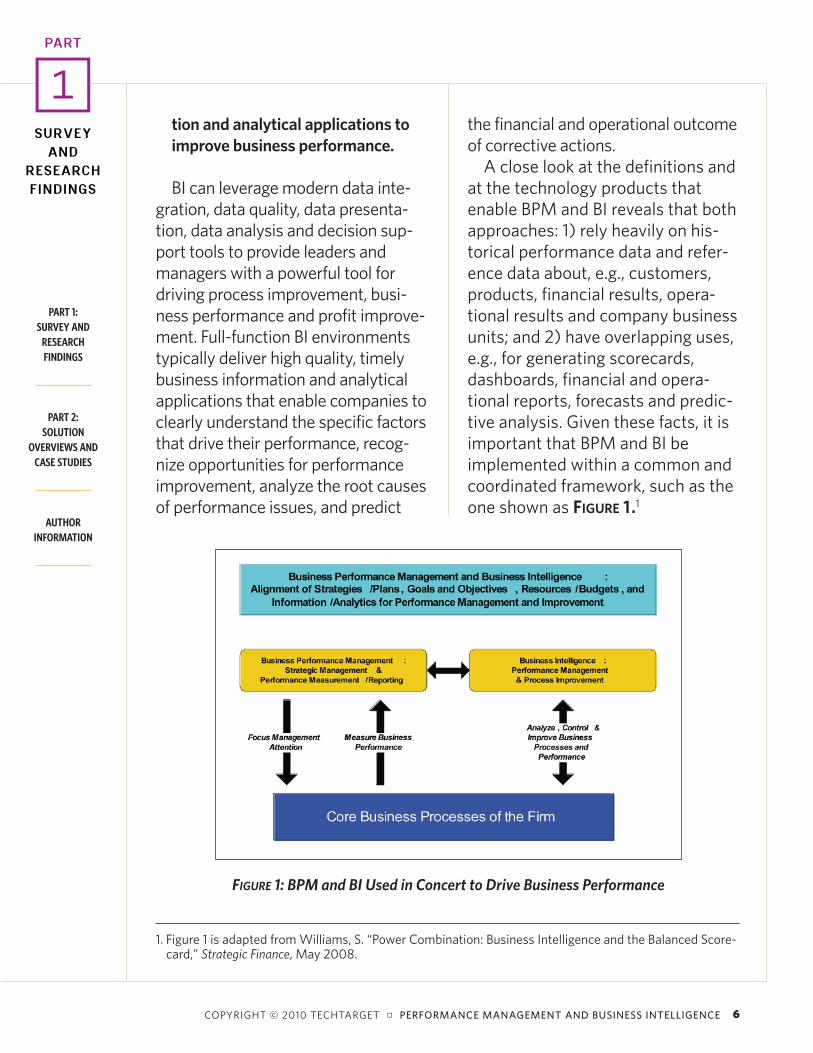
A close look at the definitions andat the technology products thatenable BPM and BI reveals that bothapproaches: 1) rely heavily on his-torical performance data and refer-ence data about, e.g., customers,products, financial results, opera-tional results and company businessunits; and 2) have overlapping uses,e.g., for generating scorecards,dashboards, financial and opera-tional reports, forecasts and predic-tive analysis. Given these facts, it isimportant that BPM and BI beimplemented within a common andcoordinated framework, such as theone shown as FIGURE 1.1
1. Figure 1 is adapted from Williams, S. “Power Combination: Business Intelligence and the Balanced Score-card,” Strategic Finance, May 2008.
FIGURE 1: BPM and BI Used in Concert to Drive Business Performance

PART
1SURVEY
AND RESEARCH FINDINGS
COPYRIGHT © 2010 TECHTARGET P PERFORMANCE MANAGEMENT AND BUSINESS INTELLIGENCE 7
PART 1:SURVEY AND
RESEARCH FINDINGS
PART 2:SOLUTION
OVERVIEWS AND CASE STUDIES
AUTHORINFORMATION
Working from the top downwithin Figure 1, we see that effec-tively using BPM and BI in concertrequires alignment between strate-gies, plans, goals, resources/bud-gets and the information and analyt-ics needed to measure, manage andimprove performance. Traditionally,BPM (the box on the left) has beenaimed at strategic management andperformance management andreporting, and a common BPMapproach is to use strategy maps andbalanced scorecards to formulateand communicate strategies, goalsand objectives and then report actualperformance. Advanced BPM toolshelp automate the strategy mappingprocess and the subsequent cascad-ing of performance targets to busi-ness units. These tools also help withbudgeting, financial modeling andfinancial reporting. That being said,BPM tools generally have taken anapplication-specific view of businessinformation, i.e., each budgeting orfinancial modeling tool creates andprovides a data repository that isdesigned for the use of each specificBPM application as opposed to shar-ing data at the enterprise level, which
is where BI comes into the picture.As shown in the box on the right sideof Figure 1, BI is aimed at perform-ance management and processimprovement, and to accomplishthese tasks BI ideally delivers busi-ness information and analyticalapplications obtained from a singlesource of enterprise data—the so-called “single version of the truth.”
BPM AND BI ALIGNMENT: WHY ARE THEY DOING IT?Both BPM and BI are concerned withbusiness performance, which is deter-mined by the sum of a company’svalue chain activities—that is, thecore business processes of the firmshown across the bottom of Figure 1.BPM has traditionally been moreabout planning and measuring per-formance, whereas BI has been moreabout measuring, managing andimproving performance. Given thatboth focus upon the use of informa-tion and fact-based management toachieve improved business perform-ance, organizations that formallycoordinate BPM and BI efforts andthat use BPM and BI technologies todo so have the following motivations,reflected in the survey results asshown in FIGURE 2 (see page 8).
Many of the problems these coor-dination objectives address stemfrom using manual approaches forBPM which is shown in FIGURE 3 (seepage 8). The shortcomings of man-
BPM tools generally havetaken an application-specific view of businessinformation.

PART
1SURVEY
AND RESEARCH FINDINGS
COPYRIGHT © 2010 TECHTARGET P PERFORMANCE MANAGEMENT AND BUSINESS INTELLIGENCE 8
PART 1:SURVEY AND
RESEARCH FINDINGS
PART 2:SOLUTION
OVERVIEWS AND CASE STUDIES
AUTHORINFORMATION
FIGURE 3: Problems with Manual Approaches
to BPM
FIGURE 2: Coordination Objectives

PART
1SURVEY
AND RESEARCH FINDINGS
COPYRIGHT © 2010 TECHTARGET P PERFORMANCE MANAGEMENT AND BUSINESS INTELLIGENCE 9
PART 1:SURVEY AND
RESEARCH FINDINGS
PART 2:SOLUTION
OVERVIEWS AND CASE STUDIES
AUTHORINFORMATION
ual BPM were explored by anothersurvey question and primarily relateto turning data into the informationBPM requires.
These data problems are generallysolved by IT through the use of datawarehousing, data integration anddata quality methods and tools,which can provide an integrateddata environment to support bothBPM and BI. In fact, survey respon-dents indicate that the primary rolesfor IT within BPM initiatives are:
pData architecture support (65%)pData integration support (60%)pTool selection and/or implemen-
tation (52%)
These data problems suggest thatstrong coordination between BPMand BI is fundamental for usingthese complementary and reinforc-ing tools cost-effectively. Further,the results indicate that strong ITinvolvement is essential to avoidinga number of data quality issues,which can quickly derail adoption ofadvanced tools such as BPM and BI.If business users don’t trust thedata, they won’t use the tools—amajor opportunity lost in today’scompetitive environment.
For those organizations that donot currently utilize a coordinated BIand BPM approach to achieve anoptimal information advantage,common organizational barriers toadoption included the following:
pLack of awareness of potentialBPM benefits (54%)
pThe need for BPM not being rec-ognized by the right people (37%)
pThe perception that BPM is tooexpensive or not worth it (17%)
pLack of knowledge about how tobegin and implement a BPM ini-tiative (14%)
pThe need for BI not being recog-nized by the right people (33%)
pThe perception that BI is too expen-sive or not worth it (25%)
pLack of awareness of potential BI benefits (17%)
These findings suggest that the ITfunction within companies, the con-sultant community, the analyst com-munity, and the BPM and BI vendorsneed to do a better job of explainingthe value propositions for BPM andBI. Since 60% of BPM initiatives and54% of BI initiatives are launched bythe business side of companies, theidentified challenges and barriers
These data problemssuggest that strongcoordination betweenBPM and BI is funda-mental for using thesecomplementary andreinforcing tools cost-effectively.

PART
1SURVEY
AND RESEARCH FINDINGS
COPYRIGHT © 2010 TECHTARGET P PERFORMANCE MANAGEMENT AND BUSINESS INTELLIGENCE 10
PART 1:SURVEY AND
RESEARCH FINDINGS
PART 2:SOLUTION
OVERVIEWS AND CASE STUDIES
AUTHORINFORMATION
also suggest that business leadersand managers need to be educatedabout BI and BPM so that they under-stand the potentially powerful impactthese managerial methods and toolscan have on performance and profits.We see the need for education as ajoint business/IT responsibility: thebusiness side needs to invest in ed-ucation, and the IT side needs to pro-mote education to the business.
BPM AND BI ALIGNMENT: HOW ARE THEY DOING IT?FIGURE 4 indicates that a variety ofcoordination mechanisms are usedto coordinate the requirements for
BPM and BI, including joint gover-nance and planning (56%), commondefinitions, data architecture anddata stores (46%), and BPM/BI liai-son (40%). Twenty percent (20%)have a formal competency center;however, that mechanism was onlyselected in combination with one ormore of the other three. Fifty percent(50%) of the time, multiple coordi-nation mechanisms are used.
BPM AND BI ALIGNMENT: WHAT ARE THE RESULTS?Our survey indicates that there is astrong business performance payofffor organizations that invest in and
FIGURE 4: Coordination Mechanism
PART
1SURVEY
AND RESEARCH FINDINGS
COPYRIGHT © 2010 TECHTARGET P PERFORMANCE MANAGEMENT AND BUSINESS INTELLIGENCE 11
PART 1:SURVEY AND
RESEARCH FINDINGS
PART 2:SOLUTION
OVERVIEWS AND CASE STUDIES
AUTHORINFORMATION
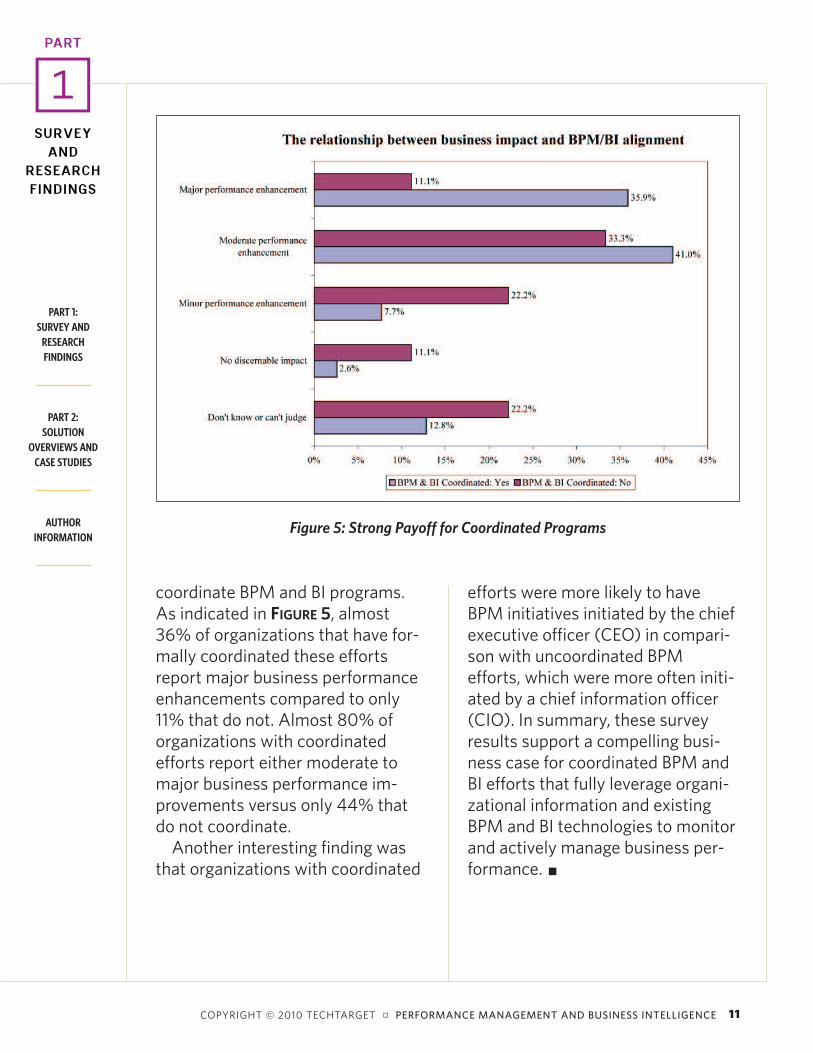
coordinate BPM and BI programs.As indicated in FIGURE 5, almost36% of organizations that have for-mally coordinated these effortsreport major business performanceenhancements compared to only11% that do not. Almost 80% oforganizations with coordinatedefforts report either moderate tomajor business performance im-provements versus only 44% thatdo not coordinate.
Another interesting finding wasthat organizations with coordinated
efforts were more likely to haveBPM initiatives initiated by the chiefexecutive officer (CEO) in compari-son with uncoordinated BPMefforts, which were more often initi-ated by a chief information officer(CIO). In summary, these surveyresults support a compelling busi-ness case for coordinated BPM andBI efforts that fully leverage organi-zational information and existingBPM and BI technologies to monitorand actively manage business per-formance. p
Figure 5: Strong Payoff for Coordinated Programs
PART
1SURVEY
AND RESEARCH FINDINGS
COPYRIGHT © 2010 TECHTARGET P PERFORMANCE MANAGEMENT AND BUSINESS INTELLIGENCE 12
PART 1:SURVEY AND
RESEARCH FINDINGS
PART 2:SOLUTION
OVERVIEWS AND CASE STUDIES
AUTHORINFORMATION
PM AND BI initiativesboth aim to leveragebusiness informationto improve the per-
formance of core value chain activi-ties of the firm. They are focused onthe same business processes andgenerally the same business infor-mation. If uncoordinated, there is agood chance of incurring adverseconsequences such as inefficiency,data redundancy, data quality andcomparability issues, and IT mainte-nance cost increases.
More broadly, lack of alignmentmay have adverse strategic and eco-nomic implications for the company.For example, absent a clear align-ment with BI, the BPM initiative maycreate a false sense of securityamong business executives thatthey have the business information,analytical tools and structured deci-sion support they need to improvebusiness performance, which couldtranslate to lost performanceimprovement opportunities that
may have a materially adverse profitimpact. In contrast, companies thathave well-aligned BPM and BI initia-tives exhibit the following:
pOrganizational alignment. TheBPM and BI teams operate withclearly defined and mutually rein-forcing charters that encompass,in part, a shared responsibility forlinking BPM performance meas-urement with BI performancemanagement and improvement.
pBusiness process alignment. TheBPM and BI teams each focus onthe same business processes forimprovement and in the sameorder of priority. Each BI releasewill either: a) improve the effi-ciency of the BPM performancemeasurement, reporting process,variance analysis and correctiveaction process; and/or b) delivernew business information, analyti-cal tools and/or decision supportto enable management and
Methods and Tools for BPM and BI Alignment
B

PART
1SURVEY
AND RESEARCH FINDINGS
COPYRIGHT © 2010 TECHTARGET P PERFORMANCE MANAGEMENT AND BUSINESS INTELLIGENCE 13
PART 1:SURVEY AND
RESEARCH FINDINGS
PART 2:SOLUTION
OVERVIEWS AND CASE STUDIES
AUTHORINFORMATION
FIGURE 6: Method for Aligning BPM and BI Initiatives
improvement of the targeted busi-ness processes.
pBudget alignment. Funds for actualperformance measurement—thescores in the scorecard, perform-ance reporting via the BPM, anddevelopment of BI for perform-ance management and improve-ment—are rationalized across theinitiatives.
pData and technical architecturealignment. The BPM and BI teamswork within a unified data architec-ture and suitable technical archi-tecture that enable automation ofBPM processes and that deliver BIfor managing and improving thebusiness processes that drive thescorecard and dashboard results.
Achieving these elements of BPMand BI alignment requires conscious
effort. A BPM initiative typicallybegins with construction of a strategymap, selection and definition of KPIsand supporting measures, and theselection of target values for each.
Implementation of this BPMdesign often is done in phasesrather than with a “big bang”approach. Each BPM implementa-tion phase includes a project thatsupplies the necessary data, calcu-lates the KPI/measure values, andpresents these actual values com-pared to their targets—and this iswhere BI makes its contribution.
In addition to projects to supportBPM, the company almost certainlyhas a number of non-BPM-relatedopportunities for BI to add value.BPM and BI alignment entails managing all of these BPM and BIactivities as a managed portfolio ofprojects. FIGURE 6 depicts a method-ology for doing so.

PART
1SURVEY
AND RESEARCH FINDINGS
COPYRIGHT © 2010 TECHTARGET P PERFORMANCE MANAGEMENT AND BUSINESS INTELLIGENCE 14
PART 1:SURVEY AND
RESEARCH FINDINGS
PART 2:SOLUTION
OVERVIEWS AND CASE STUDIES
AUTHORINFORMATION
Working from left to right acrossthe top of Figure 6, we see three pri-mary processes and specific busi-ness deliverables. The first processis to create a BPM and BI vision,which is done by analyzing BPM andBI opportunities to leverage busi-ness information, analytical toolsand structured decision supporttechniques to improve business per-formance. Since the key objectivefor both BPM and BI initiatives isperformance improvement, we alsoneed to have a high-level under-standing of the core businessprocesses that need to be meas-ured, managed and improved.
From these analyses, we canunderstand common informationrequirements for both BPM and BIinitiatives, and align those informa-tion requirements within the BI port-folio. For example, we would notwant a BPM application to show dif-ferent performance results than BIapplications would show for thesame process. By systematicallyidentifying common needs for busi-ness information between BPM andBI initiatives, we avoid the inefficiencyand data quality issues spawned byuncoordinated efforts. Further, byidentifying the core business pro-cesses of interest for BPM purposes,we can align BI applications that offernot only performance measurements,but also business information, analyti-cal tools and structured decision sup-port for improving the core processes
that drive the performance measuresreported via BPM scorecards anddashboards. The result is a muchmore robust performance manage-ment asset.
The second part of the alignmentprocess is to identify risks andchange imperatives associated with the BPM and BI initiatives ingeneral and the alignment processin particular. This is done via astructured BI and BPM readinessassessment, which looks at suchfactors as whether the company isleveraging the reported BPM per-formance measures and available BI, and whether the company hasthe technical ability to deliver anintegrated data and technical envi-ronment that would support bothBPM and BI. The process also evalu-ates the BI and BPM data architec-ture from efficiency, responsiveness,flexibility, scalability, cost and dataquality perspectives.
The last process incorporates theresults and deliverables from thefirst two processes into a compre-hensive BI and BPM program planthat is customized for a given com-pany with respect to alignmentbetween BPM and BI initiatives. Theprogram plan provides a roadmapfor achieving alignment between theBPM and BI initiatives, and sets thestage for technical execution thatensures that BPM and BI informa-tion requirements are met.
Once a program plan has been
PART
1SURVEY
AND RESEARCH FINDINGS
COPYRIGHT © 2010 TECHTARGET P PERFORMANCE MANAGEMENT AND BUSINESS INTELLIGENCE 15
PART 1:SURVEY AND
RESEARCH FINDINGS
PART 2:SOLUTION
OVERVIEWS AND CASE STUDIES
AUTHORINFORMATION
developed and implemented, a keytask will often be to select and imple-ment the technology and toolsrequired to deliver BPM and BI func-tionality. There is a wide range of rel-evant tools to consider, and adetailed treatment of these is beyondthe scope of this report. That beingsaid, modern BPM and BI tools pro-vide a wide range of functionality thatis essential for leveraging BI and BPMas a power combination to improveperformance and profits. Key func-tional capabilities include:
pRobust data warehousing, dataintegration and data managementplatforms that enable a shared dataenvironment that can be used byBPM and BI applications alike.
pSpecific BPM and BI capabilitiesoffered within a single solutionpackage, e.g., BPM applicationplatforms that leverage BI toolsfor data integration, storage andreporting within a BPM suite thatenables planning, financial model-ing, budgeting, financial consoli-dation and predictive analysis.
pBPM/BI solutions based on thesoftware-as-a-service (SaaS)delivery paradigm as a means ofstarting quickly and reducing ini-tial investment in BPM/BI.
The importance and prevalence oftechnology and tools to enable BPM
and BI is attested to by our surveyresults, where we found that:
1. Fifty-five percent (55%) of com-panies surveyed have invested inBPM products/tools.
2. Forty-nine percent (49%) of com-panies reported using BI technologiesand tools to automate the recurringprocess of generating BPM measuresand KPIs.
3. Eighty-eight percent (88%) ofcompanies surveyed have investedin BI products/tools.
4. Sixty-five (65%) of companieshave implemented BI using enter-prise data warehouses and/or datamarts.
5. Thirty-nine percent (39%) ofcompanies have implemented BIusing independent data marts.
6. Thirteen percent (13%) of com-panies have deployed BI using theSaaS (on-demand) model.
There are many highly regardedtools available from strong BPM andBI vendors, including the excitingtools provided by our sponsors forthis report�Host Analytics, Infor andTeradata. We encourage readers toreview the case studies and vendoroverviews included at the end of thisresearch report. p
PART
1SURVEY
AND RESEARCH FINDINGS
COPYRIGHT © 2010 TECHTARGET P PERFORMANCE MANAGEMENT AND BUSINESS INTELLIGENCE 16
PART 1:SURVEY AND
RESEARCH FINDINGS
PART 2:SOLUTION
OVERVIEWS AND CASE STUDIES
AUTHORINFORMATION
S OUR SURVEY dis-covered, 54% ofcompanies whohave adopted BPM
are using the scorecard and dash-board functionality. Further, 47% ofcompanies that have adopted BI areusing it for enterprise performancemanagement. This suggests a con-fluence between BPM and BI, andwe will illustrate how the two com-bine to provide a robust and scala-ble performance management capability.
In addition to being a strong toolfor communication of key strategies,BPM provides clear linkagesbetween strategies, the businessprocesses by which the strategiesare executed and the key measuresneeded to gauge business perform-ance. BPM provides the baseline forperformance measurement; andaccording to industry research,many companies who adopt BPMare satisfied with the method andplan to continue its use. Whether
you call it enterprise performancemanagement, business performancemanagement or corporate perform-ance management, there is no deny-ing that the ability to measure per-formance from financial, customer,operational and learning perspec-tives is valuable.
Another view of BPM is as arecurring management process.After the initial strategy maps havebeen created and cascaded, theobjectives have been decided andthe targets have been defined, thereis a regular performance measure-ment and reporting cycle, which isoften monthly. As you might imag-ine, for a company of any size andcomplexity, the number of measuresto be reported every month as themeasures are “cascaded” into theorganization can become unwieldy.Further, the scope of business infor-mation required to report the meas-ures can be quite broad and mayrequire data integration from severalsources. Many companies that use
BPM and BI in Action
A
PART
1SURVEY
AND RESEARCH FINDINGS
COPYRIGHT © 2010 TECHTARGET P PERFORMANCE MANAGEMENT AND BUSINESS INTELLIGENCE 17
PART 1:SURVEY AND
RESEARCH FINDINGS
PART 2:SOLUTION
OVERVIEWS AND CASE STUDIES
AUTHORINFORMATION
largely manual methods for BPMexpend large sums of money to pro-duce BPM report—in some casesmore than $1 million per year. Giventhe current state of BI practice andtools, there is no reason why the
recurring BPM reporting processcannot be automated and based onintegrated data.
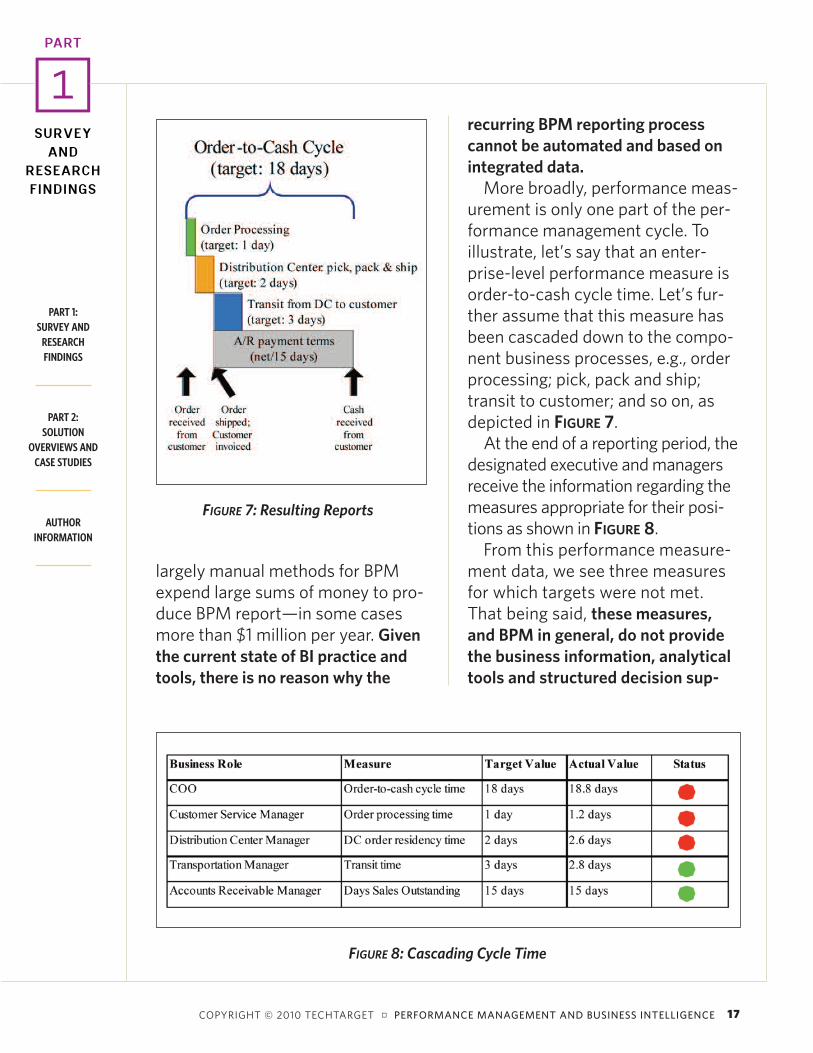
More broadly, performance meas-urement is only one part of the per-formance management cycle. Toillustrate, let’s say that an enter-prise-level performance measure isorder-to-cash cycle time. Let’s fur-ther assume that this measure hasbeen cascaded down to the compo-nent business processes, e.g., orderprocessing; pick, pack and ship;transit to customer; and so on, asdepicted in FIGURE 7.
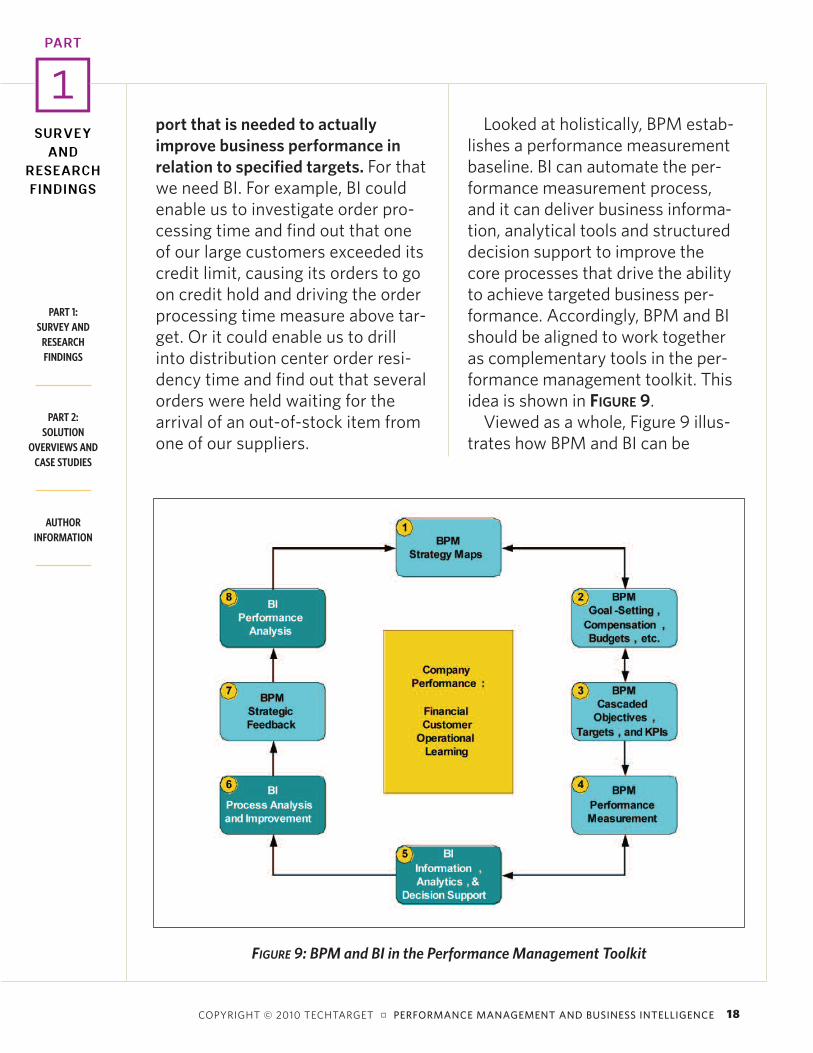
At the end of a reporting period, thedesignated executive and managersreceive the information regarding themeasures appropriate for their posi-tions as shown in FIGURE 8.
From this performance measure-ment data, we see three measuresfor which targets were not met.That being said, these measures,and BPM in general, do not providethe business information, analyticaltools and structured decision sup-
FIGURE 8: Cascading Cycle Time
FIGURE 7: Resulting Reports
PART
1SURVEY
AND RESEARCH FINDINGS
COPYRIGHT © 2010 TECHTARGET P PERFORMANCE MANAGEMENT AND BUSINESS INTELLIGENCE 18
PART 1:SURVEY AND
RESEARCH FINDINGS
PART 2:SOLUTION
OVERVIEWS AND CASE STUDIES
AUTHORINFORMATION
port that is needed to actuallyimprove business performance inrelation to specified targets. For thatwe need BI. For example, BI couldenable us to investigate order pro-cessing time and find out that oneof our large customers exceeded itscredit limit, causing its orders to goon credit hold and driving the orderprocessing time measure above tar-get. Or it could enable us to drillinto distribution center order resi-dency time and find out that severalorders were held waiting for thearrival of an out-of-stock item fromone of our suppliers.
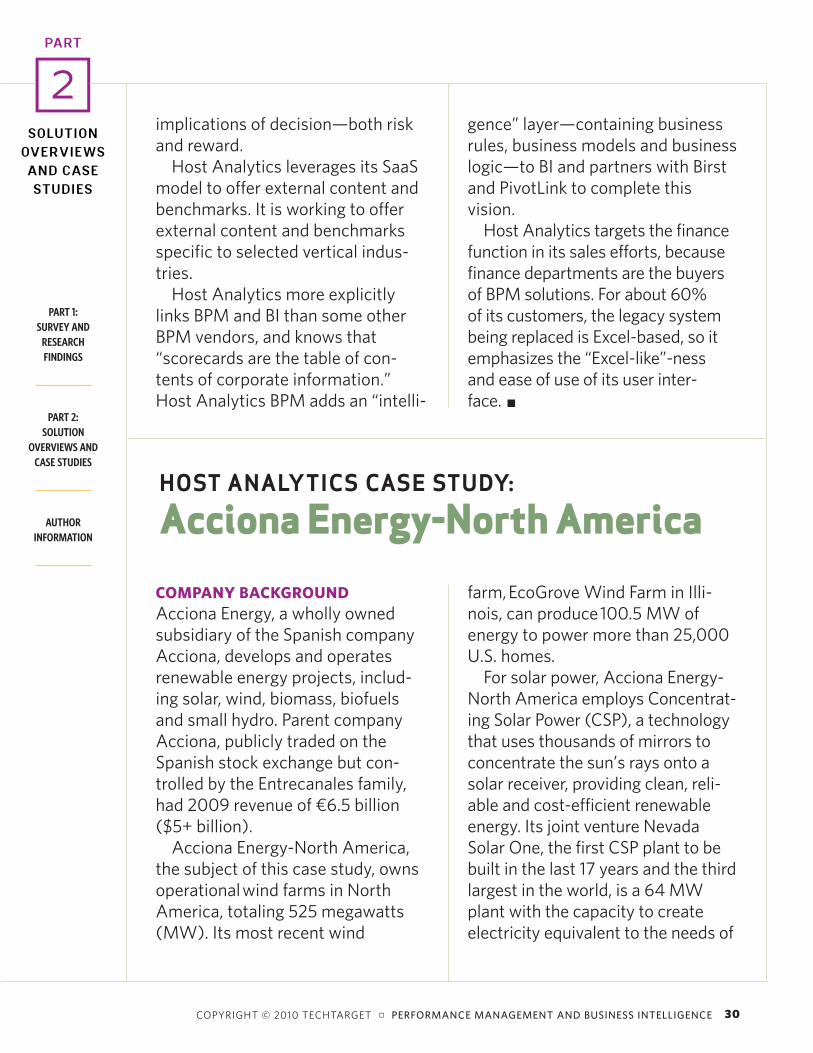
Looked at holistically, BPM estab-lishes a performance measurementbaseline. BI can automate the per-formance measurement process,and it can deliver business informa-tion, analytical tools and structureddecision support to improve thecore processes that drive the abilityto achieve targeted business per-formance. Accordingly, BPM and BIshould be aligned to work togetheras complementary tools in the per-formance management toolkit. Thisidea is shown in FIGURE 9.
Viewed as a whole, Figure 9 illus-trates how BPM and BI can be
FIGURE 9: BPM and BI in the Performance Management Toolkit

PART
1SURVEY
AND RESEARCH FINDINGS
COPYRIGHT © 2010 TECHTARGET P PERFORMANCE MANAGEMENT AND BUSINESS INTELLIGENCE 19
PART 1:SURVEY AND
RESEARCH FINDINGS
PART 2:SOLUTION
OVERVIEWS AND CASE STUDIES
AUTHORINFORMATION
aligned and interleaved to create adynamic performance managementasset. At the center of it all, ofcourse, is company performance,which in a BPM environment thatuses the balanced scorecard as itsframework is viewed from the fourkey perspectives: financial, cus-tomer, operational and learning. BI isalso focused on company perform-ance, particularly if guided by busi-ness-driven design and portfoliomanagement methods.
Starting at the top of Figure 9 andmoving clockwise, step 1 of the per-formance management cycle beginswith using the balanced scorecardmethod of strategy mapping to linkcompany strategies to the core busi-ness processes via which the strate-gies are realized. This sets the stagefor step 2, in which the strategicmanagement framework is used toguide goal setting, compensationalignment, budgeting, improvementinitiatives and so forth. We show abidirectional flow between steps 1and 2 because of the possibility ofbudget and resource constraintsshaping business strategy. In thiscontext, companies that haveadopted BPM tools might also usethe financial modeling and budget-ing capabilities of those tools to for-mulate balance sheet and incomestatement targets and allocatethese to business units. Further, theymight use the profit modeling andbusiness optimization capabilities of
the BPM tool to generate inputs tothe budget process.
The goal setting part of step 2sets the stage for cascading finan-cial and operational objectives, per-formance measures and perform-ance targets throughout theorganization. These can be simplehierarchical cascades or quite com-plex cascading to cross-functionalbusiness processes based on differ-ent organizational roles. In anyevent, the objectives, measures andtargets need to be relevant andclearly tied to business processesthat drive company performance.Skillful completion of step 3 estab-lishes the performance measure-ment framework and baseline,which when linked to compensationand artfully reinforced will ensuremanagement attention to the busi-ness processes that contribute tostrategic success.Step 4 is the recurring manage-
ment process we described earlier.Generally on a monthly cycle, butpossibly more frequently dependingon the level within the company andthe appropriate operational controlcycle, BPM is used to report actualperformance results from the fourbalanced scorecard perspectives.Within this context, the financialconsolidation and financial report-ing capabilities of a BPM tool can beleveraged to create the appropriatereports. More broadly, the publica-tion of BPM reports triggers vari-

PART
1SURVEY
AND RESEARCH FINDINGS
COPYRIGHT © 2010 TECHTARGET P PERFORMANCE MANAGEMENT AND BUSINESS INTELLIGENCE 20
PART 1:SURVEY AND
RESEARCH FINDINGS
PART 2:SOLUTION
OVERVIEWS AND CASE STUDIES
AUTHORINFORMATION
ance analysis, management reviewsand corrective action planning.
In larger companies, the processof generating the measures, format-ting BPM reports and varianceanalysis/corrective action planningcan be complex and manually inten-sive. In our survey, 37% of respon-dents reported that performancemanagement measures and KPIs aregenerated manually or by a manu-ally intensive process of drawinginformation from standard reportsand entering it into spreadsheets.As a result, 39% of companiesspend more than $100,000 per yearto generate manual BPM reports,with 14% spending more than$500,000 per year. When thesefacts are combined with thereported data problems associatedwith BPM report—lack of consistentinformation (54%), inadequate
information timeliness (49%),insufficient level of informationdetail (44%) and poor informationquality (37%—it becomes clear thatleveraging BI to automatically gen-erate and cascade BPM measuresand KPIs is a substantial economicopportunity in many cases. This iswhy we show a bidirectional flowbetween steps 4 and 5, whereby BIcan be used to automate this recur-ring management control process.That being said, a BPM report is akind of BI and is a key driver of man-agement motivation to use BI tounderstand unfavorable variancesand develop improvement strate-gies. More specifically, BI can beused to drill down into the rootcauses of performance variancesand to improve the underlying corebusiness processes that drive theactual performance measured andreported by BPM. This is reflectedby the interplay between steps 5 and 6.
In addition to the specific processanalysis and improvement capabili-ties delivered by BPM/BI combina-tion, the results of steps 4 through 6provide strategic feedback, asshown by step 7. For any given BPMreporting cycle, there are actual per-formance measures and BI-enabledanalysis of variances and improve-ment opportunities, which providevaluable strategic learning thatfeeds into a higher-level companyperformance analysis during step 8.
More specifically, BI can be used to drill downinto the root causes ofperformance variancesand to improve the under-lying core businessprocesses that drive theactual performance measured and reported by BPM.

PART
1SURVEY
AND RESEARCH FINDINGS
COPYRIGHT © 2010 TECHTARGET P PERFORMANCE MANAGEMENT AND BUSINESS INTELLIGENCE 21
PART 1:SURVEY AND
RESEARCH FINDINGS
PART 2:SOLUTION
OVERVIEWS AND CASE STUDIES
AUTHORINFORMATION
The performance managementcycle is then able to close the loopby using strategic feedback andenterprise performance informationwithin the BPM strategic planningprocess. Steps 7 and 8 are morelikely to be done on a quarterly orannual basis, whereas steps 4through 6 will often be recurringmonthly and/or biweekly manage-ment processes, with the frequencydictated by the nature of the busi-ness and the industry.
Moving back to overall perform-ance management perspective, wesee that BPM and BI are compatibleand complementary tools that focuson company performance. If we dropBI from of the equation, we see thatBPM is very suitable for establishingthe strategic management frame-work and performance managementbaseline, and it can be used for
timely performance measurement.But measurement alone is notenough. Managers have continuallyexpressed the need for businessinformation, analytical tools anddecision support so that they canimprove the actual processes thatdrive the performance measurementnumbers. And that is what BI isabout. Taken together and skillfullyaligned, BPM and BI provide a robusttool set for enabling highly effectiveperformance management, which isultimately management’s mostessential and fundamental task. p
BPM and BI are compa-tible and complementarytools that focus on company performance.

PART
1SURVEY
AND RESEARCH FINDINGS
COPYRIGHT © 2010 TECHTARGET P PERFORMANCE MANAGEMENT AND BUSINESS INTELLIGENCE 22
PART 1:SURVEY AND
RESEARCH FINDINGS
PART 2:SOLUTION
OVERVIEWS AND CASE STUDIES
AUTHORINFORMATION
T IS CLEAR FROM our surveyresults that BPM and BI havemade their way into the main-stream as key tools in the mana-
gerial toolkit. Both are widelyadopted, both have produced posi-tive results, and both are focused onimproving the core business pro-cesses that drive profits and busi-ness results. It is also clear from thesurvey that substantial economicopportunities exist for the minorityof companies that have not adoptedBPM and BI, and for those compa-nies that have adopted BPM buthave not leveraged BI to automaterecurring management processessuch as strategic planning, goal set-ting, financial modeling, forecasting,budgeting, scorecarding, dash-boarding, variance analysis and theuse of predictive analytics to modeland optimize business performance.These companies are leaving moneyon the table year after year, andtheir leaders and managers arecompeting with their hands tied
behind their backs. Given that thecost of modern BPM and BI tools isminor relative to their returns, thiswould appear to be an unduly riskystate of affairs. For public compa-nies, one could also argue that fail-ure to capitalize on BPM and BI is a
breach of management’s fiduciaryresponsibility to shareholdersbecause inadequate planning andcontrol mechanisms increase riskand reduce profits in relation to amore optimal performance profile.In today’s competitive global econ-omy, that seems reckless. p
Conclusion
IBPM and BI have pro-duced positive results,and both are focused on improving the corebusiness processes that drive profits andbusiness results.

PART
2SOLUTION OVERVIEWSAND CASE STUDIES
23
PART 1:SURVEY AND
RESEARCH FINDINGS
PART 2:SOLUTION
OVERVIEWS AND CASE STUDIES
AUTHORINFORMATION
Host Analytics Solution Overview
Host Analytics Case Study: Acciona Energy-North America
Infor Global Solutions Technical Overview
Infor Case Study: BlueLinx Corporation
Teradata Corporation Solution Overview
Teradata Corporation Case Study: AT&T Mobility

PART
2SOLUTION
OVERVIEWS AND CASE STUDIES
COPYRIGHT © 2010 TECHTARGET P PERFORMANCE MANAGEMENT AND BUSINESS INTELLIGENCE 24
PART 1:SURVEY AND
RESEARCH FINDINGS
PART 2:SOLUTION
OVERVIEWS AND CASE STUDIES
AUTHORINFORMATION
COMPANY BACKGROUNDHost Analytics is a provider of BPMsolutions delivered via a software-as-a-service (SaaS) delivery modeland supports continuous improve-ment in methods and tools. Foundedin 2000, it serves the enterprise,large and midsized company andpublic sector markets.
The Host Analytics Decision Plat-form reveals the full implications of decision—both risk and reward.As the industry’s first on-demandcorporate performance manage-ment (CPM) suite, Host Analyticsimproves budgeting, forecasting,financial consolidations, dash-boarding, scorecarding, reportingand analysis to drive fact-baseddecisions for all executives. HostAnalytics has been named amongJMP Securities’ Hot 100: The BestPrivately Held Software Companiesand the AlwaysOn OnDemand 100.
Host Analytics has customers in anumber of industries, including con-
sumer packaged goods (Otis Spunk-meyer, Paramount Farms), financialservices (DHI Mortgage, JPMorganChase), manufacturing (SignetArmorlite, Inc.), retail (McCoys),services (MWH Global) and technol-ogy (Sigmatel). Gartner added thecompany to its 2010 magic quadrantfor corporate performance manage-ment (CPM) suites. (Note: both HostAnalytics and Gartner use the termcorporate performance management(CPM) whereas this report uses theterm business performance manage-ment (BPM). For the purposes of thisreport, CPM and BPM are synony-mous.)
A privately held company, HostAnalytics has venture capital back-ing from Advanced Technology Ven-tures, StarVest Partners, TridentCapital and Next World Capital.
BPM SOLUTIONThe Host Analytics solution is com-posed of three applications:
Host Analytics Solution Overview

PART
2SOLUTION
OVERVIEWS AND CASE STUDIES
COPYRIGHT © 2010 TECHTARGET P PERFORMANCE MANAGEMENT AND BUSINESS INTELLIGENCE 25
PART 1:SURVEY AND
RESEARCH FINDINGS
PART 2:SOLUTION
OVERVIEWS AND CASE STUDIES
AUTHORINFORMATION
pHost Analytics Budget, includingExpense Planning and specializedapplications for Revenue Planning,Capital Planning, Workforce Plan-ning and Project Planning
pHost Analytics ConsolidatorpHost Analytics Scorecard
All three applications share:
pA unified databasepA common Excel-like user inter-
face for collecting and updatingplan, actual and metric informa-tion normally not capturedthrough other systems
pA consistent modeling methodol-ogy providing the ability to flexactual results with plan infor-mation
pRobust scenario management forusing understand the decisionsthat need to be made given differ-ent economic and operationalscenarios
pIntegrated reporting
HOST ANALYTICS BUDGETHost Analytics Budget helps execu-tive decision making become a fact-based, highly efficient process andhelps managers, during the planningcycles, understand the full impact ofdecisions, both risk and return.
Save time with familiar Excel format.Decision makers can simply usetheir Internet browser to access
business information that is storedin a central location for quick andeasy access. The browser displaysand functions in Excel format so it’svery familiar to users.
Reduce time on maintenance. Withthe flexibility of Excel comes risk,but Host Analytics Budget mitigatesthat risk by providing database-driven templates. Formulas and values are not trapped in the cellmetaphor but centrally stored fordynamic reporting with database-driven calculations.
Stay on top of the process. In orderto control the budgeting process, itis critical to know the progress of allplans and have the ability to pin-point bottlenecks and delays. HostAnalytics Budget will validate budg-ets automatically based on an orga-nization’s guidelines and targets.Reports are available on who hasthe budget, when they got it andwho submitted it.
The Host Analytics solu-tion is composed of Host Analytics Budget, Host Analytics Consolidator and Host Analytics Scorecard.
PART
2SOLUTION
OVERVIEWS AND CASE STUDIES
COPYRIGHT © 2010 TECHTARGET P PERFORMANCE MANAGEMENT AND BUSINESS INTELLIGENCE 26
PART 1:SURVEY AND
RESEARCH FINDINGS
PART 2:SOLUTION
OVERVIEWS AND CASE STUDIES
AUTHORINFORMATION
Maintain an accurate, dynamic plan throughout the year. Host Ana-lytics Budget simplifies the refore-casting process by eliminatingproblems associated with multiplelinked spreadsheets. Host Analy-tics Budget’s flexibility will assist inmodeling different company sce-narios and monitoring companyperformance as the year pro-gresses.
Access reports easily. Host Analyt-ics Budget data is stored in anOLAP database for easy informa-tion access. Report output can beeasily set to HTML or Excel for-mats. Reports can be organized andstored together in “briefing books,”so that groups of reports can beaccessed or printed quickly andeasily.
Initiative-based project planning.Host Analytics Budget has uniquefunctionality that allows managersto plan and compare the outcome ofalternative investment decisions.Executives have access to all therequired data and visibility intofinancial risks and returns in order toallocate resources in the most prof-itable way.
Specialized packaged functionalmodules. Host Analytics budget hasspecific modules for workforce plan-ning, revenue planning and capitalplanning.
HOST ANALYTICS CONSOLIDATORHost Analytics Consolidator pro-vides visibility and structure to drivequick and controlled consolidations.
Helping with Sarbanes-Oxley. HostAnalytics Consolidator reduces theeffort of Sarbanes-Oxley compli-ance in financial reporting. Internaland external transparency isimproved and complete audit trailsare provided.
The control panel manages andprocesses all financial consolidationtasks. Host Analytics Consolidatorgoes the extra step by providing anoutline and live snapshot of theentire workflow process through theHost Analytics Control Panel, whichhas a closing and locking mecha-nism built in. If any validation rulesor journal entries are not complete,the reporting site and administratorare alerted and the entire processwill display incomplete and data isnot rolled up.
Checks and balances.pDisplays the steps needed for the
conversion and who is responsible pProvides status on completion
of Sarbanes-Oxley checks andprocesses Enables the administra-tor to view the entire status of theconsolidation process
pIdentifies and prevents bottle-necks

PART
2SOLUTION
OVERVIEWS AND CASE STUDIES
COPYRIGHT © 2010 TECHTARGET P PERFORMANCE MANAGEMENT AND BUSINESS INTELLIGENCE 27
PART 1:SURVEY AND
RESEARCH FINDINGS
PART 2:SOLUTION
OVERVIEWS AND CASE STUDIES
AUTHORINFORMATION
pAllows the administrator to execute tasks
Built-in financial consolidation and reporting functionality. Businessrules, not cryptic scripts, offer asimple way to manage the complex-ity of the consolidation process.
Organization rules manage thecomplexities of minority interestcalculations, subsidiaries on mul-tiple fiscal years, complex equityownership, multilevel eliminationjournal entries and multipleaccounting methods.
Currency conversion rules managecurrency conversion based on FASB8, 52 and 95, including the temporalmethod of currency conversion asrequired for remeasurement orhyperinflationary environments.
Allocation rules allow for the configuration of multilevel alloca-tions across divisions and depart-ments.
Consolidation rules manage thesequence and processing of sub-sidiaries in the financial consolida-tion process.
HOST ANALYTICS REVENUE PLANNINGHost Analytics Revenue Planningsolution is flexible, provides consis-
tent revenue planning and drivespredictable sales growth.
Establishing an accurate view offuture sales is the cornerstone offinancial planning. For most compa-nies, the business plan is drivenfrom the revenue forecast, fromordering supplies, planning opera-tions, projecting inventories, deter-mining headcount and approvingcapital expenditures. Yet many busi-nesses still create the revenue fore-cast from an ad hoc, antiquated sys-tem supported by linkedspreadsheets and the workflow ismanaged by email.
Top-down, middle-out and bottom-up planning. These modeling toolsminimize time wasted building mul-tiple spreadsheets and maximizemodel flexibility. This flexibilityallows managers to analyze thebusiness in a dynamic way: by cus-tomer, by store, by location, by SKUchannel or delivery method andadjust numbers based on changingbusiness conditions.
Flexible, feature-rich budget tem-plates. Host Analytics RevenuePlanning input templates are ren-dered in a browser, in an “Excel-like”smart grid. The interface is datadriven, dynamic and configurable torevenue planning dimensionalrequirements (e.g., product by cus-tomer, by channel, etc.). These tem-

PART
2SOLUTION
OVERVIEWS AND CASE STUDIES
COPYRIGHT © 2010 TECHTARGET P PERFORMANCE MANAGEMENT AND BUSINESS INTELLIGENCE 28
PART 1:SURVEY AND
RESEARCH FINDINGS
PART 2:SOLUTION
OVERVIEWS AND CASE STUDIES
AUTHORINFORMATION
plates handle discrete formulas tomanage complex pricing schemesand multistage sales contracts.Users can create scenario compar-isons in order to drive the refore-casting process. The system sup-ports complex revenue recognitionmodeling including perpetuallicensing agreements, maintenancerevenue calculations, subscriptionrevenue calculations, accretions andamortizations.
Customized workflow. This intuitiveprocess helps users create theirforecasts and budgets and allowsmanagers to understand everyone’sstatus in the plan creation andupdate process. This applies to anytype of planning frequency: fore-casting once per year, every quarteror monthly. Workflow reports onwhere an organization is in theprocess, who participated and whohas not yet provided data, includingsales, marketing, operations andfinance.
Sales and operations planningautomation. Host Revenue Planningprovides the functionality to auto-mate the sales and operations plan-ning (S&OP) process. Utilizing inputtemplates, key team members pro-vide their expectations regardingunit sales and delivery. The groupthen meets to form a consensusestimate of the expected futuresales and delivery. Through this
streamlined process, sales, opera-tions and finance can anticipatefuture performance, manage cus-tomer expectations and allocateresources with reduced costs.
HOST ANALYTICS SCORECARDHost Analytics Scorecard offers visi-bility and flexibility to drive account-ability-focused scorecards.
Driving success through metrics.Visibility in every direction is essen-tial to measuring business perform-ance. The balanced scorecard is atool that is specifically designed tolet managers understand higherlevel KPIs and how these drive themetrics in their area. Senior execu-tives can analyze how the perform-ance measures cascade through theorganization and report variances toplan and make course correctionswhen required.
Help management ask the rightquestions. Simply log into the securecorporate network and view KPIs.These indicators may show prob-lems with KPIs such as on timedelivery and average time for orderentry to shipment which can shift focus to underperformingareas.
Stay focused on objectives. The ultimate purpose of Host Analytics

PART
2SOLUTION
OVERVIEWS AND CASE STUDIES
COPYRIGHT © 2010 TECHTARGET P PERFORMANCE MANAGEMENT AND BUSINESS INTELLIGENCE 29
PART 1:SURVEY AND
RESEARCH FINDINGS
PART 2:SOLUTION
OVERVIEWS AND CASE STUDIES
AUTHORINFORMATION
Scorecard is to guide daily behaviortoward continuous improvement.Host Analytics Scorecard is effec-tive because it translates big picturegoals into objectives that manage-ment can track and employees havethe ability to impact. The solutionhas dashboards with signals, alerts,dials and graphs to make sure vari-ances are communicated to deci-sion makers.
Full configuration to match solutionto processes and KPIs. Use HostAnalytics Scorecard as a standalonefor performance management orcombine it with Host AnalyticsBudget to have integrated perform-ance-based budgeting that alignsstrategy with the budgeting process.
TECHNOLOGY AND PARTNERSHIPSBecause, in a SaaS deployment, thecustomer’s data is in the “cloud”rather than on site, security is apotential customer concern thatSaaS solution providers mustaddress. Host Analytics operatestwo SAS 70 Level II certified datacenters to provide the SaaS environ-ment for its solution. Its applicationshave C2 level security.
Host Analytics is a Microsoft GoldCertified Partner. Its solution wasbuilt using Microsoft developmenttools and uses the Microsoft BIstack (SQL Server database, SQL
Server Analysis Services OLAPengine and thin client integrationwith Excel). The Host Analyticssolution utilizes a multi-tenantarchitecture.
Host Analytics has partnered withBoomi and uses its integrationadapters to common source sys-tems, such as Salesforce, SAP ERP,Microsoft Dynamics CRM, Work-Day and more.
Host Analytics has partnershipswith two BI SaaS vendor—PivotLinkand Birst—to complete the BPM andBI vision along with providing trans-actional level drill down within theHost Analytics product suite.
HOST ANALYTICS’ STRATEGYHost Analytics offers two primarydifferentiators.
One is the SaaS BPM solution.Host emphasizes the fundamentalaspects of the SaaS value proposi-tion: quick implementation andlower cost as well as supportingcontinuous improvement in meth-ods and tools used to drive perform-ance. Customers can start theirimplementation with Host AnalyticsBudget, Host Analytics Scorecard orHost Analytics Consolidator andwork through the other implementa-tions as the internal processesadjust to support the completeBI/BPM process.
Secondly, Host provides a deci-sion platform for exposing the full
PART
2SOLUTION
OVERVIEWS AND CASE STUDIES
COPYRIGHT © 2010 TECHTARGET P PERFORMANCE MANAGEMENT AND BUSINESS INTELLIGENCE 30
PART 1:SURVEY AND
RESEARCH FINDINGS
PART 2:SOLUTION
OVERVIEWS AND CASE STUDIES
AUTHORINFORMATION
implications of decision—both riskand reward.
Host Analytics leverages its SaaSmodel to offer external content andbenchmarks. It is working to offerexternal content and benchmarksspecific to selected vertical indus-tries.
Host Analytics more explicitlylinks BPM and BI than some otherBPM vendors, and knows that“scorecards are the table of con-tents of corporate information.”Host Analytics BPM adds an “intelli-
gence” layer—containing businessrules, business models and businesslogic—to BI and partners with Birstand PivotLink to complete thisvision.
Host Analytics targets the financefunction in its sales efforts, becausefinance departments are the buyersof BPM solutions. For about 60% of its customers, the legacy systembeing replaced is Excel-based, so itemphasizes the “Excel-like”-ness and ease of use of its user inter-face. p
COMPANY BACKGROUNDAcciona Energy, a wholly ownedsubsidiary of the Spanish companyAcciona, develops and operatesrenewable energy projects, includ-ing solar, wind, biomass, biofuelsand small hydro. Parent companyAcciona, publicly traded on theSpanish stock exchange but con-trolled by the Entrecanales family,had 2009 revenue of ¤6.5 billion($5+ billion).
Acciona Energy-North America, the subject of this case study, ownsoperational wind farms in NorthAmerica, totaling 525 megawatts(MW). Its most recent wind
farm, EcoGrove Wind Farm in Illi-nois, can produce 100.5 MW ofenergy to power more than 25,000U.S. homes.
For solar power, Acciona Energy-North America employs Concentrat-ing Solar Power (CSP), a technologythat uses thousands of mirrors toconcentrate the sun’s rays onto asolar receiver, providing clean, reli-able and cost-efficient renewableenergy. Its joint venture NevadaSolar One, the first CSP plant to bebuilt in the last 17 years and the thirdlargest in the world, is a 64 MWplant with the capacity to createelectricity equivalent to the needs of
HOST ANALYTICS CASE STUDY:
Acciona Energy-North America

PART
2SOLUTION
OVERVIEWS AND CASE STUDIES
COPYRIGHT © 2010 TECHTARGET P PERFORMANCE MANAGEMENT AND BUSINESS INTELLIGENCE 31
PART 1:SURVEY AND
RESEARCH FINDINGS
PART 2:SOLUTION
OVERVIEWS AND CASE STUDIES
AUTHORINFORMATION
approximately 14,000 homes annu-ally. The company also has a plantthat builds wind turbines.
The spokesperson interviewed forthis case study was Tom Sullivan,Manager of Financial Planning andAnalysis of Acciona Energy.
THE BUSINESS PROBLEMWhen a new director of accountingand manager of financial planningand analysis joined the company inmid-2008, problematic accountingprocesses and systems were found.A Peachtree accounting system wasin place, but the closing processwas inefficient and the result waslengthy reporting timetables. Allfinancial reporting was done usingExcel. The budgeting process, alsoExcel-based, took input from al-most 50 people. Creating the con-solidated company budget usedmore than 90 intricately linkedExcel workbooks.
Compounding the problem,Acciona Energy-North America hasno internal IT resources: all IT workis outsourced. This meant that no ITresources were available to helpimplement, operate or support moreautomated budgeting and financialreporting systems.
THE SOLUTIONThe company evaluated two BPMalternatives, the Host Analytics
SaaS solution and an on-premisessystem from another software ven-dor. The 5-year total projected costof both systems was similar, but theon-premises system entailed moreup-front cost and required internalIT support, which Acciona Energywould have had to hire or contract.Acciona Energy selected the HostAnalytics solution and had it up andrunning within 60 days.
Acciona Energy-North Americauses the Host Analytics Budget andConsolidator applications. It intendsto, but does not yet, use the Score-card application. Actuals from thePeachtree accounting system areloaded into Host Analytics, which isused for all financial reporting andanalysis.
The company is licensed for 55users. Almost 50 people use thesystem during formulation of theannual budget, and many of theseusers are beginning to use HostAnalytics for ad hoc reporting. Thefinance department has 10 to 15users, 5 to 6 of whom use the sys-tem every day.
BENEFITSHost Analytics is a cost-effective so-lution to Acciona Energy-NorthAmerica’s budgeting and financialreporting needs. The SaaS model fitswell with its lack of internal ITresources.
The finance function has expanded

PART
2SOLUTION
OVERVIEWS AND CASE STUDIES
COPYRIGHT © 2010 TECHTARGET P PERFORMANCE MANAGEMENT AND BUSINESS INTELLIGENCE 32
PART 1:SURVEY AND
RESEARCH FINDINGS
PART 2:SOLUTION
OVERVIEWS AND CASE STUDIES
AUTHORINFORMATION
the amount of information it makesavailable to executives and theoperating departments. As anexample, reports now are availableat the individual department level,which has helped uncover dataanomalies. Financial information ismore accurate, available sooner andwith greater detail than before.
The monthly financial closeprocess and especially the annualbudget development process areautomated, less error prone and less
laborious for the finance depart-ment to execute.
FUTURE PLANSAt present, only the wind energyportion of the company uses theHost Analytics solution. It is work-ing to extend its use to the solarenergy operation and eventually tothe wind turbine plant.
Acciona Energy-North Americaintends to implement an ERP sys-tem, but its plans to do so have beenput on hold due to economic condi-tions. It hopes to be one of the firstadopters of ERP software to beselected by Acciona, its Spanishparent company, for the entireenterprise. ERP implementation willentail changes to the data sourcesfor its Host Analytics solution. p
Reports now are available at the individualdepartment level, whichhas helped uncover anomalies.

PART
2SOLUTION
OVERVIEWS AND CASE STUDIES
COPYRIGHT © 2010 TECHTARGET P PERFORMANCE MANAGEMENT AND BUSINESS INTELLIGENCE 33
PART 1:SURVEY AND
RESEARCH FINDINGS
PART 2:SOLUTION
OVERVIEWS AND CASE STUDIES
AUTHORINFORMATION
COMPANY BACKGROUNDInfor Global Solutions offers enter-prise software for enterpriseresource planning (ERP), customerrelationship management (CRM),enterprise asset management,financial management, human capi-tal management, product life cyclemanagement, performance man-agement and supply chain manage-ment. A global company with officesin more than 100 countries, Inforhas solutions for manufacturing,distribution, and services industries.Its customers include:
pThe top 10 aerospace companies
p9 of the top 10 high tech and electronics companies
p21 of the top 35 life sciences companies
p7 of the top 10 brewerspMany others
Infor is a privately held companywhose primary shareholder is pri-
vate equity firm Golden Gate Capi-tal Partners. It has over $2 billion inrevenue, 70,000+ customers andmore than 8,000 employees. Thecompany was founded (as Agilisys)in 2002 and since then has mademore than 25 acquisitions, includingMAPICS, Geac and SSA Global.
BPM SOLUTION: INFOR PERFORMANCE MANAGEMENT (PM 10)Infor Performance Management(PM 10) is designed for companiesin all industries that seek to bettermonitor, measure and manage theirbusiness performance in real time toimprove competitive advantage.With PM 10, a company can harnessits data—wherever it resides—tobetter understand the businessenvironment, streamline andimprove the effectiveness of finan-cial processes and prepare optionsfor competing successfully.
Closed-loop performance manage-
Infor Global Solutions Technical Overview
PART
2SOLUTION
OVERVIEWS AND CASE STUDIES
COPYRIGHT © 2010 TECHTARGET P PERFORMANCE MANAGEMENT AND BUSINESS INTELLIGENCE 34
PART 1:SURVEY AND
RESEARCH FINDINGS
PART 2:SOLUTION
OVERVIEWS AND CASE STUDIES
AUTHORINFORMATION
ment follows a cycle from strategy toexecution and incorporates theresults of the strategy into the nextcycle. It includes business processesfor strategy, planning, budgeting,consolidation and forecasting. InforPM 10 supports the processes ofclosed-loop performance manage-ment via a set of core components:
pStrategic managementpPlanning and budgetingpForecastingpFinancial consolidationpReporting and analysispMultidimensional analysispAdvanced query and analysis
Strategic management. Use a cause-and-effect framework to link strate-gic plans to operational plans, per-formance measures and people.Management gains an intuitive,visual method of reporting on howthe actions of operating units andindividuals are contributing to thesuccess of strategic goals.
Planning and budgeting. Easily cre-ate and compare multiple “what if”scenarios, test assumptions, assessthe impact of events and model thebusiness to meet targets and high-level objectives. At the same time,any number of zero-based, histori-cal-based, and rolling budgets andplans can be designed.
Forecasting. Create statistically
accurate forecasts that help manageperformance expectations, maketactical adjustments and achieveperformance goals. Generate rollingforecasts, check the accuracy ofsubmitted plans and receive auto-matic alerts that allow issues to beeasily spotted as they arise—soaction can be taken quickly.
Financial consolidation. Improve cor-porate accountability, increasefinancial transparency and meetgovernment-mandated reportingdeadlines confidently. Collect,process, report and analyze data inmultiple currencies as well as reporton the effects of currency fluctua-tions. IPM helps organizationsensure compliance with GAAP, IFRS,Sarbanes-Oxley, FASB, Basel II andXBRL. IPM also provides financialreporting capabilities to automatethe generation, formatting and dis-tribution of book quality financialstatements and managementreports.
Reporting and analysis. Provide busi-ness intelligence by accessing, filter-ing, analyzing and publishing infor-mation throughout the organization.All reports are instantly webenabled and can be deployed usingstandard web browsers. With inte-gration to other Infor PM applica-tions, reports for production report-ing, budgeting and planning can bebuilt.
PART
2SOLUTION
OVERVIEWS AND CASE STUDIES
COPYRIGHT © 2010 TECHTARGET P PERFORMANCE MANAGEMENT AND BUSINESS INTELLIGENCE 35
PART 1:SURVEY AND
RESEARCH FINDINGS
PART 2:SOLUTION
OVERVIEWS AND CASE STUDIES
AUTHORINFORMATION
Multidimensional analysis. Getmemory-resident OLAP capabilitiesthat ensure fast access to large volumes of summarized data. Theunderlying technology of this solu-tion makes it simple to browse datafrom any angle and level of detail.
Advanced query and analysis. With apowerful, flexible and customizableMicrosoft Excel add-in, report andanalyze data in Excel without need-ing multiple tools or dealing withtime-consuming imports. This solu-tion can also be used as a platformfor building and deploying analyticapplications.
INFOR STRATEGYThe product strategy supportsInfor’s value proposition to cus-tomers:
Continuous innovation:
pMore software choicespCustomers can add solutions at
their own pacepService-oriented architecture
(SOA) enables faster, less disrup-tive response to changing busi-ness requirements
pFaster implementationpFast start programspTemplate-based business editions
for many solutionspOnePoint implementation
methodology
Better global service and support:
pLocalized versions of solutionspSupport and training available in
20 languagespInfor365 collaborative community
Flexible buying options:
pTraditional software licensespHosted applicationspSoftware as a servicee
Specific to its PM 10 performancemanagement solution, Infor offersthese points of differentiation:
Integrated information presentationvia MyDay. Infor MyDay is a userinterface for Infor solutions basedon the concept of user personas.Each persona is based on in-depthresearch into how an end user doeshis/her work and interacts withinformation to do that work. Itencompasses that person’s respon-sibilities, daily tasks, skills, workenvironment, management hierar-chy, and goals and challenges.Based on understanding each userpersona, Infor has prebuilt reportsand metrics specific to it. The userdoes not need to know in whichapplication, module, database table,etc. the information of interest tohim/her resides.
Source system inclusivity. PM 10 candraw data from other Infor solutions,
PART
2SOLUTION
OVERVIEWS AND CASE STUDIES
COPYRIGHT © 2010 TECHTARGET P PERFORMANCE MANAGEMENT AND BUSINESS INTELLIGENCE 36
PART 1:SURVEY AND
RESEARCH FINDINGS
PART 2:SOLUTION
OVERVIEWS AND CASE STUDIES
AUTHORINFORMATION
non-Infor ERP, general ledger andother applications, Access databases,Excel spreadsheets, etc. It is designedto be able to take data from whateversource(s) the customer has.
Unified database. All the core com-ponents of PM 10 share the samedatabase, in contrast to some of itscompetitors which have a separatedatabase for each performancemanagement module.
Comprehensiveness of solution. InforPM 10 supports the entire closed-loop performance managementcycle.
Scalability of solution. Infor PM 10 isan appropriate performance manage-ment solution for enterprises of allscales and levels of complexity. It isused by companies ranging from verysmall to global companies with morethan $4 billion of annual revenue. p
COMPANY BACKGROUNDBlueLinx Corporation was born in2004 when Cerberus Capital Man-agement, a private equity firm, and a team of executives purchased thedistribution division of Georgia-Pacific Corporation. It became apublicly traded corporation in 2005,with Cerberus retaining 55% ownership.
BlueLinx is a Fortune 1000 com-pany (2009: $2.78 billion revenue;#722) and the largest distributor ofbuilding products in the UnitedStates. It distributes products in twocategories: structural products (ply-wood, oriented strand board, rebarand lumber) and specialty products(roofing, insulation, vinyl products
and more). Major competitors areWeyerhaeuser Company and BoiseCascade LLC.
BlueLinx operates a network of 68warehouses and a fleet of 600+tractors and 1,000+ trailers and hassales centers in Denver and Atlanta.It distributes more than 10,000products from 750 vendors to11,500 customers.
The BlueLinx spokesperson inter-viewed for this case study wasMichael D. Shaw, IT Project Manager.
APPLICATION LANDSCAPE AND BI ENVIRONMENTWhen spun-out from Georgia-Pacific,BlueLinx took its application sys-
INFOR CASE STUDY:
BlueLinx Corporation
PART
2SOLUTION
OVERVIEWS AND CASE STUDIES
COPYRIGHT © 2010 TECHTARGET P PERFORMANCE MANAGEMENT AND BUSINESS INTELLIGENCE 37
PART 1:SURVEY AND
RESEARCH FINDINGS
PART 2:SOLUTION
OVERVIEWS AND CASE STUDIES
AUTHORINFORMATION
tems and associated infrastructurewith it. One of these systems wasInfor Infinium, an IBM AS/400-based ERP system that BlueLinxuses for procurement, generalledger, accounts payable andaccounts receivable. Most of theother application systems wereinternally developed custom appli-cations running on SQL Server;these include customer order pro-cessing and warehouse manage-ment systems.
The BlueLinx culture of internallydeveloping applications extends toits BI efforts. It has a SQL Server-based data warehouse that supportsboth reporting and a number of ana-lytic applications. One of these ana-lytic applications is a “contributionmodel” that allocates costs to prod-ucts and customers. (Each ofBlueLinx’s 68 warehouses is a sepa-rate profit center and has its ownP&L; this entails complex cost allo-cation.) A pricing model that usesfull product costing and a desiredgross margin to dynamically deter-mine the price to quote customers isbeing implemented.
BlueLinx uses the SQL Server toolset, Visual Basic and .NET todevelop both its transaction pro-cessing and BI applications; it doesnot use a BI tool.
THE BUSINESS PROBLEMDuring its days as a Georgia-Pacific
division, BlueLinx did financialreporting using Microsoft Access asthe reporting front end to a SQLServer database, with both the data-base and the reporting being ownedby the accounting departmentrather than IT. This approachworked for a division with no exter-nal reporting requirements—itsoperations were included in Geor-gia-Pacific’s external reporting.
The spin-out from Georgia-Pacificin 2004 and the IPO in 2005 broughtsignificant new financial reportingrequirements—all those of a publiclytraded company. The home-grownAccess-based financial reporting sys-tem could not satisfy those additionalrequirements. In addition, themonthly close process took 1.5weeks, even though the accountingstaff worked significant overtime;both the elapsed time and the staffworkload were unacceptable.
THE SOLUTIONLeveraging its existing relationshipwith Infor, BlueLinx selected Infor’sPerformance Management Suite,PM 10, to replace its home-grownAccess-based financial reportingsystem. It considered financialreporting solutions from Cognosand Hyperion, but chose Infor PM10 because it met the requirementsat significantly less cost.
BlueLinx used Infor ProfessionalServices to improve the perform-

PART
2SOLUTION
OVERVIEWS AND CASE STUDIES
COPYRIGHT © 2010 TECHTARGET P PERFORMANCE MANAGEMENT AND BUSINESS INTELLIGENCE 38
PART 1:SURVEY AND
RESEARCH FINDINGS
PART 2:SOLUTION
OVERVIEWS AND CASE STUDIES
AUTHORINFORMATION
ance of its PM 10 implementation.Professional Services recommendedthat BlueLinx build multidimensionalcubes using Microsoft SQL ServerAnalysis Services (SSAS) and havePM 10 access the data from thecubes, rather than using the rela-tional Business Integration Services(BIS) database that comes with PM10. The SSAS cubes approach dra-matically improved performance.
IT has taken over responsibility forthe back end (the SQL server data-base and SSAS cubes), whileaccounting staff self-serve theirreporting needs using PM 10.
BENEFITSInfor PM 10 fulfills BlueLinx’s exter-nal reporting needs. The monthlyclose process now takes 3.5 days
down from 10.5 days, a reduction ofone week, with the accounting staffworking normal hours.
FUTURE PLANSBlueLinx is working to implementinventory reporting using PM 10. Itwill build a separate SSAS cube containing the inventory data, andPM 10 will draw data from thatcube.
BlueLinx has licensed the entireInfor PM 10 suite, which has fivecore components: strategic man-agement, planning and budgeting,forecasting, financial consolidation,and reporting and analysis. It cur-rently uses the financial consolida-tion and reporting and analysiscomponents, and might use addi-tional components in the future. p
PART
2SOLUTION
OVERVIEWS AND CASE STUDIES
COPYRIGHT © 2010 TECHTARGET P PERFORMANCE MANAGEMENT AND BUSINESS INTELLIGENCE 39
PART 1:SURVEY AND
RESEARCH FINDINGS
PART 2:SOLUTION
OVERVIEWS AND CASE STUDIES
AUTHORINFORMATION
COMPANY BACKGROUNDTeradata Corporation focuses onimproving decision agility throughdatabase software, integrated datawarehousing, data warehouse appliances and business analytics.
Teradata has more than 950 cus-tomers worldwide and over 1,900installations of its parallel databasemanagement software. It has largeand prominent customers in retail(Walmart, Tesco, SUPERVALU Inc.),banking (Royal Bank of Canada,Wells Fargo, Bank of America),telecommunications (AT&T, BellCanada, Vodafone), airlines (Ameri-can Airlines, Continental Airlines)and other industries. In 2010 Tera-data was recognized as a “Top 10Most Strategic Vendor” by Informa-tionWeek.
Teradata is a Fortune 1000 com-pany (2009: $1.709 billion revenue;#979). Founded in 1979 in a garagein Brentwood, California, Teradatahas 6,000 employees in 60 coun-tries. From 1991 to 2007 it was
owned by NCR Corporation, butthen spun-off as a public company(NYSE: TDC).
BUSINESS ANALYTICS OFFERINGS FOR BPM AND BIUsing a full suite of tools, applica-tions, consultants and partnerships,Teradata users integrate financialdata with customer, operational(e.g., POS, web clicks, orders, prod-uct production and supply chaindata) and industry data, facilitatingcross-functional analyses through-out the enterprise. By linking finan-cials to key operational drivers, Ter-adata serves as a crucial foundationfor both business intelligence andbusiness performance manage-ment.
Teradata complements its corescalable data warehouse technologyand services with a wide array ofapplications and partnerships perti-nent to BI and BPM.
Teradata Corporation Solution Overview

PART
2SOLUTION
OVERVIEWS AND CASE STUDIES
COPYRIGHT © 2010 TECHTARGET P PERFORMANCE MANAGEMENT AND BUSINESS INTELLIGENCE 40
PART 1:SURVEY AND
RESEARCH FINDINGS
PART 2:SOLUTION
OVERVIEWS AND CASE STUDIES
AUTHORINFORMATION
TERADATA DECISION EXPERTSUsed by customers such as QantasAirlines, Office Depot and O2, Tera-data Decision Experts (TDEs) areflexible, prepackaged and integrateddata models for key subject areasincluding general ledger, accountspayable, accounts receivable, pur-chasing, fixed assets, projectaccounting, inventory, order man-agement, human resources and pay-roll. Leveraging Decision Expertswith Teradata’s industry data mod-els provides customers the ability tolink financial data and operationaldrivers, and provides a platform forconsistent calculation of all KPIs and metrics.
TERADATA VALUE ANALYZERCompanies such as DHL and RoyalBank of Canada use a calculationengine called Teradata Value Ana-lyzer (TVA) to understand the prof-itability of processes, products, pro-grams and customers. TeradataValue Analyzer (TVA) drives theanalysis of activity-based profitabil-ity at both detailed and aggregatelevels. TVA captures object levelfinancial events by defining businessrules associated with the drivers (orcomponents) of profitability, e.g.,calculation of direct costs versusindirect costs.
TERADATA RELATIONSHIP MANAGERTeradata Relationship Manager(TRM) assists companies such asHallmark Cards, National AustraliaBank and Lloyds Banking Group togauge and optimize the perform-ance of marketing activities. Analyt-ical insights from TRM ensure thatbusinesses communicate with theirhigh value customers with the rightcontent and offers at the right time.TRM has three interrelated mod-ules�Campaign Management, OfferOptimizer and Marketing ResourceManager (MRM). Teradata MRM is“BPM for Marketing,” so marketingleaders can:
pManage, coordinate and trackmarketing budgets
pManage and simplify distributionof digital assets
pAutomate and coordinate market-ing process workflows enterprise-wide
pTrack and analyze marketing cam-paign performance
pImprove coordination and man-agement of outside agencies
TERADATA/ORACLE HYPERIONPARTNERSHIPCompanies such as BNSF, Nation-wide and Verizon benefit from thepartnership of Teradata and Oraclefor BPM and BI solutions. The part-nership integrates and optimizes
PART
2SOLUTION
OVERVIEWS AND CASE STUDIES
COPYRIGHT © 2010 TECHTARGET P PERFORMANCE MANAGEMENT AND BUSINESS INTELLIGENCE 41
PART 1:SURVEY AND
RESEARCH FINDINGS
PART 2:SOLUTION
OVERVIEWS AND CASE STUDIES
AUTHORINFORMATION
Teradata with Oracle Business Intel-ligence, Oracle Essbase and OracleEnterprise Performance Manage-ment�which includes Oracle Hyper-ion Financial Management and Ora-cle Hyperion Planning.
TERADATA/SAP PARTNERSHIPAs a database platform for SAPBusiness Objects Business Intelli-gence and Information Manage-ment solutions, Teradata improvesBI across SAP and non-SAP data.Freescale, a major semiconductormanufacturer, used Teradata andSAP joint technology to optimize itsfinancial close process. Anotherquality analytics project drove $100million in improved gross marginfrom increasing manufacturing lotyields. Other reference customersinclude Coca-Cola, Ford and theHershey Company.
TERADATA/SAS PARTNERSHIPThe Teradata and SAS partnershipfocuses on ability to run and opti-mize key SAS analytics within theTeradata database engine, leverag-ing the core parallel processinginherent in Teradata’s architecture.The Business Insight Advantageprogram combines the Teradatadatabase platform with the SASBusiness Analytics Framework to
accelerate the deployment and exe-cution of business analytics. Thisincludes data integration, modeldevelopment and deployment, andforecasting and reporting. The twocompanies have participated inmore than 350 global customerengagements spanning multiple ver-tical markets.
ADDITIONAL PARTNERSHIPS Teradata and MicroStrategy have a14-year-old alliance based on sev-eral years of successful integrationat approximately 200 customers,including Hudson’s Bay and the U.S.Postal Service.
Teradata partnerships with IBMBusiness Analytics (Cognos andSPSS) date back more than 12 years.Together, Cognos, SPSS and Tera-data provide a flexible and compre-hensive performance managementsolution used by more than 200joint customers such as Sabre Hold-ings and Barclays Bank.
BUSINESS ANALYTICS STRATEGYFOR BPM AND BITeradata believes that a successfulBPM implementation requirestightly linking a company’s entireinformation flow to businessprocesses, corporate strategy and BIcapabilities. As a company’s officialkeeper of results and statistics, the

PART
2SOLUTION
OVERVIEWS AND CASE STUDIES
COPYRIGHT © 2010 TECHTARGET P PERFORMANCE MANAGEMENT AND BUSINESS INTELLIGENCE 42
PART 1:SURVEY AND
RESEARCH FINDINGS
PART 2:SOLUTION
OVERVIEWS AND CASE STUDIES
AUTHORINFORMATION
finance organization doing BPMderives value from the ability to seeall financial data in one place withcommon data definitions and com-mon business rules. FIGURE 10 showsthe Teradata Reference architecturefor BPM/BI and critical elementsdelivered through Teradata technol-ogy, tools, professional services andpartnerships.
A shared, warehouse-centricapproach to BPM and BI has severaladvantages over stovepiped, sepa-rate but independent, approaches tobuilding BI applications, score-boards/dashboards and BPM capa-bilities:
1. Lower cost. Data needed by BIand BPM usually has high overlap. Ashared data warehouse approachdramatically reduces storage costs.Companies can simultaneously
leverage the same data source forBPM tools for forecasts and moni-toring actuals as well as for BI inves-tigations that drill into manufactur-ing production anomalies or showshifting markets or customer pur-chase patterns.
2. Innovation. Often 80% of thecost of a new project is finding andsourcing data. By sharing the data,business groups can more quicklyinvent and build new KPIs andvalue-added applications.
3. Business alignment. Aligningfront-line groups whose actionsimpact daily operations with back-office departments effectively putseveryone in the company on thesame page. Teradata customersoften use BI to discover leading ver-sus lagging indicators, which can
FIGURE 10: Shared Warehouse-Centric Approach

PART
2SOLUTION
OVERVIEWS AND CASE STUDIES
COPYRIGHT © 2010 TECHTARGET P PERFORMANCE MANAGEMENT AND BUSINESS INTELLIGENCE 43
PART 1:SURVEY AND
RESEARCH FINDINGS
PART 2:SOLUTION
OVERVIEWS AND CASE STUDIES
AUTHORINFORMATION
then be put on BPM dashboards. OrBPM-based financials or salesanomalies can be investigated withBI tools to drill into details anddetect causative factors.
4.Accelerated insight and action.When data is loaded rapidly,insights are fresher. The use of trig-gers in Teradata helps analysts orfront-line users react decisively totime-critical business events,decreasing response times for cus-tomer-critical events with positiveimpacts on dashboard scores forcustomer delight.
Teradata’s Data Warehouse isbased on a platform family of hard-ware products as well as Teradata 13software, which runs across all sizesof platforms.
HARDWAREThe hardware platform familyincludes:
pActive Enterprise Data Warehousefor enterprise-wide centralizeddata computing, supporting tensof thousands of simultaneoususers, up to 14 petabytes (PB).
pExtreme Performance Appliancefor intensive, high performanceanalytics and lower data work-loads, featuring the first datawarehouse composed entirely of
solid state disks, up to 24 ter-abytes (TB). Improves query per-formance by a factor of 20.
pExtreme Data Appliance for higherdata, lower analytic computeapplications, up to 50PB of data.Provides high amounts of cost-effective online data for compa-nies with large data storage com-pliance requirements.
pData Warehouse Appliance forcompanies just starting theirenterprise data warehouse(EDW) efforts or for workgroupswho require a production datamart, up to 514TB.
pData Mart Appliance is a starterkit for first implementations ortesting/development, up to 6TB.
SOFTWAREAll these platforms run Teradata 13,which features in-database process-ing for SAS analytics and statisticalfunctions, and recently announcednative support for SAP BW andBusiness Explorer BEX with Teradata13.10, which will be available later in2010. These capabilities are alsoused by a variety of BI reporting andanalytics partners such as IBM Busi-ness Analytics (Cognos and SPSS),MicroStrategy and SAP BusinessObjects. In-database processingmoves intensive computing inside

PART
2SOLUTION
OVERVIEWS AND CASE STUDIES
COPYRIGHT © 2010 TECHTARGET P PERFORMANCE MANAGEMENT AND BUSINESS INTELLIGENCE 44
PART 1:SURVEY AND
RESEARCH FINDINGS
PART 2:SOLUTION
OVERVIEWS AND CASE STUDIES
AUTHORINFORMATION
the Teradata system, so complexSQL generated by these BI tools canexploit Teradata’s parallel process-ing capabilities. This is much moreefficient than copying data from Ter-adata into separate data sets, com-puting remotely, and putting resultsback into Teradata, resulting in dra-matically improved query process-ing times and far lower storagerequirements.
New features in Teradata 13include native geospatial capabili-
ties for spatial analytics and visuali-zation as well as enhanced workloadmanagement tools for DBAs to cre-ate and monitor workload queuesfor various kinds of simultaneousworkloads (ETL, ad hoc queries andoperational queries with tight serv-ice level agreements). TeradataExpress for VMware and Amazon’sEC2 are two new offerings cus-tomers or prospects can use toexplore the use of private or publicdata warehouse clouds. p
COMPANY BACKGROUNDAT&T Inc. is a telecommunicationscompany comprised of pieces of theformer “Ma Bell” AT&T Corporation,which was broken up in 1984, andnumerous acquisitions. It includes 11of the original Bell Operating Com-panies and the AT&T Corporationlong lines division.
In 2005, SBC CommunicationsInc. (formerly, Southwestern Bell)acquired AT&T Corporation (theoriginal “Ma Bell” parent company)and changed the name of the com-bined entity to AT&T Inc. In 2006, itacquired BellSouth (originally,Southern Bell and South CentralBell). The BellSouth acquisition con-
solidated ownership of CingularWireless and Yellowpages.com,which previously were joint venturesbetween AT&T and Bell South. Allservices now are offered under theAT&T brand name.
AT&T is #8 in the Fortune 500,with 2009 revenue of $123 billion.This case study is about the wirelessbusiness, AT&T Mobility, which is a$53.6 billion operating segment.AT&T Mobility interacts with60,000 customers per day throughits retail stores, call centers andother venues. In addition to its own2,200 retail stores, AT&T Mobilityalso sells through national retailersand independent agents.
TERADATA CORPORATION CASE STUDY:
AT&T Mobility
PART
2SOLUTION
OVERVIEWS AND CASE STUDIES
COPYRIGHT © 2010 TECHTARGET P PERFORMANCE MANAGEMENT AND BUSINESS INTELLIGENCE 45
PART 1:SURVEY AND
RESEARCH FINDINGS
PART 2:SOLUTION
OVERVIEWS AND CASE STUDIES
AUTHORINFORMATION
AT&T Mobility is organized into27 geographic regions, each ofwhich is headed by a vice presi-dent/general manager who has fullP&L responsibility for all aspects ofoperations: network, infrastructure,stores, distribution, etc. The cultureis very sales-oriented, with anemphasis on growing top-line rev-enue.
AT&T Mobility articulates itsobjectives as:
pGrowth: penetration of new mar-kets and growth in existing mar-kets
pReturn on operations and invest-ments
pCustomer service and reputationpFinancial contribution to the par-
ent company
Matt Boos, Director of Perform-ance, Planning & Analysis, and TimMcCabe, Executive Director of DataWarehousing for AT&T Mobility,were the spokespeople for thisinterview.
DATA WAREHOUSING AND BUSINESS INTELLIGENCELANDSCAPEAT&T is an enormous enterprisewhose piece parts themselves arequite large. Predecessor companiesAT&T Long Lines, SBC, Bell South,Cingular Wireless and AT&T Wire-less all had multi-terabyte Teradata-
based enterprise data warehouses;these all continue in the combinedenterprise.
One of the enterprise data ware-houses used by AT&T Mobility, andthe subject of this case study, is a700-terabyte “eCDW” Teradatadata warehouse that consolidated:
pAll wireless businesspMost consumer landlinespNo regulated landlines
Historically, eCDW services 400to 600 simultaneous users, a maxi-mum of 2,500 to 3,000 users perday, running 200,000 traditional BIqueries per day. AT&T Mobility usesmost of the major BI reporting andanalysis tools, including:
pBusiness Objects, primarily bysales
pMicroStrategy, primarily by con-sumer marketing
pHyperion, primarily by financepCognos and many others
The eCDW data warehouse isused for more than just reporting; itsupports a number of BI applica-tions, including:
pDeriving sales targets and newKPI options.
pMarketing campaign manage-ment, using an analytic applica-tion from Unica.
pUnified household view, which
PART
2SOLUTION
OVERVIEWS AND CASE STUDIES
COPYRIGHT © 2010 TECHTARGET P PERFORMANCE MANAGEMENT AND BUSINESS INTELLIGENCE 46
PART 1:SURVEY AND
RESEARCH FINDINGS
PART 2:SOLUTION
OVERVIEWS AND CASE STUDIES
AUTHORINFORMATION
provides call center agents a uni-fied view of an AT&T Mobility cus-tomer.
pPersonalized course of action,which uses customer history andlifetime value to determine aseries of “next best” offers for asalesperson to present to a cus-tomer.
Most of the sales reporting fromeCDW is via the Sunrise data martrunning on the same Teradata hard-ware, which integrates and con-forms data from many sourcesacross a common organization hier-archy, product and other dimen-sions. The Sunrise data mart alsoapplies complex business rules tocalculate business defined metrics.Information from the Sunrise datamart is accessible via BusinessObjects and delivered via HTMLreports.
THE BUSINESS PROBLEM/OPPORTUNITYAT&T Mobility has a large portfolioof Business Objects sales reports,and each regional VP/GM has areporting manager and staff whodevelop new reports. Historically,access to sales metrics was limitedto standard HTML reports deliveredlate in the day or new customreports developed by the regionalreporting staff. While useful, theavailable reporting did not com-
pletely satisfy the need for salesinformation so a project waslaunched to widen access for front-line users, specifically storemanagers. The requirements included:
pAccess. Provide self-serviceaccess to an order-of-magnitudemore users, including store man-agers, marketing and financeemployees who need sales infor-mation, and executives, some ofwhom need the ability to slice anddice, drill, and trend data.
pFast value. Quickly and easily tellstore managers what they need toknow about the operations of theirstores. Store managers have littletime—they want to spend lessthan 10 minutes per day gettingtheir metrics—and are not inter-ested in learning or using BI tools.
pCustomization. Each of the 27regions has a unique competitivesituation, market share, and capa-bilities, and therefore has a uniquestrategy and objectives (or, atleast, a unique prioritization ofthem). Each region and storeneeds a unique subset of perform-ance KPIs/metrics, with uniqueweighting/prioritization tailoredto its situation.
pEase of use. Although AT&T had astandard web access tool, it was

PART
2SOLUTION
OVERVIEWS AND CASE STUDIES
COPYRIGHT © 2010 TECHTARGET P PERFORMANCE MANAGEMENT AND BUSINESS INTELLIGENCE 47
PART 1:SURVEY AND
RESEARCH FINDINGS
PART 2:SOLUTION
OVERVIEWS AND CASE STUDIES
AUTHORINFORMATION
too expensive to license andrequired too much training to bethe right tool for store managersor executives. None of the manyBI tools in use within AT&T Mobil-ity had the right functionality tomeet all the requirements of thisapplication.
pUp to date. An infrastructure thatcould deliver updated informationtimely (by 9:00 a.m. each day),provide sub-second response timeand handle tens of thousands ofusers.
THE SOLUTIONAT&T Mobility developed what itcalls a sales dashboard, althoughthe functionality of the application issubstantially more than a dash-board. It devoted significant timeand effort to working with all levelsof users to understand their needs,spending more than 6 months initerative prototyping.
The sales dashboard applicationleveraged the existing Teradata-based eCDW and Sunrise datamart. The front end is a custom Javauser interface that:
pUses cascading dropdowns tonavigate through the organiza-tional hierarchy. Each organiza-tional level and region combina-tion sees a customized view ofwhat is useful to it.
pEnables slice and dice by breakingdown star schemas into check-boxes, radio buttons, dropdownsor list boxes.
pRealizes a “browse for my met-rics” experience chosen from a“cafeteria” of 150 KPIs.
pProvides configuration choicesused to drive the nightly ETL toload the right metrics.
pAchieves quick response time byprecalculating all metrics.
To support both the responsetime requirements and the largeuser population, both the datamodel and the queries were highlytuned to deliver the specific andpredictable requirements of thesales dashboard.
BENEFITSThe sales dashboard application hasbeen deployed and enables regionaland store managers to proactivelymonitor and manage sales perform-ance based on the set of customizedKPIs that support their businessobjectives based on unique regionaland store demographics and charac-teristics.
This project effectively leveragedAT&T Mobility’s existing investmentin Teradata (eCDW enterprise datawarehouse and Sunrise data mart).
PART
2SOLUTION
OVERVIEWS AND CASE STUDIES
COPYRIGHT © 2010 TECHTARGET P PERFORMANCE MANAGEMENT AND BUSINESS INTELLIGENCE 48
PART 1:SURVEY AND
RESEARCH FINDINGS
PART 2:SOLUTION
OVERVIEWS AND CASE STUDIES
AUTHORINFORMATION
Thanks to the tuning of the datamodel and queries, the sales dash-board:
pHas consistently met all perform-ance goals specified in the servicelevel agreements with usergroups.
pRequired minimal additional hard-ware investment. The dashboardqueries run on the same box asthe BI queries with high prioritycompared to BI workloads.
pHas had no negative impact onother eCDW query performance.
This project was estimated tocost $1.5 million to initiate and $1
million for the first productionrelease. AT&T uses a waterfall-oriented development methodologycalled the IT Unified Process(ITUP). To reduce the elapsed timeto deliver new BI/reporting, AT&TMobility changed how it organizesBI projects: IT is responsible for theinfrastructure and the back end,while the business group (salesoperations) is responsible for thefront end, and the front-end devel-opers belong to it. Building the salesdashboard using this new approachcost only $650,000 of internallabor, a significant cost savings toalternate approaches for doingBPM. Using the same system for BIand BPM paid big dividends forAT&T Mobility. p

AUTHORINFORMATION
COPYRIGHT © 2010 TECHTARGET P PERFORMANCE MANAGEMENT AND BUSINESS INTELLIGENCE 49
PART 1:SURVEY AND
RESEARCH FINDINGS
PART 2:SOLUTION
OVERVIEWS AND CASE STUDIES
AUTHORINFORMATION
Nancy Williams is VicePresident of Business Intelli-gence and Data Warehousingfor DecisionPath Consulting. Sheis a sought-after speaker, in-structor, author and consultant
on BI/DW topics and has been a judge for TDWIbest practices competitions for more than 10years. She holds an MBA in General Manage-ment from the Darden School of University ofVirginia.
With Steve Williams, she is a co-author of TheProfit Impact of Business Intelligence and Decision-Path’s BI Pathway Method. Nancy’s clients haveincluded McCormick & Company, Marriott Inter-national, Legg Mason, Taubman Centers, StewartInformation Services, Principal Financial Group,Travelers Insurance and the U.S. Social SecurityAdministration. Nancy has an expert channel onthe BeyeNETWORK at http://www.b-eye-net-work.com/channels/1381/. She may be con-tacted at [email protected].
Steve Williams is Founderand President of DecisionPathConsulting, whose mission is toleverage data warehousing,business intelligence and per-formance management tech-
nologies and methods to improve its clients’business performance. He holds an MBA in Gen-eral Management from the Darden School of theUniversity of Virginia.
Steve has written for many business journalsand magazines, including Strategic Finance, Busi-ness Trends Quarterly, Business Intelligence Journaland Information Management (previously DMReview). With Nancy Williams, he is co-author ofThe Profit Impact of Business Intelligence (Else-vier/Morgan Kaufman Publishing, 2006). Steve’sclients have included Pinnacle Foods Group,United Natural Foods, Inc., McCormick & Com-pany, Toronto Hydro Corporation, PrincipalFinancial Group, the U.S. Treasury and the U.S.Social Security Administration. He may be con-tacted at steve.williams@decision path.com.
The authors wish to acknowledge the substantial contribution of their colleague, Bill Collins, for the insights pro-vided therein. Bill executed the survey and provided the scoring and analysis that form the basis for the findingsreported here.
All product names mentioned in this report are the trademarks/registration trademarks of their respective manufacturers.