Performance Information Team Blood Transfusion …uthscsa.edu/cpshp/CSEProject/Performance...
29
Performance Improvement Team Transfusion Delays South Texas Veterans Healthcare System Data Timeframe January to July 2009
Transcript of Performance Information Team Blood Transfusion …uthscsa.edu/cpshp/CSEProject/Performance...

Performance Improvement Team Transfusion Delays
South Texas Veterans Healthcare System
Data Timeframe
January to July 2009
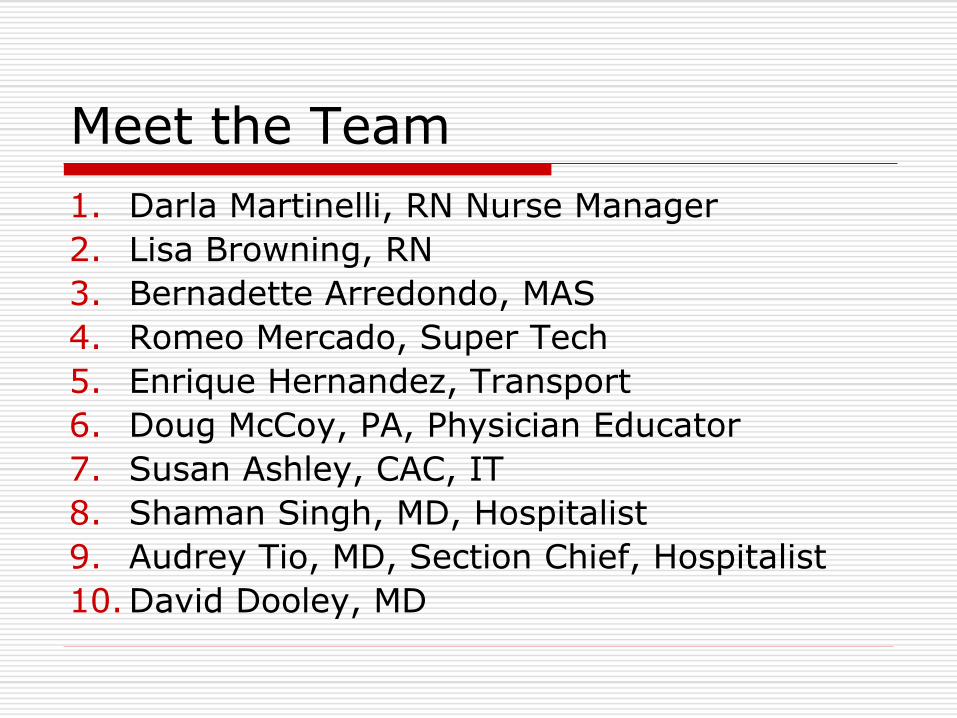
Meet the Team
1. Darla Martinelli, RN Nurse Manager
2. Lisa Browning, RN
3. Bernadette Arredondo, MAS
4. Romeo Mercado, Super Tech
5. Enrique Hernandez, Transport
6. Doug McCoy, PA, Physician Educator
7. Susan Ashley, CAC, IT
8. Shaman Singh, MD, Hospitalist
9. Audrey Tio, MD, Section Chief, Hospitalist
10.David Dooley, MD

Situational
Decision Rule
Priority
Requirement
Priority Focus
Area
Mission Critical
MeasureOIG
Immediate Threat to
Health & Safety
Preliminary Denial of
Accreditation (PDA)
High Risk
Assessment & Care
Credential Practitioners
Communication
Technical QualityCommunity Acquired
PneumoniaPt Identification
Strategic Business
PlanCARF
Situation Decision Rule
Conditional
Addredication
(CA) & PDA
Problem Prone
Equipment Use
Infection Control
Information Mgmt.
Medication Mgmt.
Access To Care Heart Failure
Improve
Communication Among
Caregivers
Transformational
MeasureCAP
Direct Impact
RequirementNew Procedure
Organizational
Structure Orientation
& Training
Patient/Client Safety
Physical Environment
Customer Satisfaction Acute MIImprove Safety of Using
Medications
Key Core Competency ACOGIndirect Impact
RequirementHigh Volume
Performance
Improvement
Rights & Ethics
Staffing
Maximize Resources SIP
Reduce Risk of
Healthcare Associated
Infections
Monitor Surgery Low Volume Healthy Communities ACS Reconcile Medications
NCQA Employer of Choice
Reduce the Risk of
Patient Harm Resulting
from Falls
Texas Quality AwardReduce the Risk of Flu
& Pneumonia
Carey Award
Encourage Patient's
Involvement in Own
Care
Prevent Healthcare
Associated Pressure
Ulcers
Identify Safety Risks
Inherent in Patient
Populations
Priority Setting Tool
Pro
ject
Project being assessed for priority setting: Blood Administration Delays Date: Dec 2009
Referral Source: Dr. Bauer via QEB
Services / Location: Blood Bank, Nursing Units, Transporter, MAS
What data is available demonstrating the problem: None
Aim/Goal of Re-design / PI Team: To reduce perceived delays in blood administration time
Business Case for Recommending Re-design/PI Team: Unit LOS, MD Satisfaction
Key DriversORYX Core
MeasureNPSG
Recommendation: Patient Care Re-design PI Team Refer to ACOS Other:
Assessm
en
t K
ey
(C
ircle
all
th
at
ap
ply
)
Hig
h P
rio
rity
= 7
- 8
Ite
ms C
ircle
d o
r 1 I
tem
in
th
e R
ed
Are
a
Mo
dera
te P
rio
rity
= 4
- 6
Ite
ms C
ircle
d
L
ow
Pri
ori
ty =
1 -
3
Item
s C
ircle
d
Performance
Indicators &
Monitors
Other
Accreditations
Joint Comission

Aim Statement
To reduce transfusion time from the "MD order” to the “Start Time" on 4 South from 6 hours to 2 hours or less by August 2009.

Team Metrics
Measures
1 "MD Transfusion Order" to “Start Time"
2 LOS
Data Elements
1 Date & Time of the "MD Order"
2 Date & Time of "Transfusion Start Time"
3 Discharge Date - Admit Date = LOS
MD evaluates
Transfusion need
Blood Bank
Processes the
Blood/Blood
Product
Does patient
meet criteria?No
Informed Consent
obtained
MD Orders
Transfusion
Date/Time
Blood/Blood
Product is
transfused
Start Date/Time
Transfusion
Reaction?
Transfusion
Follow/up Testing
Is this an urgent order?
(Yes if surgical & after 10am the
day prior to surgery or if to be
given within 2 hours of the
transfuse order)
Schedule Urgent
Ward Collect by
RN/Super Tech
Schedule routine
Lab Collect
@ 5am or 11am
Transfusion Reaction
Investigation
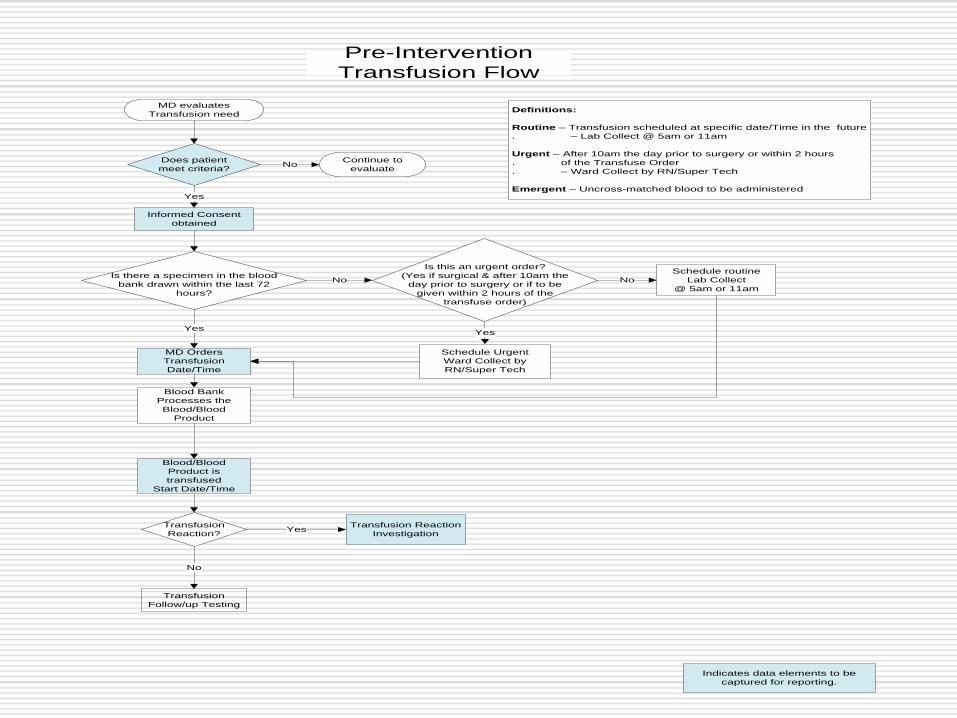
Indicates data elements to be
captured for reporting.
Pre-Intervention
Transfusion Flow
Yes
Yes
No
Yes
Continue to
evaluate
Is there a specimen in the blood
bank drawn within the last 72
hours?
No
Yes
No
Definitions:
Routine – Transfusion scheduled at specific date/Time in the future
. – Lab Collect @ 5am or 11am
Urgent – After 10am the day prior to surgery or within 2 hours
. of the Transfuse Order
. – Ward Collect by RN/Super Tech
Emergent – Uncross-matched blood to be administered

Transfusion Delays
MD Transfuse Order
to Transfusion Start
Time = <6 Hours
Procedures Policies
People
Poor Communication
MD – RN – PSA - Transporter - Lab
Delays in Drawing Blood
Lack Priority
Awareness & Setting
Delay in getting proper MD Order
Excessive hand off times
BB to Delivery
Do not meet criteria
for blood transfusion
Poorly defined Blood Admin.
Categories (Routine, Emergent)
Outdated policies that
do not reflect actual practice
Inconsistent Staffing Patterns
Inconsistent Notification
Of MAS to RN
Cause & Effect Diagram
Transfusion Delays

Restraining Forces
4South staff is patient focused & motivated →
← Poor Communication between MD / Nurse (7)
4South staff motivated to produce good patient
outcomes →
← Delays in getting blood drawn (6)
4South staff highly skilled, knowledgeable &
capable →
← Lack of priority setting (3)
4South has adequate supplies & equipment →
← Delay in getting orders (2)
Management supports valued employees →
← Excessive hand off times BB ready to delivery (2)
→
← Inconsistent MAS notifiction to RN
→
← Do not meet criteria for blood administration
→
← Poorly difined blood administration categories
(routine, Emergent)
→
← Outdated policies that do not reflect actual process
← Inconsistent staffing patterns
These forces produced average Blood administration delays of > 2 hours
Force Field Analysis Started 04/08/09Goal: To reduce the time of routine blood administration from the "MD to give" order to the
"Transfusion Start Time" on 4South from the 6 hours baseline to 2 hours or less.
Driving Forces
Blood administration delays averaging 6 hours 50 minutes

Pre-Intervention Data -The average time from MD order to
. transfusion start time is 5.86 hours
UCL 14.86
CL5.86
LCL -3.14
-6
-1
4
9
14
19
1 3 5 7 9 11 13 15 17 19 21 23 25 27 29 31 33
Tran
sfu
sio
n t
o S
tart
Tim
e I
n H
rs.
Case #
Transfusion Order to Start Time in Hours
XmR Average Transfusion Time
Data Time Frame
January – June 7, 2009
ALM - Unit 4 South

Pre-Intervention Data-The average moving range is 3.38 hours
UCL 11.05
CL 3.38
0
2
4
6
8
10
12
14
16
1 2 3 4 5 6 7 8 9 101112131415161718192021222324252627282930313233
Mo
vin
g R
an
ge
Case #
Transfusion Order to Start Time in Hours
XmR Moving Range
Data Time Frame
January – June 7, 2009
ALM - Unit 4 South

Pre-Intervention Data –There is wide variation in the data from
MD order to transfusion start time . . .
0
1
2
3
4
5
6
7
-5.6 -4.3 -3.1 -1.8 -0.6 0.7 1.9 3.2 4.4 5.7 6.9 8.2 9.4 10.7 11.9 13.2 14.4 15.7 16.9 18.2 19.4
Num
ber
Values
HistogramLSL -4.30 USL 16.10Mean 5.86
Median 5.77
Mode 5.86
Stdev 3.41Min 1.33Max 16.60Z Bench 3.21ZTarget 0.00% Defects 3.0%

Interventions
Creating expectations
Precise physician transfusion order
Setting Priorities
RN and MAS Alert List - Teaching Tool
Clarifying provider roles & responsibilities

This menu is loaded with prompts for:
- Consent
- Repeating type and screen if not within
72hrs at the top in bold.
It also gives the option for ordering blood to be
administered in 4 distinct ways:
1) Emergent, call blood bank
2) STAT, defined as the need for blood
products within 2 hours
3) ROUTINE, defined as the need for blood
products within 4 hours
4) FUTURE, defined as the need for
administration times in the… future

The appearance of the nurse transfusion text
order stays the same, but now has defined time
expectations.

Here the nursing order has STAT
and a description of what that
means (within 2 hours)

We also have the ability to order all relevant
labs at different criteria (STAT or routine)
Each pathway for blood transfusion has an
automated order set where you will be taken
through all the possible orders
The physician has the opportunity to avoid the
order set and just order what they specifically
need
And at the bottom is a link to another menu
which demonstrates current blood bank
criteria.

These are current blood bank guidelines to be used as
recommendations. Note the stipulation in bold at the top for
decisions to be made based upon clinical assessment and not
on lab values alone.

Implementation
Implementation of the NEW transfusion order occurred June 10, 2009.
Education on the NEW transfusion order occurred through: MD’s/Surgical Service - Doug McCoy Medicine Service – Drs. Tio & Singh Residents – David Dooley, MD QEB – Jay Brooks, MD CEB – Shaman Singh, MD RN’s – 4South Darla Martinelli MAS – 4South Bernadette Arredondo & Michael Weiner
Chief MAS

Type & Screen
MD Order
PSA & RN
electronically notified
of MD Order
PSA Verifies if
Specimen in BB
Begin SF18
End
No
Yes
Ward Collect?
Type & Cross
ROUTINE/HOLD/STAT
MD Order
Phlebotomist, RN, Super Tech,
MD Collects Specimen
Yes
Lab Collect
5am & 11am
Page Transporter to pick up on
nursing unit & deliver to BB
NO
SF18 clocked
into BB
BB Tech verifies SF518 &
specimen information
BB tech spins specimen
(Approximately 8 min.)
Type & Screen Processed
(Valid for 72 Hours)
Ø Accessioning
Ø Set up
Ø Resulting
Ø Pt history checked
(Approximately 45 min. if no antibodies)
Post-Intervention
Blood Administration Flow
PSA/RN verifies T&S
PSA/RN Starts NEW SF518 w/
copy of T&C MD order to Escort
Yes
Escort Picks up and Delivers
SF18 & T&C MD order to BB
SF18 & T&C MD order clocked
into BB
BB cross verifies T&S specimen
info with SF18 & T&C MD order
T&C performed
Results of T&C read
Results recorded in VISTA
Blood Product tagged w SF518
Routine Blood
Administration?
BB MT calls on
“to give” orders ONLY
Routine
w/in 4 hrs
Refer to T&S process
PSA notifies RN Blood
is ready
RN assesses schedule for
blood administration
If conditions ready for blood
administration, PSA calls escort
for priority blood pick up
No
If Type & Hold
Process ends
Stat
w/in 2 hrs
Hold
BB MT calls on Stat Blood
Administration orders
Process Ends
Escort Present MD “to give”
order to MT in BB
MT Verifies SF18, Blood
Product, Pt name & SS# with
MD order
If verification is correct, BB
issues blood product to
escort & both sign
Escort deliver blood product
to unit RN or pages RN
& RN signs off
RN verifies blood product
with 2nd
LVN, RN, MD
If verification correct,
RN hangs blood product
Process Ends

Post-Intervention Data -The average time from MD order to transfusion start time
decreased from 5.86 hours to 3.68 hours
UCL 14.86
8.46
CL 5.86
3.68
LCL -3.14 -1.10
-6.1
-1.1
3.9
8.9
13.9
18.9
1 3 5 7 9 11 13 15 17 19 21 23 25 27 29 31 33 35 37 39 41 43 45 47 49
Tra
nsf
usi
on
Ord
er
to S
tart
Tim
e
Case #
Transfusion Order to Start Time in Hrs.XmR Average Time
Data TimeframeJan - Jul 2009
Audie L. Murphy Memorial Veterans Hospital - 4 South
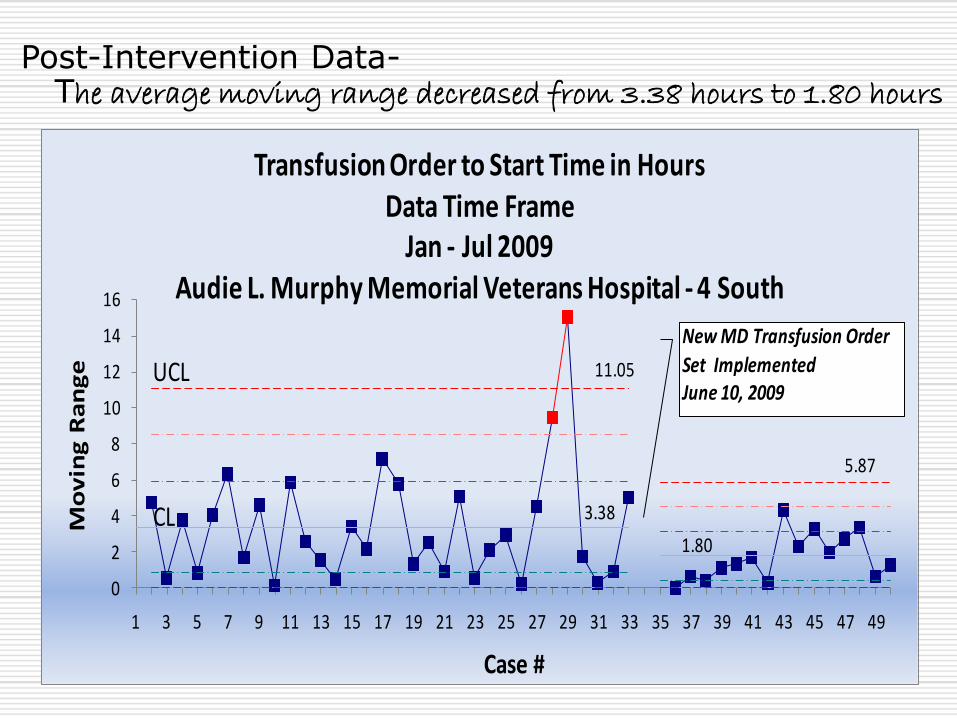
Post-Intervention Data-The average moving range decreased from 3.38 hours to 1.80 hours
UCL 11.05
5.87
CL 3.38
1.80
0
2
4
6
8
10
12
14
16
1 3 5 7 9 11 13 15 17 19 21 23 25 27 29 31 33 35 37 39 41 43 45 47 49
Mo
vin
g R
an
ge
Case #
Transfusion Order to Start Time in HoursData Time Frame
Jan - Jul 2009Audie L. Murphy Memorial Veterans Hospital - 4 South
New MD Transfusion Order
Set Implemented June 10, 2009

Post-Intervention Data –Data skews to the right due to an outlier
. at the 17 hour range
0
2
4
6
8
10
12
-5.2
1
-4.1
1
-3.0
1
-1.9
1
-0.8
1
0.29
1.39
2.49
3.59
4.69
5.79
6.89
7.99
9.09
10.1
9
11.2
9
12.3
9
13.4
9
14.5
9
15.6
9
16.7
9
17.8
9
18.9
9
Num
ber
Values
Histogram - Transfusion Order to Start Time LSL -4.10 USL 14.50Mean 5.18
Median 3.99
Mode 5.18

Post – Intervention Data The diagram suggests a direct relationship
. between transfusion time and LOS
R² = 0.8557
0
20
40
60
80
100
120
140
160
0 5 10 15 20 25 30 35 40 45 50
Y A
xis
-D
epen
den
t
X Axis - Independent
Scatter Diagram - Transfusion Time vs LOS
Transfusion Time in Hours
LOS
y=mx+b
Linear (Transfusion Time in Hours)
Linear (Transfusion Time in Hours)
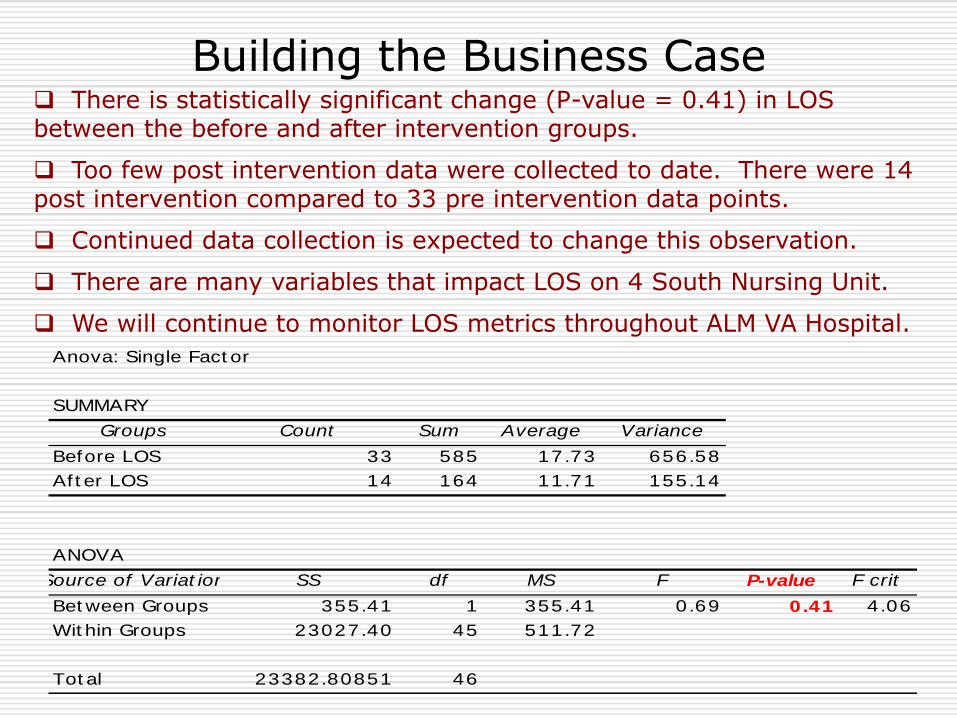
Building the Business Case There is statistically significant change (P-value = 0.41) in LOS between the before and after intervention groups.
Too few post intervention data were collected to date. There were 14 post intervention compared to 33 pre intervention data points.
Continued data collection is expected to change this observation.
There are many variables that impact LOS on 4 South Nursing Unit.
We will continue to monitor LOS metrics throughout ALM VA Hospital.
Anova: Single Fact or
SUMMARY
Groups Count Sum Average Variance
Before LOS 33 585 17.73 656.58
Af t er LOS 14 164 11.71 155.14
ANOVA
Source of Variat ion SS df MS F P-value F crit
Bet ween Groups 355.41 1 355.41 0.69 0.41 4.06
Wit hin Groups 23027.40 45 511.72
Tot al 23382.80851 46

Building the Business Case
Differences in cost per case cannot be directly attributable to new transfusion physician order set.
Too few post intervention values were collected to date. There were 14 post intervention compared to 33 pre intervention data points. Continued data collection may change this observation.
There are many variables that impact LOS on 4 South Nursing Unit.
We will continue to measure cost per case metrics for impact.
Patient Population AVLOS Cost / Day Cost / Case
Before Intervention 17.7 $1,706 $30,196
After Intervention 11.7 $1,706 $19,960
$10,236Cost Difference

Lessons Learned
A “good” physician order is key to creating nursing expectations
and follow through.
We eliminated arbitrary verbal turnaround times and instead based transfusion on physician clinical assessment coupled with blood bank guidelines.
We focused on our desire to improve and put aside prior performance & prejudice.
We created a safe environment of trust in which to make mistakes and to learn how to make improvements.
We broke down barriers between departments and created the expectation of multi-disciplinary team effort.
The new clearly defined process will be reflected in the revised
Blood Administration Policy.

Sustain Best Practice
4 South data will be reported to the Blood Use Committee on a routine basis.
The data will also be placed on the 4 South PI Dashboard to provide feedback to staff on their performance.
We are beginning to spread this best practice to 6B and will eventually cover all nursing units with reporting to Blood Use Committee and Nursing PI Dashboards.

Sustain Best Practice
This team submitted an abstract to the VHA Improvement Forum in July 2009.
This team submitted an abstract for presentation in October, 2009 to the Center for Safety Effectiveness.
An abstract will be submitted to the IHI poster presentation for December 2009.
We expect to publish and are looking for the proper opportunity to make this happen.

Point of Contact
Amir Ehsan, MD - Champion
Jay Brooks, MD – Team Leader
Director, Blood Bank Services
Yolanda Garza & Michael Noriega - Co-Team Leaders
Blood Bank Supervisors
Edna Cruz, RN, MS, CPHQ - Facilitator
QM Clinician – Performance Improvement Clinician
1-210-260-1686
Diane Woomer, RN, MSN,- Co-Facilitator
QM Clinician – Medicine
1-210-364-8154