Evaluation of Drug treatment and rehabilitation programs in Grenada

Performance Indicators for Rehabilitation Programs Page 1 of 95
Performance Indicators for
Rehabilitation Programs Version 1.1
August 1998
Working Paper for Comment
Prepared by:
Deborah Wilkerson Di Shen
Melissa Duhaime
Research and Quality Improvement Division
© 1998 CARF…The Rehabilitation Accreditation Commission
4891 E. Grant Rd. Tucson, Arizona 85712
520.325.1044

Performance Indicators for Rehabilitation Programs Page 2 of 95
Table of Contents Acknowledgments
Preface
Chapter 1 Introduction: Background on Performance
Indicators
Chapter 2 Environmental Scan
Chapter 3 Building Rehabilitation Performance Indicators
Chapter 4 Candidate Performance Indicators in Behavioral Health
Chapter 5 Candidate Performance Indicators in
Employment and Community Services
Chapter 6 Candidate Performance Indicators in Medical Rehabilitation
Chapter 7 Conclusion: Themes and Next Steps
Appendix
Glossary of Terms
Selected Bibliography
Request for Feedback

Performance Indicators for Rehabilitation Programs Page 3 of 95
Tables & Figures Figure 1 - Target Actions Figure 2 - Quality & Accountability Initiative Figure 3 - Levels of Analysis Figure 4 - Domains of Interest
Table 3a - Conceptual Framework – Terms for CARF Performance Indicators Version 1.1
Table 3b – Terminology Related to CARF Performance Indicators
Table 3c - Performance Indicators Project Terminology: Who uses what? Table 3d - Criteria for Performance Indicators
Table 4a - Candidate Behavioral Health Performance Indicators
Table 4b - CARF Performance Indicators / Behavioral Health
Table 5a – Candidate Performance Indicators for Employment and Community Services
Table 5b – CARF Performance Indicators / Employment and Community Services Table 6a – Candidate Medical Rehabilitation Performance Indicators
Table 6b - CARF Performance Indicators / Medical Rehabilitation

Performance Indicators for Rehabilitation Programs Page 4 of 95
Acknowledgments
Many people contributed to the thinking behind this monograph. The participants in the 1997 invitational Working Conference on Performance Indicators were instrumental in clarifying the concepts and detailing the key indicators that are the raw material for this project. The Performance Indicators Advisory Council was first convened in July 1998. This group was asked to refine the work to date, and advise CARF on the directions the project should take. We greatly appreciate the time, creativity, and collaboration of these expert participants in our effort. Thanks to all those participants listed beginning on the following page.
The 1997 working conference was supported in part by two very important organizations. First, UNUM Life Insurance Company of America, the nation’s leading provider of group long-term disability insurance and retirement products, made a generous grant to support the conference. We thank Patricia M. Owens, President of the Integrated Disability Management division of UNUM and member of the CARF Board of Trustees, for making this happen. Paralyzed Veterans of America (PVA) also provided support, thanks to the efforts of Fred Cowell, staff director for the Department of Health Policy at PVA and member of the CARF Board of Trustees.
The CARF Board of Trustees—representative of several dozen rehabilitation stakeholder organizations—has been very attentive to this project and, as noted in the monograph, has endorsed a high priority for CARF’s development of performance indicators. We greatly appreciate their support.
Four CARF national directors facilitated the discussions of the Working Conference in division-based groups, and did a marvelous job of ensuring that the diverse and creative efforts of the participants resulted in a coherent set of recommendations. This work could not have materialized without the skills of Paul Andrew and Dale Dutton, national directors in Employment and Community Services; Tim Slaven, and Nikki Migas, national directors in Behavioral Health; and Chris MacDonell, national director for Medical Rehabilitation. Ensuring that the discussions were recorded for presentation to the participants in the conference were four tireless individuals who structured the discussions into Powerpoint displays: Barbara Altman, Vice President; Linda Nausin, Executive Assistant to the President/CEO; Ginny

Performance Indicators for Rehabilitation Programs Page 5 of 95
Peterson, Division Coordinator, ECS; and Kathy Lauerman, Director of Operations for Medical Rehabilitation.
Of course none of this would have been conceptualized or made possible without the extraordinary vision of Donald E. Galvin, Ph.D., President and CEO of CARF, without whose support and mentoring we would be nowhere with this project.
What a team!

Performance Indicators for Rehabilitation Programs Page 6 of 95
CARF Rehabilitation Performance Indicators Working Conference Participants July 24-25, 1997 Fred Altaffer, Ph.D. Director of Research MENTOR Boston, MA
James W. Baxter, Ph.D. Senior Manager Hennepin County Care Management Initiative for People with Disabilities Minneapolis, MN
Rick Berkobien, MSW Assistant Director Department of Research Programs & Services The Arc of the US Arlington, TX
James W. Blume President Developmental Services of Northwest Kansas, Inc. Hays, KS
Brian J. Boon, Ph.D. Vice President Claimant & Health Care Services Worker’s Compensation Board – Alberta Edmonton, AB CANADA
Ruth Brannon Director Washington Business Group on Health Washington, DC
David Brown Survey & Analysis Division CMHS Rockville, MD
Bonnie-Jean Brooks, B.Sw. Executive Director/President OHI/ANCOR Hermon, ME
Connie Burgess, M.S., RN President Connie Burgess & Associates Lakewood, CA
Thomas J. Buckley Executive Director Upper Pinellas Association for Retarded Citizens, Inc. Clearwater, FL
John Carswell Associate Executive Director for Health Policy Paralyzed Veterans of America Washington, DC
Anthony Campanell Department of Veterans Affairs Washington, DC

Performance Indicators for Rehabilitation Programs Page 7 of 95
Carrie Craven UNUM San Diego, CA
Larry Cervelli, B.S. Vice President, Provider Development Paradigm Health Corporation Northampton, MA
Nathan Cope, M.D. Chief Medical Officer Senior Vice President, Medical Affairs Paradigm Health Corporation Concord, CA
Fred Cowell Staff Director Department of Health Policy Paralyzed Veterans of America Washington, DC
Willis Goldbeck Institute for Alternative Futures La Jolla, CA
Shirley A. Girouard, Ph.D., RN, FAAN Vice President, Child Health & Financing National Association of Children’s Hospitals & Related Institutions Alexandria, VA
Byron Hamilton, M.D., Ph.D. Raleigh, NC
Rochelle Habeck, Ph.D., CRC Professor Michigan State University East Lansing, MI
Christopher Hagen, Ph.D. Director, Outpatient Neuro Rehab Program San Diego Rehabilitation Institute Encinitas, CA
Karyl Hall, Ed.D. Director of Rehab Research Santa Clara Valley Medical Center San Jose, CA
Catherine V. Hayes, M.A. Senior Program Analyst - ICF/MR Health Care Finance Administration Baltimore, MD
Robert B. Harvey, Ph.D. Executive Director Independence Center Saint Louis, MO
Allen Heinemann, Ph.D. Rehabilitation Institute of Chicago Chicago, IL
Michael Jones, Ph.D. Director, Crawford Research Institute Shepherd Center Atlanta, GA
Mark Johnston, Ph.D. Director, Outcome Research Kessler Institute of Rehabilitation East Orange, NJ
Harold Kay, Jr., Ed.D. Director of Evaluation Rehabilitation Services Administration/OSERS U.S. Department of Education Washington, DC

Performance Indicators for Rehabilitation Programs Page 8 of 95
Barbara Keir, B.Sc., PT Director, Worker’s Rehabilitation Centre Safety & Compensation Commission St. John, NB CANADA
Teresa Kramer, Ph.D. Director of Research Center for Outcomes Research & Effectiveness Little Rock, AR
Cille Kennedy, Ph.D. Assistant Director for Disability Research/DESRNational Institute of Mental Health Rockville, MD
Rick Lee VA Medical Center Hampton, VA
Susan Lucht Rehabilitation Planning Specialist Physical Medicine & Rehabilitation VA Headquarters Memphis, TN
Charles McGeough, M.S. CWT Marketing Director VA Medical Center Dallas, TX
David MacDonald Director of Operations Columbia Rehabilitation Centre - Calgary Calgary, AB CANADA
Fredrick Menz, Ph.D. Associate Director Research & Training Center University of Wisconsin - Stout Menomonie, WI
John D. McPeake, Ph.D., CAS President The Dublin Group: Behavioral Consultants, Inc. Dublin, NH
Bryce Miller National Alliance for the Mentally Ill Topeka, KS
John A. Morris, M.S.W. Professor & Director of Interdisciplinary Affairs Department of Neuropsychiatry USC School of Medicine Columbia, SC
Donald Naranjo, Ph.D., RPRP Synergetic Systems Management LLC Albuquerque, NM
Deborah C. Nelson, Ph.D. Vice President Beacon Health Strategies, LLC Boston, MA

Performance Indicators for Rehabilitation Programs Page 9 of 95
Jan Nestler National Council on Aging National Adult Day Services Association Washington, DC
Bill Niederloh Chief Executive Officer National Results Council St. Paul, MN
John J. Niederman President Pathfinder Services, Inc. Huntington, IN
Richard P. Oestreich, Ph.D., CRC Director, Services & Product Development Goodwill Industries International Bethesda, MD
Michael J. O’Malley Coordinator Substance Abuse & Vocational Rehabilitation U.S. Department of Veteran’s Affairs White City, OR
Gloria H. Polk, M.A., CCP-SLP Special Projects Coordinator American Speech, Language, & Hearing Association Detroit, MI
Mary Reitter, M.S. Vice President Brain Injury Association, Inc. Washington, DC
Neil Ridley National Center on Education & the Economy Washington, DC
Jacqueline Rodrigue, M.S.W. Program Analyst HSRA/Bureau of Health Professions Division of Quality Assurance Rockville, MD
Sally Rogers Research Director Center for Psychiatric Rehabilitation Boston University Boston, MA
Rhonda Runkle, M.A. Assistant Director Employment & Training Services Goodwill Industries International, Inc. Bethesda, MD
Joseph A. Skiba Eagle, MI
Gary Smith, AB Director for Special Projects National Association of State Directors of Developmental Disabilities Services Littleton, CO
Robert P. Smith Executive Director Platte River Industries, Inc. Denver, CO

Performance Indicators for Rehabilitation Programs Page 10 of 95
Susan Stoddard, Ph.D. President InfoUse Berkeley, CA
Greg Thomsen, Ed.D., FACHE Vice President Covenant Health System Knoxville, TN
Tom Trabin, Ph.D., MSM Vice President Informatics & Outcomes Initiatives, CentraLink Tiburon, CA
Robin Turpin, Ph.D. Associate Director Merck - RIC West Point, PA
Kenneth D. Wells, M.D. Corporate Medical Director Tenneco, Inc. Houston, TX
Gale Whiteneck Research Director Craig Hospital Englewood, CO
Michael Wirth-Davis President & Chief Executive Officer Goodwill Industries, Inc. Easter Seal Society of Minnesota Saint Paul, MN
Christine Woods Program Specialist for Psychosocial Rehab Department of Veterans Affairs Hampton, VA
Mary Zubeck, M.S. Assistant Vice President Vocational & Adult Services National Easter Seal Society Chicago, IL

Performance Indicators for Rehabilitation Programs Page 11 of 95
CARF Rehabilitation Performance Indicators Advisory Council Participants July 20 - 21, 1998 Neal Adams, M.D. Medical Director Santa Cruz County Mental Health Santa Cruz, CA
Leigh C. Anderson, M.D.* Chief Physical Medicine & Rehab Services Veterans Affairs Medical Center Denver, CO
Amy Armstrong (representing Paul Wehman) Virginia Commonwealth University Rehabilitation Research Training Center Richmond, VA
James W. Baxter, Ph.D. Senior Manager Hennepin County Care Management Initiative for People with Disabilities Minneapolis, MN
Douglas Bigelow, Ph.D. Department of Psychiatry Oregon Health Science University Portland, OR
Brian J. Boon, Ph.D. Vice President Claimant & Health Care Services Worker's Compensation Board - Alberta Edmonton, AB CANADA
Valerie Bradley, Ph.D.* President Human Services Research Institute Cambridge, MA
David Brown (representing Ronald Manderscheid) Survey & Analysis Division CMHS Rockville, MD
Nancy Brundy Director of Aging Health Services Goldman Institute on Aging San Francisco, CA
John Carswell Associate Executive Director for Health Policy Paralyzed Veterans of America Washington, DC
Lewis C. Chartock, Ph.D. President Metropolitan Employment & Rehabilitation Services St. Louis, MO
Elizabeth Edgar* NAMI Director of State Health Care National Alliance for the Mentally Ill Arlington, VA

Performance Indicators for Rehabilitation Programs Page 12 of 95
Celia S. Feinstein, Director* Exemplary Services & Technical Assistance Institute on Disabilities Temple University Philadelphia, PA
Bruce Flynn Director for Disability Management Washington Business Group on Health Washington, DC
Shirley A. Girouard, Ph.D., R.N., FAAN Vice President, Child Health & Finance National Association of Children’s Hospitals & Related Institutions Alexandria, VA
Laura Lee Hall, Ph.D.* Director of Research National Alliance of the Mentally Ill Arlington, VA
Byron Hamilton, M.D., Ph.D. Consultant Raleigh, NC
Allen Heinemann, Ph.D. Professor, PM&R Northwestern University Associate Director, Research Rehabilitation Institute of Chicago Chicago, IL
Cille Kennedy, Ph.D. Assistant Director for Disability Research/DESR National Institute of Mental Health Rockville, MD
William Kiernan, Ph.D.* Project Director Institute for Community Inclusion Children's Hospital Boston, MA
Jerod M. Loeb, Ph.D. Director, Research & Evaluation Chief Scientific Officer JCAHO Oakbrook Terrace, IL
David MacDonald Director of Operations Columbia Rehabilitation Centre - Calgary Calgary, AB CANADA
Ronald W. Manderscheid, Ph.D.* Chief Survey & Analysis Division, CMHS Rockville, MD
Fredrick Menz, Ph.D. Associate Director Research & Training Center University of Wisconsin - Stout Menomonie, WI
John A. Morris, M.S.W. Professor & Director of Interdisciplinary Affairs Department of Neuropsychiatry USC School of Medicine Columbia, SC
Donald R. Naranjo, Ph.D., RPRP Synergetic Systems Management LLC Albuquerque, NM

Performance Indicators for Rehabilitation Programs Page 13 of 95
Richard Oestreich, Ph.D., CRC Consultant Chillicothe, OH
Patricia M. Owens* President, Integrated Disability Management A Division of UNUM America Brooklyn, NY
David S. Salkever, Ph.D.* Professor, Department of Health Policy & Mgmt Johns Hopkins School of Hygiene & Public HealthBaltimore, MD
Max Schneier, J.D. (representing Ronald Manderscheid) Rawdon, Quebec CANADA
Joseph A. Skiba* Consultant Eagle, MI
Gary Smethers, M.D.* Medical Director Blue Cross Blue Shield Arizona Phoenix, AZ
Glenn A. Stanton* Director, Division of Quality Management & Service Innovation Mental Health & Substance Abuse Services Lansing, MI
Susan Stoddard, Ph.D. President InfoUse Berkeley, CA
Tom Trabin, Ph.D., M.S.M. Vice President Informatics & Outcomes Initiatives, CentraLink Tiburon, CA
Laura Van Tosh Consultant Silver Spring, MD
Paul Wehman* RRTC Director & Professor of Rehab Medicine Virginia Commonwealth University Rehabilitation Research Training Center Richmond, VA
* Council participants unable to attend the meeting

Performance Indicators for Rehabilitation Programs Page 14 of 95
Preface This monograph is presented to the constituents and stakeholders of CARF as a working document and as a beginning for gathering broad input from the field. It is about the identification, selection and development of key indicators of rehabilitation program performance. Our interest crosses the branches of service represented by all four of CARF’s divisions: Behavioral Health, Employment and Community Services, Medical Rehabilitation, and Adult Day Services, though the last division (ADS) is newly formed and thus was not involved in the work that produced this monograph. There are definite themes and common information needs for consumers of all three arenas presented here. At the same time, we recognize that each division represents a different flavor, or texture in the fabric of services whose goal it is to enhance the activities and participation of people served. Therefore, this monograph contains both CARF-wide and division-specific discussions. We encourage the reader at least to scan the work of the three division-specific chapters; there are common traits as well as differences and we have much to learn from each other.
This report presents work of the creative and energetic participants in CARF’s Working Conference on Performance Indicators held in Tucson in July, 1997, and participants in the Performance Indicators Advisory Council convened in Tucson in July, 1998, as listed in Acknowledgments. It also constitutes the first draft document in a project under development.
We hope that the reader of this document will feel free to comment and provide constructive critique for CARF as we move into the heavily populated territory of defining performance indicators. For CARF, as an accrediting body we believe we have both the opportunity and the responsibility to help move the field forward in defining and measuring quality services. We have also heard from our customers that this work would provide a valued service to the field. We need your assistance to keep the effort moving in a direction that may lead, but also challenge, the field in providing ever higher quality to people who can benefit from our services. The reader is therefore encouraged to review the contents with a critical eye, and to communicate to CARF and others in the field your reactions, suggestions, and questions so that the process may move forward. To that end, we have included in this monograph a comment form for use in submitting comments on specific indicators.

Performance Indicators for Rehabilitation Programs Page 15 of 95
It is in this spirit that we present in this working monograph a set of candidate performance quality indicators for rehabilitation programs and services.

Performance Indicators for Rehabilitation Programs Page 16 of 95
Chapter 1 Background on Performance Indicators The Need for Rehabilitation Performance Quality Indicators
Rehabilitation programs are facing a renewed era of accountability. Pressures come from consumers of services and payers alike to demonstrate the value of services provided, i.e., that the highest quality product is achieved at the lowest possible cost. It is this value equation—more than either cost or outcome alone—which constitutes the new accountability.
The field of constituents interested in the demonstration of value has also grown. Providers need to know that they can provide quality services at a competitive price; they also need to know where they stand as compared with their past performance and with their peers or competition. Purchasers and sponsors of services seek to lower costs but are pressured by their consumers to ensure that quality is maintained. Consumers themselves—persons served by rehabilitation programs and services—are becoming more vigilant about the kinds of services they receive, especially as the effects of cost-lowering managed reimbursement strategies come to light. Those who purchase and use rehabilitation services have a right to an informed choice, just as they do with other products and services.
It follows, then, that common information is needed by consumers to shop for and compare the quality and performance of rehabilitation programs. Accreditation can provide evidence to stakeholders that certain national standards are met, that certain structures are in place to facilitate the delivery of quality services, that processes are followed which are known or thought by expert consensus to facilitate good outcomes and consumer satisfaction, and in some cases, that the results of care are on par with those expected in the field. However, accreditation as an assurance of quality is limited unless hard data are available in a uniform manner. It is the need for this next level of information that has driven the accreditation world to address the definitions, specifications, and even compilation of data on organizational performance.

Performance Indicators for Rehabilitation Programs Page 17 of 95
Much work has been done on the topic of performance indicators by a number of organizations including government agencies, research institutions and other accrediting bodies. Yet the most visible of the efforts do not direct their work specifically toward rehabilitation services. Leaders from whom CARF has sought advice and reflection about new outcome-oriented directions have told us clearly that we should be assisting the field to identify key performance indicators; that we should facilitate the dialogue and consensus-building in the rehabilitation field; that we should communicate to the field those findings and specifications for performance indicators that respond to stakeholders’ needs; and that we should begin the challenging consideration of how to include outcome and performance information in the accreditation process. Our advisors have also told us we should help sort out some of the overlap and parallel evolution in indicator work, not contribute "yet another different scheme" to the situation. It is with this input in mind that CARF has embarked on the rehabilitation performance indicators project.

Performance Indicators for Rehabilitation Programs Page 18 of 95
Historical Perspective and Context-- CARF’s Quality and Accountability Initiative
In CARF’s Strategic Plan for 1995-97 the Board of Trustees first approved a new initiative captured in Goal I of the Plan. That initiative had at its core the goal of enhancing the value of accreditation, but embodied several more specific objectives—to conduct a program of accreditation research and to enhance attention to outcomes measurement and management. To those ends, a new Division was established at CARF—Research and Quality Improvement—and given the charge to coordinate this new effort.
The Initiative addresses major forces prevalent in health and human services in the United States as of the late 1990’s.
• Consumer Rights. We are all consumers of products and services, and we all expect to be safe, to be respected as the purchaser, and to receive goods and services that do what they advertise. The consumer is "king" and people expect that providers will systematically determine and respond to consumer needs.
• Quality Improvement Philosophy. Total quality management and related movements which began in manufacturing and business, has been widely applied to health and human services, as well as to the government. The concept of an acceptable threshold of quality has been replaced by expectations of continuously improving performance.
• Information Age Technology. With the explosion of technology and vast amounts of information available, people expect that reasonable technology (computer hardware and software particularly) will be used where appropriate by service provider businesses. They also expect to be able to quickly access large amounts of information.
Figure 1 displays three facets of CARF’s Quality and Accountability Initiative: our own internal quality improvement efforts aimed at the accreditation products themselves (including the standards-setting and accreditation survey processes); enhanced information for consumers of accreditation information; and continued attention to the quality of services provided to persons in need of rehabilitation.

Performance Indicators for Rehabilitation Programs Page 19 of 95
Figure 1.
Three Target Actions for CARF’s Quality and Accountability Initiative
In the two years since its inception, the Quality and Accountability Initiative has evolved into a coordinated set of projects aimed at the original goals of the initiative. Figure 2 illustrates the specific projects that have emerged to address the three target areas. A major portion of this evolution and definition can be attributed to the input CARF has obtained from our constituents…accredited organizations, surveyors, payers and sponsors of rehabilitation services, government agencies, researchers, and policy makers. In 1996 we held three National Leadership Panels (NLPs) on outcomes to begin forming the charge. Each panel was constituted of experts in each of three divisions of CARF, and represented an assortment of stakeholders. While each of the divisions presents a different "flavor" based on the particular characteristics and current status of program performance assessment in the field, there were definite themes from the three NLPs.
The panels concluded that:
CARF must take a strong public stand on outcomes. We must be an accountability advocate and a resource to the field. We should provide more direction in our outcomes standards.
CARF should use information gathered from the field on application forms and through the survey process to help describe the rehabilitation industry itself and assist with continued quality improvements.

Performance Indicators for Rehabilitation Programs Page 20 of 95
CARF should consider a quantitative rating system for standards to help identify exemplary practice and recognize excellence.
CARF should assist the field to identify a core set of performance indicators.
CARF should move, but cautiously and in partnership with consumers, providers, purchasers and other stakeholders, to enhance the availability of public information about program quality.
Figure 2.
Projects and Activities of the Quality and Accountability Initiative
These themes formed the foundation of the Quality and Accountability Initiative, and were especially important to the Strategic Outcomes Initiative that is part of the broader effort. (The Appendix includes the vision statement developed for the Strategic Outcomes Initiative in 1996.) The recommendation that CARF assist in identifying a core set of performance indicators was the genesis of this project.
Another motivation for the performance indicators project lies in CARF’s position as advocate for quality and value in rehabilitation services for consumers. We believe that managed care and other purchasers of rehabilitation services, while certainly keenly focused on price of services, will eventually turn to purchasing services on the basis of value, or quality and price. The rehabilitation field should take the initiative to provide

Performance Indicators for Rehabilitation Programs Page 21 of 95
consumers and payers with information on the quality and outcomes of their services in order to encourage purchase on the basis of quality; if rehabilitation stakeholders themselves do not come forth with objective information on value, the focus will remain on price alone. CARF is being proactive and taking a leadership role in prompting and preparing the field to take this initiative.
Mission and Goals of the Performance Indicators Initiative The mission of CARF’s Performance Indicators project, as part of our Strategic Outcomes Initiative, is to ensure that consumers of rehabilitation services, their advocates, and sponsors, have consistent, valid, and reliable information available to them upon which to judge the likely quality of programs and choose services that match their needs.
It is our vision that key performance indicators will be considered in the CARF standards-setting process, and that ultimately the review of program conformance with CARF standards will include attention to these indicators.
Our specific goals in conducting this project are: to develop a cohesive conceptual framework for disability and rehabilitation related performance indicators; to identify a limited set of quantifiable performance indicators about which there is reasonable consensus among stakeholders in the rehabilitation process; to publish documents and provide educational opportunities to inform rehabilitation stakeholders of the indicators; and to meld the use of performance indicators with the standards-setting and accreditation processes.
It should be clear to the reader that the identification of performance indicators using common, valid, and reliable measures and data elements and useful reporting techniques is an evolving effort. We do not present this work as a final product, but as a beginning. Understanding that there are technical, political, and practical challenges, we suggest only that interested stakeholders "START HERE." We expect that the broad input CARF is accustomed to gathering and using will serve only to improve this product and move the performance indicators effort along.

Performance Indicators for Rehabilitation Programs Page 22 of 95
Chapter 2 Environmental Scan
CARF is not embarking upon this project in a vacuum. Other organizations responding to the same forces and input from the field have initiated inquiries into or development of indicator sets. There has been an evolution of data set definitions and establishment of pooled data systems which can provide both definitions for measures and data elements and benchmarks for performance. Yet the evolution of these systems and present state of the art in development of performance indicators is somewhat different in the three arenas of CARF involved in this project to date.
We have provided with this report a selected bibliography of works and references to indicator efforts with which we are familiar. This is not intended to be an exhaustive list, but will give the reader some idea of the level of activity in performance indicators in each division. Two other accrediting organizations, Joint Commission on the Accreditation of Health Care Organizations (JCAHO) and National Committee on Quality Assurance (NCQA) have well-established indicator efforts that relate to medical and health care, and include to some extent the behavioral health arena. The American College of Mental Health Administrators (ACMHA) has spearheaded an effort to identify indicators for behavioral health programs. The requirements for reporting performance indicator data for employment and community services seem to reside with the governmental and private sponsors of those services, e.g., state agencies, federal agencies, and national not-for-profit organizations.
In this section we provide a sketch of each of the CARF divisions’ arenas to define their particular flavor with respect to quantitative indicators of performance. While there are several quite visible efforts and some outstanding documents available through the literature, there are also less visible state-level efforts that may not have come to our attention. We are certain that this is a changing landscape and that input from the project’s Advisory Council, our constituents in the field, and our own expanding knowledge will augment or even materially change our view. This is a beginning point; we offer it in this document in order to share our

Performance Indicators for Rehabilitation Programs Page 23 of 95
background work with the reader and to solicit information about other efforts about which we should be aware. Also, since CARF is a single organization that addresses four similar but distinct areas of rehabilitation, we must constantly consider where a uniform policy is appropriate, and where we must maintain the diversity in these fields. A comparative environmental scan then can help us strike that balance.
Behavioral Health In some ways, the behavioral health arena is ahead of both medical rehabilitation and employment and community services in the development of performance indicators. Behavioral health services have been under enormous scrutiny from managed care and other insurers, employers, and policy makers as consumers have demanded parity for mental health services with other aspects of health care. Thus, demonstrating and communicating performance has become a matter of survival for behavioral health providers in a very short time.
There are well-developed conceptual frameworks and indicator sets in behavioral health care developed by an array of governmental, payer, and trade groups (e.g. MHSIP, PERMS, University of Arkansas and ACMHA). Compared to acute medical areas such as cardiac disease, diabetes, childhood immunization, breast cancer, and other big-ticket diagnoses and issues, accrediting organizations have been slow to include behavioral health among their indicator sets. This is changing, however, with the addition of indicators and measures in NCQA’s HEDIS, for example. In addition, data management systems for behavioral health are growing in number, if their presence at national meeting exhibits is an indication.
The behavioral health field is also well populated with people trained in quantitative measurement. Scales for diagnosis and outcome assessment are quite prevalent in the field, and the providers for the most part understand well issues related to measuring qualities that may at first seem elusive. This too may help explain the readiness and even enthusiasm for performance indicators and the sharing of information with the public that is apparent in the behavioral health constituents with whom CARF interacts. Though this represents the newest area for CARF accreditation, it is also the fastest

Performance Indicators for Rehabilitation Programs Page 24 of 95
growing, and the fastest moving in terms of preparation for using performance indicators.

Performance Indicators for Rehabilitation Programs Page 25 of 95
Employment and Community Services The ECS-related field is perhaps the most recent player in the field of performance indicators. Employment and community service programs, particularly those oriented to independent living services and supports for persons with developmental disabilities, have typically expressed the most focus on individual outcomes, independent living philosophy and concepts. There is less experience with pooled data systems; at least commercial data management services are far less prevalent in ECS-related programs than for medical rehabilitation or behavioral health.
State and federal agencies, as well as the CARF standards, have for many years conducted or required program evaluations of employment and community services and related programs. However, the standards place greater emphasis on individual, consumer-defined outcomes and less on uniformity of data gathering. These efforts are entirely valid and critically important but they stop short of generating the kind of uniform data definitions that are needed for broadly used performance indicators.
Performance indicator projects underway which seek to develop consensus for the identification of key indicators and are soliciting broad input from the field, e.g., Human Services Research Institute (HSRI) project. As with the other two arenas, CARF is making efforts to dovetail its work with that of other projects including those mentioned here.
Finally, because many of the community-based programs are small and minimally funded, quantitative measurement approaches and data base management systems are more difficult to come by. Commercially available pooled data systems have been slower to develop in employment and community services than in either medical rehabilitation or behavioral health. However, we believe that with increasing availability of inexpensive and easy-to-use computer technology this is changing. Thus identifying performance indicators in the ECS arena presents a very interesting set of challenges: how to maintain their important emphasis on consumer-direction and individual outcome-orientation and at the same time to develop cost-effective and feasible quantitative systems for aggregate data use in small community-based programs.

Performance Indicators for Rehabilitation Programs Page 26 of 95
Medical Rehabilitation Providers in medical rehabilitation—especially traditional inpatient hospital-based programs—have decades of experience with program evaluation, functional status and outcome measurement, and pooled data collection for benchmarking and comparison purposes. Somewhat like the behavioral health arena, medical rehabilitation has had to demonstrate its worth among medical disciplines and as a provider of services. The curve of evolution in measurement, data systems, and indicator development is more shallow, however. The now well-established services of medical rehabilitation appear less often debated as a viable service, but the setting, intensity, and cost of care are hotly debated and changing rapidly in today’s health care environment.
The pooled data systems that have been developed offer quasi-indicator sets in that data elements have been well-defined and are in widespread use, but these systems were designed primarily for internal use by providers and are not necessarily geared to external reporting, especially to consumers. Moreover, because they have been primarily for internal use, there are many protections for the privacy of the provider. In short, the medical rehabilitation field has very solid resources ready for use in performance indicator systems, but agreement on specific detailing of an indicator set has not gelled as yet.
Finally, while JCAHO and NCQA are more oriented to the medical arena than to behavioral health or certainly to employment and community services, their work on indicators (e.g., HEDIS; NLHI) has not yet explicitly addressed, except to a very limited degree, performance of rehabilitation services or programs for persons with chronic conditions and functional limitations. Similarly, the Foundation for Accountability (FAACT) and the Medical Outcomes Trust (MOT) are both major resources in promoting and making available sound measures for health care outcomes in general, but do not specifically target rehabilitation program.
Adult Day Services The newest CARF division, Adult Day Services (ADS), is just now in the midst of preparing its first standards manual, which will not go into effect

Performance Indicators for Rehabilitation Programs Page 27 of 95
until July 1999. Outcomes and performance data for these programs will be a definite challenge to design and implement even on a program-by-program basis. This arena may well move very quickly into the concept of performance indicators, and may in fact have an easier time reaching some consensus on key indicators for consumer use precisely because there is an opportunity to do so in concert with developing measurement and data management systems. However, we will defer the identification of indicators for the CARF project at least until the next version, after our accreditation program has begun to take shape. We will, however, include representatives of the ADS field in all CARF’s performance indicators project deliberations.
An Approach for CARF Recognizing that the particular needs of each arena represented by CARF divisions must be met, we nonetheless hope to identify indicator sets that fit into the conceptual framework we have adopted, and which follow a consistent format for concern and indicator statements. We also intend for the indicator sets that emerge from this effort to adhere to the mission, vision, values, and purposes of CARF, and to promote quality services for persons in need of rehabilitation. As the project moves forward, we will be alert to the possibility that common indicators across these arenas may emerge.
Even as we move toward more quantitative and scientifically based tools in the Quality and Accountability Initiative, we are determined to be true to both the mission and spirit of CARF. This means a continued focus on the persons served, advocacy for maximum independence and participation for persons of all abilities, promoting quality rehabilitation services, and a consultative approach to the accreditation survey process. In the pages that follow, we discuss some of the conceptual underpinnings for our performance indicators effort, and outline the definitions of terms and concepts key to defining a useful indicator set.
Performance Indicators for Rehabilitation Programs Page 28 of 95
Chapter 3 Building Rehabilitation Performance Indicators Goals of Performance Indicators
Identifying a limited number of performance indicators would serve to:
• Help define more precisely key desired outcomes of rehabilitation. • Communicate to the field, using a common metric, those key
indicators important to rehabilitation consumers, payers, managed care organizations, other accrediting bodies, and policy makers.
• Enable providers to prepare their outcomes data and information systems over a period of time to respond to these key indicators.
• Provide a template for the provider to report where they choose to disclose their own outcomes and performance.
• Enable "apple-to-apple" comparisons by consumers and other stakeholders seeking rehabilitation providers.
• Create the potential for benchmarking from pooled data on the key indicators.
CARF, as an accrediting body, is acting as a facilitator of the dialogue and consensus building in the arena of rehabilitation performance indicators. We acknowledge that there are many investigators interested in this issue, and a number of ongoing projects addressing the development of outcomes measures, and in identification of key aspects of process of importance to consumers and payers. It is our intention to glean input from as many of these projects and individuals as we can identify and publicize the consensus we can identify through the platform of CARF.

Performance Indicators for Rehabilitation Programs Page 29 of 95
Defining Values and Concerns: How to Deal with Differing Stakeholders’ Views The ultimate users of information about program performance are those who will be using the services of the rehabilitation programs themselves—persons served (whether adults, adolescents or children) and their families, agencies, insurance company representatives, managed care organizations, and referring service providers (whether clinicians, social service or state agency personnel, case managers, educators, and others). Thus, performance indicators identified should reflect information of value to all these stakeholders in the rehabilitation service delivery system.
However, each of these constituents may be interested in different aspects of program performance, and their interests may at times be at odds with those of other stakeholders. For example, an employer may want for an employee to return to work after an injury or illness, yet disincentive structures may motivate a person served to remain out of the workplace. In this case, the desired outcome—at least on the surface—is exactly opposite for the two parties. The very choice of key indicators—for example, return-to-work rate—reflects a certain value system (e.g., return to work is desirable) that may not in fact reflect the values of all stakeholders in the rehabilitation outcome. We acknowledge this dilemma and recognize that no set of indicators can be value-neutral; to the contrary, any indicator set should reflect a definitive set of values.
There is also an issue of fairness and equity to providers whose quality and performance will be assessed using a set of indicators, while at the same time they must deal with sometimes conflicting motivations among their stakeholders. The key to equity in this situation lies in the process of setting benchmarks, or expectations for performance of a quality organization. A realistic benchmark would take into account the fact that part of the population served will not move in the value direction implicit in the indicator because they have different values or needs; the provider may have little control over some of the forces influencing outcomes. For example, even a pediatric provider of the highest quality and performance may not return 100 percent of its program participants in a school setting; a more realistic target number may be, say 75 percent, depending on the severity of the issues for the population and the community environments they face.

Performance Indicators for Rehabilitation Programs Page 30 of 95
We do not want the identification of a draft indicator set to be derailed by the downstream challenges of benchmarking, or by the recognition that the goal performance is less than 100 percent of the value stated. Rather, we want to continue to identify the desired indicators, and work to write specifications and set performance goals consistent with and adjusted for the realities of severity, risk, and barriers for the population served.
Relationship of Performance Indicators to Accreditation There is a great deal of discussion in the accreditation arena about becoming more outcome-oriented in the development and application of standards. Input CARF has received through our National Leadership Panels points out that while process standards should not be ignored, there should indeed be an increased emphasis on ensuring that an accredited organization’s products (results of service delivery for persons served) be of high quality. It is important to have accreditable processes in place, but the outcomes of service also should be of high quality. The difficulty comes in being able to: accurately and reliably measure the right outcomes; adjust these measures for risk, severity or other influencing factors to make comparisons valid. Performance indicators should be reviewed, therefore, with respect to how well they can be risk- or severity-adjusted at the present time, or what work should be done in the foreseeable future to develop better methods for cross-program comparison.
We are often asked to describe the relationship of our performance indicators effort to the CARF standards applied during site surveys for accreditation. For this project, performance indicators refer to a set of concerns and quantitative expressions that can be collected by a provider and reported to a stakeholder (consumer, payer, agency, etc.). Indicators tend to reflect outcome or process aspects of programs or services. For example, we might be concerned that people have choice about where they live, and an indicator could quantify the number of clients who report that they have choice.
In contrast, standards are requirements for accreditation; programs are assessed as to their conformance with standards during a site survey. They reflect primarily structure and process aspects of programs or services.

Performance Indicators for Rehabilitation Programs Page 31 of 95
Standards may identify domains, indicators, or measures programs should use in their own information systems, but the values represented in data collected by the organization are not usually integral to the accreditation standards or the survey process. (See Glossary of Terms)
Individual versus Program Levels of Analysis The level of analysis has implications for both the content and the interpretation of a given indicator. Indicators will be different for performance of an individual person served (e.g., responses to a questionnaire as indicators of a person’s quality of life), of the qualifications of a practitioner (e.g., test scores on a qualifying exam as indicator of counselor’s competence), of a service program or organization (e.g., return-to-work rate for the population served as indicator of the likely success in getting me a job), or of a system, network, or plan of programs and organizations (e.g., percent of eligible population enrolled as indicator of easy access to a health plan). CARF currently accredits only programs and services; it does not credential practitioners. CARF’s recently developed network standards, first published in 1999, will allow accreditation at the network level.
CARF’s two applicable levels of interest in performance, then, are the individual person served and the service or program within an organization. Figure 3 illustrates that the individual person served is—and should be—at the center of what we do in rehabilitation, as well as the basic unit for data collection. Outcome performance for the program, organization, a network, or even the field in general consists of levels of aggregation of individual-level outcomes; i.e. the process begins with aggregating input from and data on the individual person served and continues through the program, organization, network and other rehabilitation, health and human services.
Results and performance at the level of individual persons served are addressed within the body of those standards which speak to the service process itself. The performance indicators addressed in this project, therefore, relate to the assessment of performance at the level of the service or program, even though that performance may be arrived at by aggregating results or opinions across the group of persons served by a program. To use

Performance Indicators for Rehabilitation Programs Page 32 of 95
a simple example, return-to-work rate as an indicator of program performance must rely on knowing how many people were served in the applicable program, and whether each individual served returned to work or not. Yet it is the rate (number of people returning to work divided by the number of people in the return-to-work program) that is of interest at the program level. This rate is the quantitative expression that forms the indicator of a program quality important to multiple stakeholders—that people served by the program have a certain likelihood of participating in the labor market and being productive.
Figure 3.
Levels of Analysis for Outcomes Data
On the Language of Performance In any national endeavor designed to communicate uniform instructions to multiple stakeholders, language is paramount, as it always has been in publishing CARF Standards Manuals. Yet, as we have scanned the performance indicator literature across three sub-fields related to CARF’s divisions, we observed inconsistency in the use of central terms, including indicators and measures. Therefore, CARF has adopted what we considered

Performance Indicators for Rehabilitation Programs Page 33 of 95
to be the clearest of terms and proposes adding these terms to our glossary to address the new language of performance quality. Table 3a outlines the conceptual framework and key terms. Table 3b shows several concrete examples from each of our fields to illustrate key concepts.
Distinctions & Definitions When we evaluate the quality of a service, we can conceptualize a set of broad domains, or categories of topics, that concern us about quality. People have concerns about the quality of services they receive, and these concerns derive from the values of persons served. Performance indicators are quantitative expressions used to point to program quality within these areas of concern. Indicators represent a limited set of constructs that the persons served and their payers/sponsors can look to for key information to assess the quality of a rehabilitation program, and to compare or shop for the program best suited to their needs.
CARF is making a distinction between the concepts of indicator (quantitative expressions of performance) and measure (specific instruments or data elements). In rehabilitation there has been a history of 30 years or more in development of measures and outcome data systems, especially in the medical rehabilitation arena. Moreover, for more than two decades CARF has required that accredited organizations use outcome measures for planning, program evaluation, quality improvement and program decision-making. We deliberately have not required organizations to use any given measure or data system (some of which are proprietary), and do not foresee a change in this policy. However, we do wish to provide guidance to the rehabilitation field by identifying a consensus on the indicators of program performance important to consumers and others, without being prescriptive about which measure to use.

Performance Indicators for Rehabilitation Programs Page 34 of 95
Table 3a CONCEPTUAL FRAMEWORK
TERMS FOR CARF PERFORMANCE INDICATORS Version 1.1 WORD DESCRIPTION
Domain General category of interest; access, structure, process, outcome, efficiency
Concern Expressible as a value statement A general category of issues May encompass several indicators Represents a value of interest to stakeholders
Indicator Quantitative expression Expressed as degree, rate, ratio, percentage May include reference to a general concept (e.g., health status) Includes or implies numerator and denominator of an expression Something CARF can endorse or support
Measure Specific instrument or scale May be a composite score or a single data element Refers to specifically defined quantities (e.g., SF-36 total score) Relates primarily to numerator of the indicator expression CARF does not endorse one over another
Data Element Field in a data base Item in a scale or scale score May constitute part or all of a measure May reflect nominal, ordinal, interval or continuous values
Numerator Count or frequency of occurrence of the process or outcome. Reflects the number of persons matching a specified value on a measure.
Denominator Population base from which the indicator is calculated Represents the group of interest for a specific indicator

Performance Indicators for Rehabilitation Programs Page 35 of 95
Table3b TERMINOLOGY RELATED TO CARF PERFORMANCE INDICATORS
Glossary Examples
Term Definition Automotive Behavioral Health
Medical Rehabilitation
Employment & Community Services
Concern Value of interest to a stakeholder
Car should enter freeway quickly
Persons served should have improved functioning.
Persons served should have maintained or improved health status.
Work program participants should attain competitive employment.
Indicator Quantifiable expression (often a rate, ratio, or percentage) used to point to program quality or performance
Speed
Power
Change in functional status of persons served from admission to follow-up
Change in health status of persons served from initial visit to one-year follow-up
Placement in work rate.

Performance Indicators for Rehabilitation Programs Page 36 of 95
Glossary Examples
Term Definition Automotive Behavioral Health
Medical Rehabilitation
Employment & Community Services
Measure Specific instrument or data element used to quantify or calibrate an indicator; may include multiple data elements in a scale
Miles per hour
Kilometers per hour
Horsepower
Time to 60 mph
Mean change in BASIS-32 scores
Outcome Index using admission-to- follow-up scores on SF-36 / standards deviation of admission scores
Percent of clients in RTW program in competitive employment 60 days post closure
Performance Achievement of a certain level or value on indicator(s) using specified quantitative measures
60 MPH
80 KPH
120 HP
10 sec. From 0-60 mph
Average reduction in symptoms of 15 percent using BASIS-32 scores
Health status Outcome Index of 52.5
73% returned to competitive employment
Benchmark Quantitative performance level used as a desirable target
Max speed 120 mph
7 sec. From 0-60 mph
Reduction by 20% in BASIS-32 scores
Health status Outcome Index of 55.0
80% or persons served in competitive employment at follow-up

Performance Indicators for Rehabilitation Programs Page 37 of 95
Components of a Performance Indicator System The components we have defined for purposes of this project are listed here, along with a group of questions that reflect the considerations that must be given in defining each component.
Domains of Interest
What are the major areas of inquiry into which the concerns, indicators, and measures can be classified? There can be several dimensions along which domains can be described. Two familiar, but cross-cutting sets of domains include:
Modified Donabedian1 Framework CARF Standards framework
Structure Process
Outcome Prevention
Efficiency Effectiveness Satisfaction
Figure 4 Domains of Interest
Values and Concerns
What are the values and associated concerns stakeholders have about quality rehabilitation services? What statements can be made that reflect stakeholders’ sense about what quality services means to them? (e.g., persons served in the employment program should be able to participate in the labor market.)
Indicators
What are those key indicators—quantitative reflections of the values and concerns—that would help a stakeholder understand a rehabilitation program’s performance? What would a person want to know about a program’s performance to help him or her decide to purchase rehabilitation 1 Donabedian, A. 1966. Evaluating the quality of medical care. Milbank Quarterly, 44:166-203. __________ 1988. The quality of care: How can it be assessed? JAMA 260(12):1743-1748.

Performance Indicators for Rehabilitation Programs Page 38 of 95
services from that program, or to assess its appropriateness for their needs? (E.g., Return-to-work rate.)
Possible Measures
What specific measures—instruments, tools, data elements—can be used to quantify the indicator? While CARF does not endorse or require the use of any specific measure or data system, it will be important to know which measures are appropriate and adequate for the indicator. It will be necessary to "drill down" to the level of the measure in order to apply many of the criteria for indicators (e.g., scientific soundness, feasibility and cost of data collection). In some cases, applying these criteria may in fact help select a measure for a given indicator (e.g., using a lengthy scale or instrument over another shorter instrument).
Specifications for Measure Use and Indicator Calculation
How does one calculate the rate or ratio used to quantify an indicator? What should be counted for the numerator and for the denominator of the equation? What specifically should be collected, what data source is acceptable, what populations should be included or excluded in order to make use of the indicator uniform? What subgroups should be used to adjust for key severity or risk factors that predict outcome values?
Scientific Soundness and Administrative Feasibility of Indicators and Their Measures
What is known about the scientific aspects of an indicator and of a measure? Is there demonstrated reliability in using a measure? Is it sound enough to be used in describing program performance? What work needs to be done that might imply testing an indicator first? Are the data feasibly collected in a service delivery setting? What is the best source for the data? Is it realistic to expect provider organizations to collect the data reliably and at a reasonable cost?

Performance Indicators for Rehabilitation Programs Page 39 of 95
Classifying Performance Indicators—A Taxonomy of Domains and Concerns The proliferation of performance indicators and the complexity of our service organizations demand that we use clear and common language to discuss these issues. If the ultimate goal is to have a common base that is understandable and comparable for all constituents and stakeholders, we must devise a glossary of terms and a sensible and feasible taxonomy that accurately reflects but helps us make sense of the complexity. As indicator sets have been developed, there has been no consistent framework for their organization; in some cases there appears to be no logic at all; in others, the logical bases for classification of indicators varies. In addition, the use of key terms is inconsistent; in some cases terms are used interchangeably, but in other cases the same terms are used to distinguish different concepts as Table 3c shows.
In reviewing literature on performance indicators, the CARF team became aware that there are many different ways of classifying domains and concerns. Three examples are:
1. A continuum of disorder / recovery / function / participation o Prevention of need for service o Access to service once needed o Appropriateness of service once provided o Safety of environment and of services provided o Rights of persons served o Results of service for persons served
2. The organization’s features (Donabedian framework) o Structure o Process o Outcome o Relationships among these features
access = structure / process combination value or efficiency = outcome-to-process relationship
3. Traditional CARF Outcome Management standards: o Effectiveness o Efficiency o Satisfaction

Performance Indicators for Rehabilitation Programs Page 40 of 95
Each set of domains represents a different plane of thought. The Donabedian framework (Donabedian, 1966; 1988) has become a classic and simple scheme for evaluating service quality. Therefore, for simplicity we have organized the candidate indicators presented here using structure, process and outcome as the basic domains. To this we have added domains of access (a combination of structure and process) and efficiency (the relationship between outcome and resource use). This is not to say that other dimensions for a taxonomy of domains, concerns and indicators are not valid. Table 3c shows a crosswalk of terms among some of the prominent efforts to define indicators. As this project moves forward and benefits from broader input, we will work to define a taxonomy that is clearest and most useful to the stakeholders involved.

Performance Indicators for Rehabilitation Programs Page 41 of 95
Table 3c Performance Indicators Project Terminology: Who uses what ?
CARF NCQA JCAHO AHCPR CMHS ACMHA COA2 The Council3
Performance Indicators Version 1.0
HEDIS 3.0 Oryx/National Library of Healthcare Indicators
CONQUEST 1.1
MHSIP The Santa Fe Summit on Behavioral Health
(General use – no document)
Personal Outcome Measures
Domain Domain Domains of performance
Performance measure set
Domain Domain Domain Factors
Concern Focus Concern Value theme Concern
Indicator Measure /Indicator Performance Performance
Indicator Indicator Outcome Indicators
Performance
Measure Data element Measure Measure Measure Measure Measure Measure
Data element Data element Data element Data element Data element Data element Data element
2 Council on Accreditation 3 The Council on Quality and Leadership in Supports for People with Disabilities

Performance Indicators for Rehabilitation Programs Page 42 of 95
An Example: Automotive Performance Concepts and Terms These concepts and terms can be illustrated using an automotive example – one that affects almost everyone. We are about to purchase a new car, one that meets our particular needs and preferences. Let us say one of our concerns is that the new car be able to enter the freeway from the onramp quickly and safely (we live where we must take the freeway to work, and the nearest onramp is on a slight uphill grade and merges with freeway traffic in a short distance). One indicator we might look for to address our concern is acceleration power of the car; another might be maximum speed capability. Suppose we choose to focus first on the power indicator; possible measures of power could include (1) horse-power of the engine, (2) number of cylinders, and (3) number of seconds it takes the car to accelerate from 0 to 60 miles per hour (mph). Often data on either or both of these measures are published in the specifications for the car, and we might look for a car whose performance on these measures matches our needs. For example, we might look for a car with an engine of at least 120 hp. Or, we might look for a car that can go from 0-60 mph in less than 10 seconds; stated another way, our benchmark performance for our auto needs is 120 hp or 10 seconds from 0-60. (We may be aware that cousin Richard (Petty) has needs that far exceed ours, and his benchmark for performance on the acceleration measure is 5 seconds from 0-60.)
We’re on the car lot, searching through various vehicles for one that meets our needs. While there are potentially many sources of information about the various cars’ power performance (Consumer Reports, Car and Driver), each car’s owners manual, a mechanic we trust, the salesperson, our neighbor and cousin Richard (if we knew where to find him), we choose to refer to a comparison chart provided by a regional automotive association. We identify two cars that meet or exceed our benchmark values on the two measures we’re using for power performance. (Note that in narrowing our selection down to only two cars, we have factored in performance characteristics on other indicators addressing other concerns we had about a car, such as price, safety features, body style, wheel base, transmission type and color.) While the final choice of a car may depend on many factors, a gut feeling or even a reference from a friend who owns one, we have at least assessed possible car choices systematically on the key indicators that matter to us, the consumer.

Performance Indicators for Rehabilitation Programs Page 43 of 95
The automotive analogy is useful in some other respects too. Consider the dashboard of the car we purchase. It contains displays that reflect the car’s momentary performance on a variety of indicators. For example, speed, engine temperature and fuel availability. Each of these indicators has the potential of being measured in different ways: speed can be measured in miles per hour or kilometers per hour; engine temperature can be measured in degrees Fahrenheit, degrees Celsius, or a point on the manufacturer’s hot/cool scale; fuel availability in gallons of fuel remaining or proportion of a full tank. A car sold in the U.S. and in Europe may display both measures simultaneously, e.g. a speedometer showing both mph and km/h on an analog scale. Some recent model luxury cars might use a digital display showing mph and others, a simple analog dial. At any rate, one of these measures is an essential component in verifying the car’s performance on our key indicator (we need to determine when the car has reached 60 mph).
The options seem endless to the weary, wary car buyer. But what indicators need to be reflected on our new car’s dashboard? Which are essential? Which are nice to have? Which are simply matters of personal preference? Who decides? And what does all this have to do with accreditation and performance indicators?
Let’s imagine there exists an organization—say, the Automotive Standards Association—that has determined that there is a basic set of indicators that must be shown on all cars sold in the country. This association might play a role similar to that of an accrediting body in health or human services. As a result of the association’s deliberations, all car dashboards contain the core indicator instruments, though they might use different measures in some cases (e.g. mph vs. km/h). Some cars may require additional indicators beyond the core set—say a tachometer for automobiles with manual transmissions. We may wish to have a certain indicator or measure simply from personal preference—say a digital display of speed in mph or outside ambient temperature gauge. Some manufacturers may have decided to include indicators beyond the core set on all their cars’ dashboards—say a clock—which might be optional or unavailable on others.
We could wheel on with the auto analogy, but let’s drive back to the original point. We know that the concerns that we have when selecting a car can and should be addressed using some quantitative indicators, each of which has the potential of being measured in various ways. We know that as consumers we want to consider at least some of these quantitative indicators

Performance Indicators for Rehabilitation Programs Page 44 of 95
rather than relying totally on the salesperson’s presentation, our neighbor’s preferences, or cousin Richard’s speeding tickets; and we may well appreciate the fact that an independent entity has established a key set of indicators for manufacturer reporting, if not for display on the dashboard. In this way, we can make at least a first-cut comparison among the available choices of cars.
Criteria for Indicators
The candidate indicators that have emerged from the efforts of CARF’s advisors were generated based primarily on the importance of an interest in the concern and indicator. Participants were given an overview of criteria for indicators, but were not explicitly asked to screen indicators in or out based on these criteria. In essence, the criteria have operated in the background for this first cut. We were more interested in first eliciting the concerns and desired indicators, and secondarily in considering data collection specifications, measure development, feasibility and affordability. Our rationale for this position was that we did not want to be constrained in our thinking by logistics that have the potential to be solved with further development or technology. Some participants in the working groups noted this has been a negative feature of other indicator sets; i.e., that indicators were chosen more because data were readily available than because they reflected the interests of stakeholders.
We recognize that final recommendations and specification for indicators may omit or defer some that are conceptually important, but which are not feasible or sound given the present state of the art in measurement. Our intention then would be to make recommendations about what kind of work would be needed in order to make the indicator feasible and useful.
Following are criteria proposed for a final indicator set. They closely parallel criteria suggested by other indicator efforts (e.g. NCQA and JCAHO). Input and reflection from the field will be necessary to help us rate candidate indicators on these dimensions. Next steps for the project will involve a review of candidate indicators against these criteria. (See Table3d)

Performance Indicators for Rehabilitation Programs Page 45 of 95
Table 3d Criteria for Performance Indicators Performance Indicators and associated measures should be:
Relevant to:
Program area CARF’s framework of effectiveness,
efficiency and satisfaction Multiple stakeholders A certain population of consumers Quality improvement efforts Cost evaluation Communicating with stakeholders Disability and rehabilitation services policy Research needs
Scientifically sound:
Face validity Construct validity Reliability and accuracy Risk adjustability Capable of discriminating (reflecting
variation) among providers
Informative for decision making:
Contributes to potential for improving quality of services
Contributes to ability to communicate with stakeholders
Contributes to ability to manage access to and costs and outcomes of, services
Compatible:
With other organizational information needs (service provision, management)
Consistent (not in conflict with) existing measures and data sets in common use
Feasible:
Clear specifications Data available or readily obtainable Tools and data systems accessible to
organizations
Affordable: Reasonable cost for data collection Reasonable cost for data management, analysis
and reporting

Performance Indicators for Rehabilitation Programs Page 46 of 95
Evolution of Performance Indicators Setting the Stage: National Leadership Panels on Outcomes
This monograph represents the substantial input of several field-based groups invited to provide major support and direction to CARF’s efforts. First, the three national leadership panels (NLPs) on outcomes, which took place in the winter of 1996, provided broad principles upon which this project is based. A key recommendation that crossed all three groups was that CARF could contribute to the field by facilitating a dialog culminating in a set of key quantitative indicators of rehabilitation program performance. Based on the NLP recommendations we began the project with the notion that CARF would act primarily as a facilitator, and that any performance indicator set that emerged would be presented as information for the field. The consensus at the time was around CARF’s role in providing information and technical assistance only.
Brainstorming: The Working Conference on Performance Indicators Next, the invitational working conference on performance indicators, convened in July 1997, conducted the first round of content brainstorming on what were the key pieces of information stakeholders would need to assess program quality providing the foundation for the project and proposing an extensive set of candidate indicators. This working group of about 75 persons crossed all three CARF divisions at the time, and included representatives from "the five P’s" of CARF stakeholders: persons served, providers, payers, policy makers, and professional researchers. The group’s strongest aspect was its technical knowledge of measurement and commonly held beliefs about what constitutes good outcomes in the respective rehabilitation arenas reflected in CARF divisions.
Participants were constituents of all three divisions of CARF: Behavioral Health (15), Employment and Community Support (23) and Medical Rehabilitation (24). Those invited were knowledgeable about various aspects of outcomes or performance assessment, and represented consumer groups (for adults and children), public agencies, professional organizations,

Performance Indicators for Rehabilitation Programs Page 47 of 95
research organizations, employer groups, and rehabilitation service providers.
Willis Goldbeck, Chairman of the Institute for Alternative Futures, presented a stunning keynote talk that set the stage for a challenging, think-outside-the-box working session. Goldbeck reminded participants:
Your focus must be on the consumer. You must believe in the value of information. You must recognize that information belongs to the consumer and you must be constantly reminded that the consumer is your mother, your lover, your ten-year old, or whoever. The consumer is not a distant creature, a statistic, an anomaly… The consumer wants and even in ignorance has the right to expect quality in performance and accountability.
Mr. Goldbeck also emphasized the need to begin the task of defining information needs for quality and accountability, even thought the state of the art in measurement and indicator development is still evolving. As he noted, "Bad data begets better data." The group was challenged to begin defining good data needs but to continue improving its quality. He challenged the group to strive past mediocrity, to break the rules currently governing levels of satisfaction. In his closing statements, Goldbeck encouraged participants to:
…dare to be the heroes that you can be in this process; to challenge the conventional, to go beyond that space where you are comfortable today. Get on with it, but know that your task will never be finished; and don’t let that disturb you.
On the first afternoon and following morning of the conference, participants broke into division-based working groups with discussions facilitated by the National Directors and recorded by CARF staff. The groups were provided with a set of worksheets designed to parallel the topics outlined in the agenda brochure. On the second afternoon, the groups came together again in a plenary session to summarize the key indicators, issues, and future work to be done.
Several goals were accomplished during the meeting. A number of very important players in rehabilitation outcomes and performance assessment were brought together in a lively dialogue. The plenary sessions provided a rare opportunity for key players in each division’s field to hear the themes

Performance Indicators for Rehabilitation Programs Page 48 of 95
and performance issues for the other fields. With this event, CARF actively joined the organizations involved in the performance indicator arena. The conference provided a good start on sorting out technically complex as well as politically challenging tasks in assessing and communicating program performance. The three divisional groups’ worksheets form the "raw data" for a draft set of indicators to be disseminated for the information of the field, and for refinement with additional input from consumers, the field, and technical experts.
While it was clear that the three sub-fields are at different stages in their evolution toward performance indicators development and use, there were also common themes across the groups. There was a remarkably consistent focus on the point of view of the consumer. All three groups reflected themes of return to productive activity (work, school, community, or family roles), community living, quality of life as defined by the person served, and access to safe, efficient service provision.
CARF staff took the enormous amount of raw material generated in the two days of the 1997 working conference, returned to the available literature on rehabilitation-related performance indicators, evaluated the pros and cons of various approaches, and crafted for CARF a conceptual framework, a glossary of terms, and a draft set of candidate indicators (Version 1.0) which fit into the defined framework.
Moving Ahead: The Performance Indicators Advisory Council
Draft 1.0 was presented to the third major working group in July 1998, CARF’s Performance Indicators Advisory Council. The group of about 30 was asked to evaluate the proposed conceptual framework and glossary; review a list of criteria for the eventual evaluation of specific indicators, measures, and measurement specifications; and refine the candidate set of indicators. This document reflects their deliberations as to the conceptual framework and content of the preliminary indicator set; we therefore refer to the present work as Version 1.1. The main charge to the Advisory Council was to delve into the topic and the preliminary work on indicators, and provide substantial direction and advice to CARF on the project itself. Key policy questions addressed by the Advisory Council included: What should CARF’s role be in relationship to performance indicators? How should we gather the substantial input from consumers / persons served that this effort

Performance Indicators for Rehabilitation Programs Page 49 of 95
requires? What should be the relationship of performance indicators to CARF standards and to accreditation?
The Performance Indicators Advisory Council officially made a recommendation to CARF’s Board of Trustees that we make a major shift in the direction for CARF’s performance indicators project, from a focus of information-only for the field, to a process that would lead toward incorporation of performance indicators within CARF standards in some fashion. The Advisory Council, like the NLPs and working conferences before them, made it clear that performance (including outcomes) should not replace the review of structure and process that is characteristic of the accreditation survey. They also emphasized that the consultative spirit of the CARF accreditation process must be maintained.
CARF’s Board of Trustees was presented with the Advisory Council’s recommendation at its August 1998, meeting. The Board, supporting the recommendation of the Advisory Council, voted unanimously to move as expeditiously as possible to elevate the priority given to the performance indicators initiative.

Performance Indicators for Rehabilitation Programs Page 50 of 95
Chapter 4 Candidate Performance Indicators in Behavioral Health This chapter presents the candidate indicators that emerged from the work of the Working Conference on Performance Indicators and the Performance Indicators Advisory Council. Participants were challenged with two key questions.
The Central Questions
o What would a stakeholder want to know about a program’s performance in order to assess its quality and choose among programs?
o How should these performance indicators be quantified and specified in such a way that stakeholders can know they are looking at comparable information from different programs?
Working outlines were provided to guide the considerations, but the three division-based groups working separately generated their ideas in somewhat different formats. In order to prepare candidate indicators within a common framework for CARF, our staff "massaged" the raw material of all ideas generated by the working groups into the candidate indicators consistent with the conceptual framework outlined in this monograph. Care was taken not to eliminate any suggestion made by the group, no matter where the ideas appeared in the working materials from the conference. We have chosen to be inclusive even when there is some redundancy so that the field may consider alternatives. Where the working groups were split or unsure about the feasibility of an indicator, we marked the indicator as one of secondary importance. This did not mean that the indicator was unimportant, but that, in limiting the number of indicators, these would be the ones to omit or defer.

Performance Indicators for Rehabilitation Programs Page 51 of 95
The number of candidate indicators that follows is high. It is expected that a final set will contain many fewer key indicators, especially when issues of feasibility and reliability of measurement are considered. However, we also believe that the array of concerns and indicators offered here provide a valuable glimpse of the thinking—and substantial consensus—of a diverse group of stakeholders.
Table 4a lists the indicators grouped by domain and topic of concern. The indicators also reflect the multiple domains of access, structure, process, outcome, and efficiency/value. Table 4b summarizes the candidate indicators, possible measures or examples of measures, the concerns and domains they represent, and potential data sources.

Performance Indicators for Rehabilitation Programs Page 52 of 95
Table 4a Candidate Behavioral Health Performance Indicators
Domain Concern Indicator Access to transportation to care
1. Convenience of service locations for consumers.
Acc
ess
Waiting time for service
2. Convenience of appointment times for consumers
3. ¥ Length of time to schedule first appointment
4. ¥ Length of time from first to second appointment
Program responsiveness to consumer needs
5. Degree of consumer involvement in the planning, design, delivery and evaluation of services
Client-driven services and support
6. Degree of active consumer participation in decisions concerning their treatment
7. Degree to which consumers receive information to make informed choices
Proc
ess
Personal dignity 8. Degree to which consumers report that staff members are sensitive to their cultural/ethnic/linguistic backgrounds
9. Degree to which linguistic accommodations are made
10. Degree to which consumers believe they were respected by staff members
Overall satisfaction
11. Degree to which consumers are satisfied with the overall services
Community tenure
12. ¥ Length of time spent in the community
13. ¥ Length of hospitalization 14. ¥ Length of time spent in jail
Out
com
e
Educational status
15. Educational attainment for those who are in school
16. ¥ Level of satisfaction with school

Performance Indicators for Rehabilitation Programs Page 53 of 95
Domain Concern Indicator Employment status
17. ¥ Degree of employment retainment 18. ¥ Decrease in days of work lost (for
those receiving or having received vocational rehabilitation)
Living situation 19. Degree to which consumers experience increased independence in their living arrangements
20. Degree to which consumers report that they live in an environment of their choosing
21. Degree to which consumers report a better housing situation
22. Degree to which adults live in residences they own or lease
23. Degree to which consumers’ housing situations improve as a direct result of services or interventions (when this is the service goal)
Quality of relationships
24. Degree to which consumers experience satisfaction with relationships
25. ¥ Degree to which consumers experience an increased level of social support
Financial Status 26. ¥ Average monthly income of consumers who are employed
27. ¥ Degree to which consumers who need benefits get benefits
Health status 28. Degree to which the health status of consumers is maintained and improved
29. Degree to which consumers report positive changes in the problems for which they sought help
Out
com
e

Performance Indicators for Rehabilitation Programs Page 54 of 95
Domain Concern Indicator Psychological well-being
30. Degree to which consumers experience a decreased level of psychological distress
31. Degree to which consumers experience an increased sense of self-respect and dignity
32. Degree to which consumers experience an increased level of functioning
33. Degree to which consumers feel good about themselves
Substance abuse 34. Number of days drinking/drug abuse in the index period
35. Degree of functional impairment in service recipients due to substance abuse
Personal safety 36. ¥ Degree to which safety is improved
Self-efficacy 37. Degree to which consumers feel they manage their day-to-day lives
The symbol ¥ denotes an indicator of secondary importance.
Out
com
e

Performance Indicators for Rehabilitation Programs Page 55 of 95
Table 4b CARF Performance Indicators / Behavioral Health
No. Performance Indicator Name Measure Concern Domain Data Source
1 Convenience of service locations for consumers
Number of positive consumer responses to a survey question regarding location, ÷ total number of responses, e.g.:
• The location of services was convenient (e.g., parking, public transportation, distance, etc.)
Access to Transportation to care
Access Consumer survey
2 Convenience of appointment times for consumers
Number of positive consumer responses to a survey question regarding convenience, ÷ total number of responses, e.g. :
• Services are available at times that were good for me.
Waiting Time
for Service
Access Consumer survey
3 † Length of time to schedule first appointment
Total number of days between initial call and first appointment, ÷ total number of new admissions (adjust between types)
Waiting Time
for Service
Access Administrative records
4 † Length of time from first to second appointment
Total number of days between first appointment and second appointment, ÷ total number of second appointment (adjust between types)
Waiting Time
for Service
Access Administrative records
5 Degree of consumer involvement in the planning, design, delivery, and evaluation of services
Number of consumers who are involved in the service delivery system (e.g., planning, design, delivery, and/or evaluation of services, ÷ total number of consumers
Program Responsiveness to consumer needs
Process Enrollment data, consumer survey
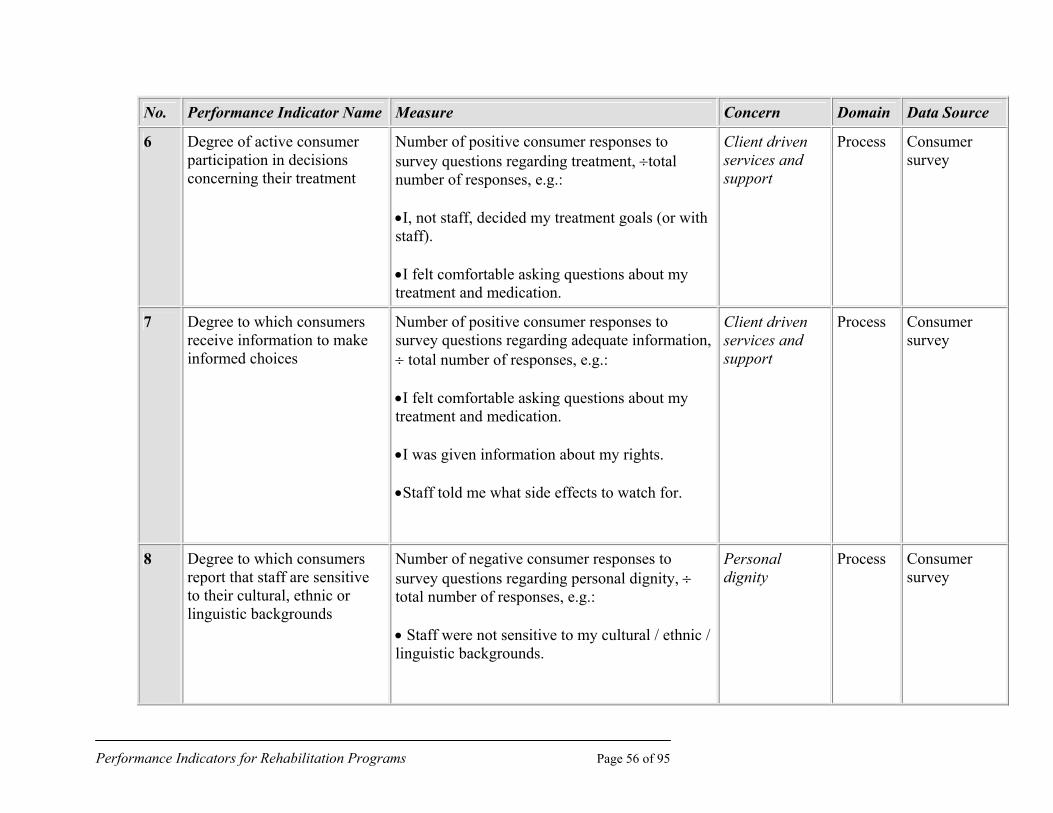
Performance Indicators for Rehabilitation Programs Page 56 of 95
No. Performance Indicator Name Measure Concern Domain Data Source
6 Degree of active consumer participation in decisions concerning their treatment
Number of positive consumer responses to survey questions regarding treatment, ÷total number of responses, e.g.:
•I, not staff, decided my treatment goals (or with staff).
•I felt comfortable asking questions about my treatment and medication.
Client driven services and support
Process Consumer survey
7 Degree to which consumers receive information to make informed choices
Number of positive consumer responses to survey questions regarding adequate information, ÷ total number of responses, e.g.:
•I felt comfortable asking questions about my treatment and medication.
•I was given information about my rights.
•Staff told me what side effects to watch for.
Client driven services and support
Process Consumer survey
8 Degree to which consumers report that staff are sensitive to their cultural, ethnic or linguistic backgrounds
Number of negative consumer responses to survey questions regarding personal dignity, ÷ total number of responses, e.g.:
• Staff were not sensitive to my cultural / ethnic / linguistic backgrounds.
Personal dignity
Process Consumer survey

Performance Indicators for Rehabilitation Programs Page 57 of 95
No. Performance Indicator Name Measure Concern Domain Data Source
9 Degree to which linguistic accommodations are made
Number of positive consumer responses to survey questions regarding staff language, ÷ total number of responses, e.g.:
• Staff can work with me in a language I feel comfortable with.
Personal dignity
Process Consumer survey
10 Degree to which consumers believe they were respected by the staff
Number of positive consumer responses to questions regarding consumer respect, ÷total number of responses, e.g.:
•I felt accepted, understood, and respected by staff who worked with me.
Personal dignity
Process Consumer survey
11 Degree to which consumers are satisfied with the overall services
Number of positive consumer responses to survey questions regarding overall satisfaction with the services, ÷total number of responses, e.g.:
•I was satisfied with the overall quality of care I received.
•I would recommend these services to others who might need them.
•I have confidence in the skills of those staff who worked with me.
Overall satisfaction
Outcome Consumer survey
12 † Length of time spent in the community
• Number of days spent in the community, ÷ total number of days in the index period
Community Tenure
Outcome Consumer survey / report

Performance Indicators for Rehabilitation Programs Page 58 of 95
No. Performance Indicator Name Measure Concern Domain Data Source
13 † Length of hospitalization • Number of days in a hospital, ÷total number of days in the index period.
•Number of hospital admissions in the index period.
Community Tenure
Outcome Administrative data
14 † Length of time spent in jail • Number of days spent in jail, ÷ total number of days in the index period.
• Number of adults who report spending some time in jail during the past year, ÷ total number of adults served during the past year
• The change in the proportion of children and adolescents involved with the legal system as reported on the CAFAS
•Legal scale on QOLQ
Community Tenure
Outcome Case record, case manager,
follow up with client
15 Educational attainment for those who are in school
The proportion of children and adolescents for whom there is an increase in educational attainment:
• Average educational attainment as measured by 1-22 years.
• Educational status if in school, e.g., GED, adult education, technical school, AA degree, BA degree, graduate school.
•Teacher rating scale
Educational status
Outcome Case record, school record, follow up with teacher referrals

Performance Indicators for Rehabilitation Programs Page 59 of 95
No. Performance Indicator Name Measure Concern Domain Data Source
16 † Level of satisfaction with school
•The proportion of children and adolescents for whom there is an increase after 3 months on the CAFAS School Performance subscale.
•Average rating of school satisfaction on QOLQ
Educational status
Outcome Case record,
follow up with children
17 † Degree of employment retainment
Number of hours, days, weeks employed in the index period:
•Number of days employed
•Number of weeks employed
•Hours worked per week
Educational status
Outcome Case record
18 † Decrease in days of work lost (for those receiving /having received vocational rehab)
The average number of days of work lost by employed adults as measured from a question such as:
• During the last four weeks, how many days did you miss work?
Employment status
Outcome Consumer report items
19 Degree to which consumers experience an increased independence in living
Percent of consumers who experience an increased level of living status as measured by, e.g.:
•IASPRS tool kit.
•ASI (relevant scales).
Living situation Outcome Case record

Performance Indicators for Rehabilitation Programs Page 60 of 95
No. Performance Indicator Name Measure Concern Domain Data Source
20 Degree to which consumer report that they live in a choice of their choosing.
Percent of consumers who report that they live in a choice of their choosing in a consumer survey.
Living situation Outcome Consumer survey
21 Degree to which consumers report housing situation is better
Percent of consumers who experience housing satisfaction as measured by, e.g.:
•Lehman QOL scale.
Living situation Outcome Case record
22 Degree to which adults live in residences they own or lease
At the time of annual reporting, number of adults with serious mental illness currently living in residences they own or lease, ÷ total number of adults with serious mental illness currently being served by the plan. (severity adjusted)
Living situation Outcome Administrative records
23 Degree to which a consumer’s housing situations improve as a direct result of service or intervention (when it is its goal).
Number of positive consumer responses to a survey question, ÷total number of responses, e.g.:
• As a direct result of services I received, my housing situation has improved.
Living situation Outcome Consumer survey
24 Degree to which consumers experience satisfaction with relationships
Number of consumers who experience satisfaction with relationships, ÷total number of consumers, as measured by, e.g.:
•Lehman scale
Quality of relationship
Outcome Case record
25 † Degree to which consumers experience an increased level of social support*
Number of consumers who experience an increased level of social support, ÷total number of consumers, as measured by, e.g.:
•ISEL or other scale
Quality of relationship
Outcome Case record

Performance Indicators for Rehabilitation Programs Page 61 of 95
No. Performance Indicator Name Measure Concern Domain Data Source
* needs specified data elements to operationally define "social support"
26 † Average monthly income of consumers who are employed
Total monthly pay by the consumers, ÷ total number of consumers who are employed, e.g.:
•Monthly income from consumer survey
•IASPRS tool kit.
Financial status
Outcome consumer survey, Case record
27 † Degree to which consumers who needs benefit get benefit
Percent of consumers who report that they get benefit they need.
Financial status
Outcome consumer survey, Case record
28 Degree to which health status of consumers is maintained and improved
Total scores, e.g., from SF-36 Health Survey, ÷ total number of consumers who take the survey (Case mix, and measured over time)
Health status Outcome Case record
29 Degree to which consumers report positive changes in the problems for which they sought help
Number of positive consumer responses to the following question, ÷total number of responses, e.g.:
•You came to our program with certain problems. How are these problems now?
Health status Outcome Consumer report

Performance Indicators for Rehabilitation Programs Page 62 of 95
No. Performance Indicator Name Measure Concern Domain Data Source
30 Degree to which consumers experience a decreased level of psychological distress
Proportion of adults with mental illness who report a decreased level of psychological distress at selected intervals after admission for mental health treatment, according to the symptom distress scale (adapted from, e.g., SCL-90 and BSI, CAFAS for children and adolescents).
Psychological well-being
Outcome Case record
31 Degree to which consumers experience an increased sense of self-respect and dignity
Percent of service recipients with serious mental illness who report an increase in sense of self-esteem based on, e.g., the Rosenberg Self-Esteem Scale
Psychological well-being
Outcome Case record
32 Degree to which consumers experience an increased level of functioning
The proportion of consumers who report to have increased level of functioning in consumer surveys. For children and adolescents, may use results from CAFAS.
Psychological well-being
Outcome Consumer surveys, Case record
33 Degree to which consumers feel good about themselves
Number of consumers who feel good about oneself, ÷ total number of consumers based on scales from, e.g.:
•Rosenberg Self-Esteem Scale
•SLOF (Specific Level of Functioning Scale)
•Client Satisfaction (CSQ-8)
•NACBHD - Respect and Dignity
Psychological well-being
Outcome Consumer surveys, Case record

Performance Indicators for Rehabilitation Programs Page 63 of 95
No. Performance Indicator Name Measure Concern Domain Data Source
34 Number of days drinking/drug abuse in the index period
Average number of days drinking/drug use by service recipients in the index period (e.g., the last 30 days).
Substance abuse
Outcome Consumer survey
35 Degree of functional impairment in service recipients due to substance abuse
• The rate of all adults receiving services in the mental health system who are identified with substance use "greater than or equal to 3" on the Clinical Alcohol and Drug Use Scale.
• The proportion of children and adolescents for whom there is a decreased level on the CAFAS Substance Abuse subscale.
Substance abuse
Outcome Case record
36 † Degree to which safety is improved
Total number of victimizations within 30 days, ÷ total number of service recipients.
Personal safety Outcome Consumer survey, MIS data
37 Degree to which consumers feel they can manage their day-to-day lives.
Number of consumers who feel they can manage (have internal locus of control) ÷total number of consumers. Based on, e.g.,
• An internal/external locus of control scale, or
• Responses to a question such as, "Do you feel like you do control most of the important things in your day-to-day life?"
Self-Efficacy Outcome Case record, consumer survey
† Secondary importance

Performance Indicators for Rehabilitation Programs Page 64 of 95
Chapter 5 Candidate Performance Indicators in Employment and Community Services Group This chapter presents the candidate indicators that emerged from the work of the Working Conference on Performance Indicators and the Performance Indicators Advisory Council. Participants were challenged with two key questions.
The Central Questions
o What would a stakeholder want to know about a program’s performance in order to assess its quality and choose among programs?
o How should these performance indicators be quantified and specified in such a way that stakeholders can know they are looking at comparable information from different programs?
Working outlines were provided to guide the considerations, but the three division-based groups working separately generated their ideas in somewhat different formats. In order to prepare candidate indicators within a common framework for CARF, our staff "massaged" the raw material of all ideas generated by the working groups into the candidate indicators consistent with the conceptual framework outlined in this monograph. Care was taken not to eliminate any suggestion made by the group, no matter where the ideas appeared in the working materials from the conference. We have chosen to be inclusive even when there is some redundancy so that the field may consider alternatives. In places where the working groups were split or unsure about the feasibility of an indicator, we have marked the indicator as one of secondary importance. This did not mean that the indicator was unimportant, but that in limiting the number of indicators, these would be the ones to omit or defer.

Performance Indicators for Rehabilitation Programs Page 65 of 95
The number of candidate indicators that follows is high. It is expected that a final set will contain many fewer key indicators, especially when issues of feasibility and reliability of measurement are considered. However, we also believe that the array of concerns and indicators offered here provide a valuable glimpse of the thinking—and substantial consensus—of a diverse group of stakeholders.
Table 5a lists the indicators grouped by domain and topic of concern. The indicators also reflect the multiple domains of access, structure, process, outcome, and efficiency/value. Table 5b summarizes the candidate indicators, possible measures or examples of measures, the concerns and domains they represent, and potential data sources.
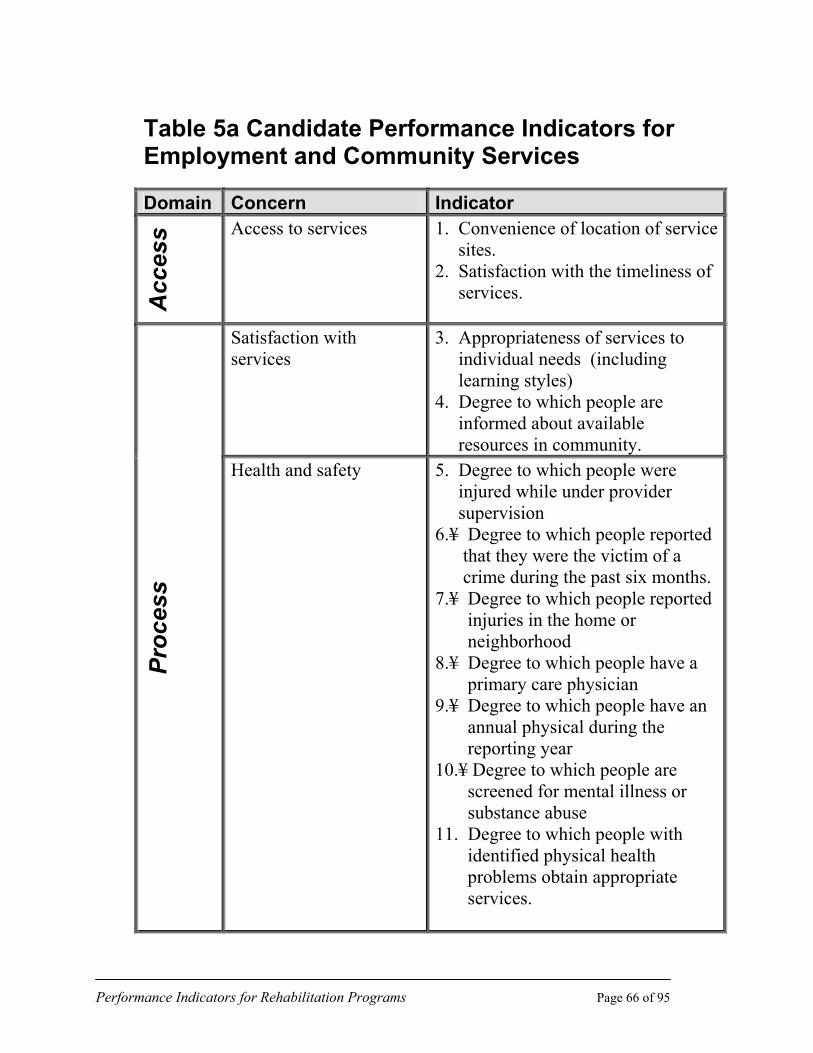
Performance Indicators for Rehabilitation Programs Page 66 of 95
Table 5a Candidate Performance Indicators for Employment and Community Services
Domain Concern Indicator
Acc
ess Access to services 1. Convenience of location of service
sites. 2. Satisfaction with the timeliness of services.
Satisfaction with services
3. Appropriateness of services to individual needs (including learning styles) 4. Degree to which people are informed about available resources in community.
Proc
ess
Health and safety 5. Degree to which people were injured while under provider supervision 6.¥ Degree to which people reported that they were the victim of a crime during the past six months. 7.¥ Degree to which people reported injuries in the home or neighborhood 8.¥ Degree to which people have a primary care physician 9.¥ Degree to which people have an annual physical during the reporting year 10.¥ Degree to which people are screened for mental illness or substance abuse 11. Degree to which people with identified physical health problems obtain appropriate services.

Performance Indicators for Rehabilitation Programs Page 67 of 95
Domain Concern Indicator Attachment to labor market
12. Degree to which people retained full-time employment for one year after service. 13. Extent of hours worked per week in gainful employment by people who need support
Earnings and relative gain in income
14. Retention of earnings at a specified point (e.g. 12 months) of employment 15. Positive change in earnings as a result of the program 16¥ Comparability of earning rates of persons served with those of general population
Community inclusion 17. Participation of the persons served in community activities
Independence and self-sufficiency
18¥ Degree to which people are able to perform activities of daily living 19. Reduces reliance on disability- specific funding sources 20. Degree to which people are in control of their own resources 21. Degree to which people are living where they choose
Esteem and self-worth 22. Degree to which consumers report feelings of improved self- worth 23.¥ Degree to which consumers report freedom from distress
Out
com
e
Self-advocacy 24. Degree to which people report realistic opportunities for making individual informed choices (i.e. choosing how to use free time, choosing daily routines)
The symbol “¥” denotes an indicator of secondary importance.

Performance Indicators for Rehabilitation Programs Page 68 of 95
Table 5b CARF Performance Indicators / Employment and Community Services
No. Performance Indicator
Measure Concern Domain Data Source
1 Convenience of the location of service sites
Total number of positive responses to a survey question regarding location, e.g. the location of service sites was convenient for me (distance, parking, public transportation) ÷ total number of responses.
Access to Services
Access Consumer Survey
2 Satisfaction with timeliness of services.
The number of positive responses to a survey question (e.g. Did you receive services in a timely manner?), ÷ total number of survey responses.
Access to Services
Access Consumer Survey, Records
3 Appropriateness of services to individual needs (including learning styles).
The number of positive responses to a survey question regarding appropriateness of services (e.g. The services were appropriate to my needs), ÷ total number of responses.
Satisfaction with Services
Process Consumer Survey, Case Records, Focus Group
4 Degree to which people are informed about available resources in the community.
The number of positive responses to a survey question regarding community networking (e.g. The program provided me useful information about available resources in the community), ÷ total number of responses.
Satisfaction with Services
Process Consumer Survey
5 Degree to which people were injured while under provider supervision.
Total number of people who were injured under provider supervision in the index period, ÷ total number of people served.
Health and Safety
Process Administra-tive Records, Incident Reports

Performance Indicators for Rehabilitation Programs Page 69 of 95
No. Performance Indicator
Measure Concern Domain Data Source
6* Degree to which people
reported that they were the victim of a crime during the past six months.
The number of positive responses to a survey question regarding safety in the community (e.g. I was the victim of a crime in the past six months), ÷ total number of responses.
Health and Safety
Process Consumer Survey
7* Degree to which people reported injuries in the home or neighborhood.
Total number of people who reported injuries in the home or neighborhood, ÷ total number of people served.
Health and Safety
Process Administra-tive Records
8* Degree to which people have a primary care physician.
Total number of people who have a primary care physician, ÷total number of persons served.
Health and Safety
Process Administra-tive Records
9* Degree to which people have an annual physical during the reporting year.
Total number of people who have an annual physical exam during the reporting year ÷total number of persons served.
Health and Safety
Process Administra-tive Records
10* Degree to which people are screened for mental illness or substance abuse.
Total number of people who are screened for mental illness or substance abuse during the reporting year ÷total number of people served.
Health and Safety
Process Administra-tive Records
11 Degree to which people identified with physical health problems obtain appropriate services.
Total number of people identified with physical health problems who obtained appropriate services during the reporting year, ÷ total number of people with health problems.
Health and Safety
Process Administra-tive Records
12 Degree to which people retained full time employment for one year after service.
Number of people with full time employment at the end of the index period, ÷ number of people who were placed in employment.(need data element to define full time)
Attachment to Labor Market
Outcome
Administra-tive Records, Survey

Performance Indicators for Rehabilitation Programs Page 70 of 95
No. Performance Indicator
Measure Concern Domain Data Source
13 Extent of hours worked per
week in gainful employment by people who need support.
Total number of hours worked in gainful employment by people who need support, ÷number of people in the program who need support.
Attachment to Labor Market
Outcome Administra-tive Records
14 Retention of earnings at a specified point (e.g., 12 months) of employment.
Number of people who retained earnings after specified point ÷total number of participants.
Earnings and Relative Gain in Income
Outcome Consumer Survey Item
15 Positive change in earnings as a result of the program.
Number of people with increase in earnings at the end of the index period ÷number of people in the program.
Earnings and Relative Gain in Income
Outcome Administrative Records
16* Comparability of earning rates of person served with those of general populations.
The number of people whose earning rates are equal to or higher than the average earning rate of the general population, ÷ total number of people with earnings in the program.
Earnings and Relative Gain in Income
Outcome Unemployment Information System, Social Security, Regional Wage Rate Data
17 Participation of persons served in community activities.
Number of people who participate in at least one community activity in the index period, ÷total number of people in the program.
Community Inclusion
Outcome Consumer Survey item
18* Degree to which people are able to perform Activities of Daily Living.
The number of people with a set score on an ADL assessment ÷total number of participants.
Independence and Self Sufficiency
Outcome ADL Assessment Tools
19 Reduced reliance on disability-specific funding sources.
The number of people with a decreased reliance ÷ total number of participants.
Independence and Self Sufficiency
Outcome Assistance Program Records,

Performance Indicators for Rehabilitation Programs Page 71 of 95
No. Performance Indicator
Measure Concern Domain Data Source Survey
20 Degree to which people are in control of their own resources.
The number of people responding positively to survey questions regarding control of resources ÷ total number of survey responses.
Independence and Self Sufficiency
Outcome Consumer Survey
21 Degree to which people are living where they choose.
The number of people responding positively to a consumer survey item (e.g. Did you choose your current residence?), ÷ total number of survey responses.
Independence and Self Sufficiency
Outcome Consumer Survey
22 Degree to which consumers report feelings of improved self-worth.
The number of positive responses to a survey question regarding feelings of self worth ÷ number of survey responses. E.g. Arkansas self concept/self worth/self perception; focus groups.
Esteem and Self-Worth
Outcome Consumer Survey
23* Degree to which consumers reporting freedom from distress.
The number of negative responses to a survey question regarding the presence of feelings of distress ÷ total number of survey responses.
Esteem and Self-Worth
Outcome Consumer Survey
24 Degree to which people report realistic opportunities for making individual
The number of positive responses to a survey question ab out the consumers’ feelings of choice ÷ total number of survey responses.
Self Advocacy
Outcome Consumer / Independent Surveys

Performance Indicators for Rehabilitation Programs Page 72 of 95
Chapter 6 Candidate Performance Indicators in Medical Rehabilitation This chapter presents the candidate indicators that emerged from the work of the Working Conference on Performance Indicators and the Performance Indicators Advisory Council. Participants were challenged with two key questions.
The Central Questions
o What would a stakeholder want to know about a program’s performance in order to assess its quality and choose among programs?
o How should these performance indicators be quantified and specified in such a way that stakeholders can know they are looking at comparable information from different programs?
Working outlines were provided to guide the considerations, but the three division-based groups working separately generated their ideas in somewhat different formats. In order to prepare candidate indicators within a common framework for CARF, our staff "massaged" the raw material of all ideas generated by the working groups into the candidate indicators consistent with the conceptual framework outlined in this monograph. Care was taken not to eliminate any suggestion made by the group, no matter where the ideas appeared in the working materials from the conference. We have chosen to be inclusive even when there is some redundancy so that the field may consider alternatives. In places where the working groups were split or unsure about the feasibility of an indicator, we have marked the indicator as one of secondary importance. This did not mean that the indicator was unimportant, but that in limiting the number of indicators, these would be the ones to omit or defer.

Performance Indicators for Rehabilitation Programs Page 73 of 95
The number of candidate indicators that follows is high. It is expected that a final set will contain many fewer key indicators, especially when issues of feasibility and reliability of measurement are considered. However, we also believe that the array of concerns and indicators offered here provide a valuable glimpse of the thinking—and substantial consensus—of a diverse group of stakeholders.
Table 6a lists indicators grouped by domain and topic of concern. The indicators also reflect the multiple domains of access, structure, process, outcome, and efficiency/value. Table 6b summarizes the candidate indicators, possible measures or examples of measures, the concerns and domains they represent, and potential data sources.

Performance Indicators for Rehabilitation Programs Page 74 of 95
Table 6a Candidate Medical Rehabilitation Performance Indicators
Domain Concern Indicators¥ Track record, organization’s capacity to provide services
1. Numbers served by: rehab problem impairment group severity type of program age distribution
2. Length of program by type of persons
served, by type of program (IP, OP, residential)
3. Staff credential rates 4. Rate of staff continuing education—
average number of CE days/employee 5. Accreditation status
Prog
ram
des
crip
tor
Cost of care 6. Average cost of care per case
Acc
ess Access to care 7. Denial rate
8. Time from referral to assessment 9. Time from assessment to first
treatment
Cost of care 10. Average cost of care per service day (inpatient services)
11. Average cost of care per unit of service
12. Average cost to consumer (person served)
Satisfaction 13. Rate of satisfaction with processes of care
Proc
ess
Stakeholder communication
14. Percentage of stakeholders satisfied with the information required to make decisions

Performance Indicators for Rehabilitation Programs Page 75 of 95
Domain Concern Indicators¥
Proc
ess
Provider/payer partnerships
15. Percentage of providers satisfied with clinical practice approaches agreed to/outcomes planned
16. Percentage of payers satisfied with clinical practices approaches agreed to/outcomes planned
17. Percentage of providers and payers satisfied with the timeliness of information exchanged
18. Percentage of providers satisfied with the quality of information exchanged
19. Degree of rish-sharing between payer and provider
20. Percentage of providers satisfied with decision-making procedures with payers
21. Percentage of providers satisfied with resource allocation
22. Percentage of payers satisfied with decision-making procedures with providers
23. Percentage of payers satisfied with resource allocation
Improved function 24. Severity-adjusted percentage of persons served who improve functional status from admission to discharge
25. Severity-adjusted distribution of discharge functional status
Durability of outcomes 26. Percentage of persons served who maintain outcomes from discharge to follow-up
Productivity and participation
27. Percentage of persons served returned to age-appropriate activities
28. Percentage of persons served in inpatient program discharged to community
Value-comparative outcomes
29. Ratio of provider to benchmark values on key outcomes (where available)
Out
com
e
Satisfaction 30. Rate of satisfaction with results of care

Performance Indicators for Rehabilitation Programs Page 76 of 95
Domain Concern Indicators¥
Eff
icie
ncy/
valu
e Value of outcome to cost 31. Rate of functional gain relative to resource utilization (efficiency)
32. ¥All indicators should use measures that are adjusted for risk or severity

Performance Indicators for Rehabilitation Programs Page 77 of 95
Table 6b. CARF Performance Indicators / Medical Rehabilitation
No. Performance Indicator Possible Measure(s) ‡ Concern Domain Data Source
1 Numbers served by:
• rehab problem • impairment group • severity • type of program • age distribution
Frequency tables using standardized coding categories; N served last 12 months, or latest fiscal year
Track Record, Organization Capacity
(Program descriptor)
Administrative data system
2 Length of program by type of persons served, by type of program (IP, OP, residential)
Mean LOS, n of visits, length of residence, by type of program
Track Record, Organization Capacity
(Program descriptor)
Administrative data system
3 Staff credential rates Proportion of staff with various credentials…(% distribution of licensed/ assistant / lay personnel; % MDs boarded in PM&R, etc)
Track Record, Organization Capacity
(Program descriptor)
Human resources records / data
4 Rate of staff continuing education—Average number of CE days / employee
Total number CE person-days ÷ number staff FTEs
Track Record, Organization Capacity
(Program descriptor)
Human resources records / data
5 Accreditation status CARF, JCAHO, NCQA, Others; Status, length of time accredited, expiration, level of accred. Etc.
Track Record, Organization Capacity
(Program descriptor)
Accrediting body / certificate

Performance Indicators for Rehabilitation Programs Page 78 of 95
No. Performance Indicator Possible Measure(s) ‡ Concern Domain Data Source
6 Average cost of care per case Total dollars spent on service provision ÷ number of persons served in index period (by impairment group)
Cost of Care (Program descriptor)
Encounter / financial data
7 Denial rate Percent of referrals not admitted or accepted for service
Access to Care Access Administrative data
8 Time from referral to assessment
Average number of days from referral to assessment
Access to Care Access Patient Survey, Financial and Administrative data
9 Time from assessment to first treatment
Average number of days from initial assessment to initial treatment.
Access to Care Access Patient Survey, Financial and Administrative data
10 Average cost of care per service day (inpatient services)
Total dollars spent on service provision ÷ number of person - days in index period
Cost of Care Process Encounter/ financial data
11 Average cost of care per unit of service
Total dollars spent on service provision ÷ number of person-units in index period (by type of service and impairment group)
Cost of Care Process Encounter / financial data
12 Average cost to consumer (person served)
Average out-of-pocket expenses required for services, by type of service ÷ program and type of health plan
Cost of Care Process Encounter / financial data and/or consumer survey

Performance Indicators for Rehabilitation Programs Page 79 of 95
No. Performance Indicator Possible Measure(s) ‡ Concern Domain Data Source
13 Rate of satisfaction with processes of care
Percent of persons served who say they are satisfied with processes of care
Satisfaction Process Consumer survey
14 Percent of stakeholders satisfied with information required to make decisions
Percent responding (x) to questions (y) on survey questionnaire
Stakeholder communications
Process Consumer survey
15 Percent of providers satisfied with clinical practice approaches agreed to / outcomes planned
Percent of provider representatives responding (x) to questions (y) on survey
Provider / payer partnerships
Process Provider survey
16 Percent of payers satisfied with clinical practice approaches agreed to / outcomes planned
Percent of payer representatives responding (x) to questions (y) on survey
Provider / payer partnerships
Process Payer survey
17 Percent of providers and payers satisfied with timeliness of information exchanged
Percent of provider and payer representatives responding (x) to questions (y) on survey
Provider / payer partnerships
Process Provider / payer survey
18 Percent of providers and payers satisfied with quality of information exchanged
Percent of provider and payer representatives responding (x) to questions (y) on survey
Provider / payer partnerships
Process Provider / payer survey
19† Degree of risk-sharing between payer and provider
Number and types of risk-sharing arrangements used in past 12 months; frequency of use
Provider / payer partnerships
Process Admin / financial records

Performance Indicators for Rehabilitation Programs Page 80 of 95
No. Performance Indicator Possible Measure(s) ‡ Concern Domain Data Source
20† Percent of providers satisfied with decision-making procedures with payers
Percent of provider representatives responding (x) to questions (y) on survey
Provider / payer partnerships
Process Provider survey
21† Percent of providers satisfied with resource allocations
Percent of provider representatives responding (x) to questions (y) on survey
Provider / payer partnerships
Process Provider survey
22† Percent of payers satisfied with decision-making procedures with providers
Percent of payer representatives responding (x) to questions (y) on survey
Provider / payer partnerships
Process Payer survey
23† Percent of payers satisfied with resource allocations
Percent of payer representatives responding (x) to questions (y) on survey
Provider / payer partnerships
Process Payer survey
24 Severity-adjusted percent of persons served who improve functional status from admission to discharge
Impairment
Disability
Perception of Health
Life Satisfaction
Improved function
Outcome Outcome data system
[expand]
25 Severity-adjusted distribution of discharge functional status
Percent of persons who reach x level of function at discharge, ÷ adjusted by admission function and impairment group
Improved function
Outcome Outcome data system
[expand]

Performance Indicators for Rehabilitation Programs Page 81 of 95
No. Performance Indicator Possible Measure(s) ‡ Concern Domain Data Source
26 Percent of persons served who maintain outcomes from discharge to follow-up
Example:
Total [scale score] at f/u = or > than at d/c
[Wide variety of tools, e.g., FIM, FAM, CHART, SF36, CIQ, etc]
(Risk adjusted and age groups)
Durability of Outcomes
Outcome Outcome data system
27 Percent of persons served returned to age-appropriate activities
CIQ
CHART
SF-36
Work status (to be determined)
School [under 18]
Other activities
Pre-morbid / current status comparison
Productivity and participation
Outcome Outcome data system / follow-up
28 Percent of persons served in inpatient program discharged to community
Number of persons discharged to home or other community setting divided by total number served (by impairment and program type)
Productivity and participation
Outcome Outcome data system
29 Ratio of provider - to - benchmark values on key outcomes (where available)
Return to work
Functional status at discharge
Value—Comparative Outcome
Outcome Outcome data system

Performance Indicators for Rehabilitation Programs Page 82 of 95
No. Performance Indicator Possible Measure(s) ‡ Concern Domain Data Source
Functional gain admission to discharge
30 Rate of satisfaction with results of care
Percent of persons served who say they are satisfied with results of care
Satisfaction Outcome Consumer survey
31 Rate of functional gain relative to resource utilization (efficiency)
Average change in function [measure] ÷ average [resource measure]
Value—Outcome to Cost
Efficiency / Value
Outcome data system
† Secondary importance
‡ All indicators should be adjusted for risk or severity; future reviews of candidate indicators will address specific needs.

Performance Indicators for Rehabilitation Programs Page 83 of 95
Chapter 7 Conclusion Themes and Next Steps
The draft set of indicators presented here is just a beginning. We recognize that more input from consumers and the field is needed to refine the concerns and indicators; that alternative measures and data elements must be outlined; that specifications for data collection and calculation of indicators must be detailed; that candidate indicators and measures must be reviewed against criteria to ensure their validity and reliability; and that experience with using the indicators by the field is needed. Version 1.1 of CARF’s rehabilitation performance indicators will be modified—and almost certainly scaled down substantially—by input we solicit from consumers and professionals in the rehabilitation field.
Themes
Predictably, the three arenas of rehabilitation represented here identified some diversity in the content of performance indicators suggested, but reflected some common themes as well. All three have concerns about:
o Access to services by persons served and organizational capacity to deliver
o The involvement of persons served and their representatives in the planning and implementation of services
o Health and safety for persons served o Maximal independence and self-sufficiency for persons served o Community inclusion and participation by persons served o Productive activity in society for persons served o Consumers’ satisfaction with services (process and outcome) o Value of services to all stakeholders

Performance Indicators for Rehabilitation Programs Page 84 of 95
These themes are not surprising and not substantially different from some of the topics addressed in CARF’s accreditation standards. Yet this list is significant when one recalls that these are suggestions for quantifiable indicators that would entail uniform data collection and the compiling of information that would be available to consumers seeking services and their sponsors. Our challenge is the continuation of work to further refine these candidate indicators, to identify appropriate measures, and to transform these suggestions into specifications for indicator calculations. Whether some of the indicators can be specified in a meaningful way for all divisions’ fields is an open question.
Input from Consumers and the Field
A crucial element of the indicators development process is substantial input from the consumer community—persons served, their families and advocates. After all, the ultimate goal of using performance indicators is the assurance and provision of information about the quality of programs. Payers, policy makers, professionals and providers ideally share this goal, and thus are most interested in gathering data on those indicators of interest to consumers.
We plan a set of targeted activities to ensure that the next draft of an indicator set truly highlights those items of keenest interest to consumers and that those items can be expressed and specified in understandable ways. A consumers’ invitational conference will be held, paired with solicitation of feedback from individuals and consumer groups via this monograph and the interactions CARF national directors have almost constantly with the field.
This monograph is being widely distributed. We will count on the advice and the extensive networks of our Working Conference and Advisory Council participants, as well as our Board of Trustees, surveyors and organizations with accredited programs or services ensure that we interface appropriately with other performance indicator efforts and that we tap all the appropriate avenues for input by our stakeholders.
Anyone wishing to comment is invited to contact CARF. A feedback form is provided at the end of this report to facilitate that process.

Performance Indicators for Rehabilitation Programs Page 85 of 95
Refining Indicators
Next steps in refining an indicator set suggest multiple activities. Aside from field input, we must continue the technical review of candidate indicators. Following the next round of comment from consumers and the field, CARF staff, the Advisory Council, and other technical reviewers will evaluate the indicator set with respect to the criteria we have listed. This process is expected to further refine the set and to identify in a concrete way, a set of indicators in which an organization could feasibly collect information and report to its stakeholders. We also expect the criteria review process will identify gaps in our knowledge and areas needing further technical research and development or field-testing.
To the extent possible, we want to ensure that indicators identified by CARF will be either identical or complementary to other major indicator sets. This will undoubtedly require additional work to crosswalk candidate indicators with other systems.
The issue of feasibility and practicality for data collection and reporting by rehabilitation providers is a crucial one. Testing the implementation and the scientific soundness of any indicator set can be a major undertaking. We will be looking to input from the field and our Advisory Council to guide progress in this area.
All these activities require resources. It will be part of our refinement efforts to identify resource needs and work to attract the resources necessary to support continued work on performance indicators for rehabilitation. Our theme of collaboration with the field in practical and useful ways will continue.

Performance Indicators for Rehabilitation Programs Page 86 of 95
Appendix Vision Statement, Strategic Outcomes Initiative
CARF’s vision for Goal I of its Strategic Plan is to enhance the value of accreditation to direct consumers of the accreditation product—providers, payors, and agency sponsors of rehabilitation services. We believe that ultimately the beneficiaries of accreditation are persons with disabilities and others in need of rehabilitation.
We strive to continually improve CARF’s services and products. We are implementing a program of accreditation research as a mechanism to help guide our quality improvement efforts.
We see ourselves as a major resource on rehabilitation outcomes measurement and management. CARF’s Strategic Outcomes Initiative, as a part of Strategic Plan Goal I, is an organized mechanism to reach this goal.
We believe that consumers and providers of rehabilitation services will benefit from valid and reliable information about outcomes of care and the utilization of outcomes information in quality improvement efforts. The rehabilitation field should take the initiative in defining consistent, valid, reliable, feasible, and acceptable quality indicators for communicating the results of rehabilitation care. We see ourselves as a major collaborator in identifying such quality indicators.
We see ourselves as a catalyst for organizations to improve the quality of their services using, in part, outcome measurement and management techniques. We envision the use of education, technical assistance, documents and, ultimately, the accreditation standards themselves, as means to this end.
We believe that outcome data should be used, not simply collected without practical application. However, outcome data, to be used effectively and credibly, must be reliable, valid, and accurate. We see ourselves, therefore, as facilitating the practical application of outcomes measurement science to the day-to-day delivery, management, and improvement of rehabilitation services.

Performance Indicators for Rehabilitation Programs Page 87 of 95
We believe in building upon the substantial already-developed resources, where they exist, for outcome measurement, management, and comparative information. We see ourselves as encouraging the use of these resources in a valid and equitable manner, and as facilitating understanding among accredited organizations about what constitutes useful measures, systems, and approaches. Where there are gaps in available tools or data, we support and urge the development of such resources from within the field.
We see ourselves in partnership with consumers, providers, payors, policy- makers, other accrediting bodies, outcome data and information service providers, and public and private entities to forge the consensus necessary for a CARF outcomes focus. Part of the Strategic Outcomes Initiative will be to help educate these constituents on outcomes issues.
7/15/96

Performance Indicators for Rehabilitation Programs Page 88 of 95
Glossary of Terms
Concern Expressible as a value statement; a general category of issues; may encompass several indicators; represents a value of interest to stakeholders; can be grouped into major areas or domains.
Construct validity
A situation in which a measuring instrument actually measures what it is intended to measure.
Data Element Field in a database; item in a scale or scale score; may constitute part or all of a measure; may reflect nominal, ordinal, interval or continuous values.
Denominator Population base from which the indicator is calculated; represents the group of interest for a specific indicator.
Disability The consequences of impairment in terms of an individual’s functional performance and activity. Disabilities represent disturbances at the level of the person. (This is the official definition from the World Health Organization’s International Classification of Impairments Disabilities, and Handicaps, 1980.)
Domain Major areas or categories of interest, e.g., access, structure, process, outcome. Broad groupings of concerns.
Effectiveness (1) Objective measures of outcomes for persons served, or
(2) Goal attainment rates for outcome goals of persons served.
Efficiency The relationship between outcome achieved and resources used to achieve them. This definition makes no assumptions that lower resource use better, but that a higher ratio of outcome to resource use is better. Sometimes resource use alone is used as an efficiency indicator (e.g., times, units of service, cost) where it is assumed that lower values are necessarily better.
Face validity A situation in which a measuring instrument intuitively appears

Performance Indicators for Rehabilitation Programs Page 89 of 95
to be measuring what is supposed to or designed to measure.
Handicap The disadvantages experienced by an individual as a result of impairments and disabilities. Handicaps reflect interaction with and adaptation to the individual’s surroundings. (This is the official definition from the World Health Organization’s International Classification of Impairments, Disabilities, and Handicaps, 1980.)
Impairment An abnormality of body structure, appearance, and organ or system function resulting from any cause. In principle, impairments occur at the organ level. (This is the official definition from the World Health Organization’s International Classification of Impairments, Disabilities, and Handicaps, 1980.)
Indicator Quantitative expression used to point to program quality; expressed as rate, ratio, percentage; may include reference to a general concept (e.g., health status); includes or implies numerator and denominator of an expression. Something CARF can endorse or support.
Measure Specific instrument or scale; may be a composite score or a single data element; refers to specifically defined quantities (e.g., SF-36 total score); relates primarily to numerator of the indicator expression. CARF does not endorse one over another.
Numerator Count or frequency of occurrence of the process or outcome; reflects number of persons matching a specified value on a measure.
Outcome Results or end points of service or status achieved by a person served by a defined point following delivery of services.

Performance Indicators for Rehabilitation Programs Page 90 of 95
Person served The primary consumer of services, whom may be defined as a client, participant, or resident. When this person is legally unable to exercise self-representation at any point in the decision-making process, person served is interpreted to also refer to those authorized to make decisions on behalf of the primary consumer. These individuals may include, as appropriate, family members, significant others, legal representatives, guardians, and/or advocates. The organization should have a means by which a legal representative of the primary consumer is invited to participate at appropriate points in the decision-making process. By the same token, a person who is legally able to represent his/her own interests should be granted the right to choose whether other members of the family, significant others or advocates may participate in that decision-making process.
Process Activities and services, treatments, or interventions provided, and resources used in the provision of service. What is done with and for the person served.
Rehabilitation The process of providing those comprehensive services deemed appropriate to the needs of persons with disabilities in a coordinated manner in a program designated to achieve objectives of improved health, welfare, and realization of the person’s maximum physical, social, psychological, and vocational potential for useful and productive activity. Rehabilitation services are necessary when a person with a disability is in need of assistance and it is beyond the person’s capacities and resources to achieve his/her maximum potential for personal, social, and economic adjustment and beyond the capabilities of the services available in the person’s usual daily experience. Such assistance continues as long as the person makes significant and observable improvement.
Reliability The process of obtaining information or data in a consistent or reproducible manner, usually when the process is administered under similar circumstances.
Risk A statistical process for reducing the effects of confounding

Performance Indicators for Rehabilitation Programs Page 91 of 95
adjustment variables that influence outcomes in cross-program comparison.
Satisfaction Satisfaction with outcome achieved – Opinion of a stakeholder regarding the outcome of service delivery from the stakeholder’s point of view.
Satisfaction with the service delivery process – Opinion of a stakeholder regarding the processes of service delivery from the stakeholder’s point of view. Often included in the outcome domain, taking the view that consumer satisfaction itself is an outcome of care, regardless of the target (structure, process or outcome) of the satisfaction.
SCoRSSM Standards Conformance Rating System, a rating system developed by CARF for use in CARF accreditation surveys.
Stakeholders The persons and/or families served by the organization; the organization’s governance authority, designated authority, executive and operational leadership; personnel, and various publics, including purchasers of service, contributors, supporters, employers, landlords, other community business interests, etc.
Structure Physical and organizational arrangements that provide a framework for activities of service provision to take place. This includes the building or site for services, organization chart, and administrative policies that support the service process.
Value The degree to which the processes, outcomes, resources used, efficiency, experience, and level of satisfaction match the expectations of the stakeholder making the assessment.

Performance Indicators for Rehabilitation Programs Page 92 of 95
Selected Bibliography Morris, John, Ph.D., Ed. 1997. Preserving Quality and Value in the Managed Care Equation: Final Report of the Santa Fe Summit on Behavioral Health Care. Pittsburgh, Penn.: American College of Mental Health Administration.
Center for Managed Long Term Supports for People with Disabilities. 1998. Core Indicators Project: A project of HSRI and NASDDDS. Cambridge, Mass.: Human Services Research Institute. http://www.hsri.org/manage/core.html
Center for Quality of Care Research & Education, Harvard School of Public Health. 1996. Conquest 1.0: A Computerized Needs-Oriented Quality Measurement Evaluation System. Boston: Harvard School of Public Health.
Human Services Research Institute. 1996. Analysis of Outcome-Based Quality Assurance Systems: Task A Report. Cambridge, Mass.: Human Services Research Institute.
Human Services Research Institute. 1996. The Identification and Development of Quality Indicators for Intermediate Care Facilities and Other Comparable Arrangements for Persons with Mental Retardation. Cambridge, Mass.: Human Services Research Institute.
Joint Commission on Accreditation of Healthcare Organizations. 1997. National Library of Healthcare Indicators: Health Plan and Network Edition. Oakbrook Terrace, Ill.: Joint Commission on Accreditation of Healthcare Organizations.
Mental Health Statistics Improvement Program. 1996. The MHSIP Consumer-Oriented Mental Health Report Card. The Final Report of the Task Force on a Consumer-Oriented Mental Health Report Card. (Collaborative effort of consumers, the MHSIP community, and the Center for Mental Health Services, Substance Abuse and Mental Health Services Administration). (No location given): Mental Health Statistics Improvement Program.
Michigan Department of Community Health Division of Quality Management & Service Innovation. 1997. Michigan’s Mission-Based

Performance Indicators for Rehabilitation Programs Page 93 of 95
Performance Indicator System for Persons with Mental Illness, Developmental Disabilities, and Emotional Disturbances: Initial CMHSP Performance Report. Lansing, Mich.: Michigan Department of Community Health, Division of Quality Management and Service Innovation.
National Committee for Quality Assurance. 1997. HEDIS 3.0: Volume 1 Understanding and Enhancing Performance Measurement and Volume 2 Measurement Specifications. Washington, D.C.: National Committee for Quality Assurance.
The Research Committee of the International Association of Psychosocial Rehabilitation Services. (No date given). Measuring Psychosocial Rehabilitation Outcomes. Cambridge, Mass.: Human Services Research Institute.

Performance Indicators for Rehabilitation Programs Page 94 of 95
Comments on CARF Performance Indicators Version 1.1 Please complete the following survey or forward any comments on this monograph to CARF, Research & Quality Improvement Via E-mail: [email protected] Via Fax: (520) 318-1129 Via Mail: 4891 East Grant Road, Tucson, AZ 85712 Please include the division and number of any specific candidate indicators you are commenting on, as well as your division affiliation with CARF, if any. We appreciate your input in this very important project. Thank you for your interest in CARF.

Performance Indicators for Rehabilitation Programs Page 95 of 95
Comments on CARF Performance Indicators Version 1.1 Survey Work Group: ________________________________________ Candidate Indicator
Number Your Vote
Keep Drop Edit Comments
General Comments: _____________________________________________________________________________________________________________________________________________________________________ Your Name: _______________________________________________________ Your Organization: _______________________________________________________ Telephone Number: _______________________________________________________ E-mail Address: _______________________________________________________ Thank you for your input! Please return this form to:
CARF, Research & Quality Improvement 4891 E. Grant Road, Tucson, AZ 857i12
FAX 520-318-1129


![Occupational Rehabilitation Programs Presented by: [name]](https://static.fdocuments.us/doc/165x107/5a4d1af77f8b9ab059982005/occupational-rehabilitation-programs-presented-by-name.jpg)