
Performance Improvement Project Selection - Iowa a SIPOC diagram. 6. Project ... benchmark • Staff...
26
Performance Improvement Project Selection Barbara Wilke, Improvement Advisor Program Specialist Telligen QIN QIO
Transcript of Performance Improvement Project Selection - Iowa a SIPOC diagram. 6. Project ... benchmark • Staff...

Performance Improvement Project SelectionBarbara Wilke, Improvement Advisor Program Specialist
Telligen QIN QIO
2
Why do we do this work?
“Between the health care we have and the care we could have lies not just a gap, but a chasm.”
- Institute of Medicine, Crossing the Quality Chasm, 2001
• Best-known science is not reliably applied• Widespread inefficiencies waste precious resources• Patients are being harmed at alarming rates
Source: Institute for Healthcare Improvement

3
QIN QIO & MBQIP Quality Measure Improvement Activities to date
Date Event Location
June 4, 2015 Introduction of QIN QIO alignment with MBQIP work
Prairie Meadows
December 10, 2015
New MBQIP Measure Review Conference Call
February 18, 2016
Outpatient Quality Improvement Initiative –Brady Allen, Telligen Intern(ID matching CMS & MBQIP OQR measures; understanding variation, rare event run charts)
CAH QI Coordinator Webinar
April 21, 2016
Patient & Family Centered Care – Brady Allen, Telligen intern (PFCC M/P, Shadowing Care Experience, Standard Work Mini Kaizen)
Hilton Garden Inn, West Des Moines
June 28, July 6, 7, 21 Aug 26
CAH QI Coordinator Regional Meetings Storm Lake, DM, Ottumwa, Waterloo, Atlantic
4
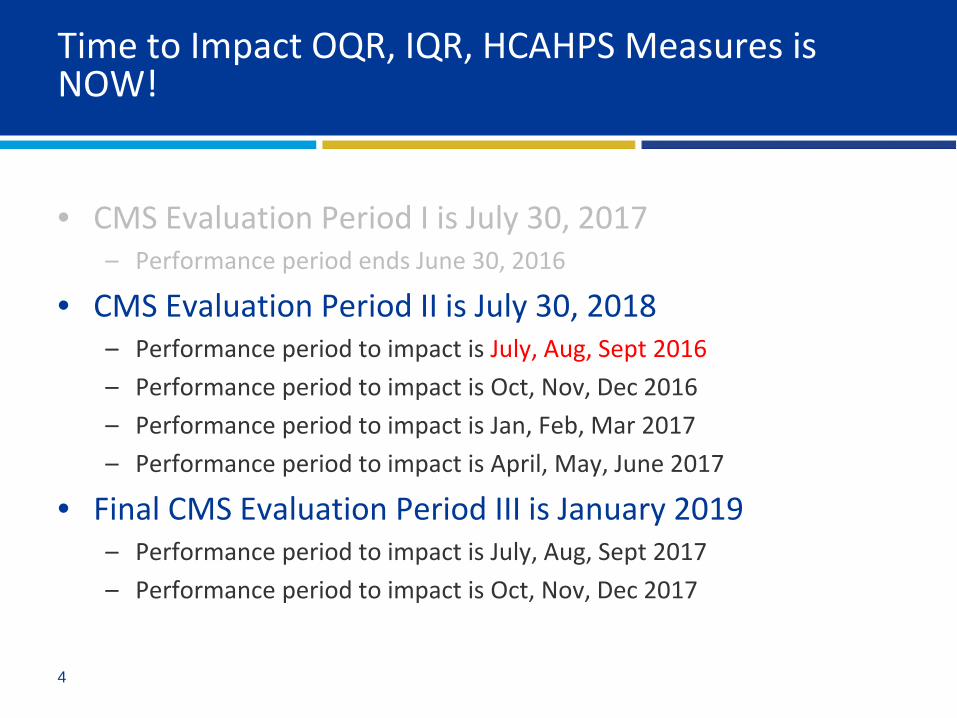
Time to Impact OQR, IQR, HCAHPS Measures is NOW!
• CMS Evaluation Period I is July 30, 2017– Performance period ends June 30, 2016
• CMS Evaluation Period II is July 30, 2018– Performance period to impact is July, Aug, Sept 2016– Performance period to impact is Oct, Nov, Dec 2016– Performance period to impact is Jan, Feb, Mar 2017– Performance period to impact is April, May, June 2017
• Final CMS Evaluation Period III is January 2019– Performance period to impact is July, Aug, Sept 2017– Performance period to impact is Oct, Nov, Dec 2017

5
Objective – By the end of this session
• Participants will have chosen a CMS/MBQIP measure to improve using a Prioritization tool
• Participants will demonstrate how to scope a project using a SIPOC diagram

6
Project Selection – sources of data
• Patient feedback• What does the data
say? Variance from benchmark
• Staff input• Family• Incident reports• Near misses• Unsafe conditions
• Survey deficiencies - DIA • CAH Dashboard or
Balanced Scorecard Key Performance Indicators
• ACO &/or Health System Dashboard KPIs
• Crosswalk of National Quality Initiative Measures
Presenter
Presentation Notes
Strategic alignment within the context of your CAH – look at your BSC or Dashboard for individual KPIs Crosswalk your CAH KPIs with State and National initiatives

7
Review the Data
• Star the CMS/MBQIP measures with a negative performance gap between current performance & benchmark
• Double star the CMS/MBQIP measures that match organizational, health system, ACO goals
• Circle the measures that overlap with MU Stage 2 CQMs, HEN, and QIN QIO initiatives
• Refer to the Prioritizing Performance Improvement Projects (PIPs) template
• Fill in the 1st column with the starred and circled CMS/MBQIP Measures

8
Prioritization Tool
Potential Area for Improvement
Preva-lence
Risk Cost Rele-vance
Respon-siveness
Respon-siveness
Feasibility Continuity Total
OP-1OP-2OP-3bOP-4OP-5OP-6OP-7EDTC-5
Directions: Score each area in the columns based on a rating scale of 1 to 5

9
Score each area in the following columns based on a rating system of 1 to 5:
Potential Area for Improvement –Consider areas identified through dashboards, feedback from staff, families, patients, other incidents, near misses, unsafeconditions, survey deficiencies.
Prevalence - The frequency at which this issue arises in our organization.
Example: hourly, daily, weekly, monthly, quarterly, annually, rarely, consistently
Risk - The level to which this issue poses a risk to the well-being of our patients.
Example: If this issue continues, it could cause direct harm to a patient(s) outcome, organizational liability to reputation or financial solvency.
Cost - The cost incurred by our organization each time this issue occurs. Cost of waste, errors/defects/rework/cycle time, impact to other's ability to do their work.
Relevance – The extent to which addressing this issue would affect patient quality of life &/or quality of care.
Example: Quality measures are most often process of care measures which impact the patient outcome.
OP-5
OP-21
1 = zero or none2 = little or some
3 = average or moderate4 = above average or somewhat high/easy5 = very high/easy or very impactful

10
Score each area in the following columns based on a rating system of 1 to 5:
Potential Area for Improvement –Consider areas identified through dashboards, feedback from staff, families, patients, other incidents, near misses, unsafe conditions, survey deficiencies.
Responsiveness –The likelihood an initiative on this issue would address a need expressed by patients, family or staff.
Example: extent this issue has direct impact on customer needs,attitudes and perceptions
Feasibility – The ability of our organization to implement a PIP on this issue given current resources.
Example: Entire organization involved in EMR upgrade or migration, 3 or more complex change management initiatives currently underway in the system impacted by this issue.
Continuity – The level to which an initiative on this issue would support organizational goals & priorities.
Example: This issue/project is critical success factor to a corporate or business objective.
Total Points
Maximum 35 points per project opportunity
In case of a tie –go back through and weight the importance of each category. Then calculate accordingly.
OP-5
OP-21
1 = zero or none2 = little or some
3 = average or moderate4 = above average or somewhat high/easy5 = very high/easy or very impactful

11
CAH Report Out – Target Measure to Improve
•
12
What are we trying to accomplish?
• Write a SMART goal:
Improve OP-5 Median time to EKG from 13 minutes to 7 minutes for people entering the ED by September 30, 2016.
Presenter
Presentation Notes
Identify each component of a SMART goal from this example Specific – Measureable – Attainable – Relevant – Time bound

13
How will we know change is an improvement?
• Outcome measure (the result):
• Process measure (Critical Success Factors):
• Balancing measure (check for unintended consequences):
Presenter
Presentation Notes
Critical success factors which need to happen to get the end result.

14
What can we change that will result in improvement?
• First, ask WHY is this happening! Don’t jump to solutions
• Run multiple rapid PDSA cycles to reach improvement goal – sustain the gain with standardization

15
Common Issues
• Abstraction processes• Documentation issues• Staff education
Source: Hospital Outpatient Outreach and Education Support Contractor, HSAG

16
Tips for Abstraction Processes
• Knowledgeable abstractors• Optimize your resources
– Specifications Manual– Q&A tool on QualityNet
• Develop processes to improve accuracy• Daily reports• Communication
Source: Hospital Outpatient Outreach and Education Support Contractor, HSAG

17
Documentation
• Reports– Identifying trends, variances, consistency issues
• Frontline staff input– Engagement of the staff
• Changes in the electronic documentation system– Adding assessments, check boxes, adding alerts
• Modifying standardized documentation
Source: Hospital Outpatient Outreach and Education Support Contractor, HSAG

18
Educating Staff
• Engage frontline staff– Continuous posting of progress– Newsletters – Pictures and graphs showing performance
• Staff meetings– Huddles
• Education to physicians, management, and administration
Source: Hospital Outpatient Outreach and Education Support Contractor, HSAG

19
Example Hospital #1: Problems
• OP-18b (reporting measure): Median Time from ED Arrival to ED Departure for Discharged ED Patients– Holding patients in the ED for the hospitalist evaluation– ED beds open, but triage nurse too busy to pull the patients to the
room– Documentation problems
Source: Hospital Outpatient Outreach and Education Support Contractor, HSAG

20
Example Hospital #1: Resolutions
• Changes implemented:– Administrative directive that patients would not be held in ED for
physician convenience– Prompt transfer to bed assignment– Redesign of the EMR ED record– Staff involvement in change decisions
Source: Hospital Outpatient Outreach and Education Support Contractor, HSAG

21
Next Steps: CAH QI Sharing Call in August 2016
• Sharing call to check in with each other to see what’s going well and lessons learned from PIP identified today
• An Iowa CAH will share their transparent QI/LEAN infrastructure to support continuous innovation & improvement through their empowered staff
• Anyone else have a prioritization process/system that works well for them? Please share! Let me know
• I’ll be conducting project status check-ins/Coaching

22
Contact Information
• Each other – who are your go to people?
• Barbara Wilke 515-223-2907– [email protected]
• Mary Beth Sorensen 515-273-8806– [email protected]
Thank you for joining the fun today!Happy 2016 Summer!!

23

24
Next Steps – Run the project
• Name who is going to Champion this particular PIP– Clinical Champion– Administrative Champion– Improvement Advisor – someone to help track and guide next
steps and bounce ideas from
• Define the beginning and the end of the process to improve
• Create a SIPOC – Supplier – Input – Process – Output - Customer
Presenter
Presentation Notes
I will follow up with you as you Run the Project – I have templates, tools and resources from running projects and coaching others in their projects to share with you as we go.

25
Next Steps continued…
• Flow chart the current process as it is today – observation• Ask why (x5) the quality measure is not meeting goal • Gather data to validate theory of root causes• Brainstorm solutions to eliminate root cause• Pick one intervention or test of change

26
Improvement to Process Control
• Plan the intervention – predict what you think will happen
• Do the test – gathering data• Study – do the results match the prediction?• Act – adopt, adapt or abandon the
intervention/change• Run Rapid Cycle Interventions until Quality Measure
outcome is achieved – then sustain with SOP, observation and monitoring
• Sustainment – we manage what we measure