Performance Impacts of Lower-Layer Cryptographic Methods in Mobile
50
SAND REPORT SAND2002-3340 Unlimited Release Printed October 2002 Performance Impacts of Lower-Layer Cryptographic Methods in Mobile Wireless Ad Hoc Networks B. P. Van Leeuwen and M. D. Torgerson Prepared by Sandia National Laboratories Albuquerque, New Mexico 87185 and Livermore, California 94550 Sandia is a multiprogram laboratory operated by Sandia Corporation, a Lockheed Martin Company, for the United States Department of Energy under Contract DE-AC04-94AL85000. Approved for public release; further dissemination unlimited.
Transcript of Performance Impacts of Lower-Layer Cryptographic Methods in Mobile

SAND REPORTSAND2002-3340Unlimited ReleasePrinted October 2002
Performance Impacts of Lower-LayerCryptographic Methods in MobileWireless Ad Hoc Networks
B. P. Van Leeuwen and M. D. Torgerson
Prepared bySandia National LaboratoriesAlbuquerque, New Mexico 87185 and Livermore, California 94550
Sandia is a multiprogram laboratory operated by Sandia Corporation,a Lockheed Martin Company, for the United States Department ofEnergy under Contract DE-AC04-94AL85000.
Approved for public release; further dissemination unlimited.

Issued by Sandia National Laboratories, operated for the United States Departmentof Energy by Sandia Corporation.
NOTICE: This report was prepared as an account of work sponsored by an agency ofthe United States Government. Neither the United States Government, nor anyagency thereof, nor any of their employees, nor any of their contractors,subcontractors, or their employees, make any warranty, express or implied, or assumeany legal liability or responsibility for the accuracy, completeness, or usefulness of anyinformation, apparatus, product, or process disclosed, or represent that its use wouldnot infringe privately owned rights. Reference herein to any specific commercialproduct, process, or service by trade name, trademark, manufacturer, or otherwise,does not necessarily constitute or imply its endorsement, recommendation, or favoringby the United States Government, any agency thereof, or any of their contractors orsubcontractors. The views and opinions expressed herein do not necessarily state orreflect those of the United States Government, any agency thereof, or any of theircontractors.
Printed in the United States of America. This report has been reproduced directlyfrom the best available copy.
Available to DOE and DOE contractors fromU.S. Department of EnergyOffice of Scientific and Technical InformationP.O. Box 62Oak Ridge, TN 37831
Telephone: (865)576-8401Facsimile: (865)576-5728E-Mail: [email protected] ordering: http://www.doe.gov/bridge
Available to the public fromU.S. Department of CommerceNational Technical Information Service5285 Port Royal RdSpringfield, VA 22161
Telephone: (800)553-6847Facsimile: (703)605-6900E-Mail: [email protected] order: http://www.ntis.gov/ordering.htm

3
SAND2002-3340Unlimited Release
Printed October 2002
Performance Impacts of Lower-LayerCryptographic Methods in Mobile Wireless Ad
Hoc Networks
Brian Van LeeuwenNetworked Systems Survivability and Assurance
Mark TorgersonCryptography and Information Systems Surety Department
Sandia National LaboratoriesP.O. Box 5800
Albuquerque, NM 87185-0785
Abstract
In high consequence systems, all layers of the protocol stack need security features. If networkand data-link layer control messages are not secured, a network may be open to adversarialmanipulation. The open nature of the wireless channel makes mobile wireless mobile ad hocnetworks (MANETs) especially vulnerable to control plane manipulation. The objective of thisresearch is to investigate MANET performance issues when cryptographic processing delays areapplied at the data-link layer. The results of analysis are combined with modeling and simulationexperiments to show that network performance in MANETs is highly sensitive to thecryptographic overhead.

4
This page intentionally left blank.

5
Contents
1. Introduction.............................................................................................................................71.1 Lower-Layer Data Security in MANETs........................................................................71.2 Report Overview.............................................................................................................8
2. Overview of MANET Lower-Layer Protocols........................................................................92.1 Network Layer.................................................................................................................92.2 Data-Link Layer ............................................................................................................13
3. Evaluation of Lower-Layer Protocols in MANETs ..............................................................163.1 Simulated Network Parameters.....................................................................................173.2 Modeling and Simulation Parameters Summary...........................................................21
4. Analysis and Simulations ......................................................................................................224.1 Link-Layer Data Transaction........................................................................................224.2 End-to-End Data Throughput ........................................................................................254.3 Optimal Zone Radius ....................................................................................................264.4 End-to-End Data Delay.................................................................................................334.5 Routing Table Convergence..........................................................................................36
5. Future Work...........................................................................................................................37
6. Conclusions ...........................................................................................................................38
7. References .............................................................................................................................40
8. Appendix A (Simulation Details)..........................................................................................438.1 Optimum Network Performance (OPNET):..................................................................438.2 Modeling and Simulating the Zone Routing Protocol:..................................................448.3 Modeling and Simulating the IEEE 802.11 MAC ........................................................488.4 Simulation Statistics Collection....................................................................................49
Figures
Figure 2.1: ZRP is included in the network layer and receives interprocess communication fromthe Neighbor Discovery Protocol (NDP) located in the data-link layer ........................................11Figure 2.2: ZRP with an IARP two-hop intrazone. .......................................................................13Figure 2.3: Wireless communication hidden terminal problem.....................................................14Figure 2.4: Media access control with virtual channel sense message exchange ..........................16Figure 4.1: Fraction of transceiver bandwidth available to node transmitting 64 byte packets ....24Figure 4.2: Fraction of transceiver bandwidth available to node transmitting 1518 byte packets 25Figure 4.3: IARP control packets increase as the zone radius is increased ...................................27

6
Figure 4.4: IERP control packets decrease as the zone radius is increased...................................28Figure 4.5: Total ZRP control packets as a function of the zone radius........................................28Figure 4.6: Optimal zone radius dependence on application-layer traffic.....................................31Figure 4.7: Simulations are done with both orderly node placement and random node placement.......................................................................................................................................................31Figure 4.8: Total ZRP control traffic with both an orderly lattice initial node position and arandom initial node position..........................................................................................................32Figure 4.9: Node 2 transmitting data packets to Node 44..............................................................33Figure 4.10: Time to deliver a number of application-layer packets from Node 2 to Node 44 witha two-hop radius and six-hop radius ..............................................................................................34Figure 4.11: Impacts of link-layer cryptography on low application-layer traffic ........................34Figure 4.12: Impacts of link-layer cryptography on medium application-layer traffic .................35Figure 4.13: Impacts of link-layer cryptography on high application-layer traffic .......................35Figure 4.14: Time for protocol to complete proactive region routing table(Note: No and 1ms Delay curves are virtually identical)...............................................................36Figure 8.1: Model of MANET node ..............................................................................................44Figure 8.2: Movement object moves nodes in random direction during simulation.....................45Figure 8.3: Traffic generation process object ................................................................................46Figure 8.4: Simulation process blocks that incorporate link-layer cryptographic overhead .........47Figure 8.5: Elements that are modeled in the OPNET Radio Channel [32] ..................................48
Tables
Table 3.1: Application-layer traffic generation..............................................................................19Table 3.2: Execution time for various signature algorithms ..........................................................20Table 3.3: Simulation parameters ..................................................................................................22Table 4.1: Time to transmit packets at the given data rates...........................................................23Table 4.2: Final throughput available after cryptographic processing time, channel contention,and path length are considered (considers a 10 MHz channel)......................................................29

7
1. Introduction
Mobile Ad Hoc Networks (MANETs) are self-organizing networks that do not depend on a fixedcommunication infrastructure and are made up of mobile nodes that communicate via a wirelesschannel. The mobile nodes are typically resource constrained, have limited transmit capability,and in many cases have poor antenna placement resulting in limited communication range. AMANET overcomes these limitations by having its nodes assist each other by forwardingmessages to their destinations. Since these nodes are mobile, the relay points are not stationary.The network must have mechanisms to maintain a current view of the dynamic networktopology. Routing protocols are employed in MANETs to acquire enough topologicalinformation to allow application layer message delivery. Routing protocols depend on anexchange of routing information between network nodes.
MANETs exist to deliver application-layer data. If the integrity of the routing messages iscompromised, then the network may suffer in its ability to transport data. Thus, methods must beemployed to protect the integrity of the routing messages.
The research community has directed a great deal of attention toward the development ofefficient routing protocols for MANETs [4, 7, 12, 15, 20, 37, 38, 39]. However, only recentlyhave efforts been directed toward the development of secure routing methods [8, 10, 17, 18, 19,33, 38, 43]. We do not discuss the security claims of any security method. This researchexamines security features from an efficiency point of view. We examine network performanceissues that arise from increasing message sizes to account for authentication as well as thoseissues associated with applying processing delays of standard security protocols to routingmessages. Our findings indicate that in many cases cryptographic delays destroy networkfunctionality.
1.1 Lower-Layer Data Security in MANETs
MANETs communicate over an open wireless channel, which provides no physical protection tothe data flows. Adversaries may acquire the data flows from places that are outside the physicalcontrol of the network and may do so with little chance of being detected. In many environmentsthe protection of application-layer is sufficient for the needs of the network. However, there is awealth of information to be found in the messages that originate at the lower layers of the OSIprotocol stack. An adversary may passively monitor the network to determine its logicaltopology, determine critical nodes and their function. In a more active sense, an adversary maylisten to network traffic, record and replay transmissions, and possibly inject false controlinformation within the network. A MANET that does not secure its routing messages can berendered non-functional when an adversary injects false topological information into the network[41]. In environments where a high-level of information security is required, all aspects of thenetwork communications must be protected. In particular, data security features such as digitalsignatures and/or encryption must be applied to the lower-layer messages.
Wireless networks have special needs that require special solutions. Because of the open channeland resource constraints, security solutions that apply to wired networks do not necessarily have

8
utility in the wireless environment. Mobile nodes contend for a limited communication channeland may operate with extreme resource constraints. They have limited channel capacity, batterypower, processing power, memory, etc. Because of these constraints, mobile devices tend to haveoperating systems and other software applications that are pared down to minimal size resultingin limited capabilities.
The resource constraints found in wireless networks are at odds with the fact that cryptographicprimitives tend to be resource hungry. Authentication and/or encryption procedures consumetime, computational resources, and have a bandwidth overhead. The addition of cryptographicprocessing delays and bandwidth overhead of appended signatures to application-layer trafficmay not terribly inconvenience the users of the network. However, control messages aretypically short and may be large in number. The functionality of the network depends on the factthat these control messages must be delivered and processed in near real-time. Significant delaysand/or size overhead in these messages can negatively impact their temporal requirements.Further, cryptographic overheads incurred on the control messages may cause networkcongestion that causes unacceptable delays in the higher-layer messages. One must carefullyanalyze the needs of the network’s lower-layer protocols to understand how cryptographicoverhead and delays placed on control messages impact network throughput.
In general, the actions that can be taken in a MANET to prevent an adversary fromcompromising the network by protecting the data transmission fall into two categories [1]:
1. Prevent the transmission over the wireless medium from being detected through the use ofphysical-layer techniques.
2. Protect transmitted data with cryptographic techniques.
A wireless network may incorporate physical-layer techniques such as spread-spectrummodulation, power control, directional antennas, etc to make it more difficult to detect andmanipulate data transmitted over a wireless channel. However, completely eliminating thepossibility to detect the signal is impossible. Thus, cryptographic techniques play an importantrole in providing data security in a MANET.
1.2 Report Overview
In Section 2 we provide a description of lower-layer protocols used in MANETs. A descriptionof the general aspects for the lower-layer protocols is presented and then a discussion of theparticulars of the protocols that we chose for our simulations is provided. Section 3 provides adiscussion of the performance criteria our analysis and simulations investigated. The section alsoincludes a discussion on the parameters that are used in the simulation models and anexplanation addressing their importance. Section 4 presents our analysis and simulation results.Sections 5 and 6 describe possible future work and conclusions, respectively. Finally, we includeAppendix A that provides a short description of the modeling and simulation environment usedin our research and details on the specific models used.

9
2. Overview of MANET Lower-Layer Protocols
This section gives a detailed description of important aspects the network layer, the zone routingprotocol, the media access layer, and the IEEE 802.11 media access approach. Those familiarwith these topics may wish to skip to Section 3.
Protocols to support MANET operation are located in the lower layers of the Open SystemsInterconnect (OSI) model for telecommunication protocols. MANET methods are implementedin the network, data-link, and physical layers. The network layer includes the routing protocol.The data-link layer includes the Neighbor Discovery Protocol (NDP) and the Media AccessControl (MAC) protocol. The physical layer addresses the transfer of data across the physicalmedium. Other than efficiency issues that impact the effective data rate, we do not addressphysical layer protocols. We focus on the network and data-link layer protocols, and refer tothese two layers as the lower layers. By upper layers, we mean the layers that lie above thenetwork layer in the OSI model.
Below we describe general aspects for the lower-layer protocols and then discuss the particularsof the protocols that we chose for our studies. There are several different MANET lower-layerprotocols to choose from, each with its unique set of operational and computational aspects. Theprotocols selected provide a sample of ordinary MANET operation.
2.1 Network Layer
The network layer provides routing support for MANETs. Many different MANET routingprotocols have been proposed [37]. These are divided into three categories based on the overallapproach to establishing and maintaining a view of the network topology. The three categoriesare (1) proactive, (2) reactive, and (3) hybrid. Proactive routing protocols attempt to maintainrouting tables that continuously reflect the current state of the network’s view of its topology.Proactive approaches act independent of any application-layer traffic. The primary goal is tohave an up-to-date route to each destination. This route is based on the node’s current view of thenetwork topology. In contrast, reactive routing responds to the demands of the upper-layertraffic. No routes are determined until an upper-layer request is made. Hybrid approaches torouting include both a proactive and a reactive region that together support the routedetermination procedure.
The advantage of a proactive approach is that when a multihop route is needed, a routing table isinquired and a route is immediately available. This routing approach has the benefit ofminimizing packet latency. However, a proactive approach comes with a penalty of increasedcontrol-message traffic overhead. This traffic continuously uses a portion of the networkcapacity to keep the routing information current. Precious resources may be wasted in order toproactively maintain paths that are not needed.
The advantage of a reactive approach to MANET routing is that there is little or no wastedcontrol-message traffic to discover routes that are never used. Control-messages are generated indirect response to an upper-layer route request. Implementations of routing protocols may takeadvantage of previous route requests by storing previously used routes, or they may take
10
advantage of route requests that have been forwarded through the node. However, if no routeinformation is available when a route request is initiated, the time to discover a route can be quitehigh, because an inefficient global search is required to find the unknown node. Global searchescan consume significant network resources.
Hybrid protocols generally lie between the proactive and reactive extremes in terms of control-message overhead and message latency. To maintain the proactive region a certain amount ofcontrol-message overhead must be generated. Unfortunately, there will be times where some ofthis proactive messaging will be wasted. However, if the proactive region is relatively small,there is a high probability that reactive messaging will be used as messages are forwardedthrough and beyond the proactive region. A node’s proactive region may not contain the entirenetwork, but it may be exploited to simplify the search for a route. This simplification reducesthe overall message latency.
2.1.1 The Zone Routing Protocol
We selected the Zone Routing Protocol (ZRP) [15, 34, 35] for our study of MANET controltraffic and implemented it for our simulations. This protocol was selected for our simulationsbecause it is a novel hybrid routing protocol that uses an adjustable zone radius that can be tunedto optimize performance as a function of application-layer traffic and network mobility. ZRP isversatile and can be applied to a large range of applications. However, the methods use belowcan be adapted to work with any routing protocol.
ZRP divides each node’s view of the network into two regions or zones: the local intrazone andextended interzone. To determine its intrazone, a node fixes a zone radius r. The node’sintrazone is comprised of the nodes that lie within r hops of the node. Each node proactivelymaintains a logical view of its intrazone. This logical view is maintained via a routing table,which contains a route to each node in the intrazone. The network nodes that lie outside theintrazone comprise the node’s interzone. Nodes do not proactively maintain route informationabout nodes in the interzone and must discover routes to nodes in the interzone when needed.However, a node may store a few previously discovered routes to nodes in its interzone. Further,a node uses its knowledge of the intrazone topology to improve the efficiency of the interzoneroute discovery process, by guiding route requests to the edge of its intrazone.
ZRP is placed at the network layer of the OSI protocol stack and is shown in Figure 2.1. It iscomprised of two sub-protocols; the Intrazone Routing Protocol (IARP) and the InterzoneRouting Protocol (IERP). The IARP provides proactive routing table generation and maintenancefor the intrazone. It incorporates a data-link layer Neighbor Discovery Protocol (NDP) todiscover a node’s one-hop neighbors. The IERP provides reactive route discovery to nodes in theinterzone.

11
Figure 2.1: ZRP is included in the network layer and receives interprocess communication fromthe Neighbor Discovery Protocol (NDP) located in the data-link layer
Early white paper descriptions of ZRP [37] did not specify the exact nature of the NDP, IARP, orthe IERP. The designers felt that any appropriate protocol would be sufficient. Implementerswere encouraged to choose their favorite (and hopefully most efficient) component protocols.The designers also felt that any improvements in proactive or reactive protocol technology couldbe applied directly to ZRP. Implementers have gravitated toward certain methodologies for thecomponent algorithms. For our simulations and analysis we examined a specific implementationof ZRP obtained from its original designers. This implementation is in line with the current stateof the art and in line with standardization proposals [15]. From this point on, we describe thebasic functionality of the specific implementation that we used for our studies. When we refer toZRP we mean the version of ZRP that we obtained from the original designers.
Neighbor Discovery Protocol:
The IARP depends on the NDP to determine a node’s one-hop neighbors. The NDP advertises anode’s presence by periodically transmitting a Hello packet that contains the transmitting node’saddress. All neighboring nodes in the range of the transmitting node receive the beaconed Hellomessage. The NDP maintains a list of nodes from which it has received a Hello message, andinitiates an interrupt that informs the IARP of any change in the one-hop neighbor list. Changesoccur when the NDP receives a Hello from a node that is not in the neighbor list, or if it has notreceived a Hello message from a node in the list for a specified number of beacon intervals.
A node’s transmitter power, antenna configuration, receiver sensitivity, and channelcharacteristics help in determining its set of one-hop neighbors. It should be noted that a node’sone-hop neighbor region is mostly based on physical distance. In contrast, a node’s zone radiusis not a physical distance, but rather it is based on node relaying connectivity as shown in Figure2.2.
There are overhead impacts associated with any proactive protocol based on the periodicbeaconing of Hello messages. For ZRP the Hello messages are short, on the order of 34 bits.Even though these messages are relatively small, each node generates a fixed number of themper second regardless of node mobility and network topological changes. Periodic beaconingreduces the amount of bandwidth available for higher level messaging. The number of beaconsthat a node receives is directly proportional to the number of nodes in its one-hop neighborhood.The bandwidth impacts due to beaconing are greatest in dense networks.
Data-Link Layer
Network Layer Zone Routing Protocol
IERP IARP
NDP

12
Intrazone Routing Protocol:
Depending on how the network is initialized, the zone radius may be fixed and constantthroughout the network, or each node may have the ability to monitor network traffic anddetermine the radius based on a predetermined set of rules. In order to explain the basics of theIARP we assume all nodes have the same zone radius.
The NDP provides the IARP with a list of one-hop neighbors. Each time the IARP receives achange in its list of neighbors, or on a periodic basis, it sends to all neighboring nodes its currentone-hop neighbor list or link-state. Each node forwards any received link-state information. So, anode’s link-state propagates throughout its intrazone. Using a minimum spanning tree algorithmand the collection of one-hop neighbor lists, each node computes a routing table. The routingtable is recomputed whenever there is a change in the link-state information. Changes in the link-state information can occur when a node discovers a new, or loses an existing, one-hop neighboror when the node is informed of a change in another node’s link-state.
Interzone Routing Protocol:
IERP uses bordercasting to efficiently propagate its route discovery messages through thenetwork. A node requiring a route to a node in its extended region will send a route request to thenodes at the peripheral of its IARP region. Each of these peripheral nodes will check theirrouting table to determine if they have a route to the destination. If no route is found, theperipheral node appends its address to the route request and forwards the request to its peripheralnodes.
When a node receives a route request for a node that lies within its intrazone, it will append itsaddress and return a route reply along the list of nodes in the request. The source node stores anduses the discovered route as needed. If multiple routes are returned to the source node, the mostefficient route is chosen and stored.
IERP bordercasting obtains efficiency over the standard “flood” approach by directing itssearches to IARP region peripheral nodes. When interior nodes forward requests to peripheralnodes they record enough information to terminate redundant requests. Further, non-forwardinginterior nodes promiscuously listen to requests so that they can also terminate future redundantrequests. Details of these directed search mechanisms are described in detail in [35].
Figure 2.2 illustrates node S’s two-hop intrazone. Peripheral nodes are the outermost nodes in theregion and participate in the extended message routing. Nodes A, B, C, D, and E are S’s one-hopneighbors. Nodes G, H, I, and K are its peripheral nodes. Nodes F and J are in the interzone ofnode S.

13
Figure 2.2: ZRP with an IARP two-hop intrazone.
2.2 Data-Link Layer
The Data-Link layer is the protocol layer that handles the interfacing of data to the physical linkin a network. The Data-Link layer is layer two in the OSI model and contains two sub-layers thatare described in the IEEE-802 LAN standards as follows:
• Logical Link Control (LLC)• Media Access Control (MAC)
The LLC is concerned with managing traffic, both flow and error control, over the physicalmedia.
The Data-Link layer initiates a communication sequence, divides output data into data frames,and handles the acknowledgements from the receiver that data arrived successfully. It alsoensures that incoming data has been received correctly by analyzing bit patterns at special placesin the frames.
The MAC sub-layer is responsible for controlling access to the wireless channel. In a largewireless network many nodes share the same channel, so there is a high probability that nodeswill compete for channel resources. Part of the duties of the MAC is to prevent contentions ifpossible, and to resolve them when they do occur.
A number of approaches have been recommended for a wireless network to access the sharedwireless channel [13]. One commonly used approach is Carrier Sense Multiple Access withCollision Avoidance (CSMA/CA) [3]. Under the CSMA/CA technique, a node that intends totransmit first listens to the channel to determine if any other node is transmitting. If the channelis busy, it will wait for a period of time. If the channel is free for a specific period of time, thenthe node transmits. Collisions occur only when two or more nodes select the same time to
H
I
K
G
SF
J
E
D
C
B
A
S’s intrazone;determined by number
of hopsS’s one-hopneighborhood;
determined by radiocharacteristics

14
transmit. If two nodes transmit at the same time and their messages collide, they will each backoff for a period of time before attempting a retransmission.
One issue that arises in a wireless network (which does not arise in a wired network) is thehidden terminal problem. The hidden terminal problem describes a situation where node Awould like to transmit a message to node B. Node C is in communication range of B but not incommunication range of node A as shown in Figure 2.3. Node C will be unaware of node A’stransmissions. Even if node C senses the channel before transmitting, that message will corruptnode A’s transmission. This corruption is independent of node C’s intended destination.
Figure 2.3: Wireless communication hidden terminal problem
2.2.1 IEEE 802.11 Media Access Control
Because of the hidden terminal problem, the CSMA/CA methodology alone cannot totallyprevent collisions. Various implementations of CSMA/CA technology incorporate extensionsthat improve the collision avoidance property. One such method is the MAC defined by the IEEE802.11 standard [2, 3]. This MAC has a number of features that mitigate many of the mediaaccess issues that arise in wireless LANs and is used because of its versatility and generallyaccepted robustness. Because of its popularity, it is the method of choice to benchmarkapproaches that deal with wireless media access.
The IEEE 802.11 standard uses an access mechanism called the Distributed CoordinationFunction (DCF) [3]. In addition to the typical CSMA/CA features, the DCF of the IEEE 802.11MAC provides for packet fragmentation and reassembly, packet retransmissions, andacknowledgements. To reduce the possibility of collisions, the DCF also employs a virtualchannel sense based on a request to send/clear to send (RTS/CTS) exchange. This approach addsstability to the channel at the cost of a small amount of overhead.
The IEEE 802.11 standard calls for inter-frame spacing times. The times are fixed in size relativeto each other, but the actual value is based on the implementation hardware. However, the IEEE802.11 standard suggests the times given below:
BA C
C’s Communication RangeA’s Communication Range
C will disrupt A’s message toB if C transmits while A is
transmitting

15
• Slot Time (Slot) – The slot time is the time that it takes for a node to determine if thechannel has been accessed at the beginning of the previous slot. Typically a 50-microsecond spacing.
• Short Inter Frame Space (SIFS) – The SIFS is the time necessary for a node to process anincoming transmission and switch between transmit/receive as necessary. Typically a 28-microsecond spacing.
• Distributed Inter Frame Space (DIFS) – The DIFS is defined as a SIFS plus two slots.Typically a 128-microsecond spacing.
The following sequence of events are followed when node A wishes to send a packet to node B.Node A first senses the channel. If the channel is clear for a DIFS, node A transmits. If thechannel is busy, node A waits until the channel is clear for a DIFS and then enters a randomback-off mode. In the random back-off mode, node A sets a decrementing timer to a randomlychosen number of slots. If the channel becomes busy during the countdown, node A suspendscounting until the channel is clear again. When the timer reaches zero, node A checks thechannel to verify it is clear and then transmits. If the counter reaches zero, but the channel isbusy, node A will reset the timer to an exponentially larger value. After a number ofunsuccessful attempts the packet is dropped.
Now suppose that node A wishes to send a data packet to node B. Node A uses the transmissionsequence described in the paragraph above to send a RTS to node B. If node B receives the RTS,it returns a CTS. Once node A receives the CTS from node B, it sends the data packet. Whennode B correctly receives the data packet, it sends an acknowledgement (ACK). When node Areceives the ACK the exchange is complete. If at any time node A does not receive a CTS orACK, it will attempt to resend the appropriate RTS or data packet. The data packet will bedropped by node A after a number of unsuccessful sending attempts. We refer to this process asthe Link Layer Data Transaction (LLDT).
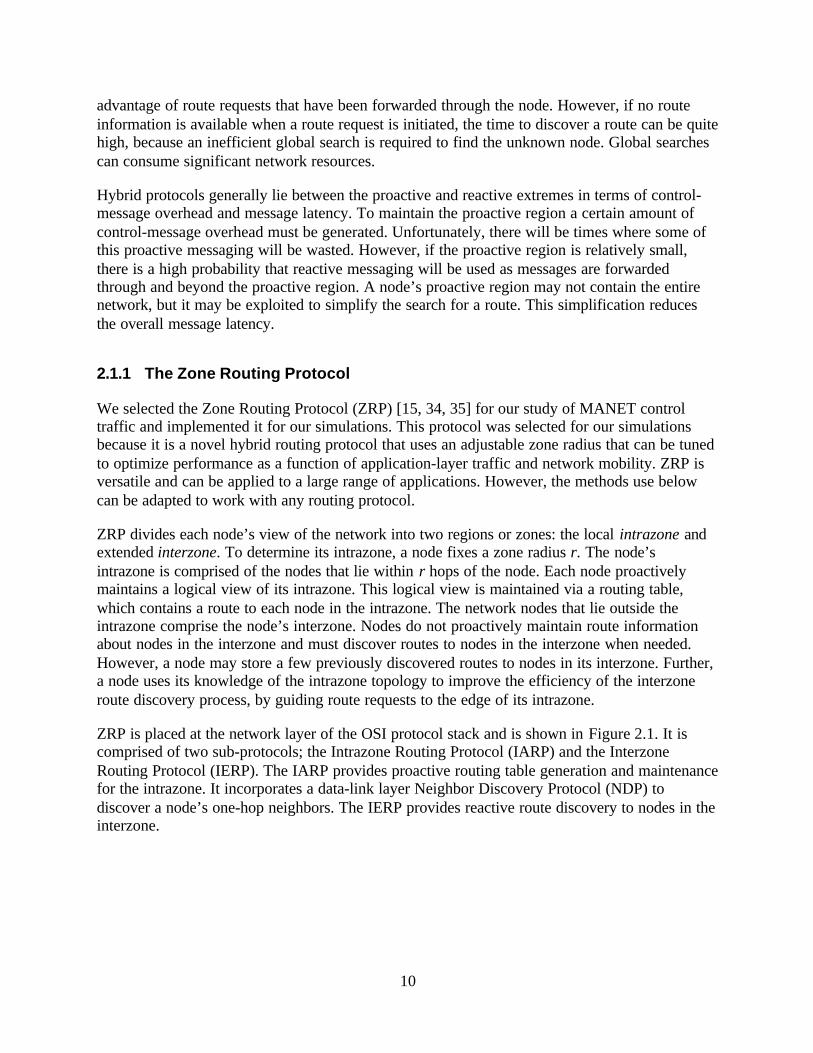
The RTS and the CTS both contain source and destination information. The RTS also includesthe expected amount of time that the entire transaction will take. This time includes the CTS,DATA and ACK transmission times plus the appropriate SIFS message processing times. TheCTS includes the timing information for the DATA and ACK transmission plus the appropriateSIFS message processing times. Nodes other than B that receive the RTS set their NetworkAllocation Vector (NAV) to the time set in the RTS. Nodes other than A that receive the CTS settheir NAV to the time in the CTS. These nodes will not transmit for the time specified by theNAV. Figure 2.4 shows an exchange between nodes that use the LLDT virtual-channel sense.
Because of the overhead associated with the RTS/CTS exchange, small packets such as Hellomessages are sent directly without the RTS/CTS exchange. Broadcast packets are also sentwithout the RTS/CTS exchange.
16
Figure 2.4: Media access control with virtual channel sense message exchange
The IEEE 802.11 MAC standard also provides a fragmentation and reassembly service for thedata packets. Since the standard interfaces to higher layers that are based on Ethernetenvironments, data packet size can be up to the maximum Ethernet packet size; 1518 bytes long.In wireless communications long packets can decrease network performance since bit error ratesare higher than in a wired network. If a bit error occurs in a packet transmission, the entire packetis lost. Thus, to maximize network performance, the selected packet size must be optimizedbased on packet header overhead and bit error rates.
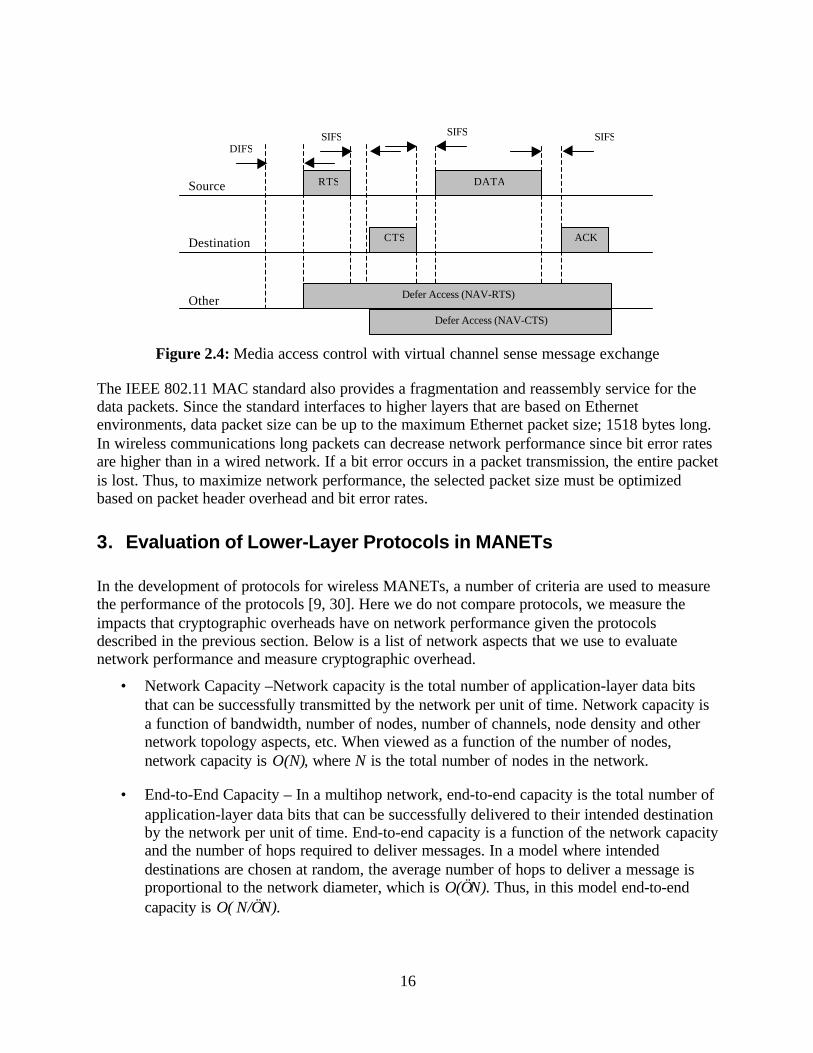
3. Evaluation of Lower-Layer Protocols in MANETs
In the development of protocols for wireless MANETs, a number of criteria are used to measurethe performance of the protocols [9, 30]. Here we do not compare protocols, we measure theimpacts that cryptographic overheads have on network performance given the protocolsdescribed in the previous section. Below is a list of network aspects that we use to evaluatenetwork performance and measure cryptographic overhead.
• Network Capacity –Network capacity is the total number of application-layer data bitsthat can be successfully transmitted by the network per unit of time. Network capacity isa function of bandwidth, number of nodes, number of channels, node density and othernetwork topology aspects, etc. When viewed as a function of the number of nodes,network capacity is O(N), where N is the total number of nodes in the network.
• End-to-End Capacity – In a multihop network, end-to-end capacity is the total number ofapplication-layer data bits that can be successfully delivered to their intended destinationby the network per unit of time. End-to-end capacity is a function of the network capacityand the number of hops required to deliver messages. In a model where intendeddestinations are chosen at random, the average number of hops to deliver a message isproportional to the network diameter, which is O(√N). Thus, in this model end-to-endcapacity is O( N/√N).
DIFS
Source
Destination
Other
SIFS SIFS SIFS
RTS
CTS ACK
DATA
Defer Access (NAV-RTS)
Defer Access (NAV-CTS)

17
• One-Hop Throughput – One-hop throughput is the average number of application-layerdata bits that can be successfully transmitted from one node to another per unit of time.One-hop throughput is a function of bandwidth, node density, other network topologyaspects, number of channels, etc. When viewed as a function of the number of nodes,network capacity is an O(1) constant.
• End-to-End Throughput – In a multihop network, end-to-end throughput is the averagenumber of data bits that can be successfully delivered from a source to a destination perunit of time. End-to-end throughput is a function of one-hop throughput and the averagenumber of hops required to deliver messages. In the random destination model with anaverage path length of O(√N), end-to-end throughput is O(1/√N).
• Route Acquisition Time – The time that it takes to discover a route from a source to adestination. This is mainly a function of the intrazone radius, average path length, and thesize of the extended region route buffer. In our simulations we set the time that that ittakes to examine the route table plus the time it takes to examine the route buffer to zero.The route acquisition time is measured only for destinations that lie outside the intrazoneand not in the route buffer.
• Propagation Time – The time that it takes for a data message to traverse from source todestination. This depends on the path length, the time to complete a LLDT, and theamount of message queuing/delay at intermediate hops.
• End-to-End Data Delay – The time that it takes to deliver an application-layer packet.This is a function of route acquisition time and transmission time.
• Route Table Convergence Time – The time it takes for a node to acquire a stable view ofits intrazone. This is a function of the intrazone radius, propagation time, Hello beaconinterval, and node velocity.
3.1 Simulated Network Parameters
For our studies we have targeted a few characteristics that play a role in MANET operation.These aspects are variable parameters in our simulations.
Network Node Mobility:
Mobility impacts the performance of a MANET since the processes of node discovery, IARPupdate rate, route discovery, and route rediscovery are dependent on node movement. Formaximum network performance, the Hello beacon rate and IARP update rate should be afunction of the average node velocity. In general, a neighbor discovery beacon should betransmitted several times during the life of a link. This will ensure that the local neighborhood isfairly stable throughout several beacon periods. If the rate is too high, the network topology maynot change during scores of beacon periods and thus waste precious bandwidth. On the otherhand, if the beacon rate is too low as compared to node velocity, a node may never have a correctview of its one-hop neighborhood.

18
A typical method of determining the beacon rate is to set its value to some fraction of thetransmit radius divided by the average node speed. However, this course method is optimal onlyin situations where the network nodes all move in random directions at approximately the samespeed. In real networks a random direction, equal speed movement pattern is not realistic, nodesmay have a wide range of speeds, and directions are not usually random.
Ideally to obtain the optimum beacon rate, each node would have to be able to measure its ownspeed as well as its speed relative to the other nodes and then adjust its own beacon rate for thoseconditions. To add the capability to incorporate node speed into the beacon rate, a node wouldhave to not only have the ability to determine its own speed, the MAC layer protocols wouldhave to be extended to dynamically adjust the beacon rate. At this time no hardware or softwareenhancements of this type are available.
Our focus is on ground-based ad hoc networks. As such, simulated node velocity is limited tothat which is reasonable for ground-based vehicles. Simulated nodes are given a randomdirection on a two-dimensional rectangular grid with boundary. When nodes intersect theboundary they are redirected with equal angle.
In our simulations and comparable research, the beacon rate is fixed to a value that is highenough to accommodate all reasonable node velocities. For most of our simulations we set thisvalue to be 0.33 seconds. Incidentally, this value is approximately 0.036(r /s), where r is thetransmit radius (chosen here as 300 meters) and s is a maximum closing speed of 120 km/hr.
In practice, it is sufficient for the IARP update period to be three times that of the beacon period[36].
Mobility also affects a node’s ability to acquire and maintain reactive routes. If node speed ishigh enough, queued routes quickly become invalid. This causes frequent applications of theroute discovery procedure. The network can waste considerable bandwidth to constantly updateolder routes. In the extreme, even the route discovery process can be impeded by mobility.Routes may become invalid before they can be used. In this case, “flooding” of application layermessages may be the only recourse for message delivery.
Application-Layer Traffic Load:
In our studies we have chosen a random destination model, where the destination of application-layer messages is chosen at random. An increase of packets delivered into the proactive regiondoes not increase control message overhead. However, if the application-layer traffic is low, thenthe effort to maintain a large proactive region is wasteful.
In ZRP, the number of control messages generated to support route discovery into the reactiveregion is a function the application-layer traffic. If a series of application-layer packets isdestined to a single node, then a single route discovery is initiated to establish the route for thisseries. On the other hand, if each packet in the series were destined to a different location, theneach packet would require a route discovery. Clearly, the amount of control traffic overhead is afunction of the number of destinations. One must keep in mind that mobility will causepreviously discovered routes to become invalid. These invalid routes must be rediscovered, thusgenerating additional control traffic. If control and application-layer traffic must share the same

19
capacity limited channel, then excessive control traffic will have a direct impact on the amountof application-layer traffic that can be transmitted throughout the network.
Three different rates of application-layer packet generation were selected for our simulations.The application-layer generates the traffic for a session. In one session, a node randomly choosesa destination, and then sends a fixed number of 1000 bit packets to that destination. The nodethen waits for a fixed amount of time before beginning another session. The three differentgeneration rates are described in Table 3.1.
Table 3.1: Application-layer traffic generation
Application-LayerTraffic
DestinationVariation
Number ofPackets per
Session
Elapsed Timeper Session
Time BetweenSessions
High 2 0.125 sec 0.125 secMedium 10 0.625 sec 0.625 sec
Low 20 1.250 sec 1.250 sec
Additional routing protocol parameters that impact the successful delivery of application-layerpackets to the destination are: Update Packet List Period and Discard Old Packet Time. Thesetwo times determine how long a packet will remain queued while the routing protocol attemptsto discover a route. The Update Packet List Period defines the frequency that the protocolreviews the send queue. Any packet that has been in the send queue for a time longer than theDiscard Old Packet Time will be removed from the queue and is considered as a dropped packet.Since we are evaluating lower protocol performance, we have not incorporated a higher layerreliable delivery mechanism. We count dropped packets, but make no attempt to retransmit them.
Cryptographic Overhead:
Typically, cryptography is applied to upper-layer messages. However, without confidentialityand authentication techniques applied to the lower-layer messages, the lower-layer is open foradversarial manipulation. For instance, an adversary may spontaneously generate an RTSindicating that a maximal length packet will be transmitted and then not transmit the data packet.Any node hearing this message will set its NAV to its maximum value and wait while nothinghappens. Or the adversary may send out a false CTS and ACK. If the intended target node is notin range or otherwise busy, it will not receive the data packet and the packet will be lost and thesource node will believe otherwise. In either case, the network will suffer considerableperformance degradations [41].
For a MANET to be secure, security features should protect both the upper and lower-layer data.Every network message must have security features applied to it. This includes messages such asHello, RTS, etc. The use of cryptography imposes computational costs on the nodes thatimplement cryptographic algorithms. These costs may include the time to encrypt, decrypt, sign,and verify messages. These operations increase packet latency and, in most cases, reduce data
20
throughput. Digital signatures appended to messages leads to increased packet size and reducesoverall throughput.
To properly utilize cryptographic primitives, a network must have a viable security policy. Thissecurity policy must include a provision for key management and auditing procedures. Keydistribution, exchange, archival, and recovery all impact the performance of the network.Invasive network audits can destroy network capacity. In addition, secure network initializationand configuration may be time and labor intensive. The performance impacts of a properlyimplemented security policy are beyond the scope of this paper.
Nodes must securely hold cryptographic keys as well as the code used to employ thecryptographic primitives. This does not impact the network steady-state performance, but doesincrease node complexity and hardware requirements.
A well-accepted set of speed benchmarks for cryptographic protocols provided by Wai Dai canbe found at [11]. With regards to the implementation platform Wai Dai says, “All were coded inC++ or ported to C++ from C implementations, compiled with Microsoft Visual C++ 6.0 SP4(optimize for speed, blend code generation), and ran on a Celeron 850MHz processor usingWindows 2000. Two assembly routines were used for multiple-precision addition andsubtraction.”
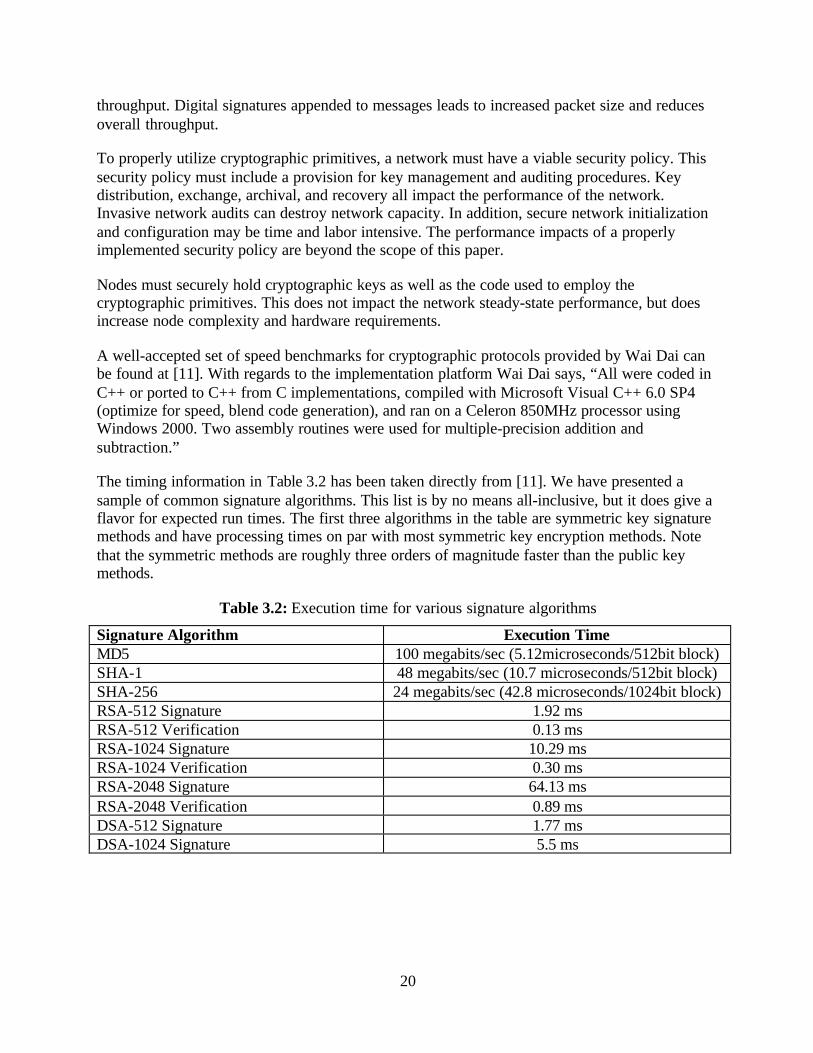
The timing information in Table 3.2 has been taken directly from [11]. We have presented asample of common signature algorithms. This list is by no means all-inclusive, but it does give aflavor for expected run times. The first three algorithms in the table are symmetric key signaturemethods and have processing times on par with most symmetric key encryption methods. Notethat the symmetric methods are roughly three orders of magnitude faster than the public keymethods.
Table 3.2: Execution time for various signature algorithms
Signature Algorithm Execution TimeMD5 100 megabits/sec (5.12microseconds/512bit block)SHA-1 48 megabits/sec (10.7 microseconds/512bit block)SHA-256 24 megabits/sec (42.8 microseconds/1024bit block)RSA-512 Signature 1.92 msRSA-512 Verification 0.13 msRSA-1024 Signature 10.29 msRSA-1024 Verification 0.30 msRSA-2048 Signature 64.13 msRSA-2048 Verification 0.89 msDSA-512 Signature 1.77 msDSA-1024 Signature 5.5 ms

21
If these authentication protocols were implemented on a less powerful wireless device, thesigning and verification times would increase dramatically. Depending on the implementation,factors of 10-1000 times slower are possible.
Very large public key signatures may be attractive for use at the application layer, but areinappropriate for use at the data-link layer. For example, RSA-2048 is 256-bytes in length. Ittakes on the order of 0.6 seconds to sign on a fairly strong machine. The same signature on aneight-bit processor will take tens of seconds to accomplish. The whole IEEE 802.11 LLDTwould take a few minutes to accomplish no matter the transceiver data rate. Using the IEEE802.11 MAC approach, the channel would sit idle for a considerable amount of time whileparticipating nodes signed and verified the messages of the LLDT. Combine this with thewireless channel contention issues, end-to-end throughput is reduced to the order of a few bitsper second no matter how high the transceiver data rate. These extremely large public keysignatures do not make sense for securing MANET lower-layer messages. We limit the signaturesize to 128 bytes, which corresponds to RSA-1024. We show that this may still be too large to bepractical.
We have taken a black box approach to the signature and encryption algorithms. For variousexperiments we have taken a range of processing times suggested as appropriate by Table 3.2.No distinction between encryption and authentication is made; the processing times of both arelumped into a single delay. A range of signature sizes is also used. Because of a possible widevariance in hardware/software implementations, we have made no attempt to correlate signaturesize with processing time.
In our simulations, we have accounted for cryptographic overheads on each and every packet.All one-hop messages must be signed and verified, so the appropriate delays are accumulatedevery time a node generates, receives to forward, forwards, or receives a packet. In addition, weassume that a node’s processor is capable of processing a single cryptographic primitive at atime, thus we have included queuing delays.
3.2 Modeling and Simulation Parameters Summary
An OPNET Modeler simulation was developed to measure the performance of ZRP andcryptographic impacts. Detailed models of the components of ZRP are used in the simulationsand were provided by Cornell University [15]. Process models to represent the routing protocol,node movement, the application layer traffic generation, the media access control, the physicalradio link, the wireless channel, and the overhead impacts of the applied cryptography weredeveloped to support the simulations studies.
The simulations were performed on an 800MHz Windows PC. Simulations were limited to 49node networks. High fidelity models of all relevant protocols simulated with OPNET Modelerare computationally intensive. One has the choice to either remove protocols, reduce the fidelityof the protocols to abstract out the essential details, or else keep the number of nodes small. Wechose the latter in an attempt to be as faithful to the protocols as possible.
In our simulations we used a transmit radius of 300 meters, which corresponds to the IEEE802.11 MAC protocol requirement of a less than one microsecond air propagation time [32]. The

22
fixed simulation values used in the studies presented in this report are defined in Table 3.3.Details of the OPNET process models used in the simulation are presented in Appendix A.
Table 3.3: Simulation parameters
Parameter Value
Number of Nodes 49 nodesNetwork Coverage Area 1,600 x 1,600 metersNode Transmission Radius 300 metersNode Beacon Period 0.33 secondNode IARP Update Period 1.0 secondNode Update Packet List Period 1.0 secondNode Discard Old Packets Time 1.0 secondNode Transceiver Data Rate 10 Mbps
4. Analysis and Simulations
In this section we present the results and conclusions of various analysis and simulationexperiments that were conducted. The pertinent details of the experiments are given below. Forthe sake of clarity, we give an outline of the ordering of the subsections.
1. Link-Layer Data Transaction2. End-to-End Data Throughput3. Optimal Zone Radius4. End-to-End Data Delay5. Routing Table Convergence
4.1 Link-Layer Data Transaction
To prevent adversarial manipulations, the media access messages need to have security featuresplaced on them. However, questions about performance arise. Each message in the media accesstransaction must be signed by the sender and verified by the intended receiver. Since any nodeable to receive an RTS or CTS is an intended receiver, all nodes in the area must verify a RTSand CTS exchange. The act of signing or verifying a RTS, CTS, DATA, and ACK must be doneduring the LLDT. However, the source node is able to sign the RTS and verify the ACK off line,so the LLDT must include six authentication procedures.
The 802.11 MAC standard calls for RTS, CTS, ACK and DATA header to be of size 40, 39, 39,and 47 bytes respectively. DATA sizes vary, up to a maximum of 1518 byte packets. Applicationof the digital signatures above will add from between 16 and 128 bytes to the packet size. With atransceiver data rate of r megabits per second, the time in milliseconds to transmit a K bytepacket is:
T = 8*K/(1000*r)= K/(125*r)

23
Table 4.1 provides examples of the time, in milliseconds, to transmit packets of the givennumber of bytes at the given data rates. The sample packet sizes given are: the smallest packet,the smallest packet with the smallest signature, the largest data size, the largest data size withheader and the largest signature. Transmission times are linear in the number of bits transmittedand in the transmission data rate, so simple interpolation allows computation of other timingvalues.
Table 4.1: Time to transmit packets at the given data rates
Data Rate Transmit timefor 39 bytes
Transmit timefor a 55 byte
packet
Transmit timefor 1518 bytes
Transmit timefor a 1693
byte packet
1 megabit/sec 0.31ms 0.44ms 12.44ms 13.54ms
10 megabit/sec 0.031ms 0.044ms 1.244ms 1.354ms
To accurately measure the performance impacts of security we need to have complete networkinformation including the actual communication protocols, the signature algorithm, transmissiondata rate, hardware and software capabilities, etc. In order to make general statements we make afew simplifying assumptions. We assume that the time to cryptographically process a receivedmessage is equal to the time for the sender to cryptographically prepare the message fortransmission. We assume that this time is independent of the size of the message and denote it inmilliseconds as AUTH. We assume that DIFS=0.128 milliseconds and SIFS=0.028 milliseconds.
Encryption and decryption times are roughly equal for most symmetric key encryptionalgorithms. Similarly, the statement that “signature and verification times are roughly equal” isvalid for many signature algorithms. The most notable exception is RSA. The times that aregiven in Table 3.2 assume a public exponent of 17. More conservative implementations use alarger public exponent. This would close the gap between times to sign and verify. Further, sincethere is the same number of signatures as verifications in an LLDT, and they must be donesequentially, then one can think of AUTH as the average of the two times.
Let R, C, D, H, A, and S be the number of bytes in the RTS, CTS, DATA, HEADER, ACK, andSignature respectively. The total time, in milliseconds, that the channel is occupied for an LLDTis:
T = 6*AUTH+DIFS+3*SIFS+(R+C+D+H+A+4*S)/(125*r)
= 6*AUTH+0.212+(165+D+4*S)/(125*r)
One method to reduce the time T, and thus increase the available throughput of the network,would be to increase the data rate r. There is a point at which 6*AUTH +0.212 becomes thedominant factor in T and further increases in r will not significantly affect the total transaction

24
time. Similarly, reducing AUTH will not significantly reduce T when0.212+(165+D+4*S)/(125*r) becomes the dominant factor. For that matter, the inter framespacing times of 0.212 ms give a lower bound on the total transaction time.
Another issue is that of idle channel time. Nodes not directly participating in an LLDT set theirNAV, which must include AUTH times. These nodes will sit idle during the transaction. IfAUTH is large in comparison to the other factors, the channel will sit idle while LLDTparticipants are completing their cryptographic processing. This time may well be used for othersmaller transmissions. However, interleaving communications in this fashion would require asignificant rewrite of the IEEE 802.11 MAC approach.
The ratio of the time to transmit DATA and the time to complete a LLDT is the percentage of thetransmission data rate that is available to a node. We denote this percentage as P, and it is givenby:
P=D/(r*(125*AUTH+26.5)+165+D+4*S)
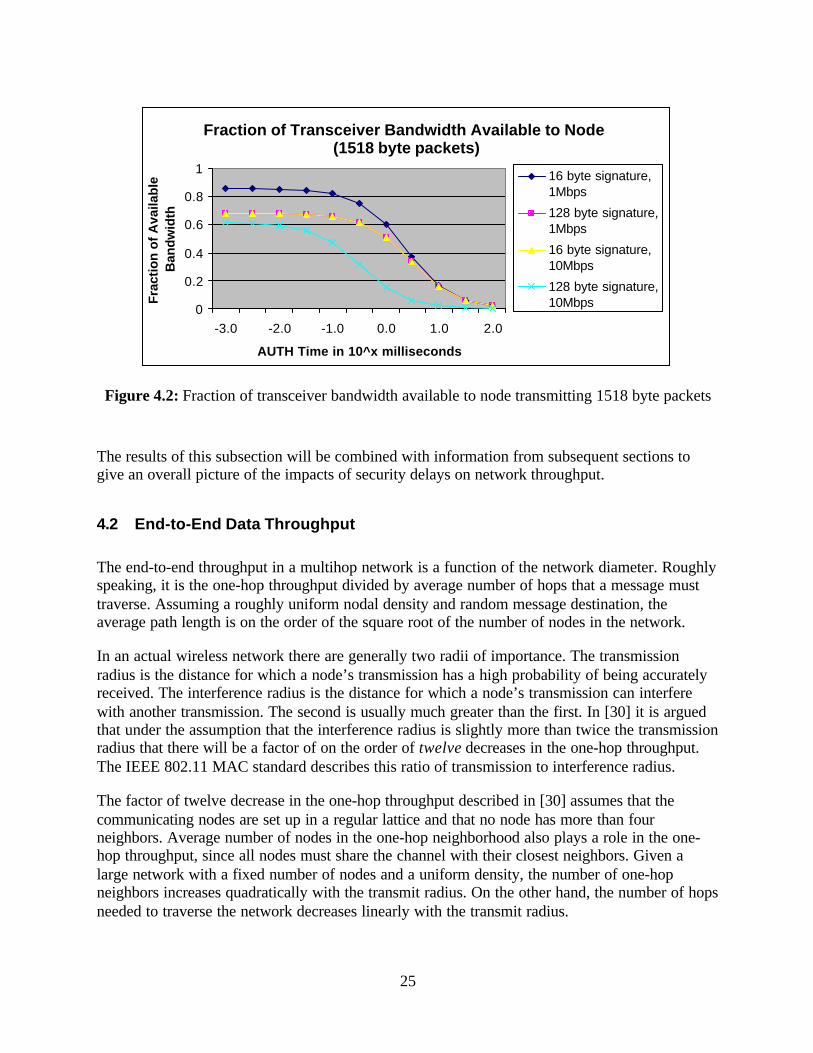
Because the processing power can vary from device to device even the values of AUTH and Scan be treated as independent variables. In this analysis we set the data rate to either one or tenmegabits/second, we set the signature size to 16 and 128 bytes, and examine 64 and 1518 byteDATA packets.
Figure 4.1 and
Figure 4.2 show P with AUTH ranging from 0.001 to 100 milliseconds (log scale). Any AUTHvalue that is in the one-second range will force multihop messages to take multiple seconds toreach its destination.
Figure 4.1: Fraction of transceiver bandwidth available to node transmitting 64 byte packets
Fraction of Transceiver Bandwidth Available to Node
(64 byte packets)
0
0.05
0.1
0.15
0.2
0.25
-3.0 -2.0 -1.0 0.0 1.0 2.0
AUTH Time in 10^x milliseconds
Fra
ctio
n o
f Ava
ilab
le
Ban
dw
idth
16 byte signature,1Mbps
128 byte signature,1Mbps
16 byte signature,10Mbps
128 byte signature,10Mbps
25
Figure 4.2: Fraction of transceiver bandwidth available to node transmitting 1518 byte packets
The results of this subsection will be combined with information from subsequent sections togive an overall picture of the impacts of security delays on network throughput.
4.2 End-to-End Data Throughput
The end-to-end throughput in a multihop network is a function of the network diameter. Roughlyspeaking, it is the one-hop throughput divided by average number of hops that a message musttraverse. Assuming a roughly uniform nodal density and random message destination, theaverage path length is on the order of the square root of the number of nodes in the network.
In an actual wireless network there are generally two radii of importance. The transmissionradius is the distance for which a node’s transmission has a high probability of being accuratelyreceived. The interference radius is the distance for which a node’s transmission can interferewith another transmission. The second is usually much greater than the first. In [30] it is arguedthat under the assumption that the interference radius is slightly more than twice the transmissionradius that there will be a factor of on the order of twelve decreases in the one-hop throughput.The IEEE 802.11 MAC standard describes this ratio of transmission to interference radius.
The factor of twelve decrease in the one-hop throughput described in [30] assumes that thecommunicating nodes are set up in a regular lattice and that no node has more than fourneighbors. Average number of nodes in the one-hop neighborhood also plays a role in the one-hop throughput, since all nodes must share the channel with their closest neighbors. Given alarge network with a fixed number of nodes and a uniform density, the number of one-hopneighbors increases quadratically with the transmit radius. On the other hand, the number of hopsneeded to traverse the network decreases linearly with the transmit radius.
Fraction of Transciever Bandwidth Available to Node (1518 byte packets)
0
0.2
0.4
0.6
0.8
1
-3.0 -2.0 -1.0 0.0 1.0 2.0
AUTH Time in 10^x milliseconds
Fra
ctio
n o
f A
vaila
ble
B
and
wid
th16 byte signature,1Mbps
128 byte signature,1Mbps
16 byte signature,10Mbps
128 byte signature,10Mbps
Fraction of Transceiver Bandwidth Available to Node

26
Position and nodal movement also play roles in the capacity of a network. In a simulatednetwork where nodes have random initial position and move in random directions the nodaldistribution is never uniform. At times, portions of the network will be sparsely populated whileother areas will be densely populated. The sparse areas may contain nodes that have no one-hopneighbors and hence cannot communicate with any other node. For these nodes, their one-hopthroughput is zero. The random placement of low-density areas tends to increase the averagepath length as paths must navigate around the holes rather than pass directly through them. In thedense areas there is much greater contention for the channel. Thus the end-to-end throughput forany particular node is less than what one would predict using a uniform distribution model. It isdifficult to precisely predict the impact of all of these issues on the end-to-end throughput.
If the network density is low enough, network partitions are common in a random movementmodel. Even if the network is reasonably dense, network partitions are common enough to causesimulation problems. As nodes randomly choose packet destinations in a different connectedcomponent, the dropped packet rate raises accordingly. This dramatically affects the overall end-to-end throughput that any node is able to realize.
Combining the one twelfth factor from [30] and the average path length the end-to-endthroughput may be estimated by dividing the transceiver data rate by at least 12*root(N). Inaddition, application-layer messages must share the remaining channel with lower-layer controlmessaging.
4.3 Optimal Zone Radius
We simulated ZRP over various zone radiuses, which were incremented from one to five.Technically, ZRP with a zone radius of zero is equivalent to a true “flood” search algorithm.However, the ZRP modeling blocks to which we had access do not allow for a zero radius. Oneof the reasons for this is that a zone radius of zero is fundamentally different than a non-zeroradius and would require on-the-fly disabling the NDP protocols, link-state update protocols, etc.A zone radius of one is practically equivalent to a “flood” search. However, there is a slightsavings over a flood on the occasion that an upper-layer message is destined for a node in theone-hop neighborhood, thus no flood is initiated. Also during a route discovery, when a nodesees the destination node in its neighbor list, it returns a path rather than continuing with a pathsearch. With a zone radius of one, the one-hop neighbors are the peripheral bordercast nodes.This results in no bordercast savings during route discovery.
In our simulations with a 49-node network, a zone radius of five is close to a complete proactivelink-state routing. If the nodes are placed regularly in our square grid, then the five-hop intrazoneof a randomly placed node will likely contain all network nodes. In the few cases where a nodehas a non-empty interzone, there is an overwhelming probability that the node has a peripheralnode with a path to the destination.
As the zone radius increases, more proactive routing traffic is generated. Each node forwards itslink-state information to every node in its intrazone. As the radius grows the number of nodes inthe interzone grows with the square of the zone radius. Thus, control traffic should increase on

27
O(radius2). Figure 4.3 illustrates the IARP proactive region overhead traffic as the zone radiusincreases.
Figure 4.3: IARP control packets increase as the zone radius is increased
One can observe two factors about Figure 4.3. The first is that the IARP traffic seems to beindependent of the node velocity. This is expected because the control messages are generated ona periodic rate that is independent of velocity. The second is that the expected quadratic nature ofthe curves appears to not hold. This fact can be attributed to the small size of the network inrelationship to the larger zone radii. The large intrazones simply run out of new nodes to include.However, the values given provide a lower bound on the number of overhead messages that thenetwork must support.
As the zone radius increases the amount of IERP traffic is reduced. Large radii require lessfrequent initiation of the route discovery protocol since more proactive routes have beendetermined by IARP. In addition large zone radii reduce the amount of traffic generated during aroute discovery because of use of peripheral nodes and bordercasting efficiencies.
Figure 4.4 illustrates the IERP reactive region overhead traffic as the zone radius increases. Forthis figure the application-layer traffic generation was set to the medium level as defined inSection 3.1.
IARP Packets
0
1020
3040
5060
70
1 2 3 4 5
Zone Radius
Pac
kets
per
sec
on
d p
er
no
de
0 km/hr
30 km/hr
60 km/hr

28
Figure 4.4: IERP control packets decrease as the zone radius is increased
As one would expect, the IERP traffic does depend on node velocity. When network nodes havezero velocity, routes are discovered and stored in a routing table and that is valid for all time. Incontrast, if the transmitting, receiving, and/or intermediate hop nodes have velocity thendiscovered routes eventually become invalid and must be replaced.
IARP and IERP control traffic components are summed and plotted as a function of the zoneradius in Figure 4.5.
Figure 4.5: Total ZRP control packets as a function of the zone radius
Due to the increasing and decreasing nature of the IARP and IERP traffic respectively, the totalcontrol traffic curves are convex. The minimum represents the optimal zone radius for the givenvelocity.
With ZRP, every network has an optimal zone radius. For some networks this optimal zoneradius may be two for a purely reactive approach or for some other networks the radius may be
IERP Packets
0
10
20
30
40
50
60
1 2 3 4 5
Zone Radius
Pac
kets
per
sec
on
d p
er
no
de
0 km/hr
30 km/hr
60 km/hr
Total ZRP Traffic
0
1020
30
40
5060
70
1 2 3 4 5
Zone Radius
Pac
kets
per
sec
on
d p
er
no
de
0 km/hr
30 km/hr
60 km/hr
29
infinite, thus a purely proactive approach. For most networks, a zone radius somewhere inbetween is best.
In our simulations, the optimal zone radius is two for all velocities. A zone radius of two takesadvantage of the bordercasting techniques and is more efficient than a zone radius of one, whichis essentially a flood search. It should also be noted that increasing node speed yields greaternumbers of control messages. Rediscovery of routes occurs more frequently with higher nodespeed.
Cryptographic Overhead:
In the current implementation of ZRP, the link-state updates are unicast to each node in sender’sone-hop neighborhood and are accompanied by the RTS/CTS exchange. All IERP messages aresent to specific nodes and are also accompanied by an RTS/CTS exchange. With n and T as thenumber of control messages a node sends per second and the time to complete an LLDTrespectively, then n*T is the percentage of a second that the channel is busy due to a singlenode’s necessary control messaging.
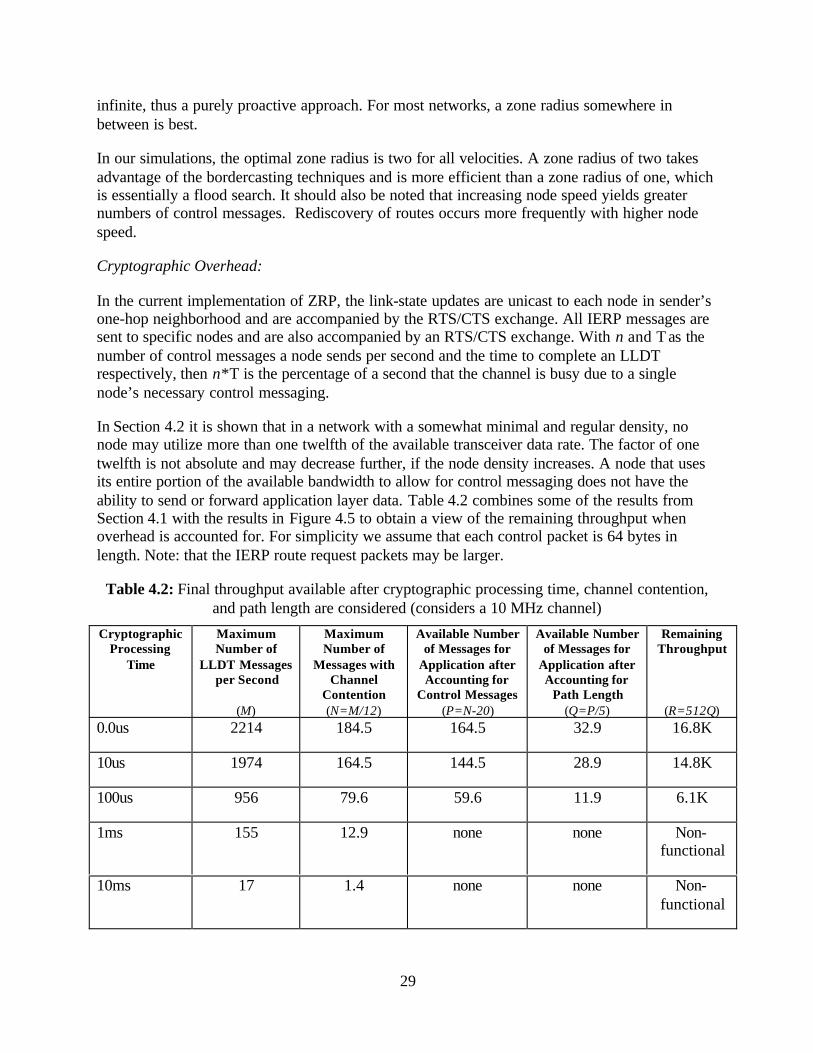
In Section 4.2 it is shown that in a network with a somewhat minimal and regular density, nonode may utilize more than one twelfth of the available transceiver data rate. The factor of onetwelfth is not absolute and may decrease further, if the node density increases. A node that usesits entire portion of the available bandwidth to allow for control messaging does not have theability to send or forward application layer data. Table 4.2 combines some of the results fromSection 4.1 with the results in Figure 4.5 to obtain a view of the remaining throughput whenoverhead is accounted for. For simplicity we assume that each control packet is 64 bytes inlength. Note: that the IERP route request packets may be larger.
Table 4.2: Final throughput available after cryptographic processing time, channel contention,and path length are considered (considers a 10 MHz channel)
CryptographicProcessing
Time
MaximumNumber of
LLDT Messagesper Second
(M)
MaximumNumber of
Messages withChannel
Contention(N=M/12)
Available Numberof Messages for
Application afterAccounting for
Control Messages(P=N-20)
Available Numberof Messages for
Application afterAccounting for
Path Length(Q=P/5)
RemainingThroughput
(R=512Q)0.0us 2214 184.5 164.5 32.9 16.8K
10us 1974 164.5 144.5 28.9 14.8K
100us 956 79.6 59.6 11.9 6.1K
1ms 155 12.9 none none Non-functional
10ms 17 1.4 none none Non-functional

30
Figure 4.5 was created with application-layer data being transmitted in the few kilobit per secondrange. This is a small percentage of the available transceiver data rate and should not beconsidered a difficult application-layer load. For application-layer messages, a node may useonly the percentage of the one-twelfth channel that is left over after the control messaging. Toobtain an estimate of the end-to-end throughput one may divide the one-hop throughput by theaverage path length to account for messaging forwarding requirements. In Table 4.2 we set thepath length to five.
With the minimal number of about 20 control messages per second and the channel contentionfactor of 12, the LLDT cannot take more than 1/(20*12)=4.2 milliseconds or else the node willexpend more than its share of the channel just to process control data. Since there are sixapplications of cryptographic delay in an LLDT, the cryptographic delay must be less than4.2/6=0.7ms. The 0.7ms is an upper bound on the cryptographic delay, and does not account forthe need for inter frame spacing nor does it account for the transmission time.
It apparent from Figure 4.5 a non-optimal selection of the zone radius leads to significantincrease in the amount of control traffic. For instance, a zone radius of four requires more than40 control packets per second. In this case, each LLDT would need to take less than 2.1milliseconds, which implies an upper bound on the cryptographic delay of 0.35 ms.
Accounting for channel contention, routing messages, path length, but without security delays,Table 4.2 shows that the end-to-end throughput is only a small fraction of the transceiver datarate. Even when the cryptographic delays are in the few microsecond range, the end-to-endthroughput drops 12 percent. However, when the cryptographic delays are on the order of amillisecond, the network essentially becomes none-functional. These results show that publickey cryptographic algorithms are not appropriate for securing lower-layer messages.
Application-layer Loads:
The amount of IERP traffic is an increasing function of the amount of application-layer traffic.Thus, one would expect that the optimal zone radius is also a function of the amount ofapplication-layer traffic, however the optimal radius is an integer and may not vary greatly withsmall changes in the traffic load. Figure 4.6 compares control traffic with 30-km/hr node speedwith three different application-layer loads.

31
Figure 4.6: Optimal zone radius dependence on application-layer traffic
For a zone radius of one, ZRP is essentially an on-demand routing protocol. When theapplication-layer data is directed to a large number of different destinations many route requestsmust be initiated, resulting in a significant increase in control traffic. On the other hand, whenthe zone radius is large more destinations lay within the intrazone so fewer route requests areneeded. When a route request is initiated it benefits from bordercasting and generates less route-discovery control traffic. The generated route discovery traffic is also a smaller portion of theoverall control traffic. Thus, when the zone radius is large, the amount of control traffic does notvary greatly with variance in the application-layer data destinations.
Initial Node Placement:
Initial placement of network nodes does affect the amount of lower-layer traffic. We examinetwo different placement patterns. Figure 4.7 shows an initial placement of nodes in a regularlattice and where nodes are randomly placed in the simulation grid.
Figure 4.7: Simulations are done with both orderly node placement and random node placement
Orderly Placement Random Placement
Total ZRP Control Traffic (30 km/hr Node Velocity)
020406080
100120140160
1 2 3 4 5
Zone Radius
Pac
kets
per
sec
on
d p
er
no
de 2 Pkts/Destination Traffic
10 Pkts/Destination Traffic20 Pkts/Destination Traffic

32
If a network is to maintain full connectivity, then each node must be connected to at least oneother node that has further connectivity into the network. If a node loses contact with all othernodes or a group of nodes loses contact with another group of nodes, the network has partitionedand some messages will not reach their destination. Partitioned subnetworks cannotcommunicate with each other. With the average nodal density used in these simulations networkpartitions are common as seen in Figure 4.7.
The amount of IARP and IERP traffic is a function of the largest connected component in thenetwork. For routing purposes, the nodes in any particular partitioned subnetwork will view theworld as consisting of that subnetwork. The total number of lower-layer messages generated bythe network is the sum of the number of lower-layer messages generated by each of theconnected components. Increasing the zone radius past the diameter of any particular componentwill not result in an increase in the amount of IARP traffic within that component. Increasing thenetwork zone radius results in an increase in the overall IARP traffic as long as there is aconnected component with a diameter large enough to use the larger radius. As the radiusincreases there are fewer components that are able to take advantage of that change, and thusfewer nodes contribute to an increase in the IARP traffic.
IERP traffic is generated in direct response to application-layer traffic generation. Each routerequest generates a number of IERP messages equal to some fraction of the number of nodes inthe connected component in which the initiating node lies. Again, the total is dominated by thelargest connected component in the network.
In Figure 4.8 we show the number of control messages per second with the two different initialpositions as shown in Figure 4.7. Nodes are given zero velocity because a network with randommovement and an orderly initial position degenerates into a network with random placement.
Figure 4.8: Total ZRP control traffic with both an orderly lattice initial node position and arandom initial node position
Total ZRP Control Traffic (0 km/hr Node Velocity)
0
50
100
150
200
1 2 3 4 5
Zone Radius
Pac
kets
per
sec
on
d p
er
no
de
Orderly Lattice Initial NodePosition
Random Initial NodePosition

33
There are no network partitions in the orderly placement scenario. This allows for the full effectsof the control traffic’s quadratic dependence on the zone radius to be seen. This quadraticdependence on the zone radius results in a significant number of control messages for large zoneradii. Thus the selection of the zone radius is more critical when the network is fully connectedthan when it is partitioned.
4.4 End-to-End Data Delay
An important measure of any routing protocol is the total time to propagate an application-layerpacket from a source node to destination node. This delay is defined as the amount of time frompacket creation to the time it is received at the destination application-layer. In our simulations,delays from route discovery, data transmission, cryptographic processing and queuing areaccumulated. However, we do not include the delays associated with media access control. If anode’s destination is listed in its routing table, the query to the routing protocol is immediatelyanswered and no time is assumed to expire for this step and no delay is accumulated for thisaction. On the other hand, if no route is listed in the table, a route request is initiated. In this case,the application-layer packet is queued and a route-request packet is generated and transmitted.
Figure 4.9 shows two nodes communicating over a multihop path. In this figure, Node 2 cancommunicate directly with Node 9, but cannot communicate directly with Node 16. Thus, forNode 2 to communicate with Node 44 a number of nodes must participate in relaying themessage to Node 44. Figure 4.10 plots the time for Node 2 to send a packet to Node 44 with zoneradii of two and six respectively.
Figure 4.9: Node 2 transmitting data packets to Node 44

34
Figure 4.10: Time to deliver a number of application-layer packets from Node 2 to Node 44with a two-hop radius and six-hop radius
With a zone radius of two, the first packet sent to node 44 takes longer than the subsequentpackets. This is due to the route discovery process. After the route has been discovered the end-to-end delay is essentially the same for both of the zone radii considered. These results are basedon a packet size of 1024 bytes and a transceiver data rate of 10Mbps. Only node 2 is generatingapplication layer messages.
Below is a set of curves that show average end-to-end delay for various zone radii and trafficloads. Each figure includes the average end-to-end delay with and without the overhead ofcryptographic features. The cryptographic processing delay is one millisecond. The simulationsfor these plots have all nodes generating traffic. Nodes receive packets from multipledestinations, they forward theses message as well as generate their own. Packets inevitably willbe queued since the node can transmit a single message at a time.
Figure 4.11: Impacts of link-layer cryptography on low application-layer traffic
Average Application Packet Latency (Low Traffic)(2 pkts/session, 4 pkts/sec, 1 sec between sessions)
0
0.2
0.4
0.6
0.8
1
1.2
1 2 3 4 5
Zone Radius
Del
ay (s
ec)
No Cypto, 0 km/hr
No Crypto, 30 km/hr
No Crypto, 60 km/hr
Crypto, 0 km/hr
Crypto, 30 km/hr
Crypto, 60 km/hr
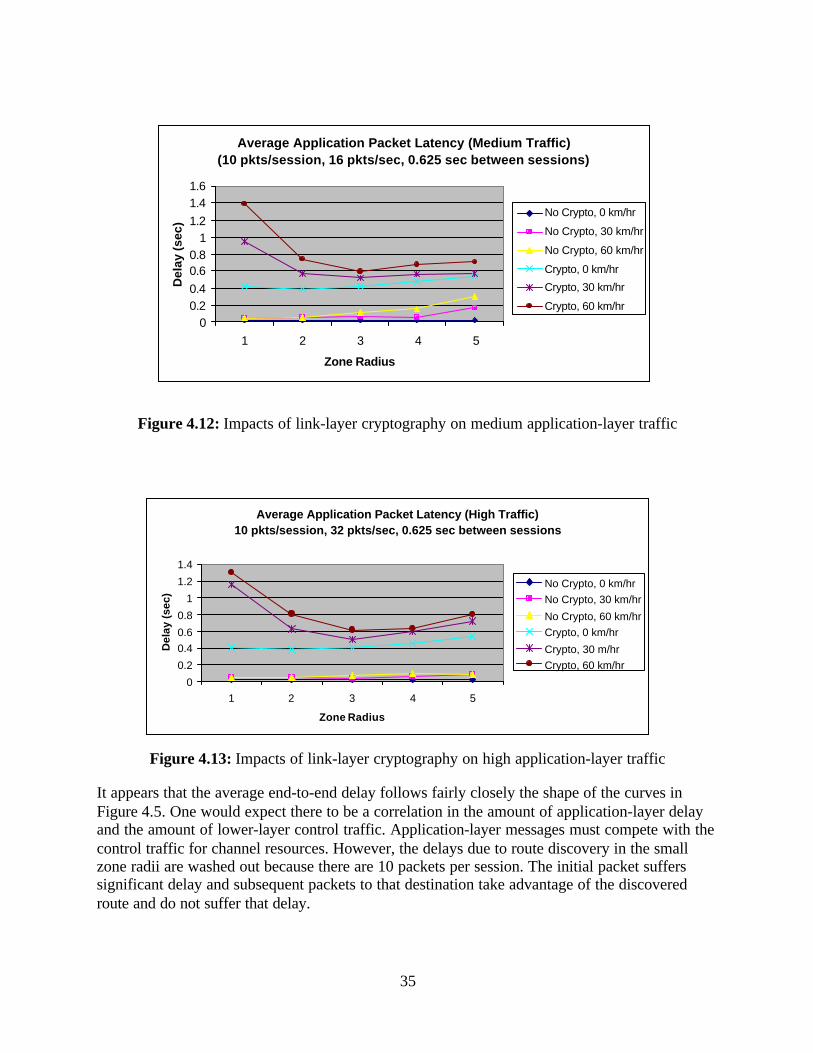
35
Figure 4.12: Impacts of link-layer cryptography on medium application-layer traffic
Figure 4.13: Impacts of link-layer cryptography on high application-layer traffic
It appears that the average end-to-end delay follows fairly closely the shape of the curves inFigure 4.5. One would expect there to be a correlation in the amount of application-layer delayand the amount of lower-layer control traffic. Application-layer messages must compete with thecontrol traffic for channel resources. However, the delays due to route discovery in the smallzone radii are washed out because there are 10 packets per session. The initial packet sufferssignificant delay and subsequent packets to that destination take advantage of the discoveredroute and do not suffer that delay.
Average Application Packet Latency (Medium Traffic)(10 pkts/session, 16 pkts/sec, 0.625 sec between sessions)
00.20.40.60.8
11.21.41.6
1 2 3 4 5
Zone Radius
Del
ay (s
ec)
No Crypto, 0 km/hr
No Crypto, 30 km/hr
No Crypto, 60 km/hr
Crypto, 0 km/hr
Crypto, 30 km/hr
Crypto, 60 km/hr
Average Application Packet Latency (High Traffic)10 pkts/session, 32 pkts/sec, 0.625 sec between sessions
0
0.2
0.40.6
0.8
1
1.2
1.4
1 2 3 4 5
Zone Radius
Del
ay (
sec)
No Crypto, 0 km/hrNo Crypto, 30 km/hr
No Crypto, 60 km/hrCrypto, 0 km/hr
Crypto, 30 m/hrCrypto, 60 km/hr

36
4.5 Routing Table Convergence
ZRP depends on IARP to proactively build a routing table based on the link-state of neighboringnodes. At network start-up, each node builds from scratch a routing table. With each new link-state update that it receives a node refines its view of its intrazone. If at some point the routingtable reflects the actual topology of the intrazone, the table is considered to have converged. Thetime that it takes for the routing table to converge is dependent on the timer setting of the IARPlink-state update period and the NDP beacon period as well as node speed. In reality, nodemovement and the periodic update of topological information means that there will be times thatthe routing table is not 100 percent correct. As speed increases, with the beacon rates constant,one would expect that there is a point where the routing table will consistently have an incorrectview of the zone. On the other hand, if the speed is zero, once the table converges it will alwaysbe correct.
Conceivably there are various metrics that one could apply to measure the quality of the routingtable as it is being built. At any given moment, one may compare every possible path in the notquite complete route-table with every possible path in the true intrazone. This is somewhat timeconsuming. We selected a much simpler method of measuring the quality of the route table as itevolves. As the routing table is built, it grows in size and at some point the size remains roughlyconstant. At this point the routing table contains all the pertinent information about the zone andrarely changes except to compensate for link-state changes. For our simulations, our measure ofrouting table convergence is a ratio of the size of the table to the size of the steady state table.
Figure 4.14 illustrates the convergence of the IARP routing table as time progresses. The zoneradius is six, the initial node placement is a regular lattice, and various cryptographic delays areapplied. Since the convergence time is fairly small, node movement is minimal during that time,so only the results of zero node speed are presented.
Figure 4.14: Time for protocol to complete proactive region routing table(Note: No and 1ms Delay curves are virtually identical)
The IARP update period will dramatically affect the rate at which the routing table converges.Each node generates its own link-state messages at a rate of one per IARP update period starting
IARP Routing Table Convergence Time
0.00
20.00
40.00
60.00
80.00
100.00
0.4 0.6 0.8 1 1.2 1.4
Time (seconds)
Per
cent
Con
verg
ed
No Cryptography Delay
1ms Cryptography Delay
10ms Cryptography Delay

37
at a random time during the first period from the startup of the network. By the end of that firstperiod all nodes have sent their initial link state information. The nodes that sent theirinformation early send an incomplete view of their intrazone, while those who send later send amore complete view of their zone. In our simulations, the update period is set to one second. It isat this point that there is a significant increase in the quality of the routing table for all but thecase where the cryptographic overhead is highest. When the delay associated with cryptographyis a sizeable fraction of the IARP update period its impact is felt during route table generation.
Inspection of a routing table that has attained 30 percent of its steady state size reveals that routesto most nodes in the intrazone are contained in the table, however some of the most efficientpaths are missing. Even when the table is in a state of growth and not 100 percent converged, thenetwork is still functional.
5. Future Work
There are significant performance impacts on MANETs that employ link-layer security features.For simulation purposes our research required the selection and use of a specific MANETrouting protocol and media access protocol. During our work, several questions arose as to howto modify the protocols we studied to make them more efficient so that they would not be sosensitive to cryptographic delays. Our results indicate that further protocol efficiencyimprovements are necessary before security features can be easily added to MANET lower-layerprotocol. In this section we present a list of further research areas.
• Cornell’s ZRP uses a reliable broadcast that sends broadcast messages to each neighborin transmission range individually. The simulation determines the neighbors by a physicaldistance calculation. Link-state updates that are distributed with a true broadcast willreduce the amount of IARP message traffic thus improving routing protocol performance.However, with a true broadcast approach, there will be an increased probability ofdropped packets because of packet collisions due to the hidden terminal problem.Collisions may occur frequently since there may be a large number of link-state updates.Further, key management techniques become an issue in the broadcast mode. A nodesigns a message and broadcasts it, and each receiving node must verify the message. Thisverification can only take place if the verifying nodes have the keys necessary to do so.Public key protocols are ideal for such a scenario, but we have shown that they are toocomputationally intensive to be of use for securing lower-layer messages. Network-widesymmetric keys are an issue if a node is compromised. Neighborhood-wide symmetrickeys are a possible option. A different MAC approach that reduces the probability and/orimpact of collisions during the broadcast of lower-layer messages is another area ofresearch.
• Our implementation of ZRP uses a periodic IARP beacon and a periodic link-state updatethat is independent of node velocity. In each period, IARP transmits the current link-stateeven if it has not changed. In turn, the neighbor nodes forward the link-state to nodeswithin the intrazone. Unless a node’s link state changes, sending out its complete link-state information is a waste of resources. Hello beacons may be modified to contain a flagindicating that there has been no change in the link-state. Once the network has

38
converged, it may be more efficient to propagate information describing the change inlink-state rather than propagate the entire table. If the network is relatively static, it maybe possible to have the link-state change information tag along with upper-layer messagesrather than be sent out individually. If the network is more dynamic, then it may be betterto revert to the passing of link-state information.
• The selected simulation scenarios used in our studies all suffered some degree of networkpartitioning when the nodes moved in random directions. One can easily considerapplications where the node density would be less than the scenario used in this reportand thus would suffer from a greater number of partitions. Each subnetwork requiresfewer control messages per unit of time, but the nodes in the subnetwork have a smallerset of possible message destinations. In a high consequence network, it may be thatcertain nodes are designated to put themselves into a position that will keep the networkfrom partitioning. More reasonable movement patterns need to be studied andincorporated into the simulations. However, it may be quite resource expensive toguarantee a network will not partition. Thus, methods to cache messages for laterdelivery are necessary for efficient MANET operation.
• Because node density plays a significant role in the efficiency of the network, methods ofadaptive power control should be folded into the routing algorithm. Nodes that havemany neighbors can reduce their transmission radius and maintain communication withthe network. This may increase the number of hops necessary to send a message, but willreduce the amount of interference with neighboring nodes. This results in more nodesbeing able to communicate at any given time. However, nodes equipped with adaptivepower control will have a higher incidence of asymmetric links. Nodes with unequalpower transmissions will also subvert, to some extent, the CSMA/CA media accesstechnologies.
6. Conclusions
This report began with an introduction and brief explanation of the network and data-link layersused in a typical wireless MANET. Protocols implemented at these layers generate control trafficto support their operation. This control traffic is critical to network operation and must besecured. Cryptographic features can be used to secure the control messages, however, such usecomes at a cost in performance. This research identifies specific costs in performance whencryptographic features are used to secure lower-layer messages.
To identify specific performance costs we selected widely known routing and data-link layerprotocols. ZRP was selected for the routing protocol and IEEE 802.11 standard was selected forthe data-link layer protocol.
An analysis is presented of the message exchange that takes place when the IEEE 802.11 MACaccesses the wireless medium. Cryptographic features were applied to each of the messagesinvolved in the data-link layer exchange. The time that it takes to complete a data-link layerRTS/CTS/DATA/ACK exchange is highly sensitive to the time required for cryptographic

39
processing. In the extreme, available channel bandwidth remains idle while nodes processcryptographic algorithms.
To quantify the performance impact that lower-layer cryptographic features have on overallnetwork performance, we considered the data throughput available when MANET overheads areaccounted for. We show throughput results when various cryptographic processing delays areapplied. We also consider channel contention, multihop impacts, and control overhead. Weobserve a drastic reduction in end-to-end throughput when these overheads are considered.
Since application-layer traffic and node mobility have a large impact on routing protocolperformance, we simulated protocol operation under various parameter settings to determineoptimal zone radii to minimize the amount of control traffic. Changes in application-layer trafficand mobility cause this optimal zone radius to vary slightly. Varying these parameters in a largernetwork will lead to a greater variation in the optimal zone radius. Our results show that smalldeviations from the optimal zone radius leads to a large increase in control traffic.
End-to-end delay of application-layer messages is found to increase when cryptographic featuresare used in MANETs. Messages directed to the interzone will suffer increased end-to-end delaysince control messages are delayed at each hop while their cryptographic features are processed.In this case the initial message suffers discovery delays and subsequent messages to the samedestination take advantage of the discovered route and do not suffer the discovery delay.Messages directed to proactive route regions also suffer from delays since the channel isoccupied longer and thus additional time is required to access the channel.
Application-layer end-to-end delay is also impacted by the time it takes to generate a usefulrouting table. Cryptographic processing overheads slow down the generation and maintenance ofeach node’s routing table. Our simulation studies indicate that until the processing delays are onthe order of the link-state update period, the delays do not significantly impact tableconvergence. However, when the delays become large enough, routing table generation isslowed down and network operation will depend on potentially stale routing tables, resulting ininefficient operation.
Some method of security must be applied at the data-link layer to protect lower-layer controlmessages to enhance system security. Our study shows that applying cryptographic features tothe control messages in many cases introduce unacceptable network performance. Our findingsindicate MANET operation depends on a number of highly sensitive attributes. Non-optimalnetwork design will inevitably lead to drastic decreases in network performance. Blindapplication of cryptographic features to secure lower-layer MANET protocols could easilydestroy network functionality.

40
7. References
[1] O. Berg, T. Berg, S. Haavik, J. Hjelmstad, and R. Skaug. Spread Spectrum in MobileCommunications. IEEE, 1998.
[2] N. Borisov, I. Goldberg, D. Wagner. Intercepting Mobile Communications: TheInsecurity of 802.11, Proceedings of MOBICOM2001, 2001.
[3] Breezecom, IEEE 802.11 Technical Tutorial. http://www.breezecom.com.
[4] J. Broch, D. Johnson and D. Maltz. Dynamic Source Routing (DSR). Internet Draft, draft-ietf-manet-dsr-03.txt, October 22, 1999.
[5] J. Broch, D. Johnson, D. Maltz, Y. Hu, and J. Jetcheva. A Performance Comparison ofMultihop Wireless Ad Hoc Network Routing Protocols. Proceedings of the Fourth AnnualACM/IEEE Conference on Mobile Computing and Networking, Mobicom, 1998.
[6] W. Chen, N. Jain, and S. Singh. ANMP: Ad Hoc Network Management Protocol, IEEEJournal on Selected Areas in Communications, August, 1999.
[7] M. S. Corson and V. Park. Temporally Ordered Routing Algorithm (TORA). InternetDraft, draft-ietf-manet-tora-spec-02.txt, October 22, 1999.
[8] M. S. Corson, S. Papademetriou, P. Papadopoulos, V. Park, and A. Qayyum. An InternetMANET Encapsulation Protocol (IMEP) Specificaion. Internet Draft, draft-ietf-manet-imep-spec-02.txt, August 21, 1999.
[9] M. S. Corson and J. Macker, Mobile Ad Hoc Networking: Routing Protocol PerformanceIssues and Evaluation Considerations. Internet Draft, January 1999.
[10] B. Dahill, B. N. Levine, E. Royer, C. Shields. A Secure Routing Protocol for Ad HocNetworks. Technical Report UM-CS-2001-037, Electrical Engineering and ComputerScience, University of Michigan, August 2001.
[11] W. Dai. Crypto++ 4.0 Benchmarks. http://www.eskimo.com/~weidai/.
[12] J. J. Garcia-Luna-Aceves, M. Spohn, and D. Beyer. Source Tree Adaptive Routing(STAR) Protocol. Internet Draft, draft-ietf-manet-star-00.txt, October 22, 1999.
[13] Z. J. Haas, J. Deng, B. Liang, P. Papadimitratos, S. Sajama. Wireless Ad Hoc Networks.Cornell University Report. December, 2001.
[14] Z. J. Haas and M. R. Pearlman. Providing Ad Hoc Connectivity With the ReconfgurableWireless Networks. In Charles Perkins, editor, Ad Hoc Networks. Addison WesleyLongman, 2000.

41
[15] Z. J. Haas and M. R. Pearlman. The Zone Routing Protocol (ZRP) for Ad Hoc Networks.draft-ietf-manet-zone-zrp-03.txt, March 2000.
[16] W. R. Heinzelman, J. Kulik, and H. Balakrishnan. Adaptive Protocols for InformationDissemination in Wireless Sensor Networks. Fifth ACM/IEEE MOBICOM Conference,Seattle, WA, August 1999.
[17] Y. Hu, D. B. Johnson, A. Perrig. Ariadne: A Secure On-Demand Routing Protocol for AdHoc Networks. Proceedings of the Eighth Annual International Conference on MobileComputing and Networking, (MobiCom 2002).
[18] Y. Hu, D. B. Johnson, A. Perrig. SEAD: Secure Efficient Distance Vector Routing forMobile Wireless Ad Hoc Networks. Fourth IEEE Workshop on Mobile ComputingSystems and Applications \mbox\rm (WMCSA '02), 2002.
[19] S. Jacobs and M. S. Corson. MANET Authentication Architecture, Internet Draft. InternetDraft, draft-jacobs-imep-auth-arch-01.txt, March 1999.
[20] P. Jacquet, P. Muhlethaler, and A. Qayyum. Optimized Link State Routing (OLSR)Protocol. Internet Draft, draft-ietf-manet-olsr-01.txt, February 7, 2000.
[21] P. Jacquet and L. Viennot. Overhead In Mobile Ad Hoc Network Protocols. INRIAReport, June 2000.
[22] S. Jiang, N. Vaidya, and W. Zhao. Preventing Traffic Analysis in Packet Radio Networks.DARPA Research.
[23] S. Jiang, N. Vaidya, and W. Zhao. Power-Aware Traffic Cover Mode to Prevent TrafficAnalysis in Wireless Ad Hoc Networks. IEEE INFOCOM 2001.
[24] V. Karpijoki. Signaling And Routing Security In Mobile And Ad Hoc Networks. Report.Helsinki University of Technology, May 2000.
[25] S. Kent and R. Atkinson. IP Authentication Header. RFC 2402, November 1998.
[26] S. Kent and R. Atkinson. IP Encapsulating Security Protocol (ESP). RFC 2406,November 1998.
[27] S. Kent and R. Atkinson. Security Architecture for the Internet Protocol. RFC 2401,November 1998.
[28] V. Lakshminarayan. NETWARS Standards Architecture and Implementation Issues.NETWARS Standards Working Group. 1998.
[29] S. M. Lawandowski, D. J. Van Hook, G. C. O’Leary, J. W. Haines, and L. M. Rossey,SARA: Survivable Autonomic Response Architecture. DARPA Report.

42
[30] J. Li, C. Blake, D. De Couto, H. Lee, R. Morris. Capacity of Ad Hoc Wireless Networks,The 7th annual International Conference on Mobile Computing and Networking, Rome,Italy, July 2001.
[31] J. Lundberg. Routing Security in Ad Hoc Networks. Tik-110.501 Seminar on NetworkSecurity, Helsinki University of Technology, Telecommunications Software andMultimedia Laboratory, 2000.
[32] OPNET Technologies. OPNET Users Manual. [email protected].
[33] P. Papadimitratos and Z. J. Haas. Secure Routing for Mobile Ad Hoc Networks. In SCSCommunication Networks and Distributed Systems Modeling and Simulation Conference(CNDS 2002), January 2002.
[34] M. R. Pearlman and Z. J. Haas. Determining the Optimal Configuration for the ZoneRouting Protocol. IEEE Journal on Selected Areas in Communications, August 1999.
[35] M. R. Pearlman and Z. J. Haas. The Performance of Query Control Schemes for the ZoneRouting Protocol. AFRL Report.
[36] M. R. Pearlman. Email Conversation. September 26, 2001.
[37] C. E. Perkins. Ad Hoc Networking. Addison-Wesley, 2001.
[38] C. E. Perkins, E. M. Royer, and S. R. Das. Ad Hoc On-Demand Distance Vector (AODV)Routing. Internet Draft, draft-ietf-manet-aodv-04.txt, October 22, 1999.
[39] C. E. Perkins and P. Bhagwat. Highly Dynamic Destination-Sequenced Distance-Vector(DSDV) Routing For Mobile Computers. In Proc. SIGCOMM’94, pages 234–244,August 1994.
[40] C. E. Perkins and E. M. Royer. Ad Hoc On-Demand Distance Vector Routing. InProceedings of the 2nd IEEE Workshop on Mobile Computing Systems andApplications, pages 90-100, February 1999. New Orleans, LA.
[41] M. Torgerson and B. Van Leeuwen. Routing Data Authentication in Wireless Ad HocNetworks. Sandia National Laboratories, SAND Report 2001-3119, October 2001.
[42] B. Van Leeuwen, J. Espinoza, and P. Sholander. Effective Protocols for MobileCommunications and Networking. Sandia National Laboratories, SAND ReportSAND98-2753, December 1998.
[43] M. G. Zapata. Secure Ad Hoc On-Demand Distance Vector (SAODV) Routing. InternetDraft, draft-guerrero-manet-saodv-00.txt, August 12, 2001.
[44] L. Zhou and Z. Haas. Securing Ad Hoc Networks. DARPA Report.

43
8. Appendix A (Simulation Details)
The simulation software used for this research was the OPNET Modeler and Radio simulationpackage Version 7.0. We also selected Cornell’s Zone Routing Protocol (ZRP) [15] for oursimulation studies, because it is a hybrid approach that includes both a proactive and reactiverouting region. In addition, an OPNET model for the ZRP implementation was available fromPearlman and Haas [15] of Cornell University. In this section, we review some of the details andspecifics of the models we created for our simulations.
8.1 Optimum Network Performance (OPNET):
Optimum Network Performance (OPNET) [32] is a comprehensive engineering system capableof simulating large communication networks with detailed protocol modeling and performanceanalysis capability. OPNET features include: graphical specifications of models; a dynamic,event-scheduled simulation kernel; integrated tools for data analysis; and hierarchical, object-based modeling. OPNET’s hierarchical modeling structure accommodates difficult problemssuch as distributed protocol development and performance evaluation. With OPNET, networksimulation modeling can be performed at a high-level using OPNET's extensive library of vendordevices, or at a very low level, where custom protocols using a graphical state transition diagrameditor and C/C++ code can be developed. The functionality of each programmable block isdefined by a process model that combines a finite state machine with the flexibility of the Cprogramming language, and an extensive library of predefined models. Ad hoc routing protocolsare still under development and so OPNET does not have predefined models for these protocols.Fortunately, OPNET is flexible enough to allow the user to develop and incorporate custommodels into the simulation tool.
A network application model is used in OPNET to generate typical network traffic patterns. Thesimulator has standard client-server node models as well as provides the user with opportunity tocreate custom or user-defined application level traffic. Client-server and server-serverinteractions can be described as a series of phases, consisting of either data transfer orprocessing.
OPNET analyzes system behavior and performance with a discrete-event simulation engine.Discrete-event simulation is an approach that supports realistic modeling of complex systemsthat can be represented as a progression of related events. This approach models system behaviorbased on objects and distinct events such as the arrival of packets at various points in a network.Each object has associated attributes that control its behavior in the simulation.
The OPNET simulation tool is generally accepted as the simulation tool of choice in the DoD.Many future DoD communication systems are, or will soon be, network based. The Joint Staff J6is in the process of providing a common set of network analysis tools to the defense communitythrough its Networks and Warfare Simulations (NETWARS) effort [28]. The NETWARS effort,which uses OPNET as the simulation engine, has involved developing a number of peripheraltools that can be used for efficiently building OPNET network models, running simulations, andanalyzing various OPNET results.

44
8.2 Modeling and Simulating the Zone Routing Protocol:
The simulation is implemented by creating individual mobile nodes that incorporate the ZRProuting protocol. These mobile nodes are distributed throughout a two dimensional area torepresent a network. Each mobile node is identical and creates application-layer traffic asdescribed in Section 3. Mobile nodes are given an initial position, a speed, and a randomdirection. The mobile nodes, shown in Figure 8.1, are further subdivided into node objects. Thevarious node objects that make up a MANET node are:
• Movement object• Traffic generation object• Routing object• Security overhead object• Media access control (MAC) object• Transceiver object• Channel object
Figure 8.1: Model of MANET node
Movement object:
Nodes are permitted to move in a two-dimensional field. The node’s initial position is defined byits (x,y) coordinate positing in the simulation area. A global speed is entered into the simulation

45
variable block. During the simulator’s initialization phase a direction based on a random numberis applied to the node. As the simulation runs, each node moves with the entered speed in theidentified direction. Node positions are updated at each event occurrence.
Figure 8.2: Movement object moves nodes in random direction during simulation
Traffic generation object:
A simple application layer traffic generation object is used to create traffic from each of thenodes. Source nodes generate packets destined for randomly chosen destination nodes. Any nodein the network is an eligible choice for destination. The application-layer traffic is delivered onbest effort basis and no retries are attempted if a packet cannot be successfully delivered. Theapplication-layer generates a session of traffic to the destination node. Sessions start at a randomtime and have a predefined number of packets be directed to the destination node. It is at thebeginning of each session that the random destination is selected. This session approach topacket destination choice is an attempt to mimic true network traffic, where larger streams ofdata destined to a node are packetized and shipped out in succession. The application-layer has apause between sessions prior to the selection of a new destination for the next session. The trafficgeneration process object is shown in Figure 8.3.
Time = 0 Time = 60 secondsTime = 0 Time = 60 seconds
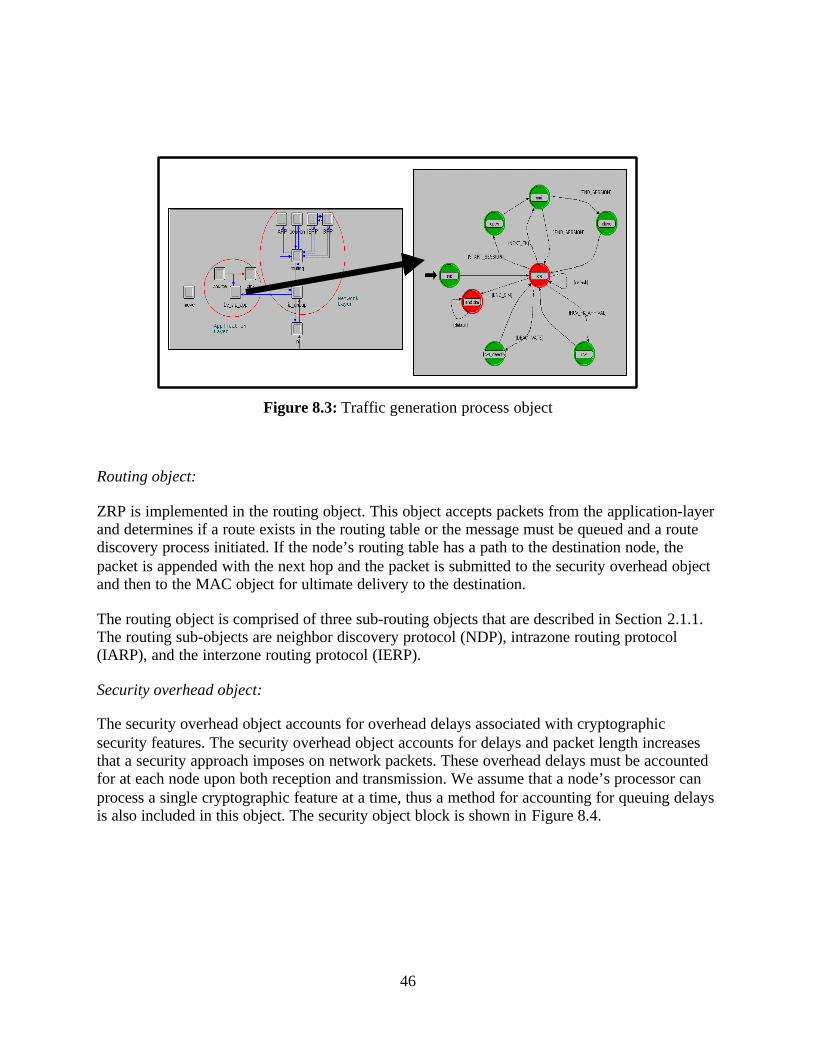
46
Figure 8.3: Traffic generation process object
Routing object:
ZRP is implemented in the routing object. This object accepts packets from the application-layerand determines if a route exists in the routing table or the message must be queued and a routediscovery process initiated. If the node’s routing table has a path to the destination node, thepacket is appended with the next hop and the packet is submitted to the security overhead objectand then to the MAC object for ultimate delivery to the destination.
The routing object is comprised of three sub-routing objects that are described in Section 2.1.1.The routing sub-objects are neighbor discovery protocol (NDP), intrazone routing protocol(IARP), and the interzone routing protocol (IERP).
Security overhead object:
The security overhead object accounts for overhead delays associated with cryptographicsecurity features. The security overhead object accounts for delays and packet length increasesthat a security approach imposes on network packets. These overhead delays must be accountedfor at each node upon both reception and transmission. We assume that a node’s processor canprocess a single cryptographic feature at a time, thus a method for accounting for queuing delaysis also included in this object. The security object block is shown in Figure 8.4.

47
Figure 8.4: Simulation process blocks that incorporate link-layer cryptographic overhead
Media access control (MAC) object:
The MAC object includes the neighbor discovery protocol and the typical MAC functions. Theneighbor discovery protocol periodically broadcasts a short packet that includes the broadcastingnode’s address. The broadcasts are heard by neighboring nodes within communication range.
Two MAC models are considered in this research; an ideal model and a high-fidelity model ofthe IEEE 802.11 protocol that is based on CSMA/CA. The ideal MAC object provides idealscheduling of packet transmissions to avoid collisions and ensures packet delivery by assigningthe packet to the destination node with the necessary delays. The ideal approach is used to focusthe analysis on the routing protocol. The 802.11 MAC is explained below.
Transceiver object:
Simulations are executed with either an ideal transceiver object or a more realistic transceiverobject associated with OPNET’s 802.11 wireless LAN model. The ideal transceiver objectaccounts for signal strength and receiver sensitivity based on a predefined distance.Transmissions are received free from errors provided the receiving node lies within thepredefined distance; otherwise the transmissions are lost. Channel contention issues for the idealtransceiver are limited to contention of packets from the transmitting node. The transceiverobject queues packets that require transmission until the node completes transmitting previouslyqueued packets. Broadcast messages are unicast to each node within range.
OPNET’s 802.11 wireless LAN model supports a high fidelity representation of the transceiverand channel access. This model incorporates all LAN nodes that share the wireless channel, thusnetwork wide channel contention issues can be addressed. In theory the model will improve thefidelity of simulations; unfortunately OPNET’s model does not perform as advertised andsimulation results with this model are not included.

48
Channel object:
OPNET simulates the communications between two nodes with a transceiver pipeline process.The transceiver pipeline mimics various aspects of the channel behavior such as transmissiondelay, link closure, channel match, transmitter and receiver antenna gain, propagation delay,received power, background noise, interference noise, receiver required signal-to-noise (SNR)ratio, bit error rate, error allocation, and error correction function. However, as the simulationincludes more of these channel aspects the simulation run-time increases. In our ideal MAC andchannel simulation, the various channel impacts other than propagation delay are not included.Most of the channel characteristics are not necessary for an evaluation of the security overheadimpacts of on lower-layer performance. Figure 8.5 illustrates the channel aspects available to theOPNET simulator.
Figure 8.5: Elements that are modeled in the OPNET Radio Channel [32]
8.3 Modeling and Simulating the IEEE 802.11 MAC
Simulations were considered with OPNET’s high-fidelity model of the IEEE 802.11 MAC sub-layer. These simulations include wireless channel aspects such as channel access, contentionissues, and the affects of the IEEE 802.11 standard virtual channel access techniques. Channelimpairments due to environmental noise can be included in simulations with the high-fidelitymodel. Unfortunately, at the completion of this research several bugs remained in OPNET’sIEEE 802.11 wireless MAC model and our confidence in the results did not meet our standardsfor this report.

49
The IEEE 802.11 standard requires that all nodes in a cell, called a Basic Service Set (BSS), bewithin a limited range of other nodes in the BSS. The range is defined such that all nodes in theBSS must be able to receive either the RTS or the CTS of two nodes that wish to communicateand be within range of an access point. The access point is a gateway to some larger network.
As written, the IEEE 802.11 standard is not intended for multihop networks. However, theprotocol can easily be applied to such a network. The standard requires that a node with its NAVset must ignore all communications until its NAV counts to zero. If a node sends a packet toanother node that has its NAV set, the packet will be ignored and the sending node willretransmit after the appropriate amount of time.
It is possible to make the transition from a single cell network using the IEEE 802.11 MAC to amultihop network using IEEE 802.11 technology. Furthermore, academic research done in thearea of multihop wireless networks uses the 802.11 MAC approach. As such, one would thinkthat OPNET’s extensively detailed 802.11 model would be ideal for simulating a multihopnetwork. However, this is not the case. OPNET has chosen to follow the IEEE 802.11admonition that all nodes should hear either the RTS or the CTS and has essentially ignored theadmonition that all nodes should ignore communications when their NAV is set.
Study of OPNET’s IEEE 802.11 MAC code indicates the model requires all network nodes bepart of the same BSS. That is, all nodes must receive either the RTS or CTS. When a node has itsNAV set and it is the target of another transmission, the model’s fragmentation and reassemblymodule fails to resolve the fact that the packet was not really received. The simulation fails whenthe module attempts to remove from the reassembly buffer a packet that that has not been storedin the buffer. In our simulations, any nodes that attempted to communicate with another nodethat had its NAV set caused the simulation to come to an abrupt end.
Because the hidden terminal problem, is inevitable in multihop wireless networks, it is clear thatnodes will attempt to communicate with nodes that have their NAV set. Node movement orchanging of BSS also means that nodes will attempt to communicate with nodes that have theirNAV set. The small failure to properly account for unreceived packets makes OPNET’s IEEE802.11 MAC model unusable for anything but a simulation of single cell implementations of theIEEE 802.11 MAC. Unfortunately, the way the OPNET code is written makes fixing theproblem non-trivial.
8.4 Simulation Statistics Collection
This research is primarily interested in collecting statistics related to routing protocol controldata and the impacts of security on the network control data. The OPNET simulator onlyprovides a partial solution to our data collection interests. OPNET is used to collect individualpacket latency results, and incorporate an inherent statistical collection method for each of theirmodels. However, collecting statistics in our custom models and over several simulation runs isquite cumbersome to use the OPNET statistic collection method. In this research, simulation datais collected with custom variables and is written to a data file upon completion of the simulation.Compilation of the data is performed with Excel.

50
DISTRIBUTION:MS
1 0839 R. L. Craft, 160001 0775 M. J. Eaton, 58521 1138 L. J. Ellis, 65021 1002 P. Garcia, 152021 0785 D. P. Duggan, 65161 9201 M. M. Goldsby, 81141 1125 J. J. Harrington, 152521 0785 R. L. Hutchinson, 65161 9201 M. M. Johnson, 81141 9101 R. D. Kyker, 82321 0812 J. H. Maestas, 93341 0785 T. S. McDonald, 65141 1125 A. K. Miller, 152521 0529 M. B. Murphy, 23461 1004 F. J. Oppel III, 152211 0455 R. D. Pollock, 65011 1170 R. D. Skocypec, 153101 0784 M. J. Skroch, 65121 0785 J. E. Stamp, 65161 0801 M. R. Sjulin, 93301 0806 T. D. Tarman, 93361 0455 R. S. Tamashiro, 65175 0785 M. D. Torgerson, 65141 0784 R. E. Trellue, 65015 0785 B. P. Van Leeuwen, 65161 0103 J. P. VanDevender, 121001 0451 S. G. Varnado, 65001 0806 E. L. Witzke, 93361 0785 W. F. Young, 65161 0188 LDRD Program Office, 1030 (Attn: Donna Chavez)2 0899 Technical Library, 96161 0612 Review & Approval Desk for DOE/OSTI, 96121 9018 Central Technical Files, 8945-1