Performance Guard 4.1 Presentation Toll Free Dial In Number:(877)826-8983 Int'l Access/Caller Dial...
13
Performance Guard 4.1 Presentation Toll Free Dial In Number:(877)826-8983 Int'l Access/Caller Dial In Number:(601)948-8023 PARTICIPANT CODE:793997 Doug Brown [email protected] Joe Murano [email protected]
-
Upload
madeleine-curtis -
Category
Documents
-
view
217 -
download
0
Transcript of Performance Guard 4.1 Presentation Toll Free Dial In Number:(877)826-8983 Int'l Access/Caller Dial...
Performance Guard 4.1 Presentation
Toll Free Dial In Number:(877)826-8983Int'l Access/Caller Dial In Number:(601)948-8023
PARTICIPANT CODE:793997Doug Brown [email protected] Murano [email protected]

Is Perception Reality?
• “Citrix is slow”
• “It took me 30 minutes to logon yesterday”
• “I Couldn’t start Outlook this morning”
• “Suddenly Word comes to a grinding halt”
• “My sessions keep terminating”
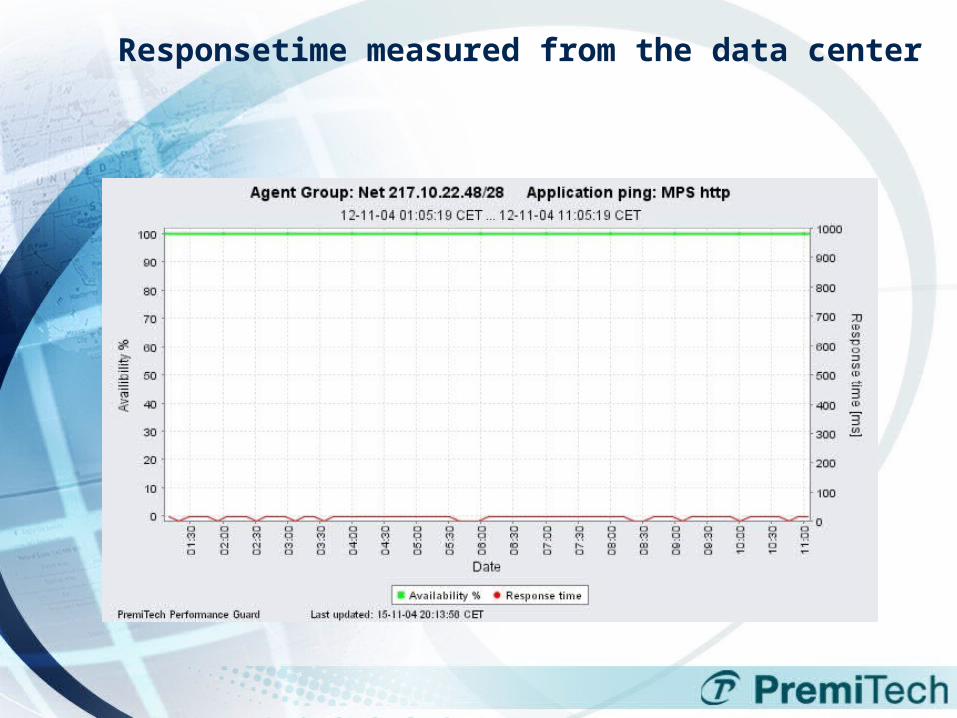
Responsetime measured from the data center

Responsetime measured from the end-user

Where are most performance problems found in Citrix?
ICA Client Latency
– LAN, WAN, Routers, Wireless
Misconfigured Infrastructure Components
– DC, DNS, Print servers
Of 150+ installations this year only 2 had performance problems caused by Citrix resources
– CPU and Memory

What Performance Guard is used for
• Accurate Monitoring of the end-user experience• Proactively identify and resolve end-user issues• Shorten the trouble shooting time• Better use of available IT resources• Ensure SLA compliance
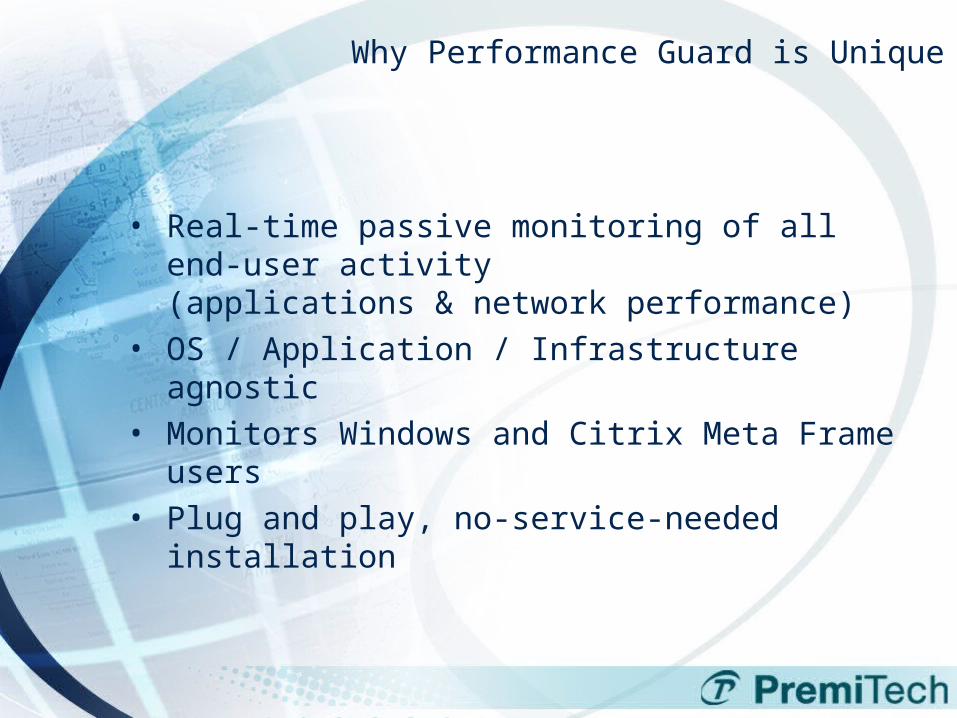
Why Performance Guard is Unique
• Real-time passive monitoring of all end-user activity
(applications & network performance)• OS / Application / Infrastructure agnostic• Monitors Windows and Citrix Meta Frame users• Plug and play, no-service-needed installation

End-to End Performance Monitoring in Citrix
Database
Fileserver
Mainframe
Performance Guard Server
Performance data
PC / Thin Clients Citrix MetaFrame Back-end Applications
ClientConnectivity Network

What’s New in 4.1?
• New Alarm Notification Framework– Email and SNMP alerts are now supported.
• New Baseline and Alarm Threshold FrameworkPerformance Guard can now do automatic base lining and set alarm thresholds based on historic data.
• Hotspot Improvements
– resource (CPU, disk, memory) consuming clients – resource (CPU, disk, memory) consuming processes running on clients – servers and clients in terms of network traffic load and unavailability – subnets in terms of response time, unavailability, packet loss, and network traffic
• Extension of Help Desk Wizard to include Citrix users – The Help Desk Wizard is extended so that it can be used with the name of a Citrix
user. • New active Citrix session login measurement (Application ping)
– The agent is now able to make active Citrix login measurements.

What’s New in 4.1? Cont.
• New Performance Counter Measurements – Average/Peak Number of Context switch/sec – Average/Peak Network outgoing traffic – Average/Peak Network incoming traffic
• Agents on servers– Performance Guard is now able to distinguish between agents installed on end-user clients and
agents installed on servers. • New Process graph
– The graph can display CPU usage, memory usage, thread count and Read+Write I/O for a specific process.
Misc. Improvements– Improved menu structure for managing agent, server and port groups. – Agent may be configured to restart it self at regular intervals. – Machine metrics like memory and CPU consumption, etc. is now available in Citrix server graphs – The Citrix data mining report now shows the 90th percentile for CPU-usage and free memory for
Citrix servers instead of overall average. That is: 90% of the time the servers consumes less CPU or memory than the listed value.

Automated Management Reports
Scheduled pdf. Reports are Automatically created for:
• Citrix Health Check• Application Health Check• Network Health Check• PC Health Check

Americas Customers and Partners

Thank You

![PageRank in Undirected Random Graphs - arXivarXiv:1511.04925v2 [cs.SI] 25 Nov 2016 RESEARCH ISSN 0249-6399 ISRN INRIA/RR--8983--FR+ENG REPORT N 8983 Nov 2016 Project-Team Maestro PageRank](https://static.fdocuments.us/doc/165x107/5f2e7dbce0133d5fec2d8bda/pagerank-in-undirected-random-graphs-arxiv-arxiv151104925v2-cssi-25-nov-2016.jpg)