Performance footprints of heavy-users in 3G networks via ...
7
HAL Id: inria-00498476 https://hal.inria.fr/inria-00498476 Submitted on 7 Jul 2010 HAL is a multi-disciplinary open access archive for the deposit and dissemination of sci- entific research documents, whether they are pub- lished or not. The documents may come from teaching and research institutions in France or abroad, or from public or private research centers. L’archive ouverte pluridisciplinaire HAL, est destinée au dépôt et à la diffusion de documents scientifiques de niveau recherche, publiés ou non, émanant des établissements d’enseignement et de recherche français ou étrangers, des laboratoires publics ou privés. Performance footprints of heavy-users in 3G networks via empirical measurement Alessio Botta, Antonio Pescapé, Giorgio Ventre, Ernst Biersack, Stefan Rugel To cite this version: Alessio Botta, Antonio Pescapé, Giorgio Ventre, Ernst Biersack, Stefan Rugel. Performance footprints of heavy-users in 3G networks via empirical measurement. WiOpt’10: Modeling and Optimization in Mobile, Ad Hoc, and Wireless Networks, May 2010, Avignon, France. pp.545-550. inria-00498476
Transcript of Performance footprints of heavy-users in 3G networks via ...

HAL Id: inria-00498476https://hal.inria.fr/inria-00498476
Submitted on 7 Jul 2010
HAL is a multi-disciplinary open accessarchive for the deposit and dissemination of sci-entific research documents, whether they are pub-lished or not. The documents may come fromteaching and research institutions in France orabroad, or from public or private research centers.
L’archive ouverte pluridisciplinaire HAL, estdestinée au dépôt et à la diffusion de documentsscientifiques de niveau recherche, publiés ou non,émanant des établissements d’enseignement et derecherche français ou étrangers, des laboratoirespublics ou privés.
Performance footprints of heavy-users in 3G networksvia empirical measurement
Alessio Botta, Antonio Pescapé, Giorgio Ventre, Ernst Biersack, Stefan Rugel
To cite this version:Alessio Botta, Antonio Pescapé, Giorgio Ventre, Ernst Biersack, Stefan Rugel. Performance footprintsof heavy-users in 3G networks via empirical measurement. WiOpt’10: Modeling and Optimization inMobile, Ad Hoc, and Wireless Networks, May 2010, Avignon, France. pp.545-550. �inria-00498476�

Performance footprints of heavy-users in 3G
networks via empirical measurement
Alessio Botta, Antonio Pescape, Giorgio Ventre
University of Napoli Federico II, Italy
{a.botta,pescape,giorgio}@unina.it
Ernst Biersack
Eurecom, France
Stefan Rugel
Telefonica O2 Germany
Abstract—Cellular technology is widely used for Internetaccess, also because most operators are now offering Mbit/sdata rates at affordable prices. Many studies analyzed theperformance of these networks using analytical or simulationapproaches. However, due to lack of data from operationalenvironments, very little is known about the performance of realcellular networks. In this paper, we assess the performance ofthe 3G network of one of the major European telecom operators,using several recent traffic traces of TCP connections to port80 and 8080. After presenting performance statistics related toall the network users, we focus on heavy users. To assess theirperformance and to uncover the related causes, we introducean investigation approach easily repeatable in the very commonsituation where only data traces are available, with no otherinformation such as mapping of users to cells, network capacity,or packet payload. Analyzing both “single long-lived connections”and “multiple long-lived connections”, we assess the performanceof those users, providing insights on how and why performancecan vary significantly over time and among different users.
I. INTRODUCTION
While cellular networks were originally used to carry voice
calls only, they have progressively evolved to providing other
services such as SMS, games, instant messaging, or Internet
access, which is the focus of this paper. Over the last decade,
the data rates achievable for Internet access via the cellular
network have increased from a few tens of Kbps using GSM
to about one hundred Kbps for GPRS, then several hundred
Kbps with basic UMTS, and finally today, several Mbps with
the High Speed Downlink Packet Access (HDSPA) that is part
of the latest UMTS releases [6]. Recently, many cell phone
operators have proposed flat fee subscription models that allow
to transfer tens of Gigabits per month. As a result, Internet
access through cellular networks is nowadays very common.
Despite this growth, while there exist theoretical and simula-
tion studies of the performance of cellular networks, very little
is known about the real performance of operational cellular
networks. In this paper, we perform a deep experimental
campaign, aimed at understanding the performance of the users
of the cellular network of one of the major European operators,
using technologies that range from GSM to HSDPA. In our
0The research leading to these results has received partial funding fromthe European Community’s Seventh Framework Programme (FP7/2007-2013)under grant agreement n. 224263-OneLab2 and from the project LATINO ofthe FARO programme financed by the Compagnia di San Paolo and by thePolo delle Scienze e delle Tecnologie of the University of Napoli Federico II.
case, the only available input for the analysis are recently-
collected packet traces (headers only for privacy reasons) of
TCP connections to port 80 and 8080, with no additional
information such as mapping of users to cells or to technology
(GPRS, UMTS, ...), information about the load of a cell, etc.
We also do not know which applications the users are running.
However, our situation is quite common as (i) it is very
difficult to collect all this additional information and (ii) even
if possible, this may violate the privacy to individual users. To
cope with such situations, we develop an approach that is able
to spot the performance of such users and to uncover its cause,
using only packet headers. In contrast with other approaches
in literature [11], ours does not rely on the estimation of the
path capacity, being able to work also on cellular networks
where accurate capacity estimations are difficult. In agreement
with the literature [5], our approach focuses on the “heavy
users”, and it provides precise indications about which TCP
connections to analyze, how to analyze a TCP connection, and
finally which metrics to use in the analysis. Before focusing on
heavy users, we provide insights on global statistics, regarding
all the users of the network. Then, we focus on individual
long lived TCP connections and, in particular, these parts of
a connection where the application always provides sufficient
data to the TCP sender: we study the performance of the so
called Bulk Transfer Periods or BTPs for short [11]. This
analysis provides interesting insights about the performance
of a first class of heavy users, for which the performance
are dominated by the network conditions. We finally look at
all the connections of a client and its aggregate performance
in terms of throughput, loss rate, and number of parallel
connections, in order to understand the effect of multiple
simultaneous connections of the same user. Such analysis
allows to understand the performance of another class of
heavy users, for which the performance are dominated by the
interference between concurrent connections.
The approach proposed in this paper is easily repeatable
in other real network scenarios. Applying it to packet traces
recently collected on a cellular network provides a snapshot
on the performance of heavy users in those scenarios and on
the cause of such performance.
II. RELATED WORK
The scientific literature on cellular networks is very broad
and covers diverse aspects. In the following we only discuss
WiNMee 2010
545

Fig. 1. Schema of the network.
work that is relevant or related to our paper. Already the intro-
duction of GPRS, the first standard based on packet switching,
give raise to a number of studies: A representative example
is [2], that presents a large-scale analysis of the performance
of TCP on such network. The authors performed an extensive
measurement campaign over different networks and obtained
results in terms of available data rate, RTT, and loss. In
this paper we also consider more recent access technologies
such as UMTS. UMTS has been already studied in literature
using theory, simulation, and experimental approaches [3].
In [1], a detailed analysis of the nominal performance of such
networks is presented. The results are directly derived from
the standards, with no information related to real deployments.
On the other hand, the works [4], [13] analyze real cellular
networks using passive and active measurement approaches
respectively. The performance indicators reported in [13] are
aggregated over the entire UMTS network, which does not
allow to determine what performance a single user experiences
in a such heterogeneous scenario. On the other hand, the work
in [4] is mainly aimed at modeling the UMTS network in terms
of delay behavior. With respect to both these papers, we also
present results related to HSDPA, which has been studied in
some recent papers [7], [9]. The former work presents exper-
iments conducted on different testbeds, in order to infer the
throughput of HSDPA in different configurations. The latter,
instead, presents an analysis of some performance parameters
conducted by using an active measurement approach on an
operational network.
To the best of our knowledge, our work extends the results
in literature in that: (i) it uses real traffic traces from an
operational network; (ii) it is conducted on a network con-
taining a mix of access technologies (GSM, GPRS, EDGE,
UMTS, and UMTS+HSDPA), which therefore provides a
unique heterogeneous network scenario; (iii) it proposes an
approach easily repeatable and extensible in the very common
situation in which only packet traces are available; (iv) it
shows results in terms of global performance statistics and
performance of “heavy-users”, providing useful insights for
understanding 3G networks performance, and presenting both
the performance experienced by users and its causes.
III. NETWORK AND TRACES
For our study, we use packet traces collected from an op-
erational cellular network, whose design is depicted in Fig. 1.
The cellular network is organized in a hierarchical fashion and
comprises different kinds of radio access technologies: GSM,
GPRS, EDGE, UMTS, and UMTS+HSDPA that reflect the
TABLE I
CHARACTERISTICS OF THE ANALYZED TRACES.
Trace Date and time Duration Packets Bytes Cnxs
Cellular1 2008-12-11 20:31 00:59:56 5Mega 4Giga 187,034
Internet1 2008-12-11 20:31 01:00:07 6Mega 4Giga 226,814
Cellular2 2008-12-11 20:31 01:00:22 5Mega 4Giga 178,292
Internet2 2008-12-11 20:31 01:00:21 6Mega 4Giga 223,175
evolution from 2nd and 3rd generation1. Such network em-
ploys a Performance Enhancing Proxy [10] or PEP for short,
which is located between the GGSN and the Internet. The PEP
operates as a transparent proxy for all TCP connections on port
80 and 8080 that are established by a mobile user: it terminates
the TCP connections of the mobile users and opens new
connections towards the Internet, while preserving the source
and destination IP address and port information. The PEP
was originally deployed to improve the download performance
of 2G users in case of HTTP traffic. Multiple connections
improve performance in case of interactive sessions where the
idle period of one session may overlap with the busy period
of another session. The PEP opens multiple parallel TCP
connections towards a mobile user to transmit the data coming
from an HTTP server in the Internet. The PEP tries to open
many parallel connections when processing an HTML page
requested, in order to overcome the restrictions imposed by
HTTP 1.1 to open no more than two parallel connections [10].
Our packet traces (see Table I for the details) are collected
at both sides of the PEP, as shown in Fig. 1, we will refer
to them as Cellular and Internet sides in the following. The
existence of the PEP and the fact that the traces are captured
at both sides of the PEP facilitate the analysis because we can
compute metrics such as loss rate or throughput separately
for the cellular network and the Internet. However, the PEP
is only receiving traffic of TCP connections destined towards
port 80 or 8080, which means that we miss some traffic. We
could confirm with the network operator that the vast majority
of the traffic is indeed destined to these two ports: in another
trace from the same network operator that was not captured
at the PEP, 82% of total Bytes and 87% of total connections
were destined towards port 80 or 8080. It is important to note
that in all the available traces we found that a small quantity of
connections (i.e. 10%) are responsible for the most part of the
traffic (i.e. 90%). Therefore, when in the following sections
we concentrate on heavy users, we are actually analyzing the
most part of the traffic in the trace.
IV. GLOBAL STATISTICS
Table II reports some important statistics related to the trace
Cellular1. Similar considerations apply for the other cellular
trace. Firstly, we observe that the ratio between the number
of packets sent and received by the mobile stations is about
10%, while the same ratio in Bytes is about 5%. Moreover, we
notice that, in the downlink direction (i.e. from the Internet to
1Even if the operators have completely upgraded their networks, they stillhave to wait for all customers to buy new handsets before they can retire theolder access technologies.
546

TABLE II
CELLULAR1: GLOBAL STATISTICS.
Bytes in payload from servers to clients 3.30 ∗ 109
Bytes in payload from clients to servers 1.68 ∗ 108
Data packets from servers to clients 2.62 ∗ 106
Data packets from clients to servers 2.55 ∗ 105
Max bytes/connection from servers to clients 2.49 ∗ 108
Max bytes/connection from clients to servers 7.42 ∗ 106
Max pkts/connection from servers to clients 1.83 ∗ 105
Max pkts/connection from clients to servers 5.17 ∗ 103
Average RTT 683 ms
Retransmissions from servers to clients
due to timeout expiration 5.76 ∗ 104
Retransmissions from servers to clients
due to fast retransmit 1.45 ∗ 104
the mobile stations) the largest connection is responsible for
about 250 MBytes of traffic, the 7.5% of the total. While,
in the uplink direction, the largest connection is responsible
for about 7 MBytes, the 4.4% of the total. The top plot of
Fig. 2 shows the cumulative distribution function (CDF) of
the number of bytes per connection, in both the uplink and
downlink directions. We can see that, in both cases, a small
number of users is responsible for the most part of the traffic,
i.e. the distributions are left skewed. Moreover, we observe
that most of the connections in the uplink directions generate
between 0.5 and 10 KBytes. While much more variation is
observed in the other direction.
0
0.2
0.4
0.6
0.8
1
102
103
104
105
106
107
F(x)
Connection volume [Bytes]
Downlink
Uplink
0
0.2
0.4
0.6
0.8
1
1 10 100 1000 10000
F(x)
RTT [ms]
Internet1
Cellular1
Fig. 2. CDF of connection volume (top) and RTT (bottom).
In Table II we also report the average RTT and the total
number of retransmissions. The value of the former parameter
is 683 ms, which is very high compared to the Internet [8].
Indeed, in the bottom plot of Fig. 2 we report the CDF of
the average RTT per connection for both the traces Cellular1
and Internet1. As we can see, on the cellular side, the values
range from 50ms to 5s, with 50% of the connections having an
average RTT value larger than 400ms. While on the Internet
side, 80% of the connections have an average RTT lower
than 100ms. This indicates that (i) on average RTT are very
0
0.05
0.1
0.15
0.2
1 10 100 1000
Retransmission score
Throughput [Kbit/s]
Connections with more than 100 pktsConnections with more than 300 pkts
Fig. 3. Throughput and retransmissions.
high, and (ii) there is a high level of heterogeneity in the
user performance. This means that looking only at aggregate
statistics does not allow to derive any strong conclusion about
the performance of the users.
As for the retransmissions, summing the values of the last
two rows of Table II (i.e. those due to timeout expiration and
fast retransmit mechanism) we obtain that about the 2.7%
of packets from servers to clients are retransmitted. Again,
this value is much higher than that on a typical Internet
link [12], [14]. Moreover, we observe that there are much
more retransmissions due to timeout expiration than due to fast
retransmit.Such high number of retransmissions, together with
the high RTT value, can cause very poor TCP performance.
However, this behavior is not common to all the users (i.e.
there is a lot of variation), and some of them are able to
achieve very high performance. Recall that, like in most of
the cellular networks currently deployed, we are observing a
mix of different cellular technologies (GSM, GPRS, EDGE,
UMTS, and UMTS+HSDPA). This means that, when analyz-
ing the performance of modern cellular networks, we have
to be very careful in selecting homogeneous sets of users
(e.g. UMTS users) before making any conclusion about the
real performance of a certain technology. In Fig. 3 we can
observe the scatter plot of throughput and retransmissions
of the connections from trace Cellular1 that transfer more
than 100 data packets. In such figure we also highlight the
connections with more than 300 data packets (represented
with a solid circle). Moreover, we report with different colors
the connections whose throughputs fall in different ranges.
The rightmost group is related to the connections achieving
a throughput >384Kbps, which are using the HSDPA. The
connections in the other group can be using all the access
technologies. As we can see, they experiment a very small
number of retransmissions, and they usually transfer more than
300 data packets. This can be an indication of a behavior that
has also been observed on the Internet: the more bandwidth
is available to the users, the more they download from the
network [15]. The connections from the other group are instead
characterized by a lower throughput, higher retransmissions,
and smaller number of packets (i.e. more circles are not solid).
It is also worth underlining that, while in Fig. 3 we observe
a maximum throughput of less than 2 Mbps, some users are
able to get more than that by using multiple connections, as
547
shown in the following. Finally, similarly to what observed
from previous figures, Fig. 3 shows a high heterogeneous
scenario. In such situation is very difficult to understand why
some users are experimenting very high losses and others are
not. To answer this question, we have to focus on the traffic
of individual users, as shown in the following section.
Summarizing, from the global analysis we (i) can derive
the order of magnitude of relevant parameters, and we have
learned that: (ii) current cellular networks are characterized
by a high degree of heterogeneity in terms performance; (iii)
the average values of some performance indicators such as
throughput, RTT, and retransmissions can easily be one order
of magnitude higher than those observed on the Internet.
V. AN APPROACH FOR ANALYZING THE PERFORMANCE OF
HEAVY-USERS
Our approach defines (i) how to select the TCP connections
to analyze; (ii) how to analyze the selected TCP connections;
and finally (iii) which metrics to use in the analysis. The
approach requires only packet headers - the only information
typically available to the researcher - and provides information
about the performance of heavy users, and the related cause. It
can therefore be easily utilized by other researchers in similar
situations.
A. Which connections to analyze?
We concentrate on “heavy users” and we look at their
“downstream” (towards the end-user) traffic captured at the
cellular side. In this way, we analyze the most part of the
traffic (see Section III), consistently to other approaches in
literature [5]. We only look at long TCP connections and
exclude short connections whose performance metrics tend to
be influenced by the dynamics of TCP slow start and they are
therefore difficult to understand.We proceed in two steps:
• Among the heavy users are some who download most of
the data in a single long lived connection. We refer to
users with this profile as HU-one, for heavy users with
non-parallel connections. We compute the throughput and
loss rate for such long lived connections. Any perfor-
mance problem observed would be due to the state of
network (congestion) since we have only one connection.
• We then look at another set of heavy users that have a
large number of long TCP connections. We refer to users
with this profile as HU-many, for heavy user with many
parallel connections. Also for them, we first analyze every
connection in isolation. But in contrast with the previous
ones, we then look at the evolution of the different
performance metrics over time for each end user, in order
to be able to check for “interference” among the different
connections of the same end user, and to understand its
impact on the performance metrics considered.
B. How to analyze a TCP connection?
From previous research [11] we know that an application
may not always have data to send, which means that in
the lifetime of a TCP connection, periods of data transfer
Time
...
MSSpacket
packetsmaller thanMSS ALP ALP
largefraction ofsmall packets
Idle time > RTT
BTP
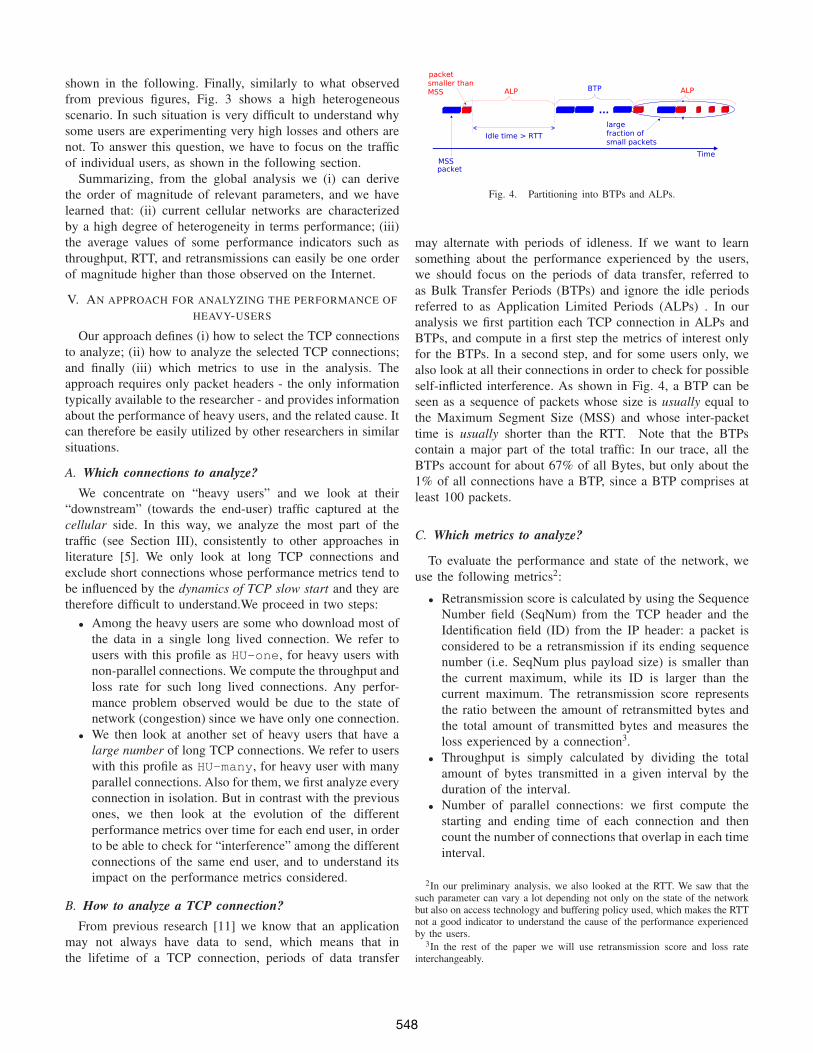
Fig. 4. Partitioning into BTPs and ALPs.
may alternate with periods of idleness. If we want to learn
something about the performance experienced by the users,
we should focus on the periods of data transfer, referred to
as Bulk Transfer Periods (BTPs) and ignore the idle periods
referred to as Application Limited Periods (ALPs) . In our
analysis we first partition each TCP connection in ALPs and
BTPs, and compute in a first step the metrics of interest only
for the BTPs. In a second step, and for some users only, we
also look at all their connections in order to check for possible
self-inflicted interference. As shown in Fig. 4, a BTP can be
seen as a sequence of packets whose size is usually equal to
the Maximum Segment Size (MSS) and whose inter-packet
time is usually shorter than the RTT. Note that the BTPs
contain a major part of the total traffic: In our trace, all the
BTPs account for about 67% of all Bytes, but only about the
1% of all connections have a BTP, since a BTP comprises at
least 100 packets.
C. Which metrics to analyze?
To evaluate the performance and state of the network, we
use the following metrics2:
• Retransmission score is calculated by using the Sequence
Number field (SeqNum) from the TCP header and the
Identification field (ID) from the IP header: a packet is
considered to be a retransmission if its ending sequence
number (i.e. SeqNum plus payload size) is smaller than
the current maximum, while its ID is larger than the
current maximum. The retransmission score represents
the ratio between the amount of retransmitted bytes and
the total amount of transmitted bytes and measures the
loss experienced by a connection3.
• Throughput is simply calculated by dividing the total
amount of bytes transmitted in a given interval by the
duration of the interval.
• Number of parallel connections: we first compute the
starting and ending time of each connection and then
count the number of connections that overlap in each time
interval.
2In our preliminary analysis, we also looked at the RTT. We saw that thesuch parameter can vary a lot depending not only on the state of the networkbut also on access technology and buffering policy used, which makes the RTTnot a good indicator to understand the cause of the performance experiencedby the users.
3In the rest of the paper we will use retransmission score and loss rateinterchangeably.
548

TABLE III
STATISTICS OF THE BTPS FOR THREE HU-ONE USERS.
Duration [s] Tput [Kbps] retr score MBytes in
User BTPs Min Max Min Max Min Max BTP
Pink 8 1 2086 327 1463 0.000 0.008 252.548
Silver 2 17 3596 100 391 0.045 0.055 45.862
Aqua 1 1721 370 0.001 58.195
VI. STATISTICS OF HEAVY-USERS
A. HU-one users
As we have found in our traces more users with the same
profile, here – for space reasons and without affecting the
generalization – we focus on three HU-one users. Looking
at Table III, we can see that within a single connection, these
users are transmitting huge amounts of data in the order of
tens to hundreds of Megabytes. We have performed a reverse
DNS lookup on the IP addresses of the three servers that
are at the origin of the data transfers and found that in two
cases the server is part of a Content Distribution Network or
a streaming service and in the third case it is part of Social
Network site. In all three cases, we ascribe the data transfer
to streaming applications. The two most important parameters
are throughput and retransmission score:
• Throughput: Pink is able to achieve with a single TCP
connection more than 1 Mbit/s throughput, which is only
possible with HSDPA; the other two users achieve a much
lower throughput of 100 and 370 Kbit/sec respectively;
• Retransmission score: Both, pink and aqua have very low
retransmission scores (less then 1%) meaning that they
obtain a very good service from the network. For silver
the retransmission score is one order of magnitude larger
(around 5%) which is considerable. Since silver has no
other connections, the loss seen by this user can only be
caused by the state of the network that is most likely
congested somewhere.
For HU-one user we have seen how the performance are
influenced by the network. In the next section we will see
how the performance of HU-many users are self-influenced.
B. HU-many users
We now look at users that have many BTPs and also have
often many connections open and active simultaneously. The
analysis of the performance of such users is complicated by
the presence of the parallel connections, and we will have to
deepen the observation level different times in order to identify
the cause of these performance. Table IV contains information
about the BTPs of three HU-many users. We have found and
analysed a much larger set of HU-many users. However, for
space reasons we limit the presentation to the top three. If
we compare the results for the three users, we find some
interesting features:
• Maximum throughput: both, Red and Yellow, can achieve
a throughput of several Mbit/sec, which is only offered by
HSDPA; on the other hand, Green never achieves more
than a few hundred Kbit/s.
TABLE IV
STATISTICS OF THE BTPS FOR THREE HU-MANY USERS.
Duration [s] Tput [Kbps] retr score MBytes in
User BTPs Min Max Min Max Min Max BTP
Red 141 1 73 271 2921 0.00 0.173 111.523
Green 86 6 833 11 297 0.00 0.205 58.997
Yellow 69 1 130 707 2386 0.00 0.025 99.653
0 1000 2000 30001
5
10
15
20
25
30
Thro
ughput [b
it/s
]
Time (s)
x105
YellowGreenRed
0 1000 2000 3000
0.01
0.05
0.1
0.15
0.2
Time (s)
Retr
ansm
issio
n s
core
YellowGreenRed
Fig. 5. Throughput and Retransmission scores vs. Time of all BTPs.
• Maximum retransmission score: Red and Green both see
loss rates that can be as high as 17% – 20%, while Yellow
experiences consistently low loss rates that never surpass
2.5%
• Minimum retransmission score: all three clients have
BTPs that do not experience any packet loss.
From the results depicted in Table IV we can conclude
that there is quite some variation with respect to the different
performance metrics, and also the maximum retransmission
scores of the HU-many users are much higher than of the
HU-one users. However, we are not able to draw any con-
clusion on the origin of that variation and the cause of the
high retransmission scores. We need to look at bit closer and
study in more detail the performance metrics computed for the
different BTPs. Fig. 5 shows the throughput and retransmission
scores achieved by each individual BTP of the three users. For
each BTP, we plot the average value of the metric of interest
for the period of duration of that BTP. This is to understand
the similarities and differences between the BTPs of the same
users, also in relation to the time during which the BTPs occur.
We observe that:
• Throughput: for Yellow and Red, the BTPs of the same
user achieve very different throughputs. On the other
hand, Green sees quite uniform throughput performance.
• Retransmission score: for Green, the variance in the
retransmission scores is the largest and there are many
BTPs that experience high loss, whereas for Red there
are only a few BTPs with high loss rates; most of the
BTPs of Red as well as all BTPs of Yellow experience
very little or no loss. Persistently high loss rates, as in
the case of Green, indicate a performance problem that
we will investigate further below.
• Number of parallel BTPs: all three users have many
parallel connections active at the same time. In 2005,
Vacirca et al. [13] excluded p2p traffic from their analysis
because of the use of several parallel connections, which
are likely to induce self-congestion. Parallel connections
549
can either be due to the end-user behavior or to the PEP
that opens multiple parallel connections to improve down-
load performance: we checked for Green the evolution of
the number of connections at the Internet side and saw
that it closely follows the one at the cellular side, which
means that it is the end-user behavior and not the PEP
that determines the number of connections.
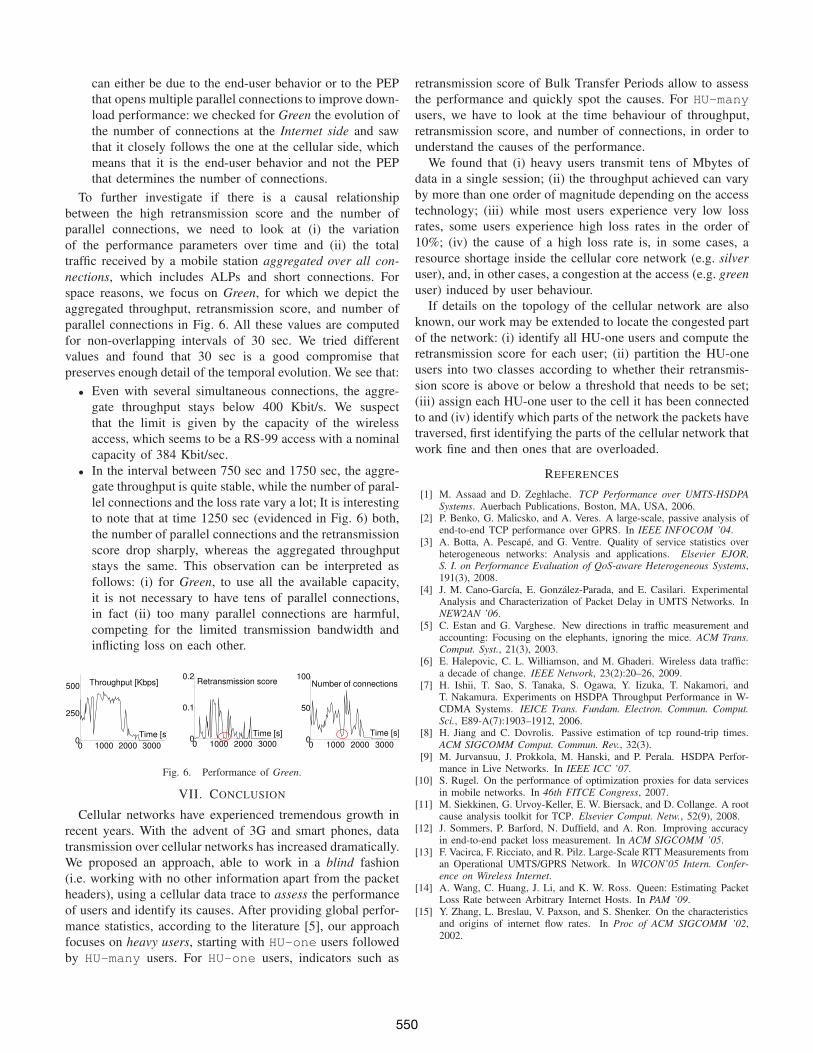
To further investigate if there is a causal relationship
between the high retransmission score and the number of
parallel connections, we need to look at (i) the variation
of the performance parameters over time and (ii) the total
traffic received by a mobile station aggregated over all con-
nections, which includes ALPs and short connections. For
space reasons, we focus on Green, for which we depict the
aggregated throughput, retransmission score, and number of
parallel connections in Fig. 6. All these values are computed
for non-overlapping intervals of 30 sec. We tried different
values and found that 30 sec is a good compromise that
preserves enough detail of the temporal evolution. We see that:
• Even with several simultaneous connections, the aggre-
gate throughput stays below 400 Kbit/s. We suspect
that the limit is given by the capacity of the wireless
access, which seems to be a RS-99 access with a nominal
capacity of 384 Kbit/sec.
• In the interval between 750 sec and 1750 sec, the aggre-
gate throughput is quite stable, while the number of paral-
lel connections and the loss rate vary a lot; It is interesting
to note that at time 1250 sec (evidenced in Fig. 6) both,
the number of parallel connections and the retransmission
score drop sharply, whereas the aggregated throughput
stays the same. This observation can be interpreted as
follows: (i) for Green, to use all the available capacity,
it is not necessary to have tens of parallel connections,
in fact (ii) too many parallel connections are harmful,
competing for the limited transmission bandwidth and
inflicting loss on each other.
0 1000 2000 30000
250
500
Time [s]
Throughput [Kbps]
0 1000 2000 30000
0.1
0.2
Time [s]
Retransmission score
0 1000 2000 30000
50
100
Time [s]
Number of connections
Fig. 6. Performance of Green.
VII. CONCLUSION
Cellular networks have experienced tremendous growth in
recent years. With the advent of 3G and smart phones, data
transmission over cellular networks has increased dramatically.
We proposed an approach, able to work in a blind fashion
(i.e. working with no other information apart from the packet
headers), using a cellular data trace to assess the performance
of users and identify its causes. After providing global perfor-
mance statistics, according to the literature [5], our approach
focuses on heavy users, starting with HU-one users followed
by HU-many users. For HU-one users, indicators such as
retransmission score of Bulk Transfer Periods allow to assess
the performance and quickly spot the causes. For HU-many
users, we have to look at the time behaviour of throughput,
retransmission score, and number of connections, in order to
understand the causes of the performance.
We found that (i) heavy users transmit tens of Mbytes of
data in a single session; (ii) the throughput achieved can vary
by more than one order of magnitude depending on the access
technology; (iii) while most users experience very low loss
rates, some users experience high loss rates in the order of
10%; (iv) the cause of a high loss rate is, in some cases, a
resource shortage inside the cellular core network (e.g. silver
user), and, in other cases, a congestion at the access (e.g. green
user) induced by user behaviour.
If details on the topology of the cellular network are also
known, our work may be extended to locate the congested part
of the network: (i) identify all HU-one users and compute the
retransmission score for each user; (ii) partition the HU-one
users into two classes according to whether their retransmis-
sion score is above or below a threshold that needs to be set;
(iii) assign each HU-one user to the cell it has been connected
to and (iv) identify which parts of the network the packets have
traversed, first identifying the parts of the cellular network that
work fine and then ones that are overloaded.
REFERENCES
[1] M. Assaad and D. Zeghlache. TCP Performance over UMTS-HSDPA
Systems. Auerbach Publications, Boston, MA, USA, 2006.[2] P. Benko, G. Malicsko, and A. Veres. A large-scale, passive analysis of
end-to-end TCP performance over GPRS. In IEEE INFOCOM ’04.[3] A. Botta, A. Pescape, and G. Ventre. Quality of service statistics over
heterogeneous networks: Analysis and applications. Elsevier EJOR,S. I. on Performance Evaluation of QoS-aware Heterogeneous Systems,191(3), 2008.
[4] J. M. Cano-Garcıa, E. Gonzalez-Parada, and E. Casilari. ExperimentalAnalysis and Characterization of Packet Delay in UMTS Networks. InNEW2AN ’06.
[5] C. Estan and G. Varghese. New directions in traffic measurement andaccounting: Focusing on the elephants, ignoring the mice. ACM Trans.Comput. Syst., 21(3), 2003.
[6] E. Halepovic, C. L. Williamson, and M. Ghaderi. Wireless data traffic:a decade of change. IEEE Network, 23(2):20–26, 2009.
[7] H. Ishii, T. Sao, S. Tanaka, S. Ogawa, Y. Iizuka, T. Nakamori, andT. Nakamura. Experiments on HSDPA Throughput Performance in W-CDMA Systems. IEICE Trans. Fundam. Electron. Commun. Comput.
Sci., E89-A(7):1903–1912, 2006.[8] H. Jiang and C. Dovrolis. Passive estimation of tcp round-trip times.
ACM SIGCOMM Comput. Commun. Rev., 32(3).[9] M. Jurvansuu, J. Prokkola, M. Hanski, and P. Perala. HSDPA Perfor-
mance in Live Networks. In IEEE ICC ’07.[10] S. Rugel. On the performance of optimization proxies for data services
in mobile networks. In 46th FITCE Congress, 2007.[11] M. Siekkinen, G. Urvoy-Keller, E. W. Biersack, and D. Collange. A root
cause analysis toolkit for TCP. Elsevier Comput. Netw., 52(9), 2008.[12] J. Sommers, P. Barford, N. Duffield, and A. Ron. Improving accuracy
in end-to-end packet loss measurement. In ACM SIGCOMM ’05.[13] F. Vacirca, F. Ricciato, and R. Pilz. Large-Scale RTT Measurements from
an Operational UMTS/GPRS Network. In WICON’05 Intern. Confer-
ence on Wireless Internet.[14] A. Wang, C. Huang, J. Li, and K. W. Ross. Queen: Estimating Packet
Loss Rate between Arbitrary Internet Hosts. In PAM ’09.[15] Y. Zhang, L. Breslau, V. Paxson, and S. Shenker. On the characteristics
and origins of internet flow rates. In Proc of ACM SIGCOMM ’02,2002.
550