Performance Evaluation of the Delphi Non-Thermal Plasma ... · PDF fileDynamics & Propulsion...
24
Dynamics & Propulsion Innovation Center Performance Evaluation of the Delphi Non-Thermal Plasma System Under Transient and Steady State Conditions 8 th Diesel Engine Emission Reduction Conference San Diego, California August 25-29, 2002 Joseph V. Bonadies, Joachim Kupe, Galen B. Fisher, Craig L. DiMaggio, David A. Goulette, Thomas W. Silvis, Mark Hemingway, William J. LaBarge Delphi Corporation Darrell R. Herling, Monty R. Smith, John G. Frye, Mark A. Gerber Pacific Northwest National Laboratory
Transcript of Performance Evaluation of the Delphi Non-Thermal Plasma ... · PDF fileDynamics & Propulsion...
Dynamics & Propulsion Innovation Center
Performance Evaluation of the Delphi Non-Thermal Plasma System Under Transient and Steady State Conditions
8th Diesel Engine Emission Reduction ConferenceSan Diego, CaliforniaAugust 25-29, 2002
Joseph V. Bonadies, Joachim Kupe, Galen B. Fisher, Craig L. DiMaggio, David A. Goulette, Thomas W. Silvis, Mark Hemingway, William J. LaBarge
Delphi Corporation
Darrell R. Herling, Monty R. Smith, John G. Frye, Mark A. GerberPacific Northwest National Laboratory
Dynamics & Propulsion Innovation Center
Acknowledgements
California Energy Commission Diesel Emissions Carl Moyer Demonstration Program
Jerry Wiens

Dynamics & Propulsion Innovation Center
Test Vehicle ConfigurationNTP Assisted Catalyst Evaluation
u 2000 European production vehicle with 2.2 L common rail engine – Delphi development EMS– Production FIE– Euro 3 emission certification
u System Configuration – DPF + Reactor + Catalysts
u 20 Cell Parallel Plate NTP Reactor– 15.4cc active area
u 2.5 liter SiC DPF (non-catalyzed)
u DeNOx Catalyst (Stabilized)– Ag Al2O3 (1.67L) (Catalyst 1)– Ag Ba-Y-Z (3.35L) (Catalysts 2 & 3)– Pt oxidation (0.98L) (Catalyst 4)
u Power Supply – 220VAC – Power control based on Speed/Load– 15KHz Pulse Density Modulation (PDM)– Power supply efficiency 80% from wall to gas
Dynamics & Propulsion Innovation Center
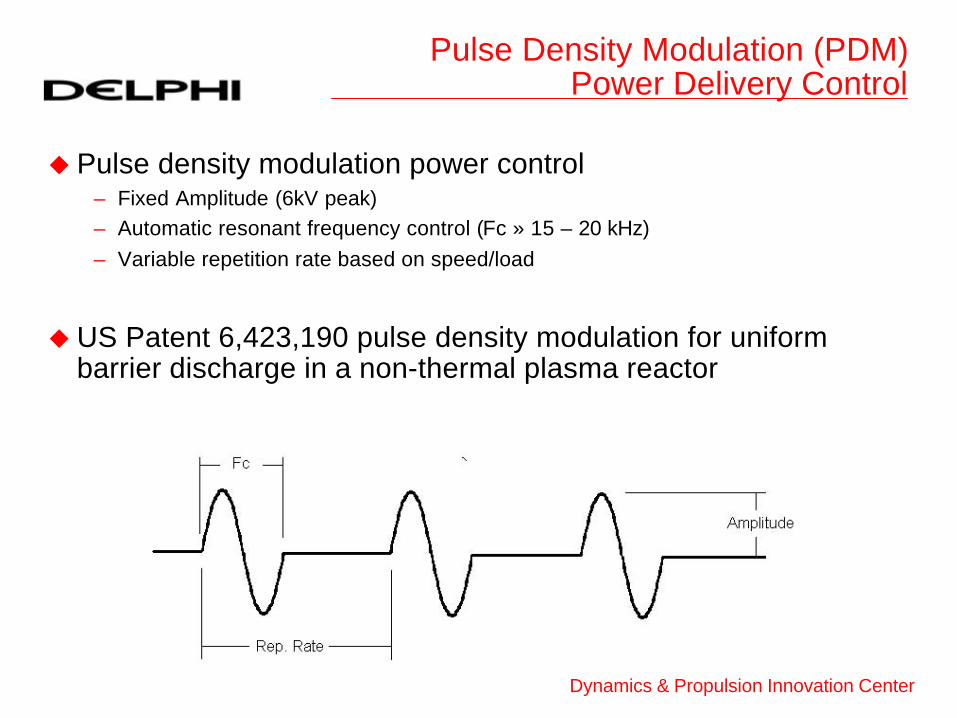
Pulse Density Modulation (PDM)Power Delivery Control
u Pulse density modulation power control– Fixed Amplitude (6kV peak)– Automatic resonant frequency control (Fc » 15 – 20 kHz)– Variable repetition rate based on speed/load
u US Patent 6,423,190 pulse density modulation for uniform barrier discharge in a non-thermal plasma reactor
Dynamics & Propulsion Innovation Center
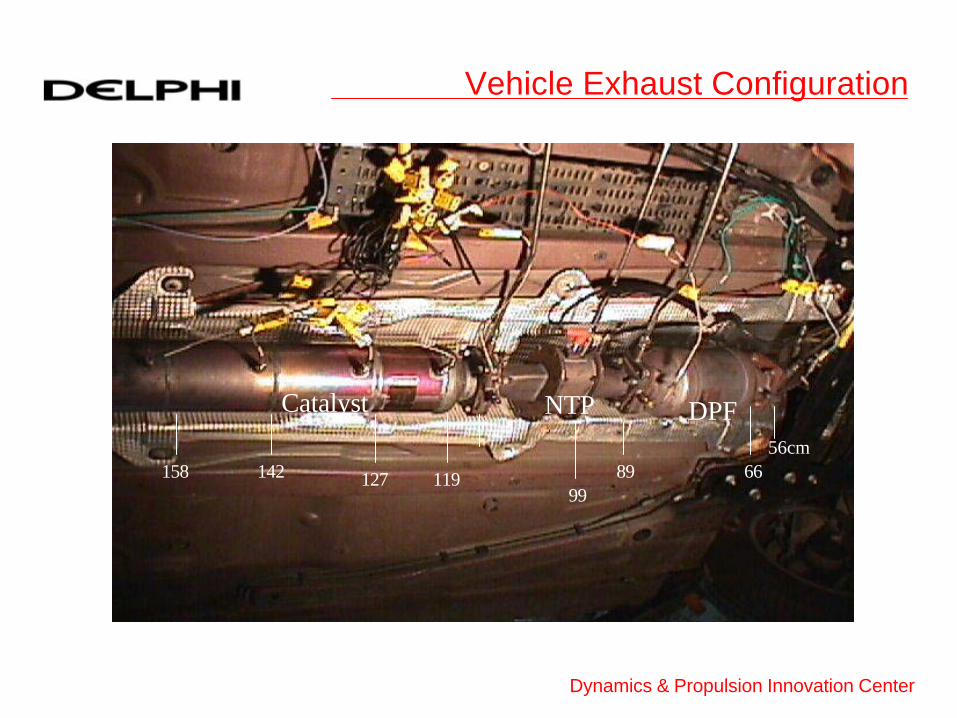
Vehicle Exhaust Configuration
56cm6689
99119127142158
Catalyst NTP DPF
Dynamics & Propulsion Innovation Center
0
10
20
30
40
50
60
70
80
90
100
0 200 400 600 800 1000 1200
Time(sec)
NO
->N
O2
Co
nve
rsio
n (%
)
0
50
100
150
200
250
300
350
400
450
500
Tem
per
atu
re (d
eg C
)
Reactor Efficiency
Reactor Inlet Temp
Vehicle Speed
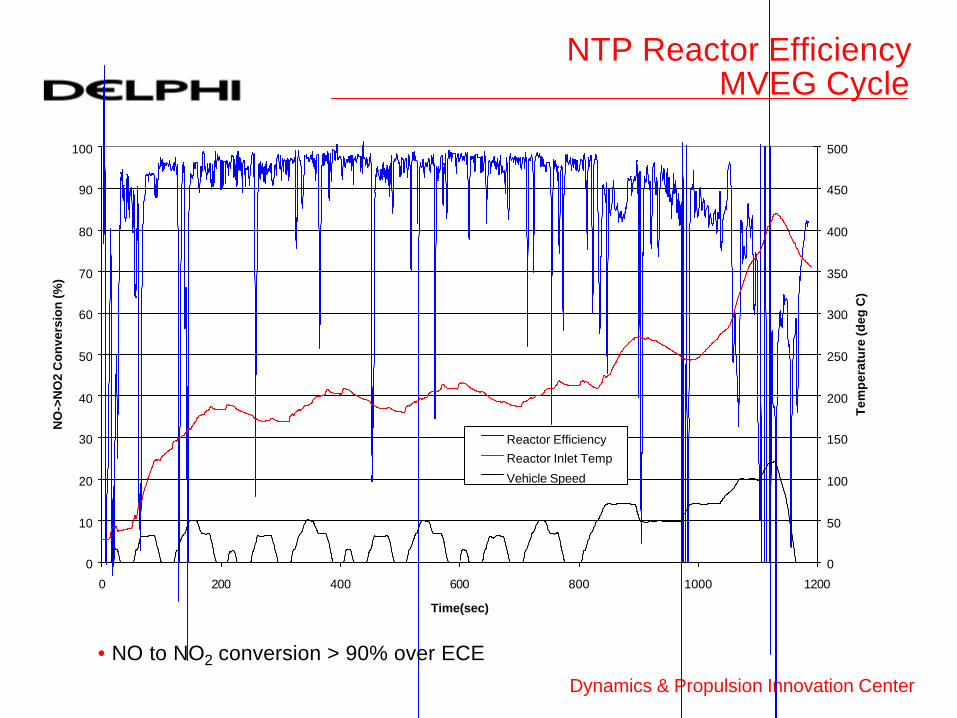
NTP Reactor EfficiencyMVEG Cycle
• NO to NO2 conversion > 90% over ECE

Dynamics & Propulsion Innovation Center
Net NTP ReactorNO Conversion Efficiency
-0.2
0
0.2
0.4
0.6
0.8
1
1.2
1.4
1.6
1.8
2
0 200 400 600 800 1000 1200
Time (s)
Cu
mu
lati
ve N
O (
g)
0
50
100
150
200
250
300
350
400
450
500
Wh
slp
d(k
ph
)
NO Reactor In CumulativeNO Reactor Out CumulativeWhlspd
67%
80%
• 80% cumulative NO to NO2 conversion up to mid EUDC• 67% cumulative NO to NO2 overall
Dynamics & Propulsion Innovation Center
0
100
200
300
400
500
600
700
800 810 820 830 840 850 860 870 880 890 900
Time(sec)
NO
(pp
m),
NO
x(p
pm
), V
ehic
le S
pee
d(k
ph
)
NO
NOx
HC
Vehicle Speed
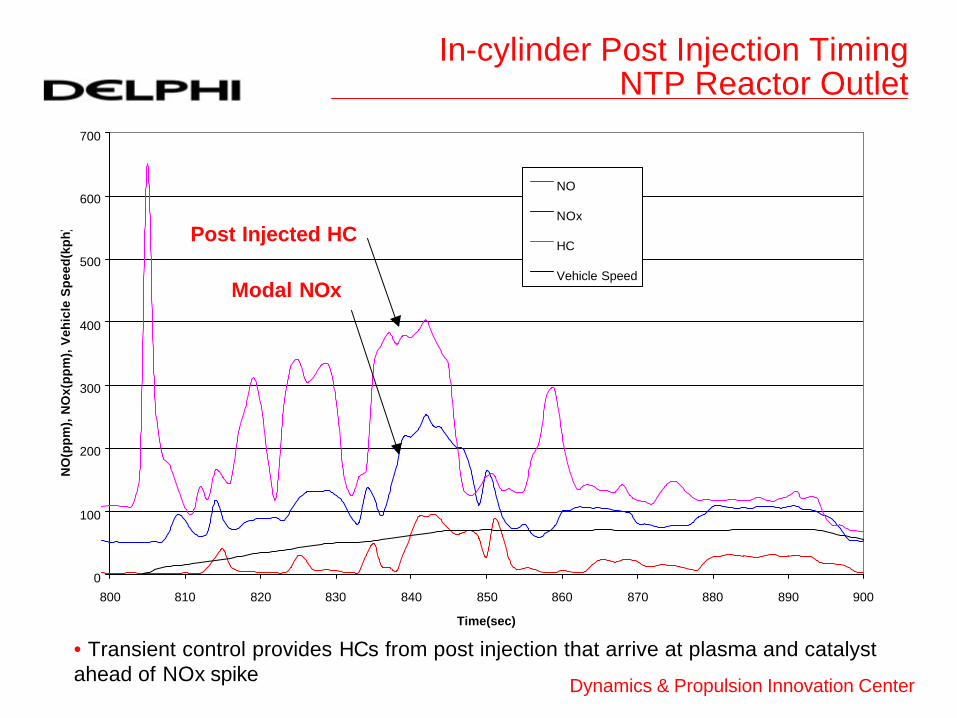
In-cylinder Post Injection TimingNTP Reactor Outlet
• Transient control provides HCs from post injection that arrive at plasma and catalyst ahead of NOx spike
Post Injected HC
Modal NOx

Dynamics & Propulsion Innovation Center
0
200
400
600
800
1000
1200
1400
0 200 400 600 800 1000 1200
Time
Po
wer
(wat
ts),
Veh
icle
Sp
eed
(kp
h)
Avg Wall Power
Avg Reactor Power
Vehicle Speed
NTP Power Consumption
• Transient control of NTP power demonstrated• 350 Watt average over MVEG

Dynamics & Propulsion Innovation Center
Fuel Economy Penalty
u Power Consumption– Fuel Economy Penalty: 5 %
u Post Injected HC– Fuel Economy Penalty: 3 %
u Total Fuel Economy Penalty = 8 %
Dynamics & Propulsion Innovation Center
NTP Assisted Catalysis NOx Performance
Dynamics & Propulsion Innovation Center
0
100
200
300
400
500
600
700
0 100 200 300 400 500 600 700 800
Time(sec)
NO
x(p
pm
)
0
50
100
150
200
250
300
350
400
450
500
Tem
per
atu
re (d
eg C
), V
ehic
le S
pee
d (k
ph
)
Engine Out NOx
Tailpipe NOx
Catalyst Inlet Temp
Catalyst Outlet Temp
Vehicle Speed
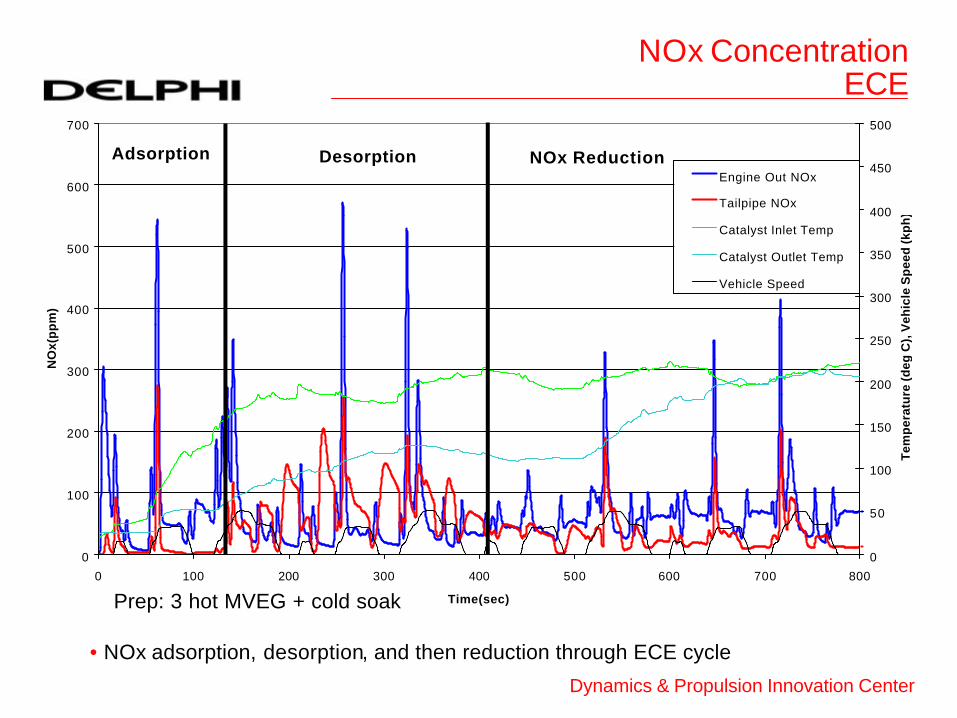
Adsorption Desorption NOx Reduction
NOx Concentration ECE
Prep: 3 hot MVEG + cold soak
• NOx adsorption, desorption, and then reduction through ECE cycle
Dynamics & Propulsion Innovation Center
0
100
200
300
400
500
600
700
800
900
1000
800 850 900 950 1000 1050 1100 1150 1200
Time(sec)
NO
x(p
pm
)
0
50
100
150
200
250
300
350
400
450
500
Tem
per
atu
re (d
eg C
), V
ehic
le S
pee
d (k
ph
)
Engine Out NOx
Tailpipe NOx
Catalyst Inlet Temp
Catalyst Outlet Temp
Vehicle Speed
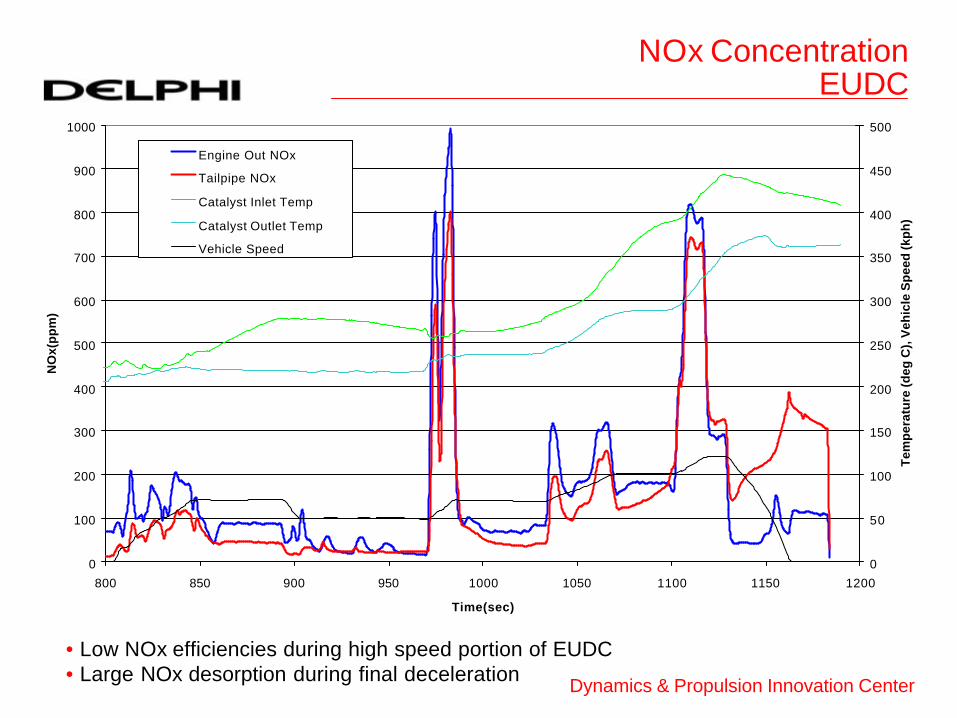
NOx Concentration EUDC
• Low NOx efficiencies during high speed portion of EUDC• Large NOx desorption during final deceleration
Dynamics & Propulsion Innovation Center
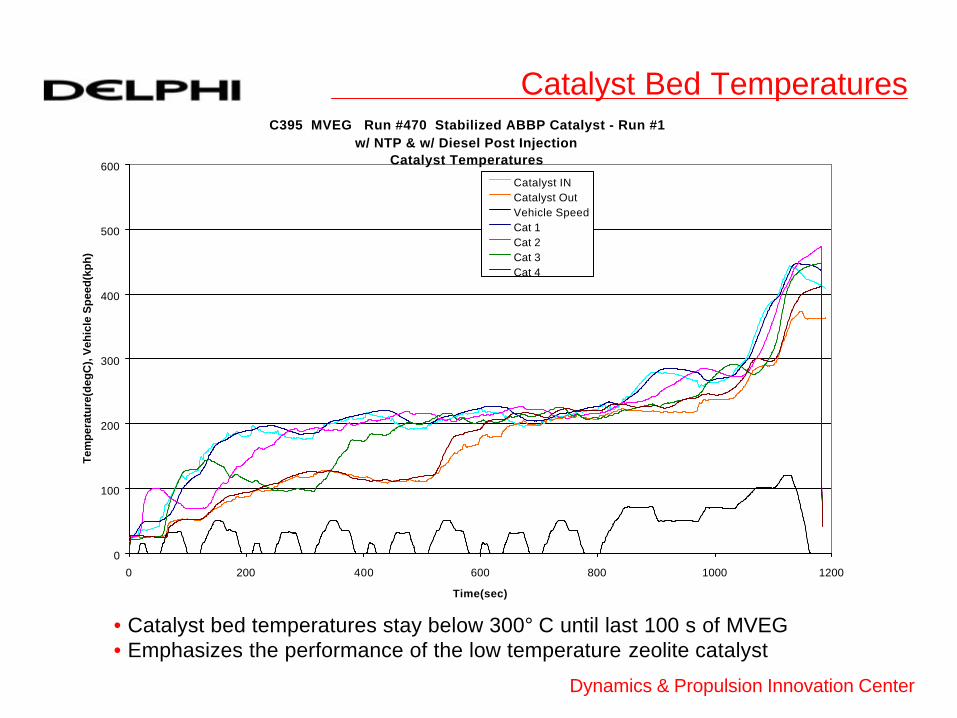
Catalyst Bed TemperaturesC395 MVEG Run #470 Stabilized ABBP Catalyst - Run #1
w/ NTP & w/ Diesel Post InjectionCatalyst Temperatures
0
100
200
300
400
500
600
0 200 400 600 800 1000 1200
Time(sec)
Tem
per
atu
re(d
egC
), V
ehic
le S
pee
d(k
ph
)
Catalyst INCatalyst OutVehicle SpeedCat 1Cat 2Cat 3Cat 4
• Catalyst bed temperatures stay below 300° C until last 100 s of MVEG• Emphasizes the performance of the low temperature zeolite catalyst

Dynamics & Propulsion Innovation Center
0
10
20
30
40
50
60
70
80
90
100
150 200 225 250 300 350 400 450
Catalyst Temperature (C)
NO
x R
edu
ctio
n E
ffic
ien
cy (%
)
SGB Concentration200 ppm NO500 ppm C3H610% O25% H2O7% CO2Balance N2
Test ConditionWith NTP at a constant 150CSV = 38k/h for each brick or
19k/h total
Synthetic Gas Bench (SGB) Catalyst Performance
NOx Reduction Efficiency of Ag-alumina + Ag-Ba-Y-zeolite Catalyst(1 washcoated brick of the alumina followed by 1 brick of the zeolite)
• Synthetic gas bench (SGB) testing used to identify candidate catalysts

Dynamics & Propulsion Innovation Center
Engine Dyno Steady State PerformanceC3H6 vs Post Injection - 150°C
Stabilized Catalyst1200 RPM, 27Nm, 97ppm NO, 150ppm NOx
-20
0
20
40
60
80
100
Ag Al2O3 Ag Ba Y Zeolite
NO
x C
on
vers
ion
(%)
w/ 500 ppm C3H6 w/NTP stabilized
w/ Post Injection w/NTP stabilized
Performance with C3H6agrees with SGB testing
Space VelocityAg Al2O3 40k/hrAg BaYZ 20k/hr
• With HC from post-injection, <20% NOx conversion • 50% NOx conversion similar on dyno and SGB with 500 ppm propene• Near 15% with only propene & no NTP
Dynamics & Propulsion Innovation Center
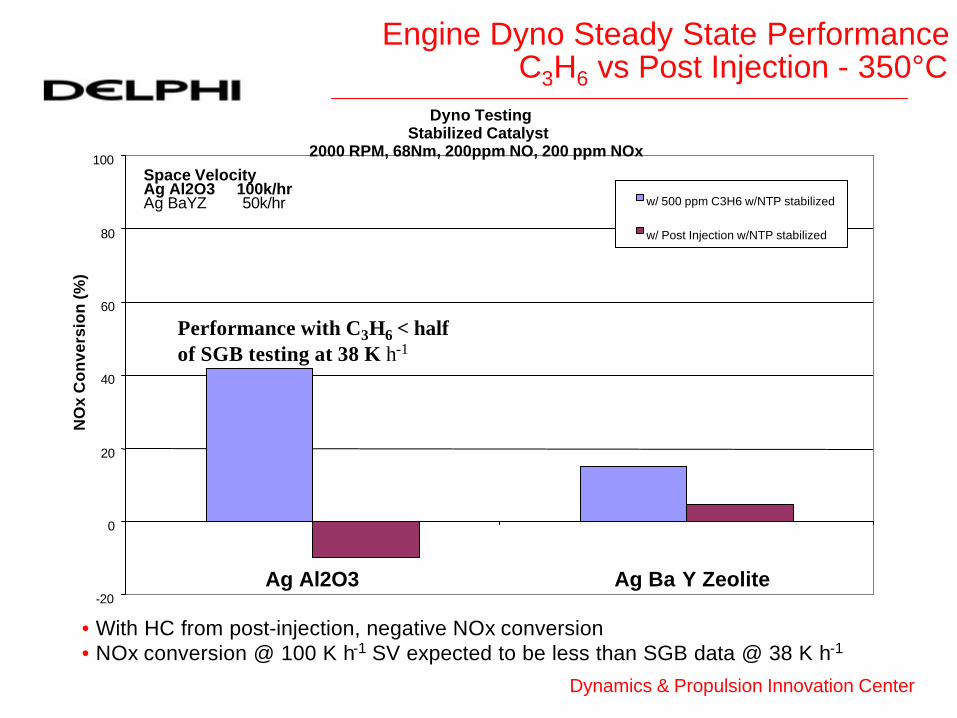
Engine Dyno Steady State PerformanceC3H6 vs Post Injection - 350°C
Dyno TestingStabilized Catalyst
2000 RPM, 68Nm, 200ppm NO, 200 ppm NOx
-20
0
20
40
60
80
100
Ag Al2O3 Ag Ba Y Zeolite
NO
x C
on
vers
ion
(%)
Performance with C3H6 < half of SGB testing at 38 K h-1
w/ 500 ppm C3H6 w/NTP stabilized
w/ Post Injection w/NTP stabilized
Space VelocityAg Al2O3 100k/hrAg BaYZ 50k/hr
• With HC from post-injection, negative NOx conversion • NOx conversion @ 100 K h-1 SV expected to be less than SGB data @ 38 K h-1
Dynamics & Propulsion Innovation Center
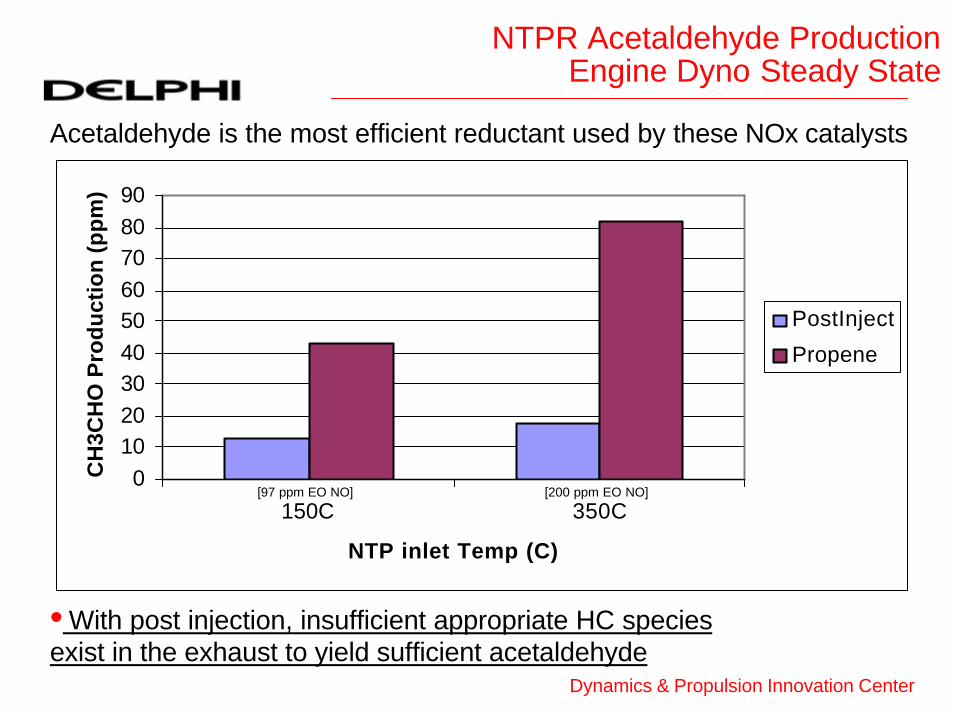
NTPR Acetaldehyde ProductionEngine Dyno Steady State
0102030405060708090
150C 350C
NTP inlet Temp (C)
CH
3CH
O P
rod
uct
ion
(p
pm
)
PostInject
Propene
Acetaldehyde is the most efficient reductant used by these NOx catalysts
• With post injection, insufficient appropriate HC species exist in the exhaust to yield sufficient acetaldehyde
[97 ppm EO NO] [200 ppm EO NO]
Dynamics & Propulsion Innovation Center
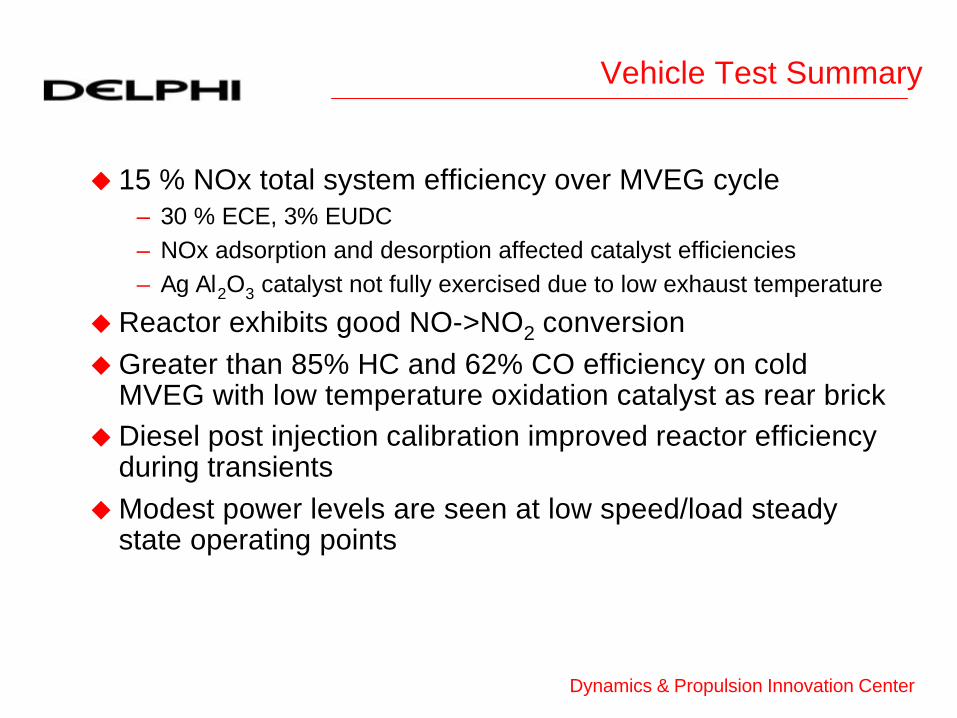
u 15 % NOx total system efficiency over MVEG cycle – 30 % ECE, 3% EUDC– NOx adsorption and desorption affected catalyst efficiencies– Ag Al2O3 catalyst not fully exercised due to low exhaust temperature
u Reactor exhibits good NO->NO2 conversionuGreater than 85% HC and 62% CO efficiency on cold
MVEG with low temperature oxidation catalyst as rear bricku Diesel post injection calibration improved reactor efficiency
during transientsuModest power levels are seen at low speed/load steady
state operating points
Vehicle Test Summary

Dynamics & Propulsion Innovation Center
DPF Regeneration

Dynamics & Propulsion Innovation Center
DPF Dynamometer Testing

Dynamics & Propulsion Innovation Center
0
2
4
6
8
10
12
0 10 20 30 40 50 60
Time ( Hours )
DP
F P
ress
ure
Dro
p (
kPa
)
0
10
20
30
40
50
60
Soo
t Loa
ding
( g
ram
s )
NTP-DPF DPF only NTP-DPF Soot DPF only Soot
26.6 gms
38.1 gms
11.0 kPa
6.7 kPa
7.3
9.5
30.1
20.2
12.8 14.6 17.719.1
21.7 24.2
EO NOx: 347 ppm EO NO: 301 ppm EO HC: 22 ppm
Speed / Load: 2000 RPM / 85 Nt m Engine Flow: 43 gm/sec
EO PM: 1.7 gm/hr No EGR DPF (Type / Size): SiC / 4.1 liter
Reactor Power: 600 Watts Reactor NO2 Efficiency: 16.2%
DPF Regeneration305 C DPF Inlet Temperature
• Continuous regeneration occurs at 305 C with ~100 ppm NO2 in exhaust • DPF backpressure and soot loading reduced with NTP compared to DPF only
Dynamics & Propulsion Innovation Center
DPF RegenerationSummary
u NTP reactor reduces exhaust PM mass 20% to 30%
u Continuous regeneration of a non-catalyzed DPF was demonstrated with the NTP reactor
u Three-way interaction exists between:– Soot loading– DPF inlet temperature– NO2 concentration
Dynamics & Propulsion Innovation Center
Conclusions
u NTP Reactor & Power Supply performance is acceptable– Potential to reduce power consumption with short pulse power supply
u NTP assisted catalysis has low NOx performance over transient MVEG emission cycle
– Catalysts tested are too selective for the hydrocarbon species present in the exhaust
– NOx adsorption and desorption is a major challenge– Catalyst durability and performance requires much more development
resources
u NTP has the potential to enable continuous regeneration of a non-catalyzed DPF, given the proper levels of temperature, soot loading, and NO2