Performance Evaluation of Medical Expert Systems Using ROC … · gold standard was among the...
17
COMPUTERS AND BIOMEDICAL RESEARCH 22, 297-313 (1989) Performance Evaluation of Medical Expert Systems Using ROC Curves* KLAUS-PETER AoLAssNrct AND WERNER SCHEITHALJER~ TDeparttnent of’ Medical Computer Sciences und $2nd Department ,for Gastroenterology und Heputology, University of Vienna, Gurnisongusse 13. A-1090 b’iennu, Austriu Received January 28, 1988 This paper presents a performance evaluation of the diagnostic accuracy of the medical expert system CADIAG-Z/PANCREAS. The study included 47 clinical cases from a univer- sity hospital with 51 diagnoses of pancreatic diseases (four patients had two pancreatic diseases). As gold standard, the histologically or clinically confirmed diagnoses were as- sumed. Performance was studied along three lines: (a) each case was evaluated twice, first, by restricting patient data to history, physical examination. and basic laboratory tests and, second, by utilizing the complete set of data including also special laboratory tests, US, X ray, CT-scan, ECG, and biopsy. if available; (b) considering CADIAG-2’s hypotheses gener- ation. each evaluation series was also carried out twice, first. by testing whether the gold standard was the first diagnosis in the ranked list of hypotheses and, second. whether the gold standard was among the hypotheses; (c) receiver operating characteristic (ROC) curves were determined by varying an internal threshold which determined the extent of CADIAG- 2’s diagnostic hypotheses generation. The evaluation showed that CADIAG-2’s initial list of diagnostic hypotheses, based on patient history, physical examination. and basic laboratory tests, usually has already included the gold standard diagnosis and thus an application of CADIAG-2 at a very early stage of the diagnostic process seems achievable. Moreover, it turned out that given the complete set of patient’s medical data the gold standard is usually ranked at the first place in the list of hypotheses. except for patients with chronic diseases where only unspecific findings are available. The last test series showed that ROC curves do not only allow optimal adjustment of the expert system’s internal ad hoc decision criteria such as thresholds, weights. and scores but also provide a basis for better comparing the performance of different medical expert systems. r 19x9 Academic Pres. Inc. 1. INTRODUCTION The evaluation of an expert system is a natural step that follows its design, development, and implementation. Basic research in medical expert systems aimed at finding new and better forms of knowledge representation, knowledge acquisition, and automated reasoning is still intensively pursued; however, some medical expert systems have already been applied as routine systems in clinical settings (HELP (I), PUFF (2), ONCOCIN (3), differential diagnosis of * Presented in part at the MIE ‘87 Conference, Rome, Italy, September 22, 1987. 297 OOIO-4809/89 $3.00 Copyright 0 1989 by Academic Pres, Inc. All rights of reproduction in any form reserved.
Transcript of Performance Evaluation of Medical Expert Systems Using ROC … · gold standard was among the...

COMPUTERS AND BIOMEDICAL RESEARCH 22, 297-313 (1989)
Performance Evaluation of Medical Expert Systems Using ROC Curves*
KLAUS-PETER AoLAssNrct AND WERNER SCHEITHALJER~
TDeparttnent of’ Medical Computer Sciences und $2nd Department ,for Gastroenterology und
Heputology, University of Vienna, Gurnisongusse 13. A-1090 b’iennu, Austriu
Received January 28, 1988
This paper presents a performance evaluation of the diagnostic accuracy of the medical expert system CADIAG-Z/PANCREAS. The study included 47 clinical cases from a univer- sity hospital with 51 diagnoses of pancreatic diseases (four patients had two pancreatic diseases). As gold standard, the histologically or clinically confirmed diagnoses were as- sumed. Performance was studied along three lines: (a) each case was evaluated twice, first, by restricting patient data to history, physical examination. and basic laboratory tests and, second, by utilizing the complete set of data including also special laboratory tests, US, X ray, CT-scan, ECG, and biopsy. if available; (b) considering CADIAG-2’s hypotheses gener- ation. each evaluation series was also carried out twice, first. by testing whether the gold standard was the first diagnosis in the ranked list of hypotheses and, second. whether the gold standard was among the hypotheses; (c) receiver operating characteristic (ROC) curves were determined by varying an internal threshold which determined the extent of CADIAG- 2’s diagnostic hypotheses generation. The evaluation showed that CADIAG-2’s initial list of diagnostic hypotheses, based on patient history, physical examination. and basic laboratory tests, usually has already included the gold standard diagnosis and thus an application of CADIAG-2 at a very early stage of the diagnostic process seems achievable. Moreover, it turned out that given the complete set of patient’s medical data the gold standard is usually ranked at the first place in the list of hypotheses. except for patients with chronic diseases where only unspecific findings are available. The last test series showed that ROC curves do not only allow optimal adjustment of the expert system’s internal ad hoc decision criteria such as thresholds, weights. and scores but also provide a basis for better comparing the performance of different medical expert systems. r 19x9 Academic Pres. Inc.
1. INTRODUCTION
The evaluation of an expert system is a natural step that follows its design, development, and implementation. Basic research in medical expert systems aimed at finding new and better forms of knowledge representation, knowledge acquisition, and automated reasoning is still intensively pursued; however, some medical expert systems have already been applied as routine systems in clinical settings (HELP (I), PUFF (2), ONCOCIN (3), differential diagnosis of
* Presented in part at the MIE ‘87 Conference, Rome, Italy, September 22, 1987.
297
OOIO-4809/89 $3.00 Copyright 0 1989 by Academic Pres, Inc.
All rights of reproduction in any form reserved.

298 ADLASSNIG AND SCHEITHAUEK
acute abdominal pain (4)). There are other computer programs that are or will soon be ready for practical operation in the hospital or the physician’s office (INTERNIST-VCADUCEUS (5). QMR (6). RECONSIDER (7). CADIAG-2 (8, 9)). Some of these systems have already been tested with several hundred clinical cases. The need for validation and verification of these expert system\ prior and during practical operation grows and methods for evaluating perfor- mance. acceptability, and costs are searched for.
A number of methods evaluating certain aspects of medical expert systems. such as the systems’ diagnostic accuracy. the consistency and completeness of their knowledge bases, their acceptance by the medical user. and their trans- portability to other locations have already been devised (10. 11 i. yet further
methods have to be developed. The study on hand describes a performance evaluation of the diagnostic
accuracy of CADIAG-Z/PANCREAS’ (1. l.i). a medical expert system for differential diagnosis of pancreatic diseases.
The performance of CADIAG-2IPANCREAS was studied with respect to
three different aspects:
First, system’s performance was determined (a) by generating diagnoses on the basis of an initial set of patient data containing only history items. signs from the general physical examination, and basic laboratory test results: and (b) by using the complete set of available data including the initial set as well as special laboratory test results and results from clinical investigations (US, X
ray. CT-scan. ECG. and biopsy). This evaluation aimed at revealing differ- ences in the hypotheses generation rooted in the availability of patient data from different examination areas. The comparison was done by calculating sensitivity and specificity rates as measures of the obtained accuracy.
Second, the system’s performance was compared by applying two different definitions of what is considered to be a true positive result of the expert system. (Here. only the definition of what is a diugtzostic lzypotllr,.sis was var- ied: definitely confirmed diagnoses are of course true positive results.) Applied definitions were (a) true positive is if the gold standard is the first diagnosis in the ranked list of generated hypotheses: and (b) true positive is if the gold standard is among the hypotheses. This evaluation showed whether or under which circumstances the system indicates immediately the correct diagnosis 01 prompts the correct diagnosis only among others. Again, sensitivity and speci- ficity rates were calculated to assess the accuracy of the expert system.
Third, in order to determine the overall degree of the system’s performance. ROC curves were calculated by varying an internal threshold which influences the extent of CADIAG-3’s diagnostic hypotheses generation. The system’s designer and eventually the system’s user is thus enabled to optimize ad hoc decision criteria such as thresholds, weights, and scores, which are often an inherent part of an expert system’s reasoning mechanism.
EVALUATION OF MEDICAL EXPERT SYSTEMS 299
2. THE MEDICAL EXPERT SYSTEM CADIAG-2
The central goal of the CADIAG-2 project is the development of a medical consultation system for general internal medicine. Its underlying clinical issues are to assist in the differential diagnostic process (a) by indicating all possible diseases which might be the cause of patient’s pathological findings, with spe- cial emphasis on rare diseases: (b) by offering further useful examinations to confirm or to exclude gained diagnostic hypotheses or to find stronger support for them: and (c) by indicating patients’ pathological findings not yet accounted for by the expert system’s proposed diagnoses.
After gaining experience with the medical expert system CADIAG-I which was formally based on first-order predicate logic and pattern matching (a), a successor system CADIAG-2 was developed and implemented (14, 15). This system applies fuzzy set theory to model inherent vagueness of medical con- cepts and fuzzy logic to infer diagnostic conclusions. At present. CADIAG-2’s knowledge base contains disease profiles and complex rules for about 295 dis- eases, among them 185 rheumatic diseases (69 joint diseases. 12 diseases of the spinal column, 38 diseases of soft tissue and connective tissue system, 45 diseases of cartilage and bone, 21 regional pain syndromes) (16) and 110 gastro- enterological diseases (35 gall bladder and bile duct diseases (17), 10 pancreatic diseases (12, 13), 37 colon diseases, 28 diseases of the peritoneum).
The CADIAG-2 system is integrated into the medical information system WAMIS’ of the Vienna General Hospital (9). This integration allows the collec- tion of patient’s findings for CADIAG-2 via the routine medical documentation and laboratory system of WAMIS. Through a data abstraction and aggregation process (18), patient data are made available to the CADIAG-2 system which tries to infer diagnoses from these abstracted findings in a data-driven manner. In addition, patient data not routinely collected in WAMIS can be added to CADIAG-2 through a man-machine interface which processes medical terms given in natural language. A word segmentation algorithm allows usage of medical synonyms and abbreviations; moreover, it accepts various ortho- graphic variants and takes different medical suffixes into account (19).
The CADIAG-2 system was designed in such a way that three modes of application in our hospital are possible: (a) the screening and monitoring mode applied at a very early stage of the diagnostic process: (b) the consultation mode applied after complete data collection; and (c) the textbook mode without connection to the central patient data base.
CADIAG-2’s diagnostic process is based on both stored disease profiles and rules (usually very complex ones such as the ARA criteria for rheumatic dis- eases (20)). Two relationships define the association between findings and dis- eases in these disease profiles, first, the necessity of occurrence of a certain finding with a disease (frequency of occurrence degree) and, second, its suffi-
2 WAMIS is the German acronym for Wiener Allgemeines Medizinisches Informations-System (Vienna General Medical Information System).

300 ADLASSNIG ANDSCHEITHACIEK
ciency to infer the disease (strength of confirmation degree). The same relation- ships are applicable to define the associations between the antecedents and
consequents of rules. The inference process of CADIAG-2 aims at generating one or more differen-
tial diagnoses and-at the same time-at excluding some or all remaining diagnoses. A diagnosis is either established as definitely confirmed or proposed as a diagnostic hypothesis to be confirmed or excluded after additional exami- nations are performed.
Diagnoses are indicated as definitely confirmed if pathognomonic findings were found in the patient or confirming rules were triggered by patient’s find- ings. Because of the hierarchical relationships among diseases in CADIAG-2. diagnoses at a higher level in the disease hierarchy are confirmed as well it subdiagnoses are indicated as being confirmed.
Excluded diagnoses are established by either present excluding criteria or absent obligatory criteria. Excluding criteria may be single excluding findings. exluding rules or other, already established diagnoses which exclude other diagnoses. Findings and rule criteria defined to be obligatory present in the patient to establish a certain diagnosis but are definitely absent consequently exclude the respective diagnosis. Definitely excluded disease categories in the disease hierarchy cause also the exclusion of the entire set of the respective subdiagnoses. if any.
Diagnoses being confirmed and excluded at the same time-which might happen due to contradictory patient data and/or knowledge base errors-are termed diagnostic contradictions. They are displayed separately stating the reason of being established.
Diagnostic hypotheses are generated if a diagnosis is. first. neither con-
firmed, nor excluded. nor a contradictory result and, second, the strength of confirmation of at least one present finding, one triggered rule. or one already established subdiagnosis is equal or higher than a given threshold E (0 i c a.. I). Since the application of fuzzy set theory allows for mathematical modeling of borderline findings. the degree of presence of a finding (degree of membership in a fuzzy set) is combined with its strength of confirmation. If the resulting value, which is a measure of certainty of the concluded disease. lies between the threshold t: and unity (unity means full confirmation), the respective disease has to be taken into consideration as a diagnostic hypothesis. In addition, diagnostic hypotheses are ranked according to a score of support. This score is calculated on the basis of. first, the number of single findings present or present to a certain degree and having a relationship to the disease under consideration. second. the degree of presence of these findings, and third, the degrees for frequency of occurrence and strength of confirmation between these findings and the respective disease.
Diagnoses which are neither confirmed, nor excluded. nor diagnostic hypoth- eses, nor contradictory results are put into a category denoted by “not gener- ated diagnoses.” This allows the physician to obtain a complete survey of all diseases included into CADIAG-2’s knowledge base.

EVALUATIONOFMEDICALEXPERTSYSTEMS 301
In CADIAG-2, two forms of knowledge acquisition have been applied, first, acquisition of knowledge from medical experts and, second, semiautomatic acquisition of medical knowledge from a patient data base. Medical experts provide definitional and judgmental knowledge from textbooks and their own practical experience. The estimation of appropriate values for the frequency of occurrence and strength of confirmation degrees is assisted by an automatic procedure which calculates the respective values from stored patient records with known diagnoses (21).
Due to the large number of medical relationships contained in CADlAG- and CADIAG-2, intense efforts have been made to verify consistency and completeness of the respective knowledge bases. For CADIAG-1, a program was developed that verifies the internal consistency of the stored medical knowledge and-in case of inconsistencies-provides the line of reasoning for subsequent correction (22, 23). Because of the possible homomorphic mapping of CADIAG-2’s finding-to-disease relationships into the finding-to-disease rela- tionship categories of CADIAG-1, this program can partially be applied to CADIAG-2’s knowledge base as well (21).
At present, extended clinical trials for testing the diagnostic accuracy in all differential diagnostic groups included into CADIAG-2 are in process. Results that have been obtained by applying the system to about 700 clinical cases are described in (8, 12, 13, 16, 17).
3. THE CADIAG-2/PANCREAS SYSTEM
The knowledge base of CADIAG-21PANCREAS contains the profiles of 10 pancreatic diseases: pancreatic cancer, acute pancreatitis, chronic pancreati- tis, cystic pancreatic fibrosis, pancreatic pseudocyst, insulinoma, gluca- gonoma, Zollinger-Ellison syndrome, Verner-Morrison syndrome, and annu- lar pancreas. Complex rules were not defined for pancreatic diseases.
In order to establish the 10 disease profiles of pancreatic diseases, 327 find- ings (135 history items, 57 signs from the physical examination, 67 laboratory test results, 54 US, 6 X ray, 6 CT-scan, I ECG, and 1 biopsy finding) were applied. Altogether, 560 frequency of occurrence and 438 strength of confirma- tion degrees were ,entered. Some findings, such as patient’s sex and his age category, were included into the respective disease profiles but with a fre- quency of occurrence degree only. In average, about 56 findings are contained in ,each profile (minimum 15 findings, maximum 120 findings). The complete disease profile of pancreatic cancer can be found in (24). In addition, 21 hierar- chical relationships and 63 mutual exclusions among findings are contained in the knowledge base. There are no hierarchical relationships among diseases defined in the pancreas part of CADIAG-2.
In CADIAG-Z/PANCREAS, the only two diagnoses that can be confirmed are pancreatic cancer, due to a positive cytology by percutaneous aspiration biopsy (US/CT-guidance) and cystic pancreatic fibrosis, due to an abnormal jinding by pilocarpine-iontophoresis. Because of the lack of excluding crite-

302 ADLASSNIG AND SCHEITHAUEK
ria. excluded diagnoses as well as contradictory results cannot occur. Diagnos- tic hypotheses are established if one of the two pathognomonic findings are not fully present (i.e.. the findings are uncertain) and/or the strength of confirma- tion between a present finding or a finding present to a certain degree and the respective diagnosis is between zero and unity, as is in the majority of case>, and-in addition-the resulting certainty values for the inferred diagnoses equal or surpass the threshold F. A complete example of a diagnostic process in the area of pancreatic diseases can be found in (-34).
4. RECEIVER OPERATING CHARACTERISTIC (ROC) CURWS
An appropriate way to determine the accuracy of an automated system for decision making is to compare its decisions with a gold standard. In terms of an expert system for medical diagnosis. the gold standard is the histopathological or surgical diagnosis-if available-or at least the opinion of recognized ex- perts against which the program’s performance should be assessed. The analy- sis of a series of decisions shows that four alternatives are possible.
l true positive decisions, that is. the system’s decision is the “truly posi- tive” standard:
l false positive decisions, that is, a decision offered by the system is not the standard: a “falsely positive” decision was made;
l true negative decisions, that is, the system did correctly avoid a decision that is not the standard; the system decided “truly negative”:
l false negative decisions, that is, the system failed to make the correct decision; the result is “falsely negative.”
These four alternatives can be entered into a 2 x 7 table and average accuracy ratios may then be computed (see Table I).
Given a series of decisions, the accuracy of an automated system for decision
TABLE 1
2 x 2 TABLE FOR CALCULATING THE FOUR Accu-
RACY RATIOS: SENSITIVITY. SPECIFICITY, FALSE
POSITIVE RATIO, AND FALSE NEGATIVE RATIO (D. DECISION OR DIAGNOSIS PRESENT: D, DECISION OR
DIAGNOSIS ABSENT)
Note. True positive ratio (sensitivity) = cr/(a + c); true negative ratio (specificity) = d/(h + d): false positive ratio (1 - specificity) = b/(b + d); false negative ratio (I - sensitivity) = c/(a + c).

EVALUATION OF MEDICAL EXPERT SYSTEMS 303
making can now be determined by calculating the sensitivity and specificity rates or-which is equivalent-the respective false positive and false negative rates of the system.
However, a system’s internal decision criterion such as a threshold usually influences the performance of the system. In order to uncover this influence, the accuracy rates are computed for several series of decisions, where the internal decision criterion is varied over its possible range. The graph of the true positive versus false positive ratios is the ROC curve in terms of the decision performance. The ROC curves quite effectively isolate the overall capacity for discrimination of a system from the specific degree of discrimina- tion given a specific decision criterion (25-27). The ROC curves obtained in our study are given in Figs. 3-10. The figures are explained in detail in Section 5.2.
Moreover, it seems useful to explicitly provoke change of the performance of an expert system by varying these decision criteria, which are-in some form-usually an inherent part of an expert system and thus establish the systems’ overall degree of discrimination. By analyzing the resulting ROC curves, it is possible to compare the systems’ capacities for discrimination of different expert systems. The comparison between ROC curves can be carried out by calculating the areas under the ROC curves. Subsequently, these areas can be tested for statistically significant differences, as is reported in (28-30).
5. EVALUATION OF CADIAG-21PANCREAS
5.1. Patient data. For this study, 47 patient records from the 2nd Department for Gastroenterology and Hepatology (Director: Professor Dr. G. Grabner) of the University of Vienna Medical School were available. Altogether, these patients showed 51 pancreatic diagnoses. The gold standard for most of them was the given histopathological or surgical diagnosis; in some cases, a reliable clinical diagnosis was available. There was a lack of cases with cystic pancre- atic fibrosis, glucagonomu, Verner-Morrison syndrome, and annular pan- creas, which occur very rarely in our department. In detail, the tested cases were as follows:
22 cases with pancreatic cancer: 11 cases with chronic pancreatitis; 6 cases with acute pancreatitis; 2 cases with pancreatic pseudocyst and with coincident chronic pancreatitis; 2 cases with pancreatic pseudocyst and with coincident acute pancreatitis; 3 cases with Zollinger-Ellison syndrome; I case with insulinoma; a total of 47 cases with 51 pancreatic diagnoses.
The complete set of patient data contained about 200 findings of which about 30 findings were present and about 170 were marked by the physician as defi- nitely absent. The reduced set of patient data usually comprised about 20 present and 150 definitely absent findings.

304 ADLASSNIG AND SCHEITHAUEK
0
threshold: .O.i
0
1st 2nd 3rd.d.h
ihrrshoid “5
I rank 5th
0 rank
FIG. 1. Ranking of51 clinical diagnoses being candidates for hypotheses generation in CADIAG-
2. The hypotheses were established on the basis of patient history. physical examination, and basic
lab tests only. The threshold f: was set to 0.05 allowing a liberal hypothesis generation. There were
no confirmed diagnoses. In I3 cases, the system failed to establish the correct diagnosis as diagnos-
tic hypothesis.
FIG. 2. Ranking of 48 clinical diagnoses being candidates for hypotheses generation in CADIAG-
2. The hypotheses were established on the basis of complete patient data including history. phy\i-
cal examination. lab tests, and clinical investigations. The thresho!d R was cet to 0.05 allowing ;I
liberal hypothesis generation. Three of the original 51 diagnoses were confirmed and not any longet
candidates for hypothesis generation. In I case, the system Wed to establish the correct diagnoaix
as diagnostic hypothesis.
5.2. Evducrtion rrsrrlts. Figure I shows the ranking of the diagnoses pro- posed by CADIAG-2 in comparison with the 51 gold standard diagnoses where only the reduced set of patient data, which mostly consisted of more or less unspecific findings such as fever. rceakwss. vomiting, iml-ectsed hlocxf scdi- mcntation rcrtr, and so on. was applied. The threshold F was set to 0.05. that is, a very low threshold allowing liberal hypotheses generation. There were no confirmed diagnoses. In 32 cases 162.8%), the gold standard was the first diag- nosis in the ranked list of diagnostic hypotheses. In 6 cases (I 1.8%), the gold standard was at the second, third, or fourth place. In I3 cases (25.4%). the system failed to establish the gold standard as a diagnostic hypothesis at all. This can be explained by lack of specific findings in these cases, especially fog patients with chronic pmcreatitis.
In a next step, the same cases were tested but now with the complete set of patient data. Expectedly, the results improved because more data containing more specific information were available. In 3 cases, pnncreatic (‘ntz~‘er was confirmed by positive cytology and was no longer a candidate for diagnostic hypotheses generation. Figure 2 depicts the results of the remaining 48 cases in

EVALUATION OF MEDICAL EXPERT SYSTEMS 305
which the generation of the gold standard as diagnostic hypothesis was still possible. In 41 cases (85.4%), the gold standard was the first diagnosis in the ranked list of diagnostic hypotheses. In 6 cases (12.5%), the gold standard was at the second, third, fourth, or fifth place, and only in 1 case (2%), the gold standard was not among the generated hypotheses. Here, the reason was an incomplete medical record of the patient.
The results may be summarized in the following way: On the basis of pa- tient’s history, physical examination results. and results from basic lab tests, we obtained diagnostic accuracies of 62.8% if we demand that the correct diagnosis is at least the first hypothesis, and of 72.6% if we expect the correct diagnosis at least among the first three hypotheses. By adding results from further diagnostic investigations to the available finding list of the patient, the diagnostic results improved drastically, as can be expected. We obtained diag- nostic accuracies of 86.3% (correct diagnosis either confirmed or the jirst hy- pothesis) and of 96.1% (correct diagnosis either confirmed or among the first three hypotheses).
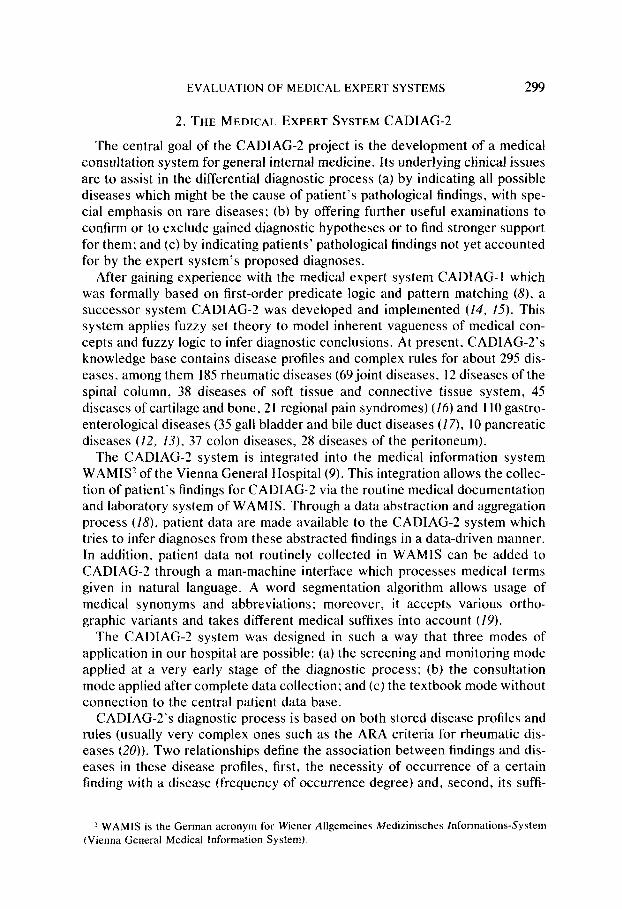
Figures 3-10 show the ROC curves obtained for various sets of gold standard diagnoses (Figs. 3 and 4 for all tested 5 1 diagnoses, Figs. 5 and 6 for 22 puncre- atic cancer diagnoses, Figs. 7 and 8 for 13 chronic pancrentitis diagnoses, and Figs. 9 and 10 for 8 acute puncreatitis diagnoses). Each figure contains two curves. One of the curves, marked by stars, shows the ROC curves under the assumption that true positive means the gold standard is among the diagnostic hypotheses. The other curve, marked by circles, has as underlying assumption that true positive means the gold standard is the jrst hypothesis in the ranked list of diagnostic hypotheses, therefore a more rigid criterion.
As can be seen, the curve obtained by applying the more rigid decision criterion shows a worse performance than the other, but only in the section of the curves with a low threshold which allows many hypotheses to be generated. By making the threshold higher, the number of false positive results dimin- ishes, so, if a hypothesis remains in the list it usually is the correct diagnosis.
Each pair of figures (Figs. 3 and 4, Figs. 5 and 6, Figs. 7 and 8, Figs. 9 and IO) were the result of testing the same cases but, first, with the reduced set of patient data (Figs. 3, 5, 7, and 9) and, second, with the complete set of patient data (Figs. 4, 6, 8, and 10).
The accuracy always increased by adding more specific data to the set of patient’s findings, which concurs with the anticipated performance of such a system, especially in the case of chronic pancreatitis (compare Figs. 7 and 8). As can be seen from Fig. 7, chronic pancreutitis was systematically underrated (under the dotted line) if only unspecific medical data of the patient were available. Diseases such as acute pancreutitis or pancreatic cancer usually obtained a higher rank by CADIAG-2 in this early stage of the diagnostic process, but one might argue that this is even desirable because clarifying acute or prognostically serious illnesses should be given priority.
CADIAG-2/PANCREAS was designed in such a way that the threshold E, which is the point of operation on the ROC curve, has as an initial value 0.10.

306 ADLASSNIG AND SCHEITHAUER
TP TP
FIG. 3. ROC curves (TP, true positive ratio vs PP. false positive ratio) calculated from all Sl
diagnoses being candidates for hypotheses generation. The hypotheses were established on the
basis of patient history, physical examination. and basic lab tests only. Two decision criteria were
applied: the gold standard diagnosis is the.fir.Pr hypothesis (line with circles). and the gold standard
diagnosis is rrnmn~ the hypotheses (line with stars). The threshold t‘ assumed the values 0.05. 0. I.
0.2, 0.3.0.4.0.5.O.h.O.7,0.8, and 0.9. A result under the 4Ydotted line is a systematic underrating
of the correct diagnoses.
FIG. 4. ROC curves (‘IT’. true positive ratio vs PP. htlse positive ratio) calculaied from the
remaining 48 diagnoses being candidates for hypotheses generation tin three case\. confirmed
diagnoses were obtained). The hypotheses were established on the basis of complete patient data
including history. physical ewamination. lab tests. and clinical investigations. Two decision criteria
wet-c applied: the gold standard diagnosis is the.fir.s/ hypothesis (line with circles), and the gold
standard diagnosis is trntong the hypotheses (line with stars). The threshold R assumed the values
0.05. 0.1. 0.2, 0.3. 0.4. 0.5. 0.6. 0.7. 0.8. and 0.9. A result under the 45’ dotted line would be a
\yxtematic underrating of the correct diagnosis.
However, this value can be actively varied by the physician during the actual consultation session and thus the sensitivity and specificity of the entire diag- nostic system can be changed. The physician can adapt the threshold to the available patient data and has thus control over the extent of the hypotheses generation. This leads to an interactive optimization of the decision results in such a way that the physician may start with a low threshold to obtain a broad spectrum of possible diagnoses but increases the value in the subsequent itera- tions when more specific findings are available and the diagnostic possibilities narrow.
6. DISCUSSION
Computer-assisted diagnosis of pancreatic diseases has been an issue of clinical interest for more than 10 years. The following should give a brief overview on some of the attempts made so far.

EVALUATION OF MEDICAL EXPERT SYSTEMS 307
TP
0
.8-
.6-
1 - - o: o: First First 1 . ...,‘. . ...,‘. hypothesis hypothesis ,:’ ,:’
0 ‘. 0 L- *: among hypotheses *: among hypotheses
.9.9 I I I I I I I I I .9.9 I I I I I I I I I 0 0 .I .I .2 .2 .3 .3 .4 .4 .5 .5 .6 .6 .7 .8 .9 .7 .8 .9 1 1
FP
1
.9 -
.Blm __:
.7- ,:. ,.:
.6- .:’ .:’
TP .5- __.’
.4
.3
.2
I
__:
.1 :.J o: first hypothesis
fa 1 ,:.’ +: among hypotheses w 0 y
.9r.9 I I I I I I I I I 0 .l .2 .3 .4 .5 .6 .7 .8 .9 1
FP
FIG. 5. ROC curves (TP, true positive ratio vs FP. false positive ratio) calculated from all 22 puncreufic wncer diagnoses being candidates for hypotheses generation. The hypotheses were established on the basis of patient history, physical examination. and basic lab tests only. Two decision criteria were applied: the gold standard diagnosis is the,firsf hypothesis (line with circles), and the gold standard diagnosis is ccmong the hypotheses (line with stars). The threshold E assumed the values 0.05.0.1.0.2.0.3.0.4.0.5.0.6.0.7,0.8. and 0.9. A result under the 45” dotted line would be a systematic underrating of puncreutic ccrncer.
FIG. 6. ROC curves (TP, true positive ratio vs FP, false positive ratio) calculated from the remaining I9 pancreatic cancer diagnoses being candidates for hypotheses generation (in three cases. pcrncreatic UUK’FY was confirmed by positive cyfolo~.v). The hypotheses were established on the basis of complete patient data including history. physical examination, lab tests, and clinical investigations. Two decision criteria were applied: the gold standard diagnosis is thefirsr hypothe- sis (line with circles). and the gold standard diagnosis is trrnonl: the hypotheses (line with stars). The threshold 8 assumed the values 0.05,O. I, 0.2,0.3,0.4.0.5.0.6,0.7,0.8. and 0.9. A result under the 45” dotted line would be a systematic underrating of pctncr-acetic, c~~cr.
In studies carried out by Thurmayr et nl. (31-34), several multivariate statis- tical approaches such as discriminante analysis, cluster analysis, and factor analysis were applied to aid in the diagnosis of pancreatic diseases. In these applications, disease entities to be discriminated were such as pancreutic can- cer, chronic, calcifying pancreutitis, chronic, recurring puncrratitis without radiological evidence of calcijication, and acute pcmcrentitis. Diagnoses were established on the basis of pancreatic function tests, where the number of test results taken into consideration ranges from 13 to 22. As is reported in (33), the correct classification rate obtained by applying a nonlinear discriminant analy- sis with 13 selected variables to different disease group arrangements was 46% for discriminating between six groups (32 cases with norm& pancreatic jitnc- tion test, 21 cases with pancreatic cancer, 41 cases with culci~~ing pancreatitis, 64 cases with chronic, recurring pancreutitis, 36 cases with acute gastric or duodenal ulcer, and 48 cases with chronic ulcer), 77% for three groups (32
308 ADLASSNIG AND SCHEITHAUER
TP
0
1 0: first hypothesis
.9 t: among hypotheses ..:
,:-
.8- ,:’ .:’
,.:
.7- ,.:
:
.6-
5- .:’ ..:
4- ..: ,:.
.3- . ..’ ,.:
o-i’- .9 .9
, , , , , / / , ,
0 .I .‘.2 .3 .4 .5 .6 .7 .8 .9 I
TP
8
FP F P
t;lc;. 7. ROC curves (TP. true positive ratio vs FP, false positive ratio) calculated from all 13
c~hrooic prrncwutifis diagnoses being candidates for hypotheses generation. The hypotheses were
established on the basis of patient history. physical examination. and basic lab te\ts only. Two
decision criteria were applied: the gold standard diagnosis is the,firsr hypothesis (line with circles).
and the gold standard diagnosis is crmon~ the hypotheses (line with stars). The threshold F assumed
the values 0.05. 0.1, 0.2. 0.3. 0.4, 0.5. 0.6, 0.7, 0.8, and 0.9. A result under the 45” dotted line is a
systematic underrating of c~/?lo~~ic~ prrncrcc~fiti.c.
PIG. 8. ROC curves (TP. true positive ratio vs FP. false positive ratio) calculated from all I3
c~i~onic~ punc~crtitis diagnoses being candidates for hypotheses generation. The hypothese\ wcrc
established on the basis of complete patient data including history. physical examination. lab tests.
and clinical investigations. Two decision criteria were applied: the gold standard diagnosis i\ the
,)r.c/ hypothesis (line with circles), and the gold standard diagnosis ix trmorrp the hypothese\ (line
with stars). The threshold E assumed the values 0.05.0. I. 0.2.0.3,0.4. 0.5.0.6. 0.7. 0.8. and 0.9. .4
result under the 45” dotted line would be a systematic underrating of (k,onic~ prtrc,wtrti/iv.
lwulthy slr~jects, I26 cases with pclncrrrrtic, disccrsrs. 84 cases with ~/lc,rr). and 96%~ for a two-group discrimination (126 cases lzlith ptcncrrcrtic disc)crscJs and 126 cases withottt pawcretrtic. disectsts).
In (35). Durbec et NI. report on an application of screening radiological signs to indicate pancreas pathologies. The screening was based on some selected binary variables found to be significant for the respective pathology. Four groups of pancreatic diseases were distinguished for this purpose: pancrPrrtic cmc-zr, chronic calciiving pmcreatitis, nonculcjf~ir~g prmcrecrtitis. and pro/w hle pmicreatitis.
Another application of computer-assisted diagnosis of pancreatic disorders is described in Boda and Pap (36). Multivariate statistics and pattern recognition methods were applied to separate patients with pwwrms insujjicietzcy from halthy wntrol subjects. This two-group differentiation is carried out on the basis of 14 laboratory parameters. The application of a linear discriminant analysis to 71 cases yielded an accuracy of 92.2%, a nearest neighbor method

EVALUATION OF MEDICAL EXPFRT SYSTEMS 309
TP TP
FP FP
FIG. 9. ROC curves (TP. true positive ratio vs FP. false positive ratio) calculated from all 8 UC’LI~~ pancrratitis diagnoses being candidates for hypotheses generation. The hypotheses were estab- lished on the basis of patient history, physical examination. and basic lab tests only. Two decision criteria were applied: the gold standard diagnosis is thejrsr hypothesis (line with circles), and the gold standard diagnosis is among the hypotheses (line with stars). The threshold E assumed the values 0.05, 0. I, 0.2,0.3,0.4,0.5,0.6.0.7. 0.8, and 0.9. A result under the 45” dotted line would be a systematic underrating of ucute pancreatitis.
FIG. IO. ROC curves (TP, true positive ratio vs FP, false positive ratio) calculated from all 8 ucurc puncrautitis diagnoses being candidates for hypotheses generation. The hypotheses were established on the basis of complete patient data including history, physical examination. lab tests, and clinical investigations. Two decision criteria were applied: the gold standard diagnosis is the jrsl hypothesis (line with circles), and the gold standard diagnosis is umonp the hypotheses (line with stars). The threshold E assumed the values 0.05,O.l. 0.2. 0.3,0.4.0.5,0.6,0.7. 0.8, and 0.9. A result under the 45” dotted line would be a systematic underrating of acute puncruufitis.
applied to 62 cases reached an 80.1% accuracy, and a centroid method with 66 cases showed an 85.7% accuracy. A reduction of the considered laboratory parameter to only 7 yielded a change of the accuracy rates to 88.3%, 80.5%, and 85.7%, respectively.
Apart from these applications dedicated to computer-assisted diagnosis of pancreatic diseases only, there are several other systems that include pancre- atic diagnoses.
One of them is the system for diagnosing mute abdominal pain developed by de Dombal et al. (4, 37, 38). It contains acute pancreatitis as one of the major disease categories.
Systems that are aimed at medical diagnosis in the entire field of internal medicine necessarily contain also pancreatic diseases.
The INTERNIST-VCADUCEUS system (3941) (consequently also the QMR system (6) employing the same knowledge base as INTERNIST-VCA- DUCEUS) contains at present 8 pancreatic diseases. In detail, these are pan-

310 ADLASSNIGANDSCHEITHAUEK
The diagnostic prompting system RECONSIDER (42-44) comprises the largest number of pancreatic diseases. Twenty pancreatic diseases are included into RECONSIDER (from (4.5)): Zollitzgrr-Ellisott .s~ttdrotw; pctnc’rccts. rrhcr- rcinl; pctt1c~ri~n.s. rihsc~c~ss; princwcr.s. cittrtioc~trrc~itiorllrr. body trtid trril; prrncwtrs. rrnnulw pcincwrrs, crrropliy; pcinuctrs, cidrttoc~at.c~itiolllrl. hrtrd; ptitrc~rrtrs, c’yst. cw~genitcil; paticrraLs, c~qsrrrdrtto~~rrr~it~~~ttt~t; put1creu.s. c,?'sf. ,fiilw; ['ritlc~lI'os.
c.~.sttr~i~~notriri; pcrncrt~ris. c’.v.st. trite; ptrncwtrs. injury; ptrnc~rrtitiris. ricrrtt~; ptiti- cre~~.s. islet-c,cll tirmor; princrecititis, clilonic; prrncrcntiliLs. Iieredilwy; putt- c’reus, po.slol~c’rLttivt~: prrnc~reas. /1(~tti0rr/tNKi(.. trculc; and VrrttC’t.--MOrri.sott ix- ler-cell rrtmor sqttdromc.
The approach taken in CADIAG-Z/PANCREAS lead to the inclusion of IO pancreatic diseases. After completion of the documentation and evaluation of the other differential diagnostic groups from the area of gastroenterology and hepatology (diseases of the esophagus, stomach, liver. gallbladder and biliary tract, intestine, colon, and peritoneum), we will merge these single groups to a larger system for gastroenterology and hepatology.
The heterogeneous number of pancreatic diagnoses included into the above- mentioned computer systems is likely to result from the more or less controver- sial and continuously changing medical nomenclature that has been established according to etiology. anatomy. and histopathology (cf. ICD-9 (4, 37) and ICD-9/CM (48. 49)). For a computer-based diagnostic system, classification of diseases according to therapeutically and prognostically distinct entities seems most appropriate. Application of both the INTERNIST-I/CADUCEUS and the CADIAG-? system will allow sufficient precise and clinically relevant differen- tial diagnosis in the hospital and the physician’s office.
Last but not least. an application of ROC curves to evaluate clinical perfor- mance is described in (50). The aim of those studies was to evaluate the effect of computer confidence of threshold levels and to assess clinical performance in the diagnosis of crcrrfe trppcndiciGs.
The evaluation described in this paper was done to prepare the clinical appli- cation of CADIAG-2 in the field of gastroenterology and hepatology. CADIAG- 2 is aimed at an application in two subsequent phases (as described in (Y) in more detail):
( I ) as an early, data-activated automatic screening and monitoring procedure for detecting pathological states in the patient, for generating diagnostic hy- potheses, and for proposing further useful examinations; and
(2) as an on-line consultation system for the clinician which assists him in clarifying patient’s disorders completely and in great detail.
The results obtained so far are considered to be satisfactory. We included IO pancreatic disease entities into the expert system which-compared with other, similar systems-seem to be a good choice. It was possible to formally

EVALUATION OF MEDICAL EXPERT SYSTEMS 311
describe these diseases by disease profiles including findings from all areas of investigation. Two important medical relationships were selected to define the association between two medical entities: the frequency of occurrence (neces- sity) and the strength of confirmation (sufficiency) degrees. An inference mech- anism combining a fuzzy logical and a heuristic approach to conclude diagnoses with degrees of certainty was applied. This algorithm also considered the possi- ble vagueness of patient’s medical findings. The diagnostic hypotheses ranking according to the heuristically calculated support score proved to be quite suc- cessful as was shown by the obtained accuracy rates. The overall performance of CADIAG-2 is reflected by ROC curves. This measure is independent of internal decision criteria, which-if changed-usually alter the outcome and thus the overall accuracy of a system. It is argued that it seems useful to provoke change of the performance of an expert system by varying internal decision criteria. which-in some form-are usually part of the system, and establish the system’s general degree of discrimination. By analyzing these, one might say, systems’ characteristic curves, it is possible to compare the systems’ capacities for discrimination of different medical expert systems and to determine their optimal points of operation.
ACKNOWLEDGMENTS
We thank J. Yen, G. Tusch. and W. Moser for many helpful discussions on the presented subject. We are also grateful to 1. Griiger and G. Sedivy for their valuable assistance in the preparation of the patient data and the medical knowledge.
REFERENCES
1. PRYOR, T. A.. GARDNER. R. M., CLAYTON. P. D., AND WARNER, H. R. The HELP system. J. Med. Syst. 7, 87 (1983).
2. AIKINS, J. S., KUNZ, J. C., SHORTLIFFE. E. H., AND FALLAT, R. J. PUFF: An expert system for interpretation of pulmonary function data. Compur. Biomed. Res. 16, 199 (1983).
3. SHORTLIFFE. E. H., SCOTT. A. C.. BISCHOFF, M. B.. CAMPELL, A. B.. VAN MELLE. W.. AND JACOBS, C. D. An expert system for oncology protocol management. In “Rule-Based Expert Systems-The MYCIN Experiments of the Stanford Heuristic Programming Project” (B. G. Buchanan and E. H. Shortliffe. Eds.), pp. 653-665. Addison-Wesley. Reading, MA, 1984.
4. DE DOMBAL, F. T. Computers and decision-making: An overview for gastroenterologists. In “Computer Aid in Gastroenterology” (P. Rozen and F. T. de Dombal. Eds.), pp. 119-133. Karger. Basel, 1984.
5. MILLER, R. A., POPLE, H. E., AND MYERS, J. D. INTERNIST-I, an experimental computer- based diagnostic consultant for general internal medicine. N. f%gl. J. Med. 307, 468 (1982).
6. FIRST. M. B., SOFFER, L. J., AND MIL.LER, R. A. QUICK (Quick Index to Caduceus Knowl- edge): Using the internist-l/caduceus knowledge base as an electronic textbook of medicine. Cornput. Biomed. Ra. 18, 137 (1985).
7. TUTTLE, M. S., SHERERTZ. D. D., BLOIS. M. S.. AND NELSON. N. “Expertness” from struc- tured text? RECONSIDER: A diagnostic prompting program. In “Proceedings. Conference on Applied Natural Language Processing.” pp. 124-131. Santa Monica, CA, 1983.
8. ADLASSNIG. K.-P., KOLARZ. G., SCHEITHAUER. W.. EFFENBERGER. H., AND GRABNER, G. CADIAG: Approaches to computer-assisted medical diagnosis. Cornput. Biol. Med. 15, 315 (1985).

312 ADLASSNIG AND SCHEITHAUER
Y. ADLASSNIG. K.-P., Kot.~uz. G., SCHEITHAU~R. W., AND GRAENER. G. Approach to a hospi-
tal-based application of the medical expert system CADIAG-2. Mrd. Inf: 11, 305 (1986). 10. LIEBOWITZ. J. Useful approach for evaluating expert systems. Flup. Sr’st. 3. 86 (1986).
II. FIESCHI. M.. AND JOUBERT. M. Some reflections on the evaluation of expert systems in
medicine. Met/lo& Ir;/: Med. 25, 15 (1986).
j-7. ADLASSNIC, K.-P.. SCHEITHAUER. W.. ANDGRABN~R. G. Computerunterstut~te medizinische
Diagnostik und ihr Einsatz bei Pankreaserkrankungen. Ac,ttr Mctl. AMY/. 11, 125 (1984).
1-j. ADLASSNI~;. K.-P., SCHEITHAUER. W.. AND GRABNER G. C’ADIAC-Z/PANCREAS: An artiti- cial intelligence system based on fuzzy set theory to diagnose pancreatic diseases. I,r “Pro-
ceedings. Third International Conference on System Science in Health Care,” pp. 196-799.
Springer-Verlag. Berlin. 19X4.
I-I. AIILASSNIG. K.-P. A fuzzy logical model of computer-assisted medical dtagnosi\. Mcrlr~~tl.~ II!/.
MlJd. 19, I41 11980).
1.5. ADLASSNI~;. K.-P. Fuzzy set theory in medical diagnosis. IEEt Ii-crrr.c. S\..v/. Llrrlt C’yhe~.,r.
SMC-16. 760 (1986).
16. KOLARZ. G.. AND ADI..~ssN~~. K.-P. Problems in establishing the medical expert \ystcms
CADIAC-I and C’ADIACi-7 in rheumatology. .1. Mud. Syst. 10. 395 c 1986). 17. AKHAVAN-HEIIIARI. M.. ~NI) ADLASSNIG. K.-P. Preliminary results on CADIAG-lIGAI.I.: A
diagnostic consultation system for gallbladder and biliary tract diseases. frr “Proceedings.
Medical lnformatics Europe ‘88,” pp. 622-666. Springer-Verlag. Her-lin. 198X.
IK. ADI ASSNI~,. K.-P. Uniform representation of vagueness and impreci\ton in patient’\ medical
findings using fuzzy sets. I/t “Proceedings, Cybernetics and System\ ‘XX.” pp. hX5-693. Klu-
wer Academic Publishers. Dordrecht. 1988.
IY. ADI.ASSNI(;. K.-P.. ANI) GRAHNER. H. Verarbeitung naturlichsprachiger medttinischer Be-
griffe. f/t “WAMIS-Wiener Allgemeines Medizinisches Inf~~rmations-Systems” t<;. Grahner.
Ed.), pp. 163-1X9. Springer--Verlag, Berlin. 19X5.
-70. ARNETT, F. C.. EDWOR~H~. ST. M., BLOCH. D. A.. MCSHANE. I>. J.. FRIES. J. I-.. <‘oopc~.
N. S.. HI-AI I y. I.. A.. K.%PI /IN. ST. R.. LIANG. M. H.. IXIHRA. H. S.. MEIXGI~R. TH. A..
JK., MIrCHt I I D. A.. NI USIAIX. D. A.. PINAI.S. R. S.. SCIIAI ILFK. J. Ci.. SHARI’. J. T..
WIL.DFR. R. I... AND H~INDEK. G. G. The American Rheumatism Association 1987 {revised
criteria for the classification of rheumatoid arthritis. Arthritis Rhc,rlnr. 33. 3 1.5 (1988). 2/. AIX ASSNIG. K.-P.. AND Kol ARZ, G. Representation and semiautomatic acquisition of medical
knowledge in CADIAC- I and CADIAG-2. C;jnrplrt. Riomet/. Rc.c. 19, 63 ( 1986). 2. BARACHINI. F. “Konsistcnzprufung von Wissensbasen medizinischer Expertrnxystcme.”
Ph.D. dissertation. Technical University Vienna. Vienna, 19X4.
3. BARACHINI, F.. AND ADI ASSNI~. K.-P. CONSDED: Medical knowledge base consistency
checking. In “Proceedings. Medical lnformatics Europe ‘X7,” pp. 951-956. EFMI, Rom. 19X7.
24. ADLASSNIC;. K.-P.. SC H~YIHAUER. W.. AND KOI.ARZ. G. Fuzzy medical diagnosis in ;I ho\pt-
tal. In “Fuzzy Logic in Knowledge Engineering” t H. Prade and C‘. V. Negoita. Eds. ), pp. 17F-
294. Verlag TUV. Rheinland. 19X6.
2.5. l.USTED. L. B. “Introduction to Medical Decision Making. ” ‘Thorna\. Springlield. II.. 196X.
26. SWETS. J. A. The relative operating characteristic in psychology. St,ic,nc.r~ 182, 990 I 1973).
-77. KOMAROI-fi, A. 1.. The variability and inaccuracy of medical data. Prr)c.. lEEE67. I I96 (1979).
2X. CENTOR. R. M.. AND SCHW,\RTZ. J. S. An evaluation of methods for estimating the area under
the receiver operating char-acteristic (ROC) curve. M&. fkc~ision Mcr/,ing 5, 149 (1985).
.?Y. CENTOR. R. M. A visicalc program for estimating the area under a receiver operating char-a-
teristic tROC) curve. Mccl. fkcision MoXirrg 5, I39 (1985).
.j(/. ENGLANI), W. I An exponential model for optimal threshold selection on ROC‘ curves. bJrl/.
fkisiorr Making 8. I20 t 198X).
3/. THURMAYR, R.. OT-IE, M.. AND THURMAYR. G. R. Computer aid for diagnosing pancreatic.
hepatic and gastric diseases by pancreatic function test. 1tt “Proceedings. MEDINFO 74.” pp.
607-612. North-Holland. Amsterdam, 1974.
32. THURMAYR, R.. BLOMFR. R. J.. FORELL. M. M.. JAI=&, A., OTTE. M.. RASCH~W.~. c‘.. ANI)
I‘HURMAYR. G. R. Computer aided diagnosis of pancreatic function tests in the troutine situ+

EVALUATION OF MEDICAL EXPERT SYSTEMS 313
tion. In “Decision Making and Medical Care” (F. T. de Dombal and F. GrCmy, Eds.). pp. 175% 182. North-Holland, Amsterdam, 1976.
33. SCHAFFER, J. B., THURMAYR. R., THURMAYR, G. R., AND OTTE. M. Auswertung von Daten aus dem Pankreasfunktionstest mit drei multivariaten Methoden: Clusteranalyse, nichtlineare Diskriminanzanalyse und Faktorenanalyse. EDV Med. Biol. 10, 54 (1979).
34. THURMAYR, R., THURMAYR, G. R.. OTTE, M., AND FORELL, M. M. Computer aid for the screening test of pancreatic diseases. In “Computers and Mathematical Models in Medicine” (D. Cardus and C. Vallbona. Eds.), pp. 232-238. Springer-Verlag, Berlin, 1981.
35. DURBEC, J.-.P., CORNBE, J.. AND BERTHEZENE. P. Data screening methods-Application to differential diagnosis in pancreatic pathology from radiological signs. Methods Injl Med. 17. 36 (1978).
36. BODA. K., AND PAP, A. Diagnostics of pancreatic insufficiency using multivariate statistical and pattern recognition methods. Comport. Biol. Med. 14, 91 (1984).
37. DE DOMRAL. F. T., LEAPER. D. J., STANILAND, J. R.. MCCANN, A. I’., AND HORROCKS, J. C. Computer-aided diagnosis of acute abdominal pain. b-if. Med. J. 2, 9 (1972).
38. LEAPER, D. J.. HORROCKS. J. C.. STANILAND. J. R.. AND DE DOMBAL, F. T. Computer- assisted diagnosis of abdominal pain using “estimates” provided by clinicians. Brif. Med. J. 4, 350(1972).
39. MILLER, R. A., POPLE. H. E., AND MYERS, J. D. INTERNIST-l, an experimental computer- based diagnostic consultant for general internal medicine. N. .511x/. J. Med. 307, 468 (1982).
40. MILLER, R. A. INTERNIST-l/CADUCEUS: Problems facing expert consultant programs. Methods Inf. Med. 23, 9 ( 1984).
41. MASARIE, F. E., MILLER, R. A., AND MYERS. J. D. INTERNIST-I Properties: Representing common sense and good medical practice in a computerized medical knowledge base. Conqrrt. Biomed. Res. 18, 458 (1985).
42. TUTTLE, M. S., SHERERTZ, D. D., BLOIS, M. S., AND NELSON, N. “Expertness” from structured text? RECONSIDER: A diagnostic prompting program. 11~ “Proceedings, Confer- ence on Applied Natural Language Processing,” pp. 124-131. Santa Monica, CA, 1983.
43. BLOIS, M. S. “Information and Medicine.” Univ. of California Press, Berkeley, 1984. 44. NELSON, S. J.. BLOIS. M. S.. TUTTLE, M. S.. ERLBAUM, M.. HARRISON, P., KIM. H.,
WINKELMANN, B., AND YAMASHITA. D. Evaluation RECONSIDER-A computer program for diagnostic prompting. J. Med. Syst. 9, 379 (1985).
45. GORDON. B. L. (Ed.). “Current Medical Information and Terminology.” American Medical Association, Chicago, IL. 1971.
46. “International Classification of Diseases.” 9th Rev., Vol. I. World Health Organization, Ge- neva, 1975.
47. “International Classification of Diseases,” 9th Rev.. Vol. 2. Alphabetical Index. World Health Organization, Geneva, 1975.
48. “ICD-9-CM The International Classification of Diseases,” 9th Rev., Clinical Modification, Vol. 1, Diseases-Tabular List. Edwards Brothers, Inc., Ann Arbor, MI, 1980.
49. “ICD-9-CM The International Classification of Diseases.” 9th Rev., Clinical Modification, Vol. 2, Diseases-Alphabetic Index. Edwards Brothers, Inc., Ann Arbor, MI, 1980.
50. DE DOMBAL. F. T., AND HORROCKS. J. C. Use of receiver operating characteristic (ROC) curves to evaluate computer confidence threshold and clinical performance in the diagnosis of appendicitis. Methods oflr$ Med. 17, 157 (1978).