Performance Evaluation of Green Roof Systems Using the Roof
59
Performance Evaluation of Green Roof Systems Using the Roof Evaluation Modules (REM) Final Report December 21, 2010 REM-10 Quad-Lock Building Systems
Transcript of Performance Evaluation of Green Roof Systems Using the Roof

Performance Evaluation of Green Roof Systems
Using the Roof Evaluation Modules (REM)
Final Report December 21, 2010
REM-10
Quad-Lock Building Systems

Performance Evaluation of Green Roof Systems Using the Roof Evaluation Modules (REM)
Final Report
REM-10
Submitted to:
Mr. Douglas Bennion Quad-Lock Building Systems 7398-132nd Street Surrey, BC V3W 4M7
Submitted by: British Columbia Institute of Technology Centre for Architectural Ecology 555 Great Northern Way Vancouver, BC V5T 1E2
Reporting Period: January 2009 – December 2009
We would like to acknowledge the Natural Sciences and Engineering Research Council (NSERC) for the financial support through its College and Community Innovation Pilot Program as well as Western Economic Diversification Canada for its continuous financial support.

Contributors:
Centre for Architectural Ecology Maureen Connelly, Director
Kerly Acosta, Research Faculty John Compton-Smith, Research Analyst
Janet Snell, Research Faculty
BCIT Technology Centre Matt Greig
Joe Newton Dr. Mehrzad Tabatabaian
Technical Assistance Bob Maikawa
Report Authors:
Maureen Connelly, Director John Compton-Smith, Research Analyst
Janet Snell, Research Faculty (Primary Author)

Executive Summary
Roof Evaluation Modules (REM) allow researchers to evaluate the engineering performance of green roof systems through field monitoring. Each REM resembles a mini-building with an experimental roof deck over a temperature-controlled interior space. The roofing and green roof systems are fully instrumented to measure the temperature profile, heat flow and roof stormwater runoff. REMs enable manufacturers and researchers to change the variables and configurations of green roof systems and evaluate the effects systematically.
This project is designed as a two-year study to allow a full year of data coverage and reporting. The first year is typically used for plant growth and establishment with the second year providing a full year of performance data.
The Roof Evaluation Module (REM-10) used for this study was installed in early June 2008 and instrumented in the months following installation. The use of pre-planted modules allowed data collection to begin immediately, which accelerated the reporting schedule.
This Final Report follows Progress Report #1, which covered the first six months of the project from July 2008 to December 2008 and presented the initial results of data collection and analysis.
The Final Report includes performance data for one full year from January 2009 to December 2009. It details the thermal performance and stormwater runoff retention characteristics of the REM at different seasons over one full year. The energy efficiency of the green roof system of the REM is calculated based on heat loss/gain through the roof. The plant growth for this period is also documented.
The results can be summarized as follows:
• The temperature fluctuation of the REM-10 roof membrane was held close to the air temperature, which reduced temperature fluctuation compared to the reference roof.
• The REM-10 green roof system was more effective in reducing heat flow through the roof system than the reference roof. The heat flow in the summer was reduced by 98% (heat gain) and 77% (heat loss) compared to the reference roof; the heat loss during the winter was reduced by 50% compared to the reference roof.
• The stormwater retention efficiency of the REM-10 green roof system was higher in the dry season (94% average event retention) than in the wet season (45% average event retention).
• The REM-10 annual average stormwater event retention capacity was 69%. • The plant mixture of sedums species interspersed with grasses and perennials in REM-
10, which began as pre-grown modules, grew successfully and increased in overall height from the beginning of the study. Some grasses died back but new growth occurred in new locations.
In order to show the progression over time in instrumentation, data collection and analysis, excerpts from Progress Report #1 are included in light coloured text with current information shown in standard text colour. Other portions of Progress Report #1 are included to provide the project context.
This study originated as part of a larger study on green roof technology with the Natural Sciences and Engineering Research Council (NSERC), College and Community Innovation Pilot Program, with continuous supporting funding from Western Economic Diversification Canada.

Table of Contents
Section Page
1 Background .................................................................................................................... 1
2 Roof Evaluation Module (REM) ...................................................................................... 1
2.1 The REM Concept ............................................................................................... 1
2.2 Materials and Construction .................................................................................. 2
3 Quad-Lock REM Roof Assembly Installation and Instrumentation .................................. 2
3.1 Configuration ....................................................................................................... 2
3.2 Roofing System – Soprema ................................................................................. 2
3.3 Green Roof System – LiveRoof supplied by NATS Nursery ................................ 3
3.4 Instrumentation ................................................................................................... 4
3.4.1 Temperature Profile .................................................................................. 6
3.4.2 Heat Flow ................................................................................................. 6
3.4.3 Stormwater Runoff .................................................................................... 7
3.4.4 Meteorological Data ................................................................................. 7
3.4.5 Space Conditioning .................................................................................. 8
3.4.6 Data Acquisition System ............................................................................ 9
3.5 Performance Analysis Method ........................................................................... 10
3.5.1 Thermal Performance .............................................................................. 10
3.5.2 Stormwater Management ........................................................................ 11
3.5.3 Plant Establishment Monitoring ............................................................... 11
4 Results ......................................................................................................................... 11
4.1 Climate Data ..................................................................................................... 11
4.1.1 Weather Conditions for the 2009 reporting period ................................... 12
4.2 Thermal Performance ........................................................................................ 14
4.2.1 Temperature and Heat Flow Profiles ....................................................... 14
Winter Performance − January 18, 2009 ................................................. 14
Summer Performance − July 26, 2009 ..................................................... 17
Late Fall Performance − November 8, 2009 ............................................ 20
4.2.2 Energy Efficiency − Seasonal Average Daily Heat Flow .......................... 23

Section Page
4.3 Stormwater Retention ........................................................................................ 26
4.3.1 Late Fall Rainfall Event (Wet Season) – December 12, 2008 .................. 27
4.3.2 Spring Rainfall Event (Wet Season) − March 17 − 20 .............................. 30
4.3.3 Summer Rainfall Event (Dry Season) – September 9, 2009 .................... 32
4.3.4 Fall Rainfall Event (Wet Season) – November 14 − 17, 2009 .................. 34
4.3.5 Stormwater Event Retention Statistics ..................................................... 36
4.4 Plant Growth and Establishment ....................................................................... 37
5 Discussion ................................................................................................................... 38
5.1 Thermal Performance ........................................................................................ 38
5.1.1 Temperature Fluctuation ......................................................................... 38
5.2 Energy Efficiency ............................................................................................... 38
5.2.1 Calculation of Heating/Cooling Cost Benefits .......................................... 38
5.2.2 Reduction in Greenhouse Gases Generated ........................................... 39
5.3 Stormwater Runoff Retention ........................................................................... 40
5.3.1 Seasonal Variation .................................................................................. 40
5.3.2 Experimental Design Limitations ............................................................. 40
5.4 Plant Performance ............................................................................................. 40
6 Conclusions ................................................................................................................. 41
7 Appendix ...................................................................................................................... 42
7.1 Plant Photographs ............................................................................................. 42
7.2 References ....................................................................................................... 53

BCIT Centre for Architectural Ecology
REM-10 December 2010 1
1 Background “Green roofs” are specialized roofing systems that support vegetation growing on rooftops. Green roof technology offers multiple benefits to the urban area. It can reduce site level stormwater runoff, lower a building’s cooling/heating energy demand, and possibly extend the roof membrane’s service life through reduced exposure to heat and ultraviolet radiation. When widely adopted, green roofs can reduce the impact of stormwater on watersheds, mitigate the urban heat island effect, and contribute positively to clean air and water in urban areas.
With increasing awareness of sustainability and the rapid adoption of Leadership in Energy and Environmental Design (LEED) throughout the country, green roofs are gaining popularity as a sustainable building design option in Canada. In particular, extensive green roof systems that involve small hardy perennials planted in relatively shallow growing media are especially attractive. They are lightweight, low cost and low maintenance; therefore, they provide the most benefits for the investment.
While extensive green roofs have been widely adopted in western European countries such as Germany and Sweden for over 30 years, green roof technology is a relatively new concept in North America. However, a recent survey by the Green Roofs for Healthy Cities industry association showed an increase in the installation of extensive green roofs in North America in 2009 representing a growth rate of 16% over 2008.1 Despite this very positive growth rate, green roof technology in North America is still well below its use in Western Europe. Discussion with architects and building owners revealed that cost, lack of climate-specific performance data, absence of third party testing and verification of green roof systems, and a lack of demonstrated feasibility are the main barriers to market penetration of green roof technology in British Columbia.
2 Roof Evaluation Module (REM)
2.1 The REM Concept The Roof Evaluation Module (REM) is an innovative tool that allows researchers to evaluate and compare the engineering performance of green roof systems through field monitoring. Each REM resembles a mini-building with an experimental roof deck over a temperature-controlled interior space. The roofing and green roof systems are fully instrumented to measure the temperature profile and heat flow between the indoor and the outdoor environments. The roof runoff is collected and measured by a flow meter. The data are collected by a data acquisition system located in the Green Roof Research Facility (GRRF) at the same site and stored in a dedicated computer at the facility. The data are compared to the reference roof on the GRRF. REMs allow manufacturers and researchers to change the variables and configurations of green roof systems and evaluate the effects systematically.
A low-sloped REM that represents a flat roof (2% slope) has approximate dimensions of 2 m X 2 m in roof area and 1.5 m in height. A steep-sloped REM has the same projected roof area (2 m X 2 m) as a low-sloped REM but the height depends on the roof slope. The REMs are designed to be readily moved by forklift and transported by truck.
The experiments have so far been conducted at BCIT’s Great Northern Way Campus in Vancouver to evaluate the performance of different green roof systems in BC’s unique rainforest climate. In the future, the REMs may be transported to other cities to compare their performance in different climate zones across Canada. 1 Green Roofs for Healthy Cities 2009 Industry Survey – www.greenroofs.org

BCIT Centre for Architectural Ecology
REM-10 December 2010 2
2.2 Materials and Construction The walls and ceiling of REM-10 consist of Quad-Lock Insulated Concrete Forms with cast-in-place concrete, installed under the direction of Quad-Lock’s Douglas Bennion.
Construction:
• Walls – 210 mm wide (57mm EPS (Extruded Polystyrene Insulation), 96 mm concrete, 57 mm EPS)
• Roof deck – 393 mm depth (75 mm concrete, steel reinforcing, 318 mm EPS insulation) • Floor – 90 mm concrete slab on EPS insulation on vapour barrier
An access door is created at the back of the module to allow entry to the interior. A roof parapet protects the sides of the green roof system. The exterior walls are covered with metal siding. After the roofing and green roof systems and the instrumentation are installed, flashing and siding are installed on the remaining exposed area to complete the REM.
3 Quad-Lock REM Roof Assembly Installation and Instrumentation
3.1 Configuration The REM-10 SBS (modified bituminous) roofing assembly was supplied and installed by Soprema. The extensive green roof system consists of LiveRoof modular components supplied and installed by NATS Nursery, with the Microfab root barrier supplied by Soprema. The components of the roofing and green roof systems are summarized in Table 1. The configuration of the Reference Roof on the Green Roof Research Facility is described in Table 2.
3.2 Roofing System – Soprema Three thermocouples and two heat flux transducers were installed on the topside of the EPS roof deck insulation and covered with polyethylene film for protection. A concrete slab was placed over the insulation and additional thermocouples installed directly over the instrumentation below. An asphalt primer was sprayed on the surface of the concrete followed by the installation of the Soprema SBS base membrane. Additional thermocouples were installed on the surface of the base sheet. Strips of base sheet were adhered over the wires of the sensors to prevent their plastic sheathing from melting during the torching of the cap sheet. The SBS cap sheet was torch-applied over the base sheet to complete the roofing system and further thermocouples were installed.
A standard aluminium gutter was installed in the front compartment and the modified bituminous membrane was extended to the inside of the front compartment to ensure that the runoff from the roof would flow into the gutter.

BCIT Centre for Architectural Ecology
REM-10 December 2010 3
3.3 Green Roof System – LiveRoof supplied by NATS Nursery The plants (fescues, grasses, sedums and perennials) supplied by NATS Nursery arrived in pre-cultivated LiveRoof modular plastic trays and were installed on the REM. Three thermistors were secured on a plastic “tee” at specific depths – the bottom, middle and top of the growing medium just under the vegetation canopy – to measure the temperature profile in the growing medium.
Table 1 Configuration of the roofing and green roof systems of REM-10
Roof Structure: Quad-Lock Insulated Concrete Form: 318 mm EPS insulation 75 mm cast-in-place concrete
Roofing System: Spray asphalt primer Soprema Sopraflam base membrane Soprema Sopraply traffic cap-560
Green Roof System: Microfab root barrier LiveRoof modular system:
• 300 mm by 600 mm LiveRoof plastic tray modules c/w drainage channels
• 100 mm growing medium • Mixture of sedums and grasses with a few
additional perennials
Build-up Height: (Approximate)
Roofing system = 390 mm (15.5”) Green roof system = 110 mm (4.4”) Total build-up = 500 mm (19.7”)
Table 2 Configuration of the roofing system of the GRRF Reference Roof
GRRF Reference Roofing System:
Kraft laminate vapour barrier
ISO (113 mm/RSI 4.9, 4.5”/R28)
Rigid asphalt protection board (4 mm, 0.16”)
180-g polyester reinforced thermal fusible base sheet
250-g polyester reinforced SBS cap sheet

BCIT Centre for Architectural Ecology
REM-10 December 2010 4
3.4 Instrumentation
Each REM is instrumented to obtain data for the temperature profile, heat flow, and stormwater runoff analyses, as well as to obtain meteorological data and to condition the interior space of the REM.
The REM module is fully instrumented to measure the thermal performance and stormwater runoff retention efficiency of the green roof system.
Figure 1 Red crosses mark the instrumentation locations on the roof deck of a typical low-
sloped REM.
Thermal Instrumentation Thermocouples measure the temperature and provide a temperature profile across the roof. The thermocouples were embedded at seven layers within the roofing/green roof system of the REM as summarized in Table 3 and illustrated in Figure 2.
The thermocouples were installed in three locations on the REM roof (Locations #1, #2 and #3) to minimize spatial variability and increase reproducibility of the data (Figure 1). The sensors are embedded between components within the roof system at each measurement location.
In addition, two heat flux transducers were installed 25 mm (1”) apart at Location 2. They measure the heat flow between the outdoor environment and the interior of the REM, generating energy efficiency data.
152 mm
305
mm
305
mm
152 mm
25 mm
978 mm97
8 m
m
Location #1
Front
Back
Location #2
Location #3
2% slope
1956 mm
1956
mm
(77.0”)
(6.0”)
(6.0”)
(12.
0”)
(12.
0”)
(77.
0”)(1”)
(38.5”)(3
8.5”
)

BCIT Centre for Architectural Ecology
REM-10 December 2010 5
Table 3 Thermal instrumentation within the roofing and green roof systems of REM-10
Instrumentation position within the roof Label
On the surface of the growing medium, under the plant canopy GMT
At mid-depth of the growing medium (75 mm, 3” from the bottom) GMM
At the bottom of the growing medium (150 mm, 6”) GMB
On top the roof membrane base sheet, under the cap sheet MEM
On top of the concrete, under the roof membrane base sheet CON
On top of the insulation, under the concrete INS
Under the ceiling in the interior of the REM INT
Figure 2 Thermal instrumentation within the roofing and green roof systems of REM-10.
LiveRoof Vegetation GMT
GMM
MEM CON Sopraply traffic cap-560
LifeRoof tray w/growing media (100 mm, 4”)
Quad-Lock concrete deck
Components Layer
Instrumentation
Heat Flux Transducer Thermocouple Heat Flux Transducer (Location #2 only)
Sopravap’r base membrane
Microfab Root Barrier GMB Sopradrain 10-G (10 mm, 0.4”)
Quad-Lock insulation
INT
INS

BCIT Centre for Architectural Ecology
REM-10 December 2010 6
3.4.1 Temperature Profile
Summary A network of thermocouples (Omega type PP-T-SLE Special Limit of Error ±0.5°C or 0.4%) is installed at different layers within the roofing and green roof systems to monitor the temperature across the roof. There are seven thermocouples embedded in the roof at each measurement location. The thermocouples are connected to National Instruments Fieldpoint thermocouple modules in the REM and the data are logged by the data acquisition computer system located in the Green Roof Research Facility.
First Reporting Period The REM was fully instrumented during construction of the REM for measuring temperature. The data acquisition system was set up in June 2008 and debugged in fall 2008. The network of thermocouples in the REM captured the temperature profile across the roof as designed. A program was written to compile the data, and development began on the database to facilitate storage and analysis of the large amount of data.
Final Report Update From January 1 to December 31, 2009, over 2,000,000 temperature measurements for the REM were collected. If an individual thermocouple recorded a data outage, the remaining two thermocouple locations provided the average used in the data analysis.
3.4.2 Heat Flow
Summary Two heat flux transducers (HFT) (Concept Engineering, Model F-005-4) are embedded in the top surface of the thermal insulation at each measurement location to measure the heat flow through the roof system. The HFTs measure the heat transfer (energy per unit area per unit time) between the building and the outdoor environment through the roof at any instant in time. They are calibrated such that a positive reading represents heat entering the building and a negative reading represents heat leaving the building. The heat flux can be integrated over time to calculate the amount of heat gain or loss through the roof during a specific time period.
The interior space of the REM is maintained at a constant temperature of 21 ±3°C, simulating the indoor temperature control of a building. The heat flux through the roof measured by the HFTs will therefore be used to estimate the energy demand for the REM due to the temperature variations of the outdoor environment.
First Reporting Period The REM was fully instrumented with heat flux transducers during construction of the REM for measuring heat flow. The heat flux transducers in the REM captured the heat flow across the roof as designed during the reporting period. A program was written to compile the data, and development began on the database to facilitate storage and analysis of the large amount of data.

BCIT Centre for Architectural Ecology
REM-10 December 2010 7
Final Report Update From January 1 to December 31, 2009, over 60,000,000 heat flux measurements for the REM were collected. Measurements of heat flux by the heat flux transducers were taken throughout the period.
3.4.3 Stormwater Runoff
Summary The REM is inclined towards the front such that the roof deck is sloped 2% for a flat roof. The rain water follows the roof slope and is collected by a standard aluminium gutter located in the front compartment of the REM. The gutter is again sloped at about 5% lengthwise such that the rain water runs into a vertical down-spout of about 1 m long at the lower end of the gutter. The water then passes through a U-shaped pipe and is measured by an electromagnetic flow meter in the up-arm of the U before it is discharged out of the REM.
The electromagnetic flow meter (Seametrics, Model EM100, 0.04–3.8L/min, +1%FS) was selected over other alternatives because it is capable of measuring volumetric flow over a large range at low pressure. As well, it has no moving parts, so it is not susceptible to grit and debris in the runoff. A screen trap is also placed at the down-spout entrance to allow easy clearing of debris and minimize accumulation of debris in the U-shaped pipe leading to the flow meter.
First Reporting Period A prototype of the custom-made electromagnetic flow meter from Seametrics was tested in the lab and in-situ on the REM over a two-week period. The meter was able to measure the runoff accurately at the design rain intensity range of 0.1–4.0 L/min under simulated rain conditions in the lab.
The stormwater instrumentation has been installed as designed. The stormwater runoff testing and commissioning occurred over this reporting period, becoming fully operational in November 2008, and data collection is ongoing. In order to accumulate a full year of data, reporting will continue until December 2009 to be included in the Final Report.
Final Report Update A total of 76 rain and stormwater events over 1 mm were captured from January 1 to December 31, 2009, with 40 of the rain and stormwater events over 12 mm. The stormwater runoff was measured as designed during the final year of data acquisition. Periodic maintenance was carried out to ensure the runoff system was clear of debris.
3.4.4 Meteorological Data
Summary A weather station (Campbell Scientific) is located on the rooftop of the Green Roof Research Facility (GRRF) about 5 m north from the REMs and 6 m above the ground. Meteorological data such as air temperature and relative humidity, rainfall, solar radiation, wind speed and direction are recorded at 1-minute intervals.
First Reporting Period The weather station instrumentation performed as designed.

BCIT Centre for Architectural Ecology
REM-10 December 2010 8
Final Report Update Both the original GRRF Weather Station and the REM rain gauge provided the rainfall and other meteorological data required for analysis.
3.4.5 Space Conditioning
Summary The interior space of the REM is designed to maintain a constant air temperature of 21 ±3°C to simulate the indoor temperature of a building. Summer cooling is provided by an individual heat exchanger and a solenoid valve in each REM. Figure 3 shows the schematics of the space conditioning design. The heat exchangers are connected in parallel with a heat pump. The heat pump cools a reservoir of water, which is pumped to a central cooling line connecting to all REMs in parallel. The REM’s solenoid valve opens just the right amount to allow the cold water to enter the heat exchanger and the circulating fan to cool the REM by blowing air over the cooling coils. The warmer water coming out from the heat exchanger is allowed to flow into a central return line, which directs the water back to the heat pump for cooling. The temperature of each REM can be controlled through the individual solenoid valve and heat exchanger.
The individual space heaters in the REMs are kept as auxiliary heaters should the outdoor temperature drop below freezing.
First Reporting Period The cooling system has been installed and commissioned as designed during this reporting period. Operational trials to fine tune the control of the temperature to within the range of the specifications were carried out and balancing continues. The electrical heaters are still in place for cold weather performance.
Final Report Update The atmospheric control system provided a stable temperature of 19 ±6°C from January 1 to December 31, with the exception of the hottest months of the summer (May – August) when the temperature was 25 ±6°C. During these hotter months, the temperature fluctuated slowly and followed the peaks and valleys of the day/night cycle. The electric heaters were retained for backup in freezing weather.
Figure 3 Schematics showing the temperature control of the REMs using a heat pump
operating in cooling mode – summer.
010203040506070809
10P
HeatPump
Heat exchangerLegend
Auxiliary heater (off)Solenoid valvePressure relieve valve
REM 10
BCIT Centre for Architectural Ecology
REM-10 December 2010 9
3.4.6 Data Acquisition System
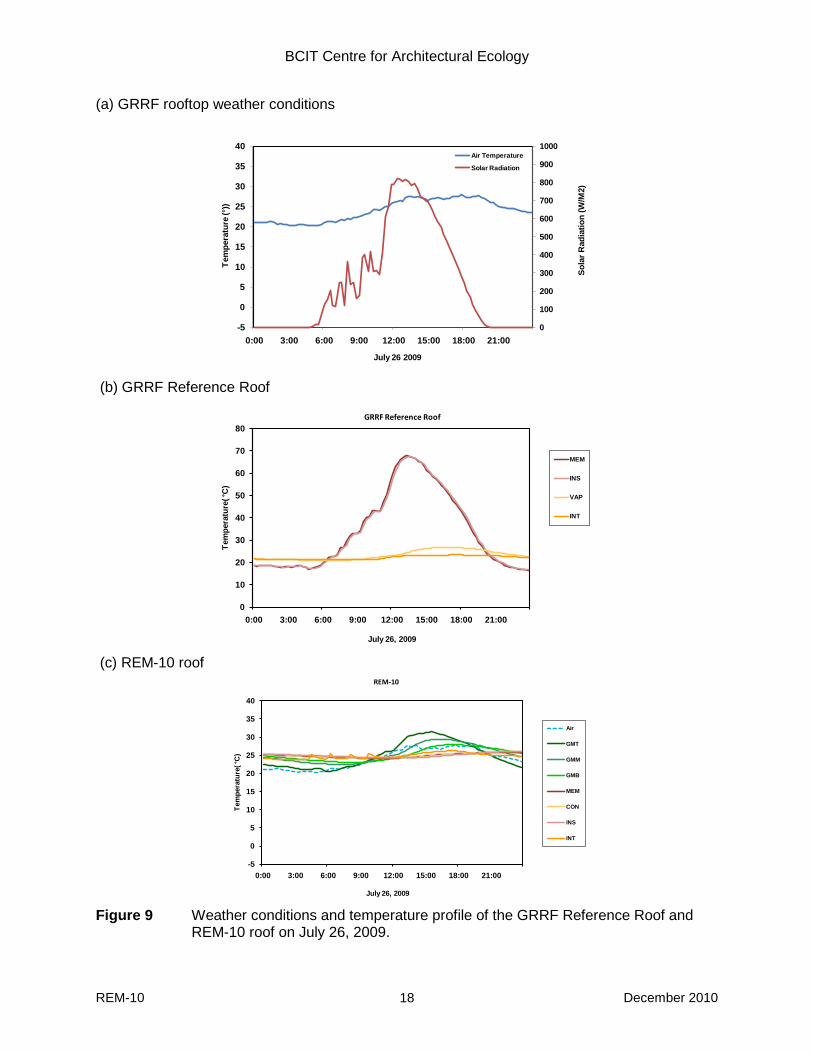
Summary The thermal performance from the thermocouples and heat flux transducers and the volumetric runoff data from the flow meters is measured at the REM and logged by the National Instruments Fieldpoint data acquisition system situated in the Green Roof Research Facility near the module. The raw data are collected at 1-minute intervals from the sensors and averaged over 15 minutes.
First Reporting Period The National Instruments Fieldpoint data acquisition system was set up and started collecting temperature and heat flow data for the REM in July 2008. Runoff measurements were added in November 2008. This system continued to collect thermal and runoff performance data from all sensors at 1-minute intervals.
The data from both data acquisition systems is stored and backed up in a dedicated computer at the Green Roof Research Facility.
Final Report Update The National Instruments Fieldpoint data acquisition system continued to collect temperature and heat flow data for the REM as designed. Runoff measurements that were added in November 2008 continued to perform as designed. The thermal performance and runoff data collected by the data acquisition system are stored and backed up in a dedicated computer at the Green Roof Research Facility.
Figure 4 The sensors of REM 10 are connected to the main data acquisition system unit
located in the Green Roof Research Facility.
Power
DAS
Green Roof Research Facility
REM 10
REMs

BCIT Centre for Architectural Ecology
REM-10 December 2010 10
3.5 Performance Analysis Method Each REM is monitored for three performance aspects: thermal performance, stormwater management and plant establishment. The objectives and data analysis method are described as follows.
3.5.1 Thermal Performance
Two aspects of thermal performance are reported:
Temperature Profile: The temperature profiles across the roofing and green roof systems of the REM are recorded to illustrate the thermal performance in different seasons. Individual days are selected for analysis of the temperature range of the various roof components and compared to the reference roof and the environmental conditions of outside air temperature and solar radiation. This performance is graphed over a 24-hour period to illustrate the temperature dynamic resulting from the change in solar radiation levels between day and night. The performance is characterized by the temperature range of roof components, including:
• Temperature maximum and minimum • Time lag after temperature maximum on the top of the green roof assembly following the
maximum period of solar radiation • Comparison between the temperature range of the green roof assembly roof membrane
and reference roof membrane
These results will illustrate to what extent the green roof assembly has reduced the temperature range of the roof membrane. Durability of the roof membrane material can be influenced by the degree to which it is subjected to temperature extremes over time.
Heat Flow: The heat flow between the outdoor and indoor environments through the roofing and green roof systems is reported for various time periods: single day events and seasonal thermal efficiencies.
Single day events: The heat flow data are examined on the same selected days as for the temperature profile and compared to the reference roof. A positive value indicates heat gain; a negative value, heat loss. The diurnal change in solar radiation between day and night results in heat gain during the day and heat loss at night. As well, heating the interior space to a standard indoor temperature will typically result in increased heat loss during the cooler months of the year.
Seasonal thermal efficiencies: For this report, the cumulative heat gain/heat loss is characterized over a longer period and used to compare performance in energy efficiency due to the green roof system. This is determined by summarizing the heat flow over time and converting the energy flow in W/m2 (watts/square metre) to MJ/m2 (Megajoules/square metre).
The extent to which other variables of roof scale, depth of growing medium, plant mix and other components of the green roof system, as well as differences in insulation levels, influence heat flow will be discussed. As this REM has a different thermal insulation level (RSI or R-value) in its roofing system from the reference roof (RSI 4.9 or R28), the energy consumption reduction due to the green roof system will not be a direct comparison between the heat flow measurements through the REM and the reference roof.

BCIT Centre for Architectural Ecology
REM-10 December 2010 11
3.5.2 Stormwater Management
The roof runoff is measured in real time during rain events to create hydrographs. By comparing the runoff hydrograph of a REM to that of the GRRF Reference Roof, the water retention capacity and characteristics of the green roof system can be illustrated. A rain event in December 2008 with a comparison to the GRRF Reference Roof is used to demonstrate the relationship.
The data analysis focuses on the delay in runoff, the reduction in peak flow and the water retention capacity of the green roof system, as these parameters are used by municipal engineers to design storm sewers for the urban areas.
3.5.3 Plant Establishment Monitoring
Plant establishment is documented via photo records over two years (section 4.4). Photos were taken when the plants were first planted (i.e., time zero), at the end of the first month, and at intervals to the end of the reporting period in December 2009. Photos have also been taken at unusual weather events such as snow and excessive drought. This has provided a simple, qualitative means to evaluate plant establishment and the viability and maintenance needs of the plant species used on the green roof system.
4 Results This section presents the results from data collected for weather conditions, thermal performance, stormwater retention, and plant establishment and monitoring.
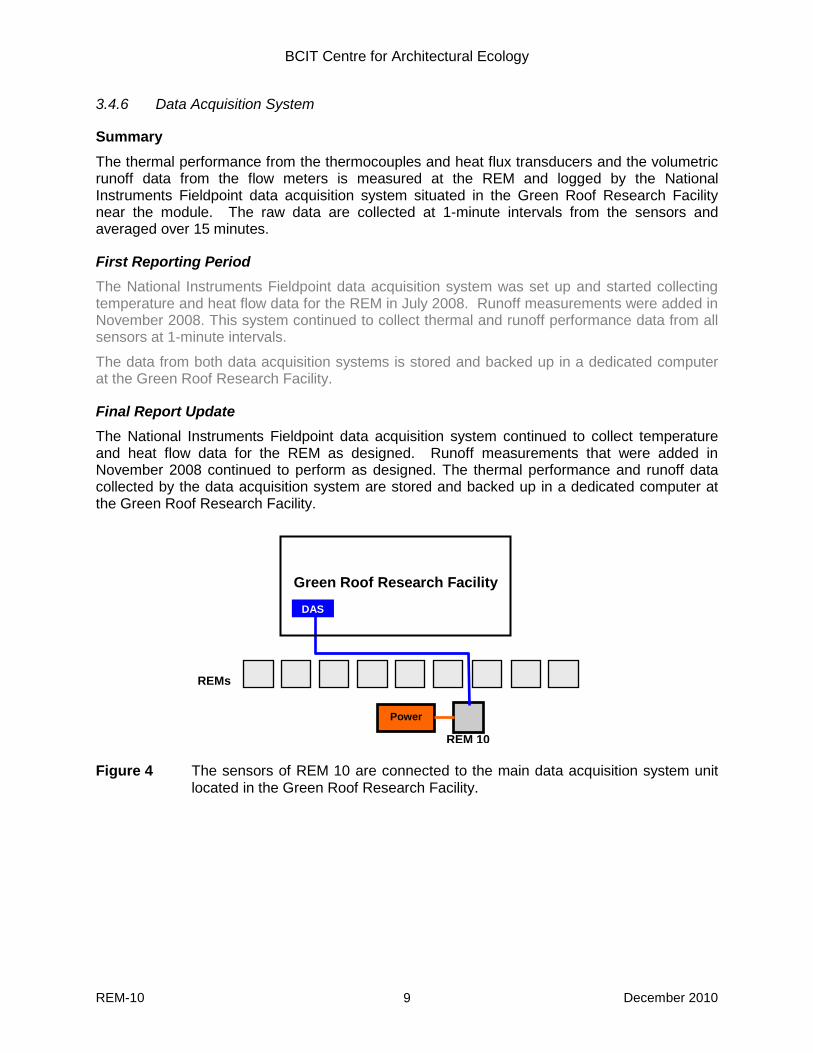
4.1 Climate Data This section provides a summary of the microclimate conditions (air temperature and rainfall) over the January to December 2009 reporting period (Table 4). These climate values are compared to 30-year Environment Canada climate normals for a similar location (Vancouver International Airport). Climate normals are defined as averages of climatological data computed for consecutive periods of 30 years, in this case 1971 − 2000. The nearest full climatological station is at the Vancouver International Airport (YVR), a relatively drier site located 9 km southwest of the research facility. The climate normal for this period at the YVR site is 1155.0 mm of precipitation annually. In comparison, the precipitation recorded at the Green Roof Research Facility (GRRF) weather station for this period is 1280.0 mm. The GRRF is an urban site situated 4 m above sea level and closer to the Coastal mountain range to the north, and is typically wetter and warmer than the YVR site as the precipitation totals indicate.
The winter wet season in Vancouver is characterized by cool temperatures and high precipitation levels, while the dry season is characterized by mild temperatures and low precipitation reaching near drought levels in July and August. The warmer temperatures and higher total rainfall recorded at the research facility compared to the airport reflect the difference in microclimate and location (Figures 5 and 6).
4.1.1 Weather Conditions for the 2009 reporting period
While following the general climatic trends for the region, the weather for 2009 was more extreme during certain periods. High levels of snowfall accumulated during the month of December, 2008 which resulted in a lingering snow pack that melted through the first weeks of

BCIT Centre for Architectural Ecology
REM-10 December 2010 12
January. There was a very dry period from June to early August with below average rainfall. Temperatures were several degrees warmer for the same period than the 30-year normal. More rainfall fell during the months of October and November than average. In summary, the dry season was hotter and drier and the wet season was wetter than average.
Table 4 2009 Climate Summary recorded at the BCIT GRRF weather station
RainfallMonth Daily Max.1
(°C )Daily Min.2
(°C )Daily Mean3
(°C )Total4 (mm)
Jan-09 5.0 1.0 3.0 80.7Feb-09 8.5 2.2 5.4 64.5Mar-09 8.0 2.3 5.2 148.9Apr-09 14.0 6.5 10.3 82.6May-09 18.1 9.9 14.0 84.2Jun-09 22.2 14.4 18.3 12.8Jul-09 25.9 16.9 21.4 17.7
Aug-09 22.5 15.5 19.0 36.3Sep-09 20.7 12.7 16.7 79.2Oct-09 13.6 7.9 10.8 183.9Nov-09 9.6 5.5 7.6 401.7Dec-09 5.8 0.6 3.2 88.1
1 The average of the daily maximum temperatures in degrees Celsius reached at the location for the month.
2 The average of the daily minimum temperatures in degrees Celsius reached at the location for the month.
4 Rainfall data taken from GRRF Rain gauge except for January (REM Rain Gauge)
3 The average of the daily mean temperatures (average of the daily maximum & minimum temperature) in °C reached at the location for the month.
Air Temperature Range2009 GRRF Climate Summary
BCIT Centre for Architectural Ecology
REM-10 December 2010 13
Figure 5 Precipitation at the BCIT Green Roof Research Facility from June to December
2009 compared to 30-year normals at the Vancouver International Airport.
Figure 6 Ambient air temperature at the BCIT Green Roof Research Facility from June to
December 2009 compared to 30-year normals at the Vancouver International Airport.
0
50
100
150
200
250
300
350
400
450
Rain
fall
(mm
)
Month
Environment Canada 30 Year Normals - YVR
GRRF Rainfall
0
5
10
15
20
25
Air
Tem
pera
ture
(°C)
Month
Environment Canada 30 Year Normals - YVR
GRRF Daily Mean Air Temperature

BCIT Centre for Architectural Ecology
REM-10 December 2010 14
4.2 Thermal Performance
4.2.1 Temperature and Heat Flow Profiles
This section examines the temperature profiles and heat flow data across the roof system on the REM and on the GRRF Reference Roof recorded on selected days in January, July and November, 2009. These dates are representative of their respective seasons. The locations of the temperature thermocouples embedded at different layers within the roof systems are shown in Figure 2 and described in Section 3. The heat flow data was collected from the two heat flow transducers and averaged.
Winter Performance – January 18, 2009
Climate Characteristics The winter climate in Vancouver in 2009 was characterized by low air temperatures and high precipitation, with very high precipitation in the peak rainfall month of November. The average daily temperature recorded at the GRRF rooftop weather station for January 2009 was 3.0°C and the total precipitation was 80.7 mm for the month (Table 4).
Temperature Profile across the Roof System Figure 7 shows the temperature profile of the REM and GRRF Reference Roof on January 18, 2009, a cloudy day. The selected day was cold: the total daily solar energy incident on the roof was 5.9 MJ/m2 with a peak 15-minute average solar radiation of 343.8 W/m2 at 12:30 PM (Figure 7a). There was no rainfall on this particular day which is characteristic of the intermittent January rainfall pattern. The outdoor air temperature reached a low of 0.03°C at 4:45 AM and a high of 7.7°C at 1:45 PM.
The roof membrane was coolest on the GRRF Reference Roof at -7.9°C at 11:45 PM in the evening (Table 5). The GRRF Reference Roof membrane temperature reached a maximum of 20.4°C at 1:15 PM. The range between the maximum and minimum GRRF Roof membrane temperatures was 28.3°C.
The REM-10 roof membrane temperature was more constant in comparison with the reference roof, with temperatures between a low of 6.3°C and a high of 6.8°C over the 24-hour period, for a total range of 0.5°C. This indicates that the REM-10 green roof was able to reduce the heat entering the REM module and keep the roof membrane warmer with less fluctuation than the conventional roof membrane during this cold and cloudy winter period. Table 5 Temperature Statistics for REM-10 and GRRF Reference Roof on Jan. 18, 2009
REM-10
Max °T 5.59 4.88 5.35 6.83 20.37Time 13:45 16:00 17:00 21:00 13:15
Lag-GMT1 2:15 1:00 7:15Min °T 0.77 3.27 4.12 6.31 -7.89
Time 23:45 23:45 11:15 12:15 23:45Lag-GMT1 0:00 -13:30 -12:30
Range2 4.82 1.61 1.23 0.51 28.261 Time lag after temperature recorded on GMT (Growing Medium Top)
Temperature Sensor Location18-Jan-09 GMT
Growing Media Top
GMM Growing Media
Middle
GMB Growing Media
Bottom
MEM REM Roof
Membrane
REF Reference Roof
Membrane
2 Range between maximum and minimum °T

BCIT Centre for Architectural Ecology
REM-10 December 2010 15
(a) GRRF rooftop weather conditions
(b) GRRF Reference Roof
(c) REM-10 roof
Figure 7 Weather conditions and temperature profile of the GRRF Reference Roof and
REM-10 roof on January 18, 2009.
0
100
200
300
400
500
-5
0
5
10
15
20
25
30
0 0.125 0.25 0.375 0.5 0.625 0.75 0.875
Sola
r Rad
iatio
n (W
/M2)
Tem
pera
ture
(°))
January 18, 2009
Air Temperature
Solar Radiation
-5
0
5
10
15
20
25
30
0:00 3:00 6:00 9:00 12:00 15:00 18:00 21:00
Tem
pera
ture
( °C
)
January 18, 2009
GRRF Reference Roof
MEM
INS
VAP
INT
-5
0
5
10
15
20
25
30
0:00 3:00 6:00 9:00 12:00 15:00 18:00 21:00
Tem
pera
ture
( °C
)
January 18, 2008
REM-10
Air
GMT
GMM
GMB
MEM
CON
INS
INT

BCIT Centre for Architectural Ecology
REM-10 December 2010 16
Heat Flow through the Roof System – January 18, 2009 Figure 8 shows the heat flow through the REM-10 and GRRF Reference Roof sections measured by the two heat flux transducers (HFT) on January 18, 2009, a cloudy and cold day. Solar radiation had a strong influence on the heat flow through the roof system during this winter period.
Figure 8a shows that thermal energy entered the GRRF Reference Roof system at around 10:00 AM and peaked at about 6.0 W/m2 at 1:00 PM, resulting in positive levels of heat gain on the reference roof for this period. The heat flow reversed direction again when the solar radiation decreased, reaching a peak heat loss level of -10.3 W/m2 at 3:45 PM.
The heat flow through the REM-10 green roof was significantly lower and more uniform over the day (Figure 8b). The heat flow through REM-10 was -2.1 watts/m2 on average, indicating a consistent low level of heat loss.
(a) GRRF Reference Roof
(b) REM-10
Figure 8 Heat flow through the roof sections of the GRRF Reference Roof and REM-10
roof on January 18, 2009.
-10
-5
0
5
10
15
20
0:00 3:00 6:00 9:00 12:00 15:00 18:00 21:00
Hea
t Flu
x (W
/m2)
Time
GRRF Reference Roof
Heat Flux
-10
-5
0
5
10
15
20
0:00 3:00 6:00 9:00 12:00 15:00 18:00 21:00
Hea
t Flu
x (W
/m2)
Time
REM-10 Heat Flux

BCIT Centre for Architectural Ecology
REM-10 December 2010 17
Summer Performance – July 26, 2009
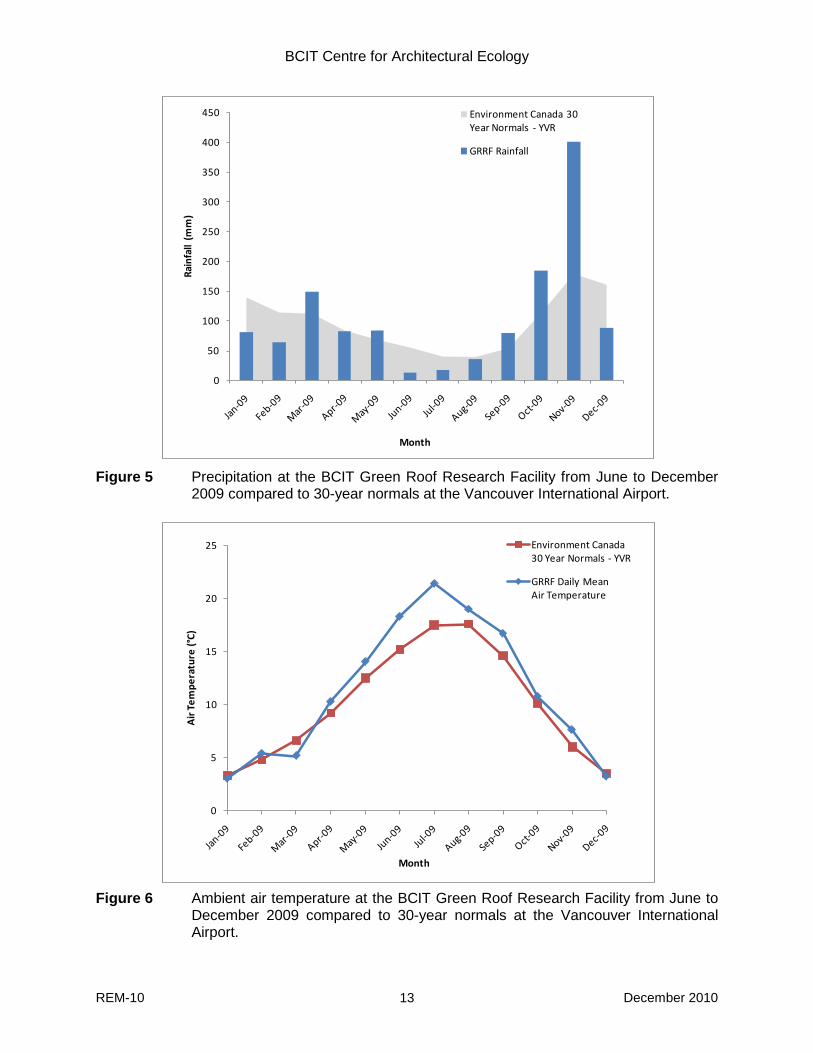
Climate Characteristics The summer climate in Vancouver in 2009 was characterized by high air temperatures and low precipitation. The average daily temperature for July 2009 recorded at the GRRF rooftop weather station was 21.4°C and the total precipitation was 17.7 mm for the month (Table 4).
Temperature Profile across the Roof System Figure 9 shows the temperature profile of the REM and GRRF Reference Roof on July 26, 2009, a clear day. The selected day was hot and sunny: the total daily solar energy incident on the roof was 21.3 MJ/m2, with a peak 15-minute average solar radiation of 825 W/m2 at 12:15 PM (Figure 9a). There was no rainfall on this particular day and little rain fell over the previous weeks as is characteristic of this summer drought period which extends into September. The outdoor air temperature reached a low of 20.3°C at 5:00 AM and a high of 28.3°C at 12:15 PM. For the GRRF Reference Roof, the roof membrane was coolest at 16.4°C at 11:45 in the morning (Table 6). The GRRF Reference Roof membrane temperature reached a maximum of 67.84°C at 1:15 PM, peaking after the highest solar energy incident at 12:15 PM. In summary, the range between the maximum and minimum GRRF Roof membrane temperatures was 51.4°C. The REM-10 roof membrane temperature was more constant in comparison with the reference roof, with temperatures between a low of 24.14°C and a high of 25.94°C over the 24-hour period, for a total range of 1.80°C. This indicates that the REM-10 green roof was able to reduce the heat entering the REM module and keep the roof membrane cooler with less fluctuation than the conventional roof system during this hot and dry summer period. Table 6 Temperature Statistics of REM-10 and GRRF Reference Roof on July 26, 2009
REM-10
Max °T 31.54 29.39 27.93 25.94 67.84Time 15:30 16:30 17:15 22:30 13:15
Lag-GMT1 1:00 1:45 7:00Min °T 20.50 22.39 23.04 24.14 16.40
Time 6:00 6:30 8:15 11:15 23:45Lag-GMT1 0:30 1:45 3:00
Range2 11.04 7.00 4.88 1.80 51.441 Time lag after temperature recorded on GMT (Growing Medium Top)2 Range between maximum and minimum °T
Temperature Sensor Location26-Jul-09 GMT
Growing Media Top
GMM Growing
Media Middle
GMB Growing
Media Bottom
MEM REM Roof
Membrane
REF Reference Roof
Membrane
BCIT Centre for Architectural Ecology
REM-10 December 2010 18
(a) GRRF rooftop weather conditions
(b) GRRF Reference Roof
(c) REM-10 roof
Figure 9 Weather conditions and temperature profile of the GRRF Reference Roof and
REM-10 roof on July 26, 2009.
0
100
200
300
400
500
600
700
800
900
1000
-5
0
5
10
15
20
25
30
35
40
0:00 3:00 6:00 9:00 12:00 15:00 18:00 21:00
Sola
r Rad
iatio
n (W
/M2)
Tem
pera
ture
(°))
July 26 2009
Air Temperature
Solar Radiation
0
10
20
30
40
50
60
70
80
0:00 3:00 6:00 9:00 12:00 15:00 18:00 21:00
Tem
pera
ture
( °C
)
July 26, 2009
GRRF Reference Roof
MEM
INS
VAP
INT
-5
0
5
10
15
20
25
30
35
40
0:00 3:00 6:00 9:00 12:00 15:00 18:00 21:00
Tem
pera
ture
( °C
)
July 26, 2009
REM-10
Air
GMT
GMM
GMB
MEM
CON
INS
INT

BCIT Centre for Architectural Ecology
REM-10 December 2010 19
Heat Flow through the Roof System – July 26, 2009 Figure 10 shows the heat flow through the REM-10 and GRRF Reference Roof sections measured by the two heat flux transducers (HFT) on July 26, 2009, a sunny day. Solar radiation had a strong influence on the heat flow through the roof system during this late summer period. Figure 8a shows that thermal energy entered the GRRF Reference Roof system at around 2:45 AM and peaked at about 25.1 W/m2 at 12:00 noon. The heat flow reversed direction again when the solar radiation decreased.
The heat flow through the REM-10 green roof was significantly lower and more uniform over the day (Figure 10b). The heat flow through REM-10 was close to zero, indicating it was highly effective in reducing heat flow between the REM module and its environment in this period.
(a) GRRF Reference Roof
(b) REM-10
Figure 10 Heat flow through the roof sections of the GRRF Reference Roof and REM-10
roof on July 26, 2009.
-10
-5
0
5
10
15
20
25
30
0:00 3:00 6:00 9:00 12:00 15:00 18:00 21:00
Hea
t Flu
x (W
/m2)
Time
GRRF Reference Roof
Heat Flux
-10
-5
0
5
10
15
20
25
30
0:00 3:00 6:00 9:00 12:00 15:00 18:00 21:00
Hea
t Flu
x (W
/m2)
Time
REM-10 Heat Flux

BCIT Centre for Architectural Ecology
REM-10 December 2010 20
Late Fall Performance – November 8, 2009
Climate Characteristics The late fall climate in Vancouver in 2009 was characterized by cool temperatures and very high precipitation levels. November, in particular, had high rainfall levels and heavy cloud cover. The average daily air temperature recorded at the GRRF rooftop weather station for November was 7.6°C and the total precipitation for the month was 401.7 mm (Table 4).
Temperature Profile across the Roof System Figure 11 shows the temperature profile of the REM and the reference roof sections on November 8, 2009. The selected day was cloudy with cool temperatures and light rainfall. The total daily solar energy incident on the roof was 2.3 MJ/m2, with a peak 15-minute average solar radiation of 142.8 W/m2 at 1:15 PM (Figure 11a). One rainfall event of 2 hr 45 min duration was recorded over the 24-hour period. The outdoor temperature ranged from a low of 6.1°C at 2:00 AM to a high of 9.1°C at 11:45 PM. The temperature ranges of the growing medium and roof membrane for the REM green roof and the reference roof are indicated in the table below. The GRRF Reference Roof membrane was coldest at 2.5°C at 12:45 AM and reached a peak temperature of 11.2°C at 1:30 PM. The range between the maximum and minimum GRRF Reference Roof membrane temperatures was 8.7°C. The roof membrane temperature of the REM-10 green roof was relatively constant with a total range of 0.44°C over the 24-hour period. The temperature range of the three depths of growing medium ranged between 0.86°C for the GMB (Growing Medium Bottom) position and 2.38°C for the GMT (Growing Medium Top) position. Table 7 Temperature statistics of REM-10 and GRRF Reference Roof
on November 8, 2009
REM-10
Max °T 8.35 8.23 8.41 9.26 11.23Time 13:30 16:30 19:30 - 0:00 13:30
Lag-GMT1 3:00 3:00 -13:30Min °T 5.97 7.07 7.55 8.83 2.48
Time 0:30 4:45 9:15 11:15 0:45Lag-GMT1 4:15 4:30 2:00
Range2 2.38 1.16 0.86 0.44 8.751 Time lag after temperature recorded on GMT (Growing Medium Top)2 Range between maximum and minimum °T
Temperature Sensor Location08-Nov-09 GMT
Growing Media Top
GMM Growing
Media Middle
GMB Growing
Media Bottom
MEM REM Roof
Membrane
REF Reference
Roof

BCIT Centre for Architectural Ecology
REM-10 December 2010 21
(a) GRRF rooftop weather conditions
(b) GRRF Reference Roof
(c) REM-10 roof
Figure 11 Weather conditions and temperature profile of the GRRF Reference Roof and REM-10 roof on November 8, 2009.
0
100
200
300
400
500
0
5
10
15
20
0 0.125 0.25 0.375 0.5 0.625 0.75 0.875
Sola
r Rad
iatio
n (W
/M2)
Tem
pera
ture
(°))
November 8, 2009
Air Temperature
Solar Radiation
0
2
4
6
8
10
12
14
16
18
20
0:00 3:00 6:00 9:00 12:00 15:00 18:00 21:00
Tem
pera
ture
( °C
)
November 8, 2009
GRRF Reference Roof
MEM
INS
VAP
INT
0
2
4
6
8
10
12
14
16
18
20
0:00 3:00 6:00 9:00 12:00 15:00 18:00 21:00
Tem
pera
ture
( °C
)
November 8, 2009
REM-10
Air
GMT
GMM
GMB
MEM
CON
INS
INT

BCIT Centre for Architectural Ecology
REM-10 December 2010 22
Heat Flow through the Roof System – November 8, 2009 Figure 12 shows the heat flow through the two roof sections measured by the heat flux transducers (HFT) on November 8, 2009. Since the indoor temperature of the REM was higher (17.0°C average) than the outdoor air temperature (6.1°C to 9.1°C), the REM lost heat through parts of its building envelope, such as the roof, walls and door. The HFTs embedded in the roof system measure the heat transfer between the building and its environment through the roof; a negative value indicates heat loss and a positive value indicates heat gain. The figure below shows that the GRRF Reference Roof lost heat for the majority of the day. During the day it absorbed the solar energy, and the heat gain reached a maximum of 1.1 W/m2 at 10:00 AM. The heat loss reached a minimum loss value of -5.1 W/m2 in the late afternoon. The REM-10 roof lost heat at a relatively constant rate between -.96 and -1.15 W/m2 throughout the day with little heat gain. (a) GRRF Reference Roof
(b) REM-10
Figure 12 Heat flow through the roof sections of the GRRF Reference Roof and
REM-10 roof on November 8, 2009.
-10
-5
0
5
10
15
20
0:00 3:00 6:00 9:00 12:00 15:00 18:00 21:00
Hea
t Flu
x (W
/m2)
Time
GRRF Reference Roof
Heat Flux
-10
-5
0
5
10
15
20
0:00 3:00 6:00 9:00 12:00 15:00 18:00 21:00
Hea
t Flu
x (W
/m2)
Time
REM-10
Heat Flux

BCIT Centre for Architectural Ecology
REM-10 December 2010 23
4.2.2 Energy Efficiency – Seasonal Average Daily Heat Flow The daily heat flow through each roof section is obtained by calculating the area above or below the heat flux curve over a 24-hour period in kWh/m2/day. Heat gain is represented by the positive area (above the x-axis). Heat loss is represented by the negative area (below the x-axis). The daily heat flow data were averaged over periods of one month and, further, over six-month heating and cooling seasons. The monthly results for the REM are compared to the GRRF Reference Roof for 2009 in Figure 13 and the seasonal results are compared in Figure 14. The cooling season extends from April to the end of September; the heating season, from January to March and October to December.
Cooling Season Performance (April, May, June, July, August, September) The GRRF Reference Roof recorded an average daily heat loss of 0.057 kWh/m2/day and an average daily heat gain of 0.072 kWh/m2/day over the twelve-month period. The average daily heat loss in the REM was reduced by 77% to 0.013 kWh/m2/day, compared to the reference roof, and the average daily heat gain was reduced by 98% to 0.002 kWh/m2/day, compared to the Reference Roof, for the same period. This indicates that the green roof assembly in the REM was able to reduce the energy demand for heating and cooling in comparison with the reference roof, with the highest benefit in reducing heat gain. The thermal insulation value of the vegetation and thermal mass effect of the growing medium in the green roof assembly contributed to this result.
Heating Season Performance (January, February, March, October, November, December) Over the colder heating season the GRRF Reference Roof recorded an average daily heat loss of 0.078kWh/m2/day and a low average daily heat gain of 0.015 kWh/m2/day. The average daily heat loss in the REM was reduced by 50% to 0.039 kWh/m2/day, compared to the reference roof, and the average daily heat gain was reduced to 0.000 kWh/m2/day compared to the reference roof, for the same period. This indicates that the green roof assembly in the REM was able to significantly reduce the energy demand for heating during these cooler months in comparison with the reference roof. Heat gain was negligible in both the reference and REM roofs during this period. Figure 14 compares the heat gain/loss through the roof sections by seasons. It demonstrates that the REM-10 green roof was effective in reducing heat flow through the roof all year, and the effectiveness for reducing heat gain was higher in the summer compared to the fall. Greater reduction in heat loss was achieved in the REM green roof assembly in the summer period than during the fall season. This may be a result of drier conditions during the summer compared to the rainy fall. Wetted growing medium may contribute to greater heat loss for those periods with higher rainfall. However, both periods represented significant improvements over the reference roof.

BCIT Centre for Architectural Ecology
REM-10 December 2010 24
a) GRRF Reference Roof
b) REM-10
Figure 13 Average Daily Heat Flow through the Reference Roof and REM-10 Roof
by month in 2009.
-0.100
-0.080
-0.060
-0.040
-0.020
0.000
0.020
0.040
0.060
0.080
0.100
Jan Feb Mar Apr May Jun Jul Aug Sep Oct Nov Dec
Heat
Flo
w (k
Wh/
m2/
day)
Heat Gain
Heat Loss
-0.100
-0.080
-0.060
-0.040
-0.020
0.000
0.020
0.040
0.060
0.080
0.100
Jan Feb Mar Apr May Jun Jul Aug Sep Oct Nov Dec
Heat
Flo
w (k
Wh/
m2/
day)
REM-10Heat GainHeat Loss

BCIT Centre for Architectural Ecology
REM-10 December 2010 25
a) GRRF Reference Roof
b) REM-10
Figure 14 Average Daily Heat Flow through the Reference Roof and REM-10 Roof
by season in 2009.
-0.100
-0.080
-0.060
-0.040
-0.020
0.000
0.020
0.040
0.060
0.080
0.100
Cooling Season Heating Season
Heat
Flo
w (k
Wh/
m2/
day)
Heat Gain
Heat Loss
-0.100
-0.080
-0.060
-0.040
-0.020
0.000
0.020
0.040
0.060
0.080
0.100
Cooling Season Heating Season
Heat
Flo
w (k
Wh/
m2/
day)
REM-10Heat GainHeat Loss

BCIT Centre for Architectural Ecology
REM-10 December 2010 26
4.3 Stormwater Retention In this section, stormwater runoff retention and delay of runoff from the green roof is discussed. This 2009 reporting period encompasses a wet season from January to mid-April, a dry season from mid-April to mid-September, and the start of the fall/winter wet season from mid-September onwards. Rainfall was measured by a rain gauge located on the Green Roof Research Facility (GRRF) weather station throughout the observation period and from an additional rain gauge (REM rain gauge) located 450 mm above the roof-plane of a centrally located REM adjacent to REM-10. The data were collected every minute and tabulated at 15-minute intervals for analysis and clarity of plots. The GRRF weather station received 1280 mm of rainfall during 2009. Most of the precipitation was in the form of rain. Note that the rain gauge was not equipped to measure snowfall in real time, so the precipitation was recorded when the snow had melted. This only affected periods in early January 2009. In this final report, rain events in March (Wet season), September (Dry season) and November (Wet season) are examined in detail. Seasonal and annual averages are presented. The rain event from December 2008 (from Progress Report #1) is included to provide a comparison to the GRRF Reference Roof. Stormwater reference data was not available for 2009. In order to analyse the green roof behaviour during a rain event, a definition for an event has been defined based on isolation of the event from other rainfall. This is required in order to investigate runoff and delay. Therefore: • Event is herein defined as a discrete period of precipitation separated in time from other
recorded precipitation by at least 6 hours before the start of the event and by at least 6 hours after.
• Runoff is defined as the amount of runoff from the start of the rain event until 6 hours after the end of the rainfall.
• Peak flow is the highest level flow of recorded rainfall intensity or roof runoff (mm/15 min) throughout the rain event.
• Delay in start of runoff is the time difference between the start of recorded rainfall and the start of runoff from the green roof.
• Peak flow delay is the time difference between the peak flow of rainfall and the peak flow of runoff from the green roof.

BCIT Centre for Architectural Ecology
REM-10 December 2010 27
4.3.1 Late Fall Rainfall Event (Wet Season) – December 12, 2008 (from Progress Report #1)
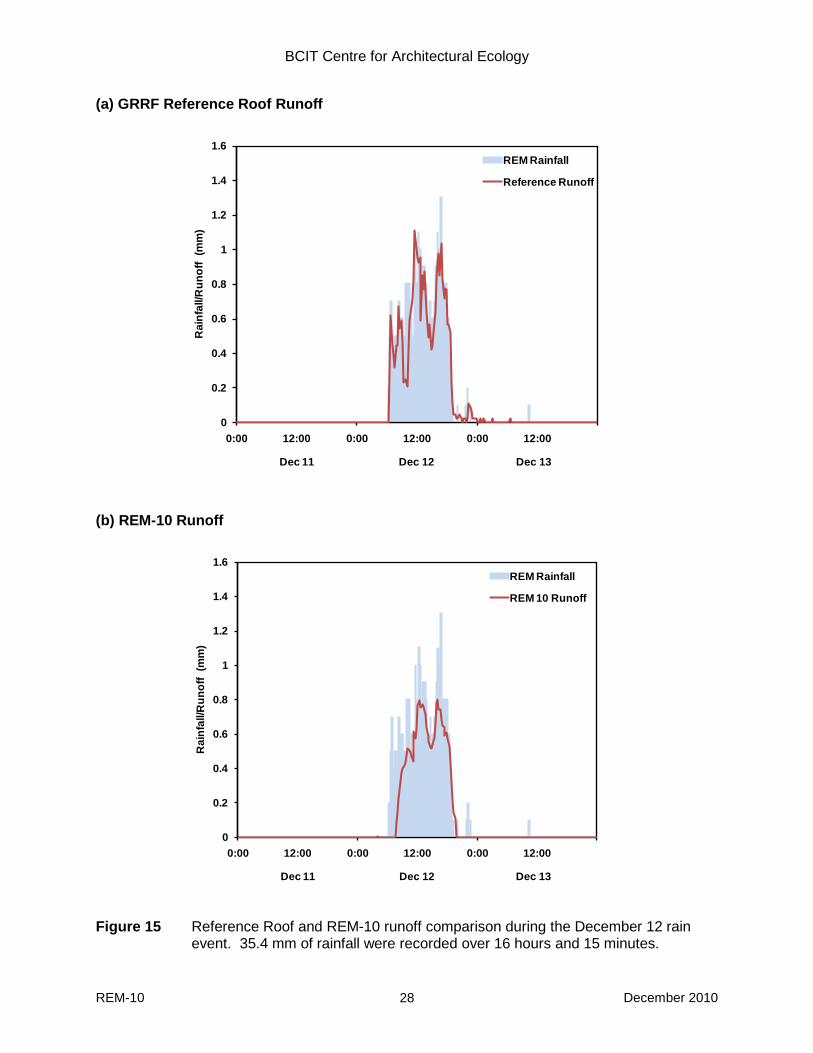
The rainfall event to be examined occurred between 6:15 AM and 10:30 PM on December 12, 2008. This period fits the definition of a distinct rain event as outlined in the previous section. This time period is characteristic of the heavy rainfall found in the late fall wet season which peaks in November. There are long periods of rainfall with little interruption between rainfall events. Heavy cloud cover and cool temperatures are typical. During this rainfall event the ambient air temperature ranged between 1.3°C and 5.1°C. In the six days that preceded this event, there were two other rainfall events of significant amount and duration. In total the REM rain gauge received 98.5 mm of rainfall between the dates of December 6 and December 12. Runoff amounts and durations for these events are found in Table 8 and illustrated in Figure 15 Figure 15b illustrates the rainfall event on December 12, when 35.4 mm of rainfall were recorded over the 16 hr 15 min event duration. This rainfall event was continuous with one peak, after which the rainfall tapered off. REM-10 retained 28% of rainfall and delayed the start of runoff by 1 hr 30 min relative to the start of rain during this period. Runoff from REM-10 ceased 3 hours before the rainfall stopped. The rainfall peak flow was 0.9 mm/15 min at 6 hr 45 min after the start of the event. The REM-10 runoff peak flow was 0.8 mm/15 min and occurred 30 minutes after the peak rainfall. In comparison, the runoff from the reference roof began 15 minutes after the start of rainfall. The rate of runoff was higher compared to the runoff from REM-10 (Figures 15a and 16a), with a runoff retention of 9% for the December 12 event. Table 8 REM-10 Runoff Statistics for December 6 − 12, 2008
6/7-12-2008 24hr 15min 22.2 10.0 55% 4:00 0:30 9%8/10-Dec-08 41hr 45min 27.5 26.3 57% 13:00 -00:15 4%
12-Dec-08 16hr 15min 35.4 32.3 28% 1:30 3:00 9%
1 Time delay betw een the f irst tip of the tipping bucket rain gauge and the f irst measured runoff
Date Duration Rainfall (mm)
Total REM 10 Run-off
(mm)
% Retained
Delay in Start1
Delay in Peak2
Reference Roof
% Retained
2 Time delay betw een the maximum recorded rainfall in a 15 min. interval and the maximum recorded runoff in a 15 min. interval
BCIT Centre for Architectural Ecology
REM-10 December 2010 28
(a) GRRF Reference Roof Runoff
(b) REM-10 Runoff
Figure 15 Reference Roof and REM-10 runoff comparison during the December 12 rain
event. 35.4 mm of rainfall were recorded over 16 hours and 15 minutes.
0
0.2
0.4
0.6
0.8
1
1.2
1.4
1.6
0:00 12:00 0:00 12:00 0:00 12:00
Rai
nfal
l/Run
off
(mm
)
REM Rainfall
Reference Runoff
Dec 11 Dec 12 Dec 13
0
0.2
0.4
0.6
0.8
1
1.2
1.4
1.6
0:00 12:00 0:00 12:00 0:00 12:00
Rai
nfal
l/Run
off
(mm
)
REM Rainfall
REM 10 Runoff
Dec 11 Dec 12 Dec 13

BCIT Centre for Architectural Ecology
REM-10 December 2010 29
(a) Reference Roof Runoff
(b) REM-10 Runoff Events
Figure 16 Rain events in the days prior to the December 12 rain event.
0
0.2
0.4
0.6
0.8
1
1.2
1.4
1.6
0:00 0:00 0:00 0:00 0:00 0:00 0:00 0:00
Rai
nfal
l/Run
off
(mm
)
REM RainfallReference Runoff
Dec 6 Dec 7 Dec 8 Dec 9 Dec 10 Dec 11 Dec 12 Dec 13
0
0.2
0.4
0.6
0.8
1
1.2
1.4
1.6
0:00 0:00 0:00 0:00 0:00 0:00 0:00 0:00
Rai
nfal
l/Run
off
(mm
)
REM Rainfall
REM 10 Runoff
Dec 6 Dec 7 Dec 8 Dec 9 Dec 10 Dec 11 Dec 12 Dec 13

BCIT Centre for Architectural Ecology
REM-10 December 2010 30
4.3.1 Spring Rainfall Event (Wet Season) – March 17 − 20, 2009
The rainfall event to be examined occurred between March 17 and March 20 (Table 9). There was a period of light rainfall from March 17−18; followed by intermittent heavy rainfall through to March 20 ending at 9:00 AM. This was followed by a period greater than six hours with no rainfall. Therefore, this period can be defined as a rainfall event as described above. Precipitation patterns in March typically include long periods of rainfall and intermittent breaks with no rainfall but heavy cloud cover and low temperatures. Rainfall levels in March 2009 were higher than the 30-year climate normal. This rainfall event was of long duration with several breaks during the event where no rain fell. However, rainfall continued after an interval of several hours. Figure 17 illustrates the rainfall event of 58 hr 0 min duration with 53.0 mm of rainfall beginning late in the evening on March 17. In the five days prior to this date, the REM rain gauge at the site received 49.6 mm of rainfall as three successive rain events occurred. The runoff in the days prior to March 17−20 is illustrated in Figure 18. There is no reference roof runoff for this event period. This event began at 11:15 in the late evening on March 17 and continued intermittently until 9:00 in the morning of March 20. During the event the ambient air temperature ranged between 4.2°C and 8.2°C. REM-10 retained 40% of rainfall and the rainfall peak flow was 0.3 mm/15 min at 53 hr 30 min after the start of the event. A small amount of runoff from REM-10 began 9 hr 0 min before the onset of rainfall, with a higher amount of runoff beginning 20 hr 0 min later. There were three separate rain events in the five days leading up to this event (Figure 18). Table 9 REM-10 Runoff Statistics
March 13-14, 2009 21:30 27.7 9.4 66% 2:00 0:30March 14-15, 2009 20:15 15.3 4.0 60% 8:30 1:00March 16-17, 2009 25:45 6.6 0.1 98% 20:30 20:45March 17-20, 2009 58:00 53.0 31.7 40% -9:00 -3:451 Time delay betw een the f irst tip of the tipping bucket rain gauge and the f irst measured runoff
2 Time delay betw een the maximum recorded rainfall in a 15 min. interval and the maximum recorded runoff in a 15 min. interval
Date Duration Rainfall (mm)
Total REM 10 Run-off
(mm)
% Retained
Delay in Start1
Delay in Peak2

BCIT Centre for Architectural Ecology
REM-10 December 2010 31
REM-10 Runoff
Figure 17 Rainfall and REM-10 runoff comparison during the March 17−20 rain event. REM-10 Runoff Events
Figure 18 Rain events in the days prior to the March 17−20 rain event.
0
0.2
0.4
0.6
0.8
1
1.2
1.4
1.6
1.8
2
0:00 0:00 0:00 0:00
Rai
nfal
l/Run
off
(mm
)
REM Rainfall
REM 10 Runoff
Mar 17 Mar 18 Mar 19 Mar 20
0
0.5
1
1.5
2
2.5
0:00 0:00 0:00 0:00 0:00 0:00 0:00 0:00
Rai
nfal
l/Run
off
(mm
)
REM Rainfall
REM 10 Runoff
Mar 13 Mar 14 Mar 15 Mar 16 Mar 17 Mar 18 Mar 19 Mar 20

BCIT Centre for Architectural Ecology
REM-10 December 2010 32
4.3.3 Summer Rainfall Event (Dry Season) – September 9, 2009
The rainfall event on September 9, 2009 occurred between 1:45 AM and 12:45 PM. There was a period greater than six hours with no rainfall both preceding and following this time period. Therefore, this period can be defined as a rainfall event. This time period is characteristic of the intermittent precipitation found in the shoulder season at the end of the summer drought period, which is most intense during July and August. Typically, there are periods of rainfall followed by dry periods with intermittent clear skies and cloud cover and warm temperatures. In the seven days that preceded this event, there were several other rainfall events of lesser amount and duration. In total the REM rain gauge received 33.1 mm of rainfall during this period. These events were not enough to cause significant runoff (>1 mm) in the REM unit until the last rain event on September 9 (Table 10 and Figure 20). Figure 19 illustrates the rainfall event beginning in the early hours on September 9 when 17.5 mm of rainfall were recorded over the 11 hr 00 min duration of the event. This rainfall event was of continuous duration but with two periods of high intensity during the event, creating two separate peaks. During the event the ambient air temperature ranged between 11.9°C and 15.1°C. REM-10 retained 88.9% of rainfall and delayed the start of runoff by 6:00 hr relative to the start of rain. Runoff from REM-10 ended when the rain stopped. The rainfall peak flow was 2.3 mm/15 min at 4 hr 30 min after the start of the event. The REM-10 peak runoff was 0.5 mm/15 min and occurred 4 hr 0 min after the peak rainfall. Table 10 REM-10 Runoff Statistics
September 5, 2009 13:15 2.8 0.0 100.00% n/a n/aSeptember 6-7, 19:45 10.2 0.0 99.98% 0:45 n/aSeptember 7, 2009 5:30 2.6 0.0 100.00% n/a n/aSeptember 9, 2009 11:00 17.5 1.9 88.94% 6:00 1:151 Time delay betw een the f irst tip of the tipping bucket rain gauge and the f irst measured runoff
Date Duration Rainfall (mm)
Total REM 10 Run-off
(mm)
% Retained
Delay in Start1
Delay in
Peak2
2 Time delay betw een the maximum recorded rainfall in a 15 min. interval and the maximum recorded runoff in a 15 min. interval

BCIT Centre for Architectural Ecology
REM-10 December 2010 33
REM-10 Runoff
Figure 19 Rainfall and REM-10 runoff comparison during the September 9 rain event. REM-10 Runoff Events
Figure 20 Rain events in the days prior to the September 9 rain event.
0
0.5
1
1.5
2
2.5
0:00 12:00
Rai
nfal
l/Run
off
(mm
)
REM Rainfall
REM 10 Runoff
Sept 9
0
0.5
1
1.5
2
2.5
3
3.5
4
4.5
0:00 0:00 0:00 0:00 0:00 0:00 0:00
Rai
nfal
l/Run
off
(mm
)
REM Rainfall
REM 10 Runoff
Sept 3 Sept 4 Sept 5 Sept 6 Sept 7 Sept 8 Sept 9

BCIT Centre for Architectural Ecology
REM-10 December 2010 34
4.3.4 Fall Rainfall Event (Wet Season) – November 14−17, 2009
The rainfall event to be examined occurred between 6:15 PM on November 14 and 2:45 AM on November 17, 2009. This period fits the definition of a distinct rain event. This time period is characteristic of the heavy rainfall found in the fall wet season. There are long periods of rainfall with little interruption between rainfall events. Heavy cloud cover and cool temperatures are typical. In the seven days that preceded this event, there were numerous other rainfall events of lesser amount and duration. In total the REM rain gauge received 129.2 mm of rainfall during this period. Runoff amounts and durations for these other events are found in Table 11 and illustrated in Figure 22. Figure 21 illustrates the rainfall event between November 14 and 17, when 89.9 mm of rainfall were recorded over the 56 hr 45 min duration of the event. This rainfall event was of continuous duration except for several periods without rainfall lasting up to three hours at a time. Rainfall was heavy with periods of intensity followed by less intense showers. During the event the ambient air temperature ranged between 2.1°C and 11.9°C. REM-10 retained 36.0% of rainfall and delayed the start of runoff by 16:00 hr relative to the start of rain. Runoff from REM-10 continued at a low rate of flow for 0:15 hr after the rain had stopped. The rainfall peak flow was 2.3 mm/15 min at 26 hr 30 min after the start of the event. The REM-10 runoff peak flow was 0.8 mm/15 min and occurred 16 hr 0 min after the peak rainfall. Table 11 REM-10 Runoff Statistics
November 9, 2009 7:30 8.8 3.0 66.16% 2:30 6:00November 9-11, 2009 34:00 19.3 5.8 69.75% 1:45 0:45November 12-13, 2009 9:45 11.2 5.1 54.47% 5:15 0:30November 15-17, 2009 56:45 89.9 57.5 36.03% 16:00 16:301 Time delay betw een the f irst tip of the tipping bucket rain gauge and the f irst measured runoff
2 Time delay betw een the maximum recorded rainfall in a 15 min. interval and the maximum recorded runoff in a 15 min. interv
Delay in Peak2
Date Duration Rainfall (mm)
Total REM 10 Run-off
(mm)
% Retained
Delay in Start1

BCIT Centre for Architectural Ecology
REM-10 December 2010 35
REM-10 Runoff
Figure 21 Rainfall and REM-10 runoff comparison during the November 14−17 rain event. REM-10 Runoff Events
Figure 22 Rain events in the days prior to the November 14−17 rain event.
0
0.5
1
1.5
2
2.5
12:00 0:00 12:00 0:00 12:00 0:00 12:00
Rai
nfal
l/Run
off
(mm
)
REM Rainfall
REM 10 Runoff
Nov 14 Nov 15 Nov 16 Nov 17
0
0.5
1
1.5
2
2.5
3
3.5
0:00 0:00 0:00 0:00 0:00 0:00 0:00 0:00 0:00
Rai
nfal
l/Run
off
(mm
)
REM Rainfall
REM 10 Runoff
Nov 9 Nov 10 Nov 11 Nov 12 Nov 13 Nov 14 Nov 15 Nov 16

BCIT Centre for Architectural Ecology
REM-10 December 2010 36
4.3.5 Stormwater Event Retention Statistics
This 2009 reporting period encompasses a wet season from January to mid-April, a dry season from mid-April to mid-September, and the start of the winter wet season from mid-September onwards. Two of the reported rainfall events (March 17−20 and November 14−17) were in the wet season, and the dry season event was September 9, 2009. Individual rainfall event results will vary depending on the duration, intensity of rainfall and proximity to other rainfall events, resulting in a range of retention values but reflecting seasonal trends. Growing media saturation will vary depending on these factors.
Rain events were recorded throughout the year and the average percentage of stormwater event retention was calculated on a monthly, seasonal and annual basis. For the purpose of calculating this average, rain events of 12 mm or greater rainfall were included. The runoff from the REM was measured and compared to the total rainfall for the event and calculated as a percentage. The stormwater retention value is the remainder of the rainfall that was retained in the green roof system. Wet Season Average based on event In the wet season, the stormwater event retention value for REM-10 was 45% based on 27 events.
Dry Season Average based on event In the dry season, the stormwater event retention value for REM-10 was 94% based on 9 events.
Annual Average based on event The annual average stormwater event retention value for REM-10 with its green roof was 69%. This is based on the average of the Wet Season and Dry Season Averages which were based on a total of 36 events.

BCIT Centre for Architectural Ecology
REM-10 December 2010 37
4.4 Plant Growth and Establishment First Reporting Period
Photos 1−8 show the plant establishment progress in the first six months after installation (June 2008 – December 2008). The plants (sedums interspersed with grasses and perennials) came in modular plastic trays of the LiveRoof system. The plants were well-established at installation with initial plant coverage at 100% (Photos 1 and 2). Photo 3 includes a section through the LiveRoof modular unit showing the extensive root growth through the growing medium at the date of planting.
The next photo period, October 20, 2008, is indicative of the fall period with cooler temperatures and heavy cloud cover. The sedum plants were more orange and red in colour, indicating some stress from cold (Photos 4−6).
The REM was covered in deep snow from mid-December to the first week of January (Photos 7−9).
Final Reporting Period Update The March 25, 2009 photo period reflects the warming trend of spring. Bright yellow-green growing tips indicate growth on the sedums against the redder winter colouration of the older branches (Photos 10 and 11). New leaf growth was visible through the older dormant growth on the grasses. Other perennials were in bloom.
By May 29, 2009, seed stems had developed on the grasses (Photos 12−14). The seed stems ripened and were in the process of drying at this time. The sedum species had developed yellow or purple flowering stalks, which grew vertically above the lower plant mass to a height of about 125 mm above the growing medium. This created a thicker layer of plant material on the green roof system than on the original installation.
Photos taken one month later on June 29, 2009 show the results of early summer drying which caused the grasses to complete their seed bloom and dry out (Photos 15−17). The seed stems grew to a height typically exceeding 600 mm above their base. At this time, flowers on the sedums had developed on single stems above the taller spring growth to a height of roughly 200 mm. By September 9, 2009, the flowering period was completed and the sedum flower stalks appeared as dried-out overburden above the green plant growth below (Photos 18−20). Due to the severe drought conditions of the summer, the grass clumps at this time appeared completely dried out and dormant. Photos were taken on the two-year anniversary of the project start on June 17, 2010 (Photos 21 and 22). The sedum growth was again showing abundant new growth and the development of flowering stalks. Dried leaf growth from the previous growing season on the grass was visible, though the plants were not visibly re-growing in the same locations. New grass had established in other locations on the green roof mixture. The total depth of the plant growth had increased by 50−75 mm from the beginning of the project.

BCIT Centre for Architectural Ecology
REM-10 December 2010 38
5 Discussion
5.1 Thermal Performance
5.1.1 Temperature Fluctuation Examination of the temperature gradient through the REM roof assembly reveals the thermal benefit of the green roof to the roof membrane. Throughout the time period under investigation the temperature of the roof membrane was consistently held much more closely to the air temperature on the REM compared to the high temperature fluctuation of the roof membrane on the reference roof. The higher temperature on the reference roof membrane was due to its direct exposure to solar radiation. The lower temperature fluctuation with the buffering effect of the green roof assembly should reduce contraction and expansion of the roof membrane over time, which should help in increasing the material durability.
5.2 Energy Efficiency The dynamic heat flow between a building and the exterior environment creates an energy demand for heating or cooling in the building in order to maintain more constant thermal comfort conditions for the occupants. The building envelope separating the interior from the exterior environment is composed of the wall, foundations, openings (window and doors) and the roof. The unit heat flow through the roof measured in kWhr/m2/day is recorded as the sum of the heat entering and leaving through the roof. If this is taken as a direct comparison to the energy demand for heating and cooling for comfort conditions in the building, it can be an indication of the energy efficiency of the system. However, it must be noted that this is a partial effect on the building envelope as a whole and does not include the internal heat production by occupants and equipment. It has been observed that REM-10 reduced heat flow during the cooling season months by 77% for heat loss and 98% for heat gain compared to the reference roof. The combination of the thermal mass benefits of the growing medium and the evapotranspirative action of the plants helped to produce this effect. The reduction during the heating season months was 50% for heat loss and nearly 100% for heat gain (though heat gain was much reduced overall during the months for both the reference and REM roofs). The wetting due to fall rainfall may have reduced the thermal resistance of the growing medium and contributed to this result. Dissimilar construction technologies which were used to construct the REM and the reference roof may also account for differences in thermal performance. Specifically, differences in insulation strategies and thermal mass characteristics of the construction materials would have an effect on heat flow.
5.2.1. Calculation of Heating/Cooling Cost Benefits
A calculation of heating/cooling cost will be demonstrated on the basis of heat loss during the fall season, where little heat gain occurred to allow passive heating. Eliminating the passive heating effect will allow a clearer calculation of both energy cost and reduction in greenhouse gas production. As an example, heat loss can be examined during the heating season (January, February, March, October, November, December). The proportion of heat loss through the roof relative to

BCIT Centre for Architectural Ecology
REM-10 December 2010 39
the rest of the building will depend on the area of the building footprint, the number of building storeys and the number of openings (windows and doors) in the building, as well as the influence of building orientation and stack effect. In the case of REM-10, during the heating season the reduction in heat loss through the roof assembly was 50% compared to the reference roof, with little to no heat gain supplying make-up heat. If the roof portion of the building envelope is estimated at, as an example, 25% of the total building heat loss, then the 50% reduction in roof heat loss would represent a 12.25% reduction in heat loss for the whole building. If this heat loss reduction was directly tied to make-up heating supplied by heating appliances, a calculation for heating cost could be made.
5.2.2 Reduction in Greenhouse Gases Generated
The contribution of greenhouse gases such as carbon dioxide to the phenomenon of global warming has been documented by many sources*. The production of greenhouse gases generated from the energy supplied by various sources (electrical and natural gas, for example) can be calculated. Data from BC Hydro is used to supply the Emission Factor for electricity (8.3 kg/GJ)** and natural gas (49.6 kg/GJ (CO2))***. The Emission Factor is multiplied by the actual energy usage (Gigajoules) in a building to calculate the amount of greenhouse gases produced over a period of time. Thus, a direct calculation of greenhouse gas production can be made by multiplying the actual energy usage (in Gigajoules) by the building by the emissions factor (for electrical energy or natural gas heating). The heat loss through the REM-10 roof system can be modelled using the heating season heat loss period of January/February/March/October/November/December as an example:
1. January, February, March, October, November, December heat loss: = 0.039 kWhr/m2/day X 182 days X .0036 GJ/kWhr (conversion factor to gigajoules) = 0.025 GJ/m2 2. Reduction of energy use compared to Reference Roof Reference Roof heat loss: = 0.051 GJ/m2
- 0.025 GJ/m2 = 0.026 GJ/m2 reduction 3. Greenhouse gas reduction – October, November, December Electrical appliance = 0.026 GJ/m2 X 8.3 kg CO2/GJ (Electrical Emission Factor**) = 0.213 kg CO2/m2 Natural gas appliance = 0.026 GJ/m2 X 49.6 kg CO2/GJ (Natural Gas Emission Factor***) = 1.27 kg CO2/m2
These examples reflect a direct connection between heat loss through the roof assembly including the green roof of REM-10 and make-up heat supplied by a heating appliance in REM-10. * United Nations Framework Convention on Climate Change (UNFCCC), 2006 ** “Estimating Greenhouse Gas Emissions” from BC Hydro data, BC Government publication *** “Environment Canada’s National Inventory Report”, BC Hydro data, BC Government publication

BCIT Centre for Architectural Ecology
REM-10 December 2010 40
5.3 Stormwater Runoff Retention 5.3.1 Seasonal Variation
The stormwater runoff capacity of the REM green roof system can be discussed by comparing the wet and dry season events for the REM green roof and the reference roof system. The climate in Vancouver is characterized by high rainfall in the winter with little rainfall in the summer. As a result, the growing medium will be near saturation often during the rainy months and much drier and capable of holding water in the dry season.
The stormwater retention during the September event (88.9%) and the seasonal average for the dry season (94%) reflect the increased capacity of the green roof plants/growing medium mixture to hold water during this period of reduced and intermittent rainfall. At the same time, the process of evapotranspiration would have had a further effect in removing water from the runoff during the active growing season of the plants.
The rainfall events in March and November presented in this report occurred within the wet seasons. The stormwater retention values of the REM during these events (40% and 36%, respectively) and the seasonal average (45%) reflect a lower capacity to hold the stormwater in the green roof plants/growing medium mixture than during drier periods. The rain events, particularly in November, can be intense with a large volume of water falling over an extended period of time. At these times, the peak flow delay was typically shorter (less than one hour) than during the drier months on the green roof.
During the December 2008 event, the stormwater retention value for the reference roof was 9%, which is lower than the stormwater retention value for the vegetated REM roof (28%). The peak flows from the reference roof runoff coincided much more closely with the peak rainfall, as illustrated in the runoff graphs for the three events. The higher stormwater runoff, with little delay in runoff, results in a greater burden on the regional stormwater runoff system.
5.3.2 Experimental Design Limitations
The REM experimental module was a small-scale replica of a full-sized building. The 2 m X 2 m roof has a total roof area of 4 m2 with a 2 m length of roof gutter and drain. As with any small-scale experimental setup, there may be some limitation in extrapolating the experimental results directly to a full-scale building.
5.4 Plant Performance The planting mixture of sedum species interspersed with grasses and perennials were pre-planted in tray modules. They were well-established with extensive roots at the time of installation. Plant coverage was 100% at the time of installation and complete coverage continued to the end of the study. The depth of plant materials increased up to 75 mm, not including seed stems, indicating that the plant growth was successful.

BCIT Centre for Architectural Ecology
REM-10 December 2010 41
6 Conclusions
1. The temperature fluctuation of the roof membrane was greatly reduced in the REM roof and was more closely held to the air temperature than the high temperature fluctuation of the reference roof.
2. The REM-10 green roof system was more effective in reducing heat flow through the roof system than the reference roof. The heat flow in the summer was reduced by 98% (heat gain) and 77% (heat loss) compared to the reference roof; the heat loss during the winter was reduced by 50% compared to the reference roof.
3. Energy efficiency gains by the green roof system can be measured in a reduction in heating and cooling costs as well as a reduction in the production of greenhouse gases.
4. The stormwater retention efficiency of the REM-10 green roof system was higher in the dry season (94% average event retention) than in the wet season (45% average event retention).
5. The REM-10 annual average stormwater event retention capacity was 69%.
6. The plant mixture of sedum species interspersed with grasses and perennials in REM-10 which began as pre-grown modules grew successfully and increased in overall height from the beginning of the study. Some grasses died back but new growth occurred in new locations.
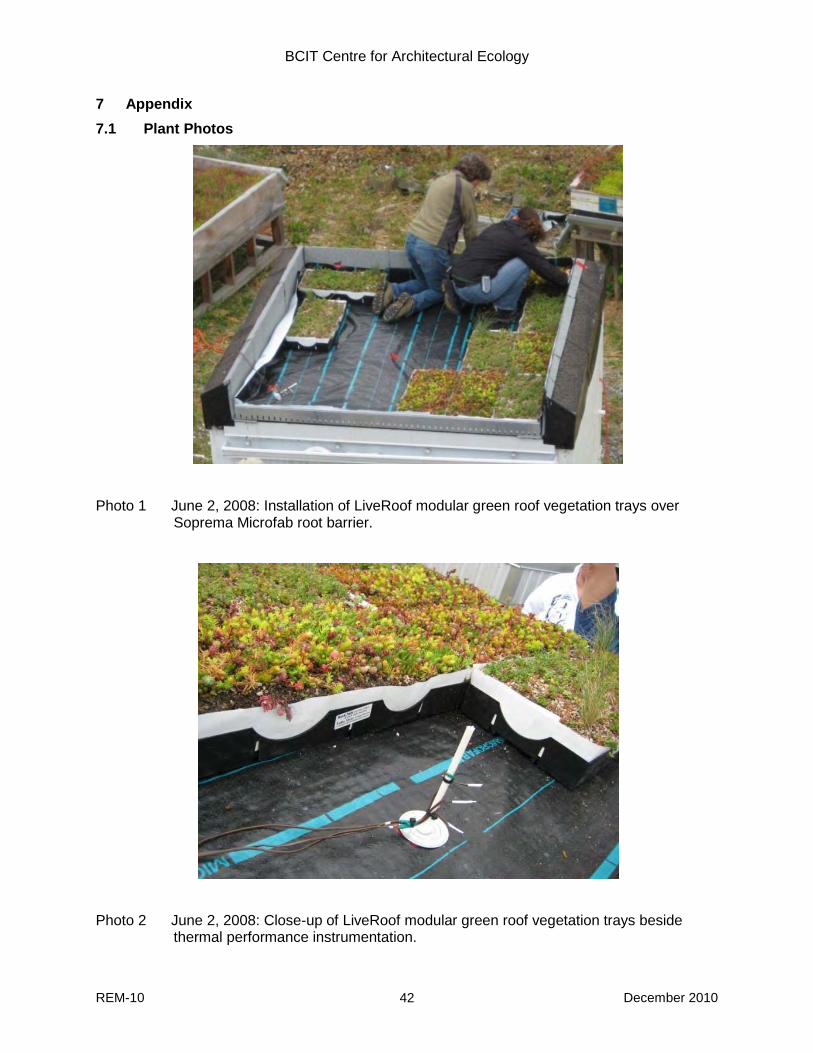
BCIT Centre for Architectural Ecology
REM-10 December 2010 42
7 Appendix 7.1 Plant Photos
Photo 1 June 2, 2008: Installation of LiveRoof modular green roof vegetation trays over Soprema Microfab root barrier.
Photo 2 June 2, 2008: Close-up of LiveRoof modular green roof vegetation trays beside thermal performance instrumentation.

BCIT Centre for Architectural Ecology
REM-10 December 2010 43
Photo 3 June 2, 2008: Close-up of LiveRoof modular green roof vegetation tray.
Photo 4 October 20, 2008: Entering the fall dormant period.

BCIT Centre for Architectural Ecology
REM-10 December 2010 44
Photo 5 October 20, 2008: Sedum species interspersed with grasses and perennials.
Photo 6 October 20, 2008: Sedums showing fall colours.

BCIT Centre for Architectural Ecology
REM-10 December 2010 45
Photo 7 December 16, 2008: Overview; after a light snow.
Photo 8 December 16, 2008: Close-up on sedums and snow.

BCIT Centre for Architectural Ecology
REM-10 December 2010 46
Photo 9 January 5, 2009: Remnants of heavy December snowfall on REM-10.
Photo 10 March 25, 2009: Sunny spring day on REM-10.

BCIT Centre for Architectural Ecology
REM-10 December 2010 47
Photo 11 March 25, 2009: Close-up on sedum mixture.
Photo 12 May 29, 2009: Sedums in bloom on REM-10.

BCIT Centre for Architectural Ecology
REM-10 December 2010 48
Photo 13 May 29, 2009: Sedums and other perennials in bloom on REM-10.
Photo 14 May 29, 2009: Seed stalks on grasses on REM-10.
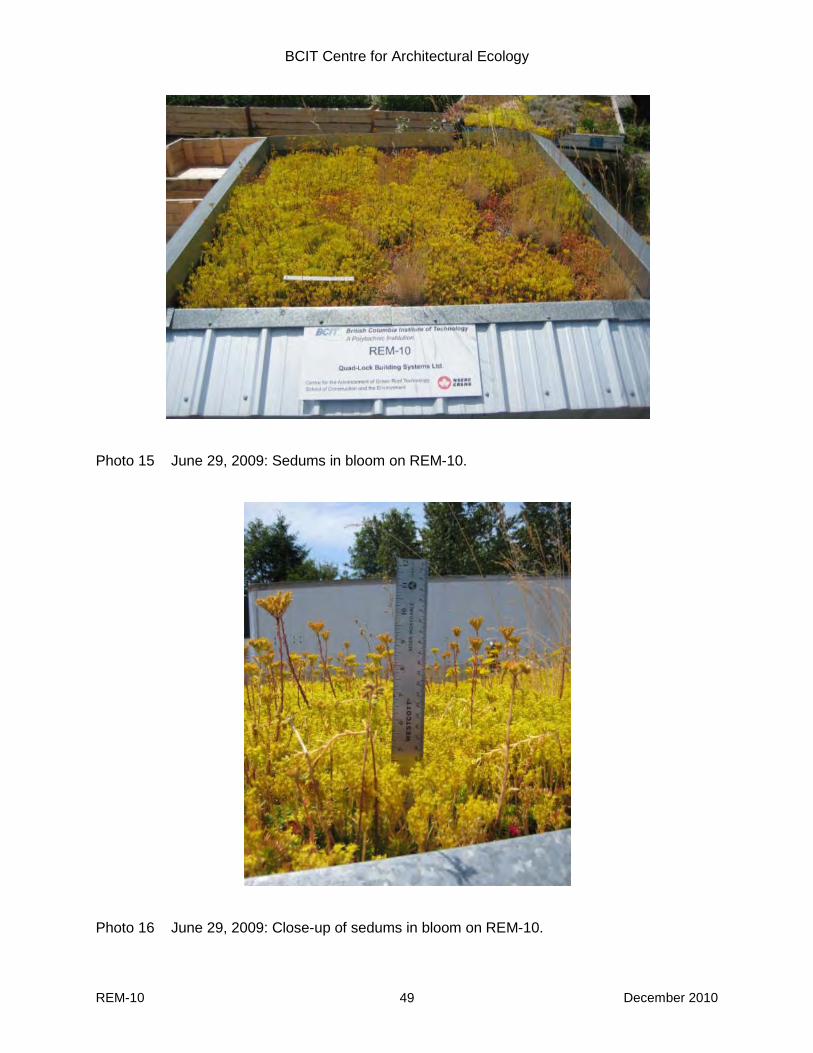
BCIT Centre for Architectural Ecology
REM-10 December 2010 49
Photo 15 June 29, 2009: Sedums in bloom on REM-10.
Photo 16 June 29, 2009: Close-up of sedums in bloom on REM-10.

BCIT Centre for Architectural Ecology
REM-10 December 2010 50
Photo 17 June 29, 2009: Seed stalks on REM-10.
Photo18 September 9, 2009: After the summer drought period on REM-10.

BCIT Centre for Architectural Ecology
REM-10 December 2010 51
Photo 19 September 9, 2009: Close-up after the summer drought period on REM-10.
Photo 20 September 9, 2009: Dormant grasses on REM-10.

BCIT Centre for Architectural Ecology
REM-10 December 2010 52
Photo 21 June 17, 2010: Two-year anniversary on REM-10.
Photo 22 June 17, 2010: Close-up on two-year anniversary on REM-10.

BCIT Centre for Architectural Ecology
REM-10 December 2010 53
7.2 References Connelly, M., Liu, K., Schaub, J., BCIT Green Roof Research Program, Phase 1, Summary of Data Analysis, Observation Period – Jan. 1, 2005 to Dec. 31, 2005, CMHC External Research Program Estimating Greenhouse Gas Emissions, from BC Hydro data, BC Government publication Estimation Methods on Greenhouse Gas Sources, Environment Canada, www.ec.gc.ca/pdb.ghg/guidance/calcu_e.cfm Green Roofs for Healthy Cities 2009 Industry Survey – www.greenroofs.org
Greenhouse Gas Emission Assessment Guide – Ministry of Community Services, Government of BC, VERSION 1 February 20, 2008, http://www.townsfortomorrow.gov.bc.ca/docs/ghg_assessment_guidebook_feb_2008.pdf United Nations Framework Convention on Climate Change, Subsidiary Body for Scientific and Technological Advice, 25th Session, Nairobi, 6−14 November, 2006, http://unfccc.int/essential_background/convention/items/2627.php


![LAYERED GREEN ROOF DETAILS - columbia-green…columbia-green.com/wp-content/uploads/2014/06/LAYERED-SYSTEM-… · layered green roof details lgr1.01 [a-d] extensive green roof lgr1.02](https://static.fdocuments.us/doc/165x107/5b8459577f8b9aef498c1eba/layered-green-roof-details-columbia-greencolumbia-greencomwp-contentuploads201406layered-system-.jpg)