2013 Tropism and pathological findings associated with canine respiratory coronavirus (CRCoV)

ww.sciencedirect.com
wat e r r e s e a r c h 4 7 ( 2 0 1 3 ) 6 9 0 9e6 9 2 0
Available online at w
journal homepage: www.elsevier .com/locate/watres
Performance evaluation of canine-associatedBacteroidales assays in a multi-laboratorycomparison study
Alexander Schriewer a, Kelly D. Goodwin b,1, Christopher D. Sinigalliano b,Annie M. Cox c,1,2, David Wanless d, Jakob Bartkowiak d, Darcy L. Ebentier e,Kaitlyn T. Hanley a,e, Jared Ervin f, Louise A. Deering g, Orin C. Shanks h,Lindsay A. Peed h, Wim G. Meijer g, John F. Griffith i, Jorge SantoDomingo j,Jennifer A. Jay e, Patricia A. Holden f, Stefan Wuertz a,k,*a Department of Civil and Environmental Engineering, University of California Davis, One Shields Ave, Davis, CA
95616, USAb National Oceanic and Atmospheric Administration, Atlantic Oceanographic and Meteorological Laboratory, Miami,
FL, USAc National Oceanic and Atmospheric Administration, Northwest Fisheries Science Center Laboratory, Seattle,
WA, USAd Cooperative Institute for Marine and Atmospheric Studies, University of Miami, Miami, FL, USAe Department of Civil and Environmental Engineering, University of California Los Angeles, 5732 Boelter Hall, Los
Angeles, CA, USAf Bren School of Environmental Science & Management and Earth Research Institute, University of California, Santa
Barbara, CA, USAg UCD School of Biomolecular and Biomedical Science, University College Dublin, Dublin 4, Irelandh U.S. Environmental Protection Agency, Office of Research and Development, National Risk Management Research
Laboratory, Cincinnati, OH, USAi Southern California Coastal Water Research Project, Costa Mesa, CA, USAj U.S Environmental Protection Agency, Microbial Contaminants Control Branch, National Risk Management
Research Laboratory, Cincinnati, OH, USAk Singapore Centre on Environmental Life Sciences Engineering (SCELSE), School of Biological Sciences and School of
Civil and Environmental Engineering, Nanyang Technological University, Singapore
a r t i c l e i n f o
Article history:
Received 25 November 2012
Received in revised form
Abbreviations: cp, gene copy numbers; Ctlower limit of quantification; LOD, limit of deqPCR, quantitative polymerase chain reactimaximum daily load.* Corresponding author. Department of Civil
95616, USA. Tel.: þ1 530 754 6407; fax: þ1 53E-mail address: [email protected] (S.
1 Stationed at NOAA/SWFSC, La Jolla, CA,2 Current address: Department of Microbi
Sciences Mall, Vancouver, Canada.0043-1354/$ e see front matter ª 2013 Publihttp://dx.doi.org/10.1016/j.watres.2013.03.062
a b s t r a c t
The contribution of fecal pollution from dogs in urbanized areas can be significant and is
an often underestimated problem. Microbial source tracking methods (MST) utilizing
quantitative PCR of dog-associated gene sequences encoding 16S rRNA of Bacteroidales are a
, cycle threshold; DNQ, detected but not quantifiable; FIB, fecal indicator bacteria; LLOQ,tection; MST, microbial source tracking; ND, not detected; PCR, polymerase chain reaction;on; ROQ, range of quantification; SIPP, Source Identification Protocol Project; TMDL, total
and Environmental Engineering, University of California Davis, One Shields Ave, Davis, CA0 752 7872.Wuertz).USA.ology and Immunology, Life Sciences Center, University of British Columbia 2350 Health
shed by Elsevier Ltd.

wat e r r e s e a r c h 4 7 ( 2 0 1 3 ) 6 9 0 9e6 9 2 06910
18 March 2013
Accepted 24 March 2013
Available online 5 July 2013
Keywords:
Quantitative PCR
Microbial source tracking
Bacteroidales
Canine fecal pollution
useful tool to estimate these contributions. However, data about the performance of
available assays are scarce. The results of a multi-laboratory study testing two assays for
the determination of dog-associated Bacteroidales (DogBact and BacCan-UCD) on 64 single
and mixed fecal source samples created from pooled fecal samples collected in California
are presented here. Standardization of qPCR data treatment lowered inter-laboratory
variability of sensitivity and specificity results. Both assays exhibited 100% sensitivity.
Normalization methods are presented that eliminated random and confirmed non-target
responses. The combination of standardized qPCR data treatment, use of normalization
via a non-target specific Bacteroidales assay (GenBac3), and application of threshold criteria
improved the calculated specificity significantly for both assays. Such measures would
reasonably improve MST data interpretation not only for canine-associated assays, but for
all qPCR assays used in identifying and monitoring fecal pollution in the environment.
ª 2013 Published by Elsevier Ltd.
1. Introduction The objectives of this study were (i) to compare two
Fecal material contributes to microbial pollution at many
coastal and freshwater sites. Dog feces, in particular, can ac-
count for poor water quality near rivers and beaches, because
it contains a significant amount of fecal indicator bacteria
(FIB). Loading estimates for canine fecal matter range from
1.5 � 108 to 5.6 � 109 CFU of enterococci/g dry weight, and the
loading from one dog fecal event is comparable to 6940 bird
fecal events (Wright et al., 2009; Zhu et al., 2011). Dog exercise
areas have been shown to impact water quality (Garfield and
Walker, 2008), and dog feces is a potential source of patho-
gens (Bagcigil et al., 2007; Gookin et al., 2007; Houf et al., 2008;
Papini et al., 2009; Damborg et al., 2009). In addition, dogs can
carry antibiotic resistant bacteria (Damborg et al., 2009;
Baptiste et al., 2005; Moodley et al., 2006; Nuttall et al., 2008),
and infections between humans and co-habiting dogs appear
to be emerging (Weese et al., 2006).
Accurate source identification can be used to address
beach and shellfish contamination problems and for Total
Maximum Daily Load (TMDL) determinations of allowable FIB
levels, as a means to estimate supportable inputs of patho-
gens into a specific watershed (Hagedorn et al., 2011; Kern
et al., 2002). Once sources of contamination have been iden-
tified, scientifically and economically sound remediation ef-
forts can be devised. To best aid watershed management,
microbial source tracking (MST) markers should provide a
quantitative means for fecal source identification as demon-
strated previously (Reischer et al., 2006; Lee et al., 2010;
Schriewer et al., 2010; Tambalo et al., 2012a). To address this
need, MST assays utilizing quantitative PCR (qPCR) to identify
fecal contamination from dogs have been developed and uti-
lized in field studies (Kildare et al., 2007; Sinigalliano et al.,
2010; Schriewer et al., 2010). The assays discussed here, Dog-
Bact (Sinigalliano et al., 2010) and BacCan-UCD (Kildare et al.,
2007), both target Bacteroidales (Dick et al., 2005a, 2005b),
but have not been compared previously. In addition, it is
uncommon for multiple laboratories to devote resources
towards a round-robin test and there are no examples of
qPCR-based methods having been validated in an interlabor-
atory exercise. For qPCR-based MST methods, only within-
laboratory (intra-laboratory) studies have been performed
(Shanks et al., 2010a, 2010b).
promising quantitative PCR (qPCR)-based canine-associated
assays, BacCan-UCD (Kildare et al., 2007) and DogBact
(Sinigalliano et al., 2010), that target genes encoding Bacter-
oidales 16S rRNA in amulti-laboratory comparison study using
a single-blinded approach with purified DNA from fecal slur-
ries originating from either one animal or human source
(singleton) or two combined sources (doubleton) (Boehm et al.,
2013) and (ii) to develop a general procedure for the normali-
zation of source tracking data obtained by qPCR. Eight
different laboratories participated in the study, all of which
received filters of the same challenge samples. This effort was
part of a broader multi-laboratory assessment of MSTmethod
performance, the State of California-funded Source Identifi-
cation Protocol Project (SIPP). Other host targets and aspects of
assay performance are reported elsewhere in this issue
(Boehm et al., 2013; Layton et al., 2013; Ebentier et al., 2013;
Raith et al., 2013; Sinigalliano et al., 2013).
2. Materials and methods
2.1. Preparation of challenge samples and processing
Briefly, sixty-four challenge samples were created by mixing
fresh feces, sewage, or septage, in artificial freshwater. Feces
used were from chicken, cow, dog, deer, goose, gull, horse,
human, pig, and pigeon. This set of sixty-four blind samples
was comprised of 19 single-source (“singleton”) and 13mixed-
source (“doubleton”) samples in duplicate. Each doubleton
sample contained human feces, septage, or sewage in com-
bination with one non-human source. Except for sewage
(untreated influent fromnine treatment facilities) and septage
(six septage collection trucks or community systems) a mini-
mumof 12 individual sampleswere collected across California
for each animal type. The challenge samples were filtered
(50 mL or 5 mL, see supplementary data) over polycarbonate
membrane filters with a diameter of 47 mm diameter and a
pore size of 0.4 mm (Isopore, Millipore) and distributed frozen
to the participating laboratories. Themethods for creation and
laboratory analysis of the challenge samples are described in
detail elsewhere (Boehm et al., 2013) and in the supplemen-
tary data for this study.
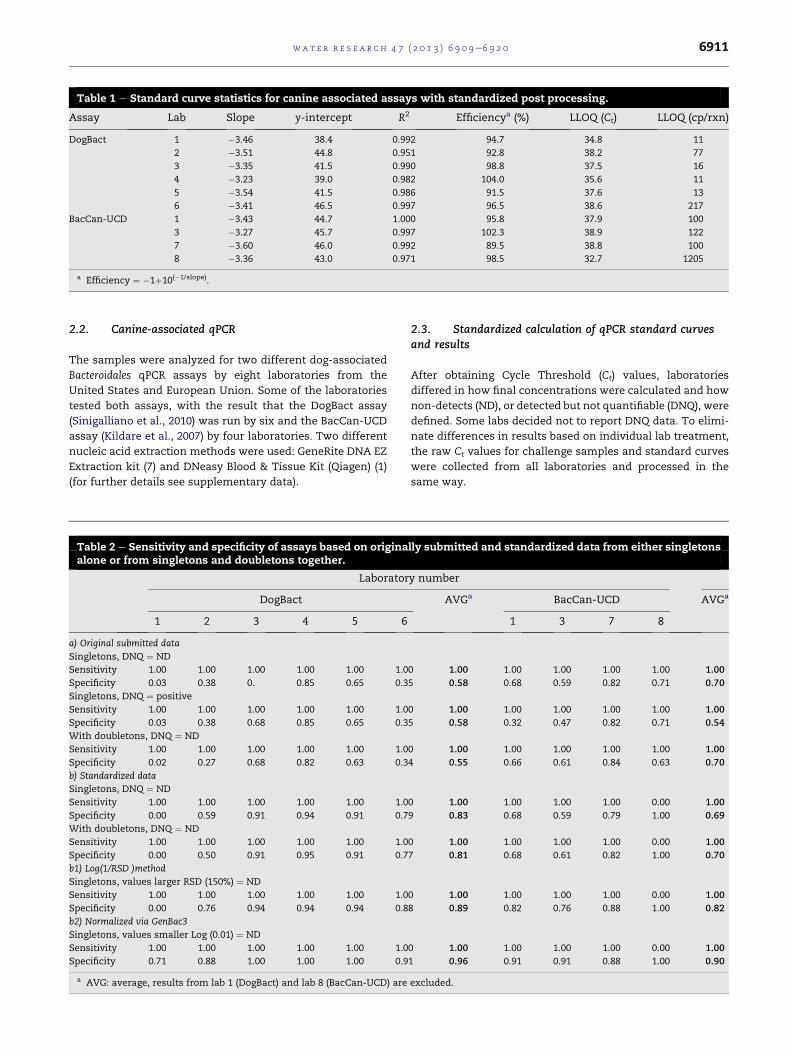
Table 1 e Standard curve statistics for canine associated assays with standardized post processing.
Assay Lab Slope y-intercept R2 Efficiencya (%) LLOQ (Ct) LLOQ (cp/rxn)
DogBact 1 �3.46 38.4 0.992 94.7 34.8 11
2 �3.51 44.8 0.951 92.8 38.2 77
3 �3.35 41.5 0.990 98.8 37.5 16
4 �3.23 39.0 0.982 104.0 35.6 11
5 �3.54 41.5 0.986 91.5 37.6 13
6 �3.41 46.5 0.997 96.5 38.6 217
BacCan-UCD 1 �3.43 44.7 1.000 95.8 37.9 100
3 �3.27 45.7 0.997 102.3 38.9 122
7 �3.60 46.0 0.992 89.5 38.8 100
8 �3.36 43.0 0.971 98.5 32.7 1205
a Efficiency ¼ �1þ10(�1/slope).
wat e r r e s e a r c h 4 7 ( 2 0 1 3 ) 6 9 0 9e6 9 2 0 6911
2.2. Canine-associated qPCR
The samples were analyzed for two different dog-associated
Bacteroidales qPCR assays by eight laboratories from the
United States and European Union. Some of the laboratories
tested both assays, with the result that the DogBact assay
(Sinigalliano et al., 2010) was run by six and the BacCan-UCD
assay (Kildare et al., 2007) by four laboratories. Two different
nucleic acid extraction methods were used: GeneRite DNA EZ
Extraction kit (7) and DNeasy Blood & Tissue Kit (Qiagen) (1)
(for further details see supplementary data).
Table 2 e Sensitivity and specificity of assays based on originaalone or from singletons and doubletons together.
Laborator
DogBact
1 2 3 4 5 6
a) Original submitted data
Singletons, DNQ ¼ ND
Sensitivity 1.00 1.00 1.00 1.00 1.00 1.0
Specificity 0.03 0.38 0. 0.85 0.65 0.3
Singletons, DNQ ¼ positive
Sensitivity 1.00 1.00 1.00 1.00 1.00 1.0
Specificity 0.03 0.38 0.68 0.85 0.65 0.3
With doubletons, DNQ ¼ ND
Sensitivity 1.00 1.00 1.00 1.00 1.00 1.0
Specificity 0.02 0.27 0.68 0.82 0.63 0.3
b) Standardized data
Singletons, DNQ ¼ ND
Sensitivity 1.00 1.00 1.00 1.00 1.00 1.0
Specificity 0.00 0.59 0.91 0.94 0.91 0.7
With doubletons, DNQ ¼ ND
Sensitivity 1.00 1.00 1.00 1.00 1.00 1.0
Specificity 0.00 0.50 0.91 0.95 0.91 0.7
b1) Log(1/RSD )method
Singletons, values larger RSD (150%) ¼ ND
Sensitivity 1.00 1.00 1.00 1.00 1.00 1.0
Specificity 0.00 0.76 0.94 0.94 0.94 0.8
b2) Normalized via GenBac3
Singletons, values smaller Log (0.01) ¼ ND
Sensitivity 1.00 1.00 1.00 1.00 1.00 1.0
Specificity 0.71 0.88 1.00 1.00 1.00 0.9
a AVG: average, results from lab 1 (DogBact) and lab 8 (BacCan-UCD) are
2.3. Standardized calculation of qPCR standard curvesand results
After obtaining Cycle Threshold (Ct) values, laboratories
differed in how final concentrations were calculated and how
non-detects (ND), or detected but not quantifiable (DNQ), were
defined. Some labs decided not to report DNQ data. To elimi-
nate differences in results based on individual lab treatment,
the raw Ct values for challenge samples and standard curves
were collected from all laboratories and processed in the
same way.
lly submitted and standardized data from either singletons
y number
AVGa BacCan-UCD AVGa
1 3 7 8
0 1.00 1.00 1.00 1.00 1.00 1.00
5 0.58 0.68 0.59 0.82 0.71 0.70
0 1.00 1.00 1.00 1.00 1.00 1.00
5 0.58 0.32 0.47 0.82 0.71 0.54
0 1.00 1.00 1.00 1.00 1.00 1.00
4 0.55 0.66 0.61 0.84 0.63 0.70
0 1.00 1.00 1.00 1.00 0.00 1.00
9 0.83 0.68 0.59 0.79 1.00 0.69
0 1.00 1.00 1.00 1.00 0.00 1.00
7 0.81 0.68 0.61 0.82 1.00 0.70
0 1.00 1.00 1.00 1.00 0.00 1.00
8 0.89 0.82 0.76 0.88 1.00 0.82
0 1.00 1.00 1.00 1.00 0.00 1.00
1 0.96 0.91 0.91 0.88 1.00 0.90
excluded.

wat e r r e s e a r c h 4 7 ( 2 0 1 3 ) 6 9 0 9e6 9 2 06912
Regression analysis was performed on each individual
standard curve to remove outliers; Ct values with a residual
value larger than þ3 or smaller than �3 were ignored when
determining the final standard curve for each lab. The initial
calculation of LLOQs using the precision of replicate standard
curves resulted in values below those that could be confidently
detected as lowest standard; for this reasonwe chose as amore
conservative approach to only consider concentrations that
yielded amplification in at least 50% of the replicates. Based on
these LLOQs, copy numbers (cp) per reaction were calculated
for each lab from the average Ct value of the non-outlier stan-
dard replicates at the lowest concentration included in the
standard curve (Table 1). Each sample replicatewas considered
within the range of quantification (ROQ) if the Ct < LLOQ,
Fig. 1 e Originally submitted results from 38 single-source (dup
ND [ not detected. DNQ [ detected but not quantifiable.
detected but not quantifiable (DNQ) if the Ct > LLOQ, and not
detected (ND) if therewasnoamplificationdetectedby cycle 40.
Since laboratories also differed in numbers of dilutions
and replicates of samples tested, a uniform strategy was
applied to standardize the interpretation of results into
categories of range of quantification (ROQ), DNQ or ND (for
details see supplementary data). Basically, the majority
category among replicates defined whether the sample was
declared ROQ, DNQ, or ND. For 50:50 situations in replicates
between ROQ and DNQ as well as DNQ and ND, both cases
were defined as DNQ. Specifically, for samples run in tripli-
cate, Ct values were averaged if 2/3 or 3/3 replicates were
within the ROQ. If 2/3 or 3/3 replicates were DNQ, then the
sample was considered DNQ. If 2/3 or 3/3 replicates were ND
licate) samples for DogBact (top) and BacCan-UCD (bottom).

wat e r r e s e a r c h 4 7 ( 2 0 1 3 ) 6 9 0 9e6 9 2 0 6913
then the sample was considered ND. In the rare case that
the replicates contained one each of ROQ, DNQ and ND, then
the samples were considered DNQ. For samples run in
duplicate, Ct values were averaged if 2/2 replicates were
within the ROQ and a single Ct values was used if 1/2 rep-
licates were within the ROQ. If 2/2 replicates were DNQ or 1
DNQ and 1 ND resulted, then the sample was considered
DNQ. If 2/2 replicates were ND then the sample was
considered ND. For samples run in dilution series all Ct
values were considered and, accounting for dilution factors,
converted into copy numbers per reaction of undiluted
sample template, using each lab’s standardized standard
curve. These concentrations were averaged and, according
to individual LLOQ values, grouped into ROQ, DNQ, and ND.
Thus, sample concentrations below LLOQ were considered
Fig. 2 e Results from 38 single-source (duplicate) samples for D
data treatment. ND [ not detected. DNQ [ detected but not qu
DNQ. When Ct values were reported at >40 cycles, then they
were considered ND.
2.4. Sensitivity and specificity
Sensitivity (%) was calculated as the number of challenge sam-
ples correctly identified as positive for the host feces divided by
the total number of samples that contain the host feces:
Sensitivity ¼ TPðTPþ FNÞ (1)
where TP and FN are true positives and false negatives,
respectively.
Specificity (%) was calculated as the number of challenge
samples correctly identified as negative for the host feces
ogBact (top) and BacCan-UCD (bottom) after standardized
antifiable.
wat e r r e s e a r c h 4 7 ( 2 0 1 3 ) 6 9 0 9e6 9 2 06914
divided by the total number of samples that did not contain
the host feces:
Specificity ¼ TNðTPþ FPÞ (2)
where TN and FP are true negatives and false positives,
respectively.
2.5. Normalization of results
Concentrations of DNA, General Bacteroidales (GenBac3), and
viable enterococci provided by the research group that created
the blinded sample set were used to normalize the results
obtained from individual lab analyses for DogBact and
BacCan-UCD assays. We also developed a new approach
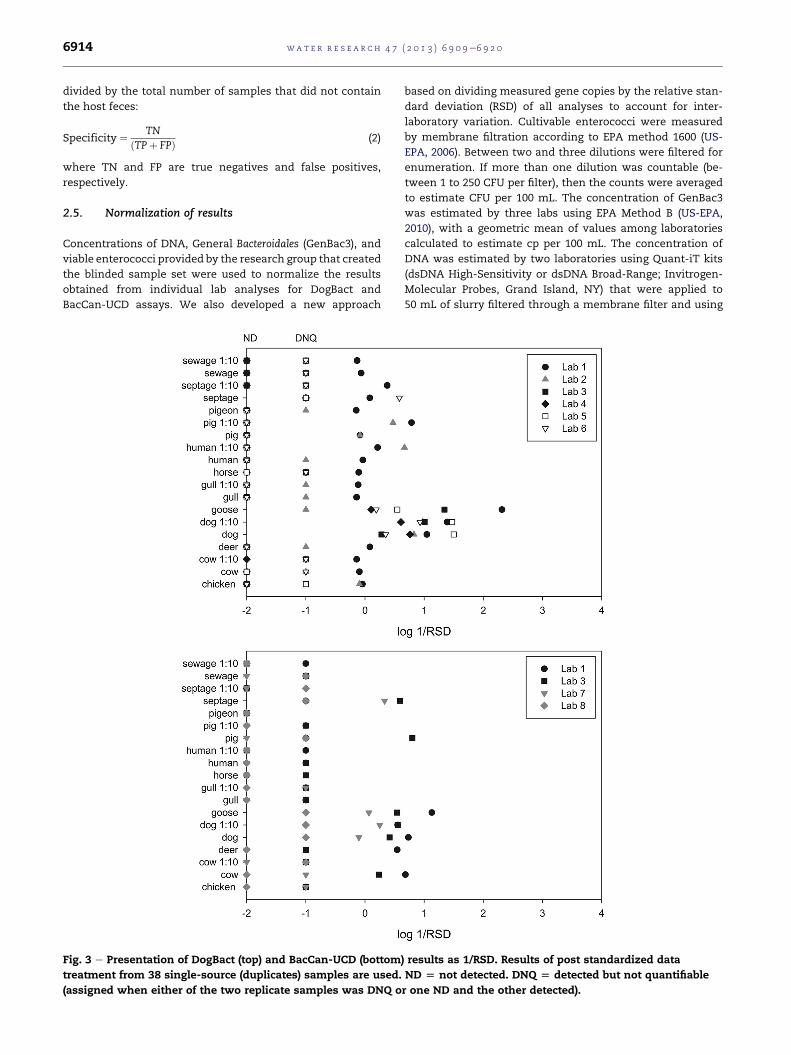
Fig. 3 e Presentation of DogBact (top) and BacCan-UCD (bottom
treatment from 38 single-source (duplicates) samples are used.
(assigned when either of the two replicate samples was DNQ o
based on dividing measured gene copies by the relative stan-
dard deviation (RSD) of all analyses to account for inter-
laboratory variation. Cultivable enterococci were measured
by membrane filtration according to EPA method 1600 (US-
EPA, 2006). Between two and three dilutions were filtered for
enumeration. If more than one dilution was countable (be-
tween 1 to 250 CFU per filter), then the counts were averaged
to estimate CFU per 100 mL. The concentration of GenBac3
was estimated by three labs using EPA Method B (US-EPA,
2010), with a geometric mean of values among laboratories
calculated to estimate cp per 100 mL. The concentration of
DNA was estimated by two laboratories using Quant-iT kits
(dsDNA High-Sensitivity or dsDNA Broad-Range; Invitrogen-
Molecular Probes, Grand Island, NY) that were applied to
50 mL of slurry filtered through a membrane filter and using
) results as 1/RSD. Results of post standardized data
ND [ not detected. DNQ [ detected but not quantifiable
r one ND and the other detected).

wat e r r e s e a r c h 4 7 ( 2 0 1 3 ) 6 9 0 9e6 9 2 0 6915
GeneRite DNA extraction kits. This concentration was multi-
plied by the exact volume of extract and normalized to 100mL
of slurry. For detailed information see Boehm et al. (2013) and
Supplementary Data.
3. Results
The DogBact (6 laboratories) and BacCan-UCD (4 laboratories)
assays for the detection of canine associated Bacteroidales
were tested on 64 challenge samples comprising duplicates of
19 singleton and 13 doubleton samples, prepared from pools
of individual fecal samples collected across California. Several
laboratories tested both qPCR assays. In general, laboratories
were not restricted in how they processed samples or
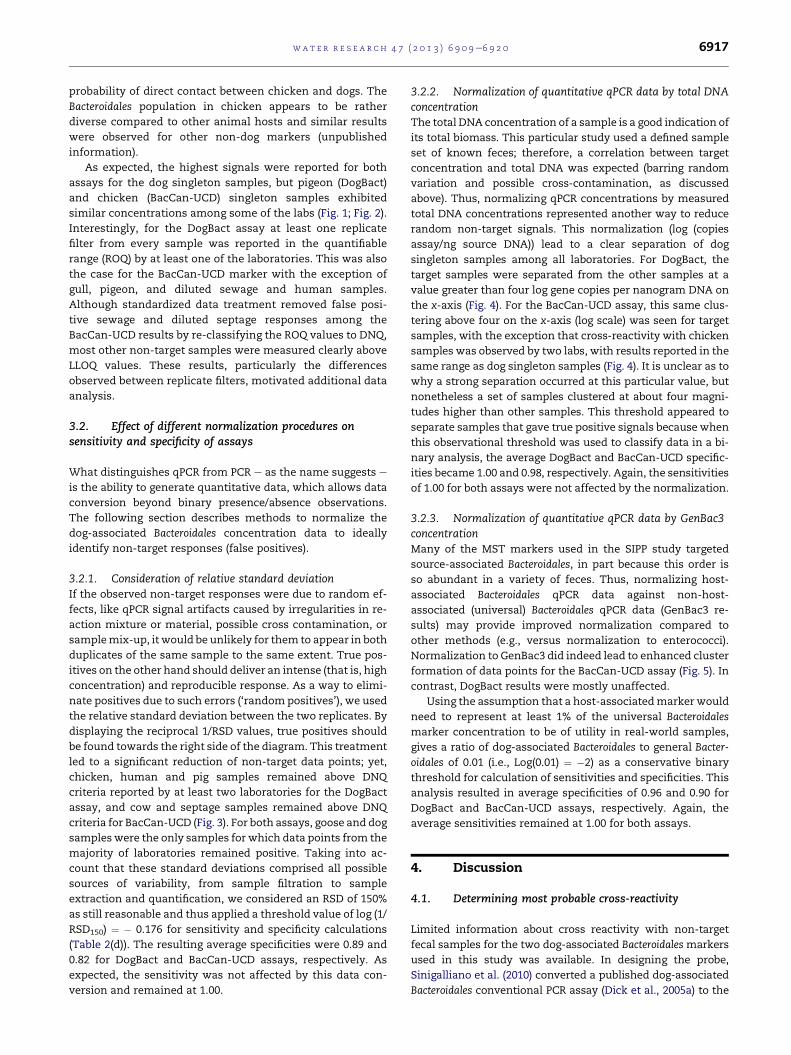
Fig. 4 e Normalization of DogBact (top) and BacCan-UCD (bottom
standardized data treatment from 38 single-source (duplicates)
not quantifiable.
calculated and reported their results. This non-restriction led
to two obvious differences among the laboratories: 1) the
number of replicates and dilutions for samples and standard
curves run by each lab and 2) the classification of results into
ROQ, DNQ and ND. While the first difference influenced the
quality of quantitative data, the second one directly affected
qualitative outcomes, i.e., the assessment whether a sample
was considered positive or negative (Table 2). To unify these
outcomes it was necessary to treat all laboratories’ original
data in a standardized fashion. More specifically, the same
criteria were used for the calculation of standard curves,
which affected how outliers within the standard curve data-
sets were identified and LLOQs were calculated. After
obtaining the standardized standard curves the same criteria
were applied to the individual lab-specific datasets for the
) results by ng DNAmeasured in the sources. Results of post
samples are used. ND [ not detected. DNQ [ detected but
wat e r r e s e a r c h 4 7 ( 2 0 1 3 ) 6 9 0 9e6 9 2 06916
challenge samples to classify ROQ, DNQ, and ND consistently.
Because the standardized data treatment resulted in close to
zero specificity or sensitivity for data from lab 1 (DogBact) and
lab 8 (BacCan-UCD), respectively, their data were excluded
from the calculation of average sensitivities and specificities
(Table 2). Both datasets represent special cases in which most
ROQs had to be classified as DNQ or vice versa after applica-
tion of standardized criteria.
3.1. Effect of standardized data treatment on assaysensitivity and specificity
Samples with an assay response below concentrations of the
calculated laboratory’s LLOQ were considered DNQ. Consid-
eration of DNQ samples as positive samples resulted without
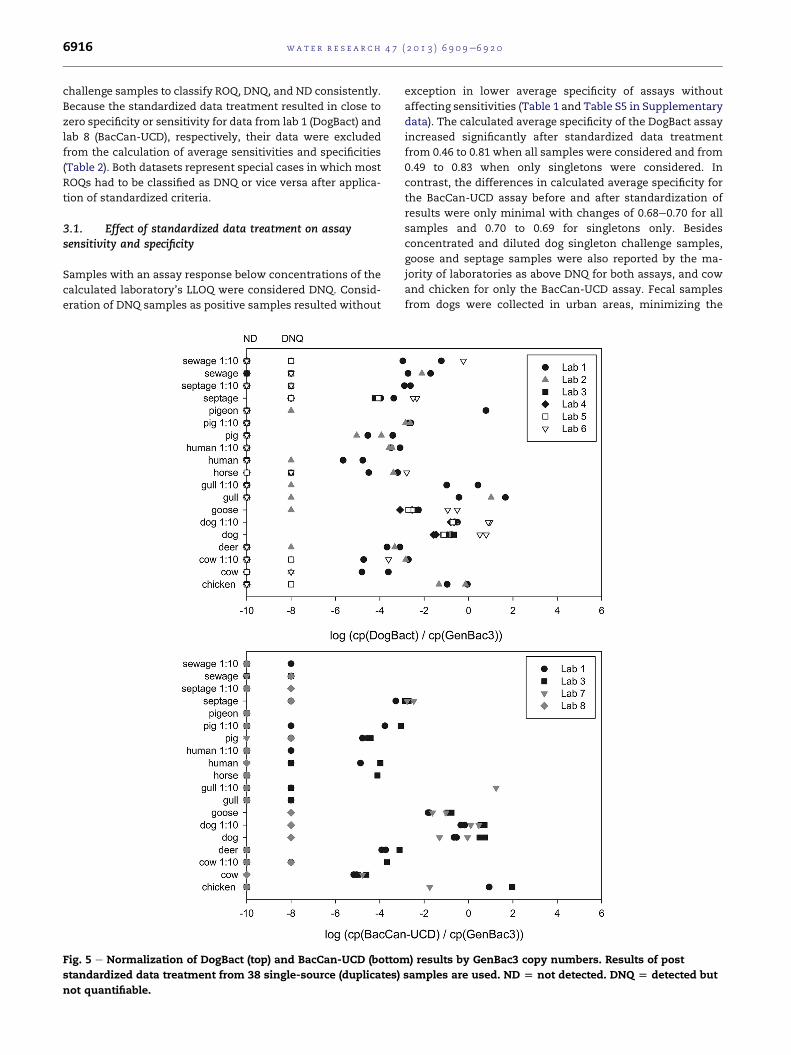
Fig. 5 e Normalization of DogBact (top) and BacCan-UCD (bottom
standardized data treatment from 38 single-source (duplicates)
not quantifiable.
exception in lower average specificity of assays without
affecting sensitivities (Table 1 and Table S5 in Supplementary
data). The calculated average specificity of the DogBact assay
increased significantly after standardized data treatment
from 0.46 to 0.81 when all samples were considered and from
0.49 to 0.83 when only singletons were considered. In
contrast, the differences in calculated average specificity for
the BacCan-UCD assay before and after standardization of
results were only minimal with changes of 0.68e0.70 for all
samples and 0.70 to 0.69 for singletons only. Besides
concentrated and diluted dog singleton challenge samples,
goose and septage samples were also reported by the ma-
jority of laboratories as above DNQ for both assays, and cow
and chicken for only the BacCan-UCD assay. Fecal samples
from dogs were collected in urban areas, minimizing the
) results by GenBac3 copy numbers. Results of post
samples are used. ND [ not detected. DNQ [ detected but
wat e r r e s e a r c h 4 7 ( 2 0 1 3 ) 6 9 0 9e6 9 2 0 6917
probability of direct contact between chicken and dogs. The
Bacteroidales population in chicken appears to be rather
diverse compared to other animal hosts and similar results
were observed for other non-dog markers (unpublished
information).
As expected, the highest signals were reported for both
assays for the dog singleton samples, but pigeon (DogBact)
and chicken (BacCan-UCD) singleton samples exhibited
similar concentrations among some of the labs (Fig. 1; Fig. 2).
Interestingly, for the DogBact assay at least one replicate
filter from every sample was reported in the quantifiable
range (ROQ) by at least one of the laboratories. This was also
the case for the BacCan-UCD marker with the exception of
gull, pigeon, and diluted sewage and human samples.
Although standardized data treatment removed false posi-
tive sewage and diluted septage responses among the
BacCan-UCD results by re-classifying the ROQ values to DNQ,
most other non-target samples were measured clearly above
LLOQ values. These results, particularly the differences
observed between replicate filters, motivated additional data
analysis.
3.2. Effect of different normalization procedures onsensitivity and specificity of assays
What distinguishes qPCR from PCR e as the name suggests e
is the ability to generate quantitative data, which allows data
conversion beyond binary presence/absence observations.
The following section describes methods to normalize the
dog-associated Bacteroidales concentration data to ideally
identify non-target responses (false positives).
3.2.1. Consideration of relative standard deviationIf the observed non-target responses were due to random ef-
fects, like qPCR signal artifacts caused by irregularities in re-
action mixture or material, possible cross contamination, or
samplemix-up, it would be unlikely for them to appear in both
duplicates of the same sample to the same extent. True pos-
itives on the other hand should deliver an intense (that is, high
concentration) and reproducible response. As a way to elimi-
nate positives due to such errors (‘randompositives’), we used
the relative standard deviation between the two replicates. By
displaying the reciprocal 1/RSD values, true positives should
be found towards the right side of the diagram. This treatment
led to a significant reduction of non-target data points; yet,
chicken, human and pig samples remained above DNQ
criteria reported by at least two laboratories for the DogBact
assay, and cow and septage samples remained above DNQ
criteria for BacCan-UCD (Fig. 3). For both assays, goose and dog
sampleswere the only samples for which data points from the
majority of laboratories remained positive. Taking into ac-
count that these standard deviations comprised all possible
sources of variability, from sample filtration to sample
extraction and quantification, we considered an RSD of 150%
as still reasonable and thus applied a threshold value of log (1/
RSD150) ¼ � 0.176 for sensitivity and specificity calculations
(Table 2(d)). The resulting average specificities were 0.89 and
0.82 for DogBact and BacCan-UCD assays, respectively. As
expected, the sensitivity was not affected by this data con-
version and remained at 1.00.
3.2.2. Normalization of quantitative qPCR data by total DNAconcentrationThe total DNA concentration of a sample is a good indication of
its total biomass. This particular study used a defined sample
set of known feces; therefore, a correlation between target
concentration and total DNA was expected (barring random
variation and possible cross-contamination, as discussed
above). Thus, normalizing qPCR concentrations by measured
total DNA concentrations represented another way to reduce
random non-target signals. This normalization (log (copies
assay/ng source DNA)) lead to a clear separation of dog
singleton samples among all laboratories. For DogBact, the
target samples were separated from the other samples at a
value greater than four log gene copies per nanogram DNA on
the x-axis (Fig. 4). For the BacCan-UCD assay, this same clus-
tering above four on the x-axis (log scale) was seen for target
samples, with the exception that cross-reactivity with chicken
samples was observed by two labs, with results reported in the
same range as dog singleton samples (Fig. 4). It is unclear as to
why a strong separation occurred at this particular value, but
nonetheless a set of samples clustered at about four magni-
tudes higher than other samples. This threshold appeared to
separate samples that gave true positive signals because when
this observational threshold was used to classify data in a bi-
nary analysis, the average DogBact and BacCan-UCD specific-
ities became 1.00 and 0.98, respectively. Again, the sensitivities
of 1.00 for both assays were not affected by the normalization.
3.2.3. Normalization of quantitative qPCR data by GenBac3concentrationMany of the MST markers used in the SIPP study targeted
source-associated Bacteroidales, in part because this order is
so abundant in a variety of feces. Thus, normalizing host-
associated Bacteroidales qPCR data against non-host-
associated (universal) Bacteroidales qPCR data (GenBac3 re-
sults) may provide improved normalization compared to
other methods (e.g., versus normalization to enterococci).
Normalization to GenBac3 did indeed lead to enhanced cluster
formation of data points for the BacCan-UCD assay (Fig. 5). In
contrast, DogBact results were mostly unaffected.
Using the assumption that a host-associatedmarker would
need to represent at least 1% of the universal Bacteroidales
marker concentration to be of utility in real-world samples,
gives a ratio of dog-associated Bacteroidales to general Bacter-
oidales of 0.01 (i.e., Log(0.01) ¼ �2) as a conservative binary
threshold for calculation of sensitivities and specificities. This
analysis resulted in average specificities of 0.96 and 0.90 for
DogBact and BacCan-UCD assays, respectively. Again, the
average sensitivities remained at 1.00 for both assays.
4. Discussion
4.1. Determining most probable cross-reactivity
Limited information about cross reactivity with non-target
fecal samples for the two dog-associated Bacteroidales markers
used in this study was available. In designing the probe,
Sinigalliano et al. (2010) converted a published dog-associated
Bacteroidales conventional PCR assay (Dick et al., 2005a) to the
wat e r r e s e a r c h 4 7 ( 2 0 1 3 ) 6 9 0 9e6 9 2 06918
DogBact qPCR assay used in this study (Sinigalliano et al., 2010).
The SIPP study is the first to report cross-reactivity data for this
qPCR assay (additional specificity testing data are given in
supplementary data, see also Boehm et al., 2013). Kildare et al.
(2007) previously reported cross-reactivity of BacCan-UCD
with individual human (4/18), pooled cat (1/7), and waste-
water influent (4/14) samples. Cross-reactivity also occurred
with pooled cow (11/11), horse (2/10), and goose (5/10) fecal
samples as well as sewage (10/12) (Silkie and Nelson, 2009).
Other studies modified the BacCan-UCD assay significantly,
either byusingonly conventional PCRand removing the second
reverse primer (Ahmed et al., 2008) or by choosing a different
annealing temperature (Tambalo et al., 2012b), and thus cannot
be used for a valid comparison of reported cross-reactivity of
the assay.
The standardized data treatment removed variations
among laboratory results due to data processing. Comparing
the standardized datasets for singleton challenge samples of
participating laboratories confirmed that some cross reac-
tivity was observed for both assays for goose and septage, and
also for chicken for BacCan-UCD. However, other cross-
reactivities were not consistent between sample replicates
or across laboratories, indicating random errors perhaps
introduced by cross-contamination, qPCR artifacts, or other
unidentified reasons. Differences in detection limits of the
different laboratories could also have been a factor for low
level cross-reactivity as the reported LLOQ values varied
significantly among laboratories (Table 1).
Consequently, reports of false positives with non-targets
must be viewed with caution when observed in a minority of
non-target samples or by only one laboratory, whether from
individual or composite samples.
4.2. Consequences for MST studies
Statisticalmodels can help to adjust host distributions relative
to each other by translating measured concentrations into
probable distributions by accounting for uncertainties and
errors (Wang et al., 2010). The accuracy of such treatment
strongly depends on the strength of the original validation of
assay specificity and sensitivity. However, not all assays used
in the SIPP study were validated in a similar fashion, and this
may have confounded assay comparisons. Many papers in the
SIPP study presented differential performance characteristics
for assays depending on how qPCR data were binned into bi-
nary results, with particular focus on treatment of DNQ re-
sults (Layton et al., 2013, Raith et al., 2013, Sinigalliano et al.,
2013). Validation requires adequate replication (Armbruster
and Pry, 2008; CODEX, 2010), and variations in LOD and
LLOQ calculations (Stewart et al., 2013) can directly affect how
quantitative results are binned for binary analysis. It is likely
that if all assays had been similarly and rigorously validated,
creating accurate limit of detection and limit of quantification
statistics, much of the need for interpretation would have
disappeared. Clearly, the overall SIPP study has highlighted
the necessity of uniform protocols to implement MST across
laboratories (Ebentier et al., 2013). In addition, the results in
total suggest a requirement for defined assay validation pro-
cedures prior to moving assays into inter-laboratory verifica-
tion exercises. Validation needs to include definition ofmatrix
effects, and forMST applications, sample aging. Genotyping or
metagenomic sequencing of samples (Rosario et al., 2009;
Tringe and Rubin, 2005) would also benefit future validation
efforts.
In the absence of additional validation exercises, any type
of positive MST results will be subject to uncertainty, whether
the observed signal is a result of a small load of real host feces
or due to a larger load of cross-reactive non-host feces. One
possible solution is normalization by other related parame-
ters, assuming that the ratio of true associated host signal to,
e.g., total DNAwould bemuch bigger than if the reason for the
signal were the presence of much more (cross-reactive) DNA
material.Whilemeasurements like Enterococcus and total DNA
concentrations are relatively simple to perform, they may not
be related to host-associated Bacteroidales data. Normalization
by total DNA concentration was effective in separating target
from non-target samples in this study. This result was likely
due to the fact that the samples contained only mixed fecal
material so that total DNA concentration was an adequate
proxy for the DNA concentration of the fecal bacteria pre-
dominant in the sample; this relationship is unlikely to hold
with real environmental samples. In contrast, normalization
by Enterococcus did not aid assay performance (Table S1,
supplementary data). Notably, the ratio of enterococci to
each MST marker is expected to vary. The Enterococcus popu-
lation can vary significantly in feces of different animals and
in relation to Bacteroidales and hence may not be optimal for
normalization (Silkie and Nelson, 2009; Ervin et al., 2013).
Normalization of these Bacteroidales-based MSTmarkers to
general Bacteroidales may provide a better method of normal-
ization. Correlations between host associated and general
Bacteroidales concentrations have been observed (Schriewer
et al., 2010; Silkie and Nelson, 2009), although variations for
individual fecal samples do occur. In this study, normalization
of host-associated Bacteroidales (DogBact and BacCan-UCD)
assays to general Bacteroidales (GenBac3 assay) improved
assay performance. Elimination of samples with less than 1%
of host-assay contribution towards the general Bacteroidales
concentration as non-target resulted in an improvement of
specificity from 0.83 to 0.96 for the DogBact assay and from
0.69 to 0.90 for the BacCan-UCD assay after standardization of
data treatment. The normalization of host-associated Bacter-
oidales with general Bacteroidales marker results for environ-
mental samples seems plausible, but criteria for the
identification of main sources need to be carefully considered
based on the assays tested.
5. Conclusions
Two MST assays for the detection of dog-associated Bacter-
oidales were tested by six (DogBact) and four (BacCan) labora-
tories against 64 created single-source and mixed-source
samples frompooled individual fecal samples collected across
California.
� Assay sensitivity and specificity depended on the way data
analysis was performed. Standardized data treatment of
standardcurveandsampledataregardingoutliers, lower limit
of quantification (LLOQ), non-detects (ND), and detected but
wat e r r e s e a r c h 4 7 ( 2 0 1 3 ) 6 9 0 9e6 9 2 0 6919
not quantifiable (DNQ) definitions, proved indispensable for
consistent determination of assay sensitivity and specificity.
� In this study, random non-target responses needed to be
separated from consistent ‘real’ non-target cross-reactivity
of assays.
� Normalization of host-target Bacteroidales data by general
Bacteroidales results (GenBac3 assay) helped eliminate
apparent cross-reactivity.
� The ability to treat data beyond binary presence-absence
observations was a marked advantage of qPCR compared
to PCR for assay validation studies.
� Both assays exhibited 100% average sensitivity with all pre-
sented normalization and non-normalization variations.
After standardized treatment the average specificitywas 83%
and 68%, for the DogBact and the BacCan-UCD assays,
respectively. Normalization by general Bacteroidales concen-
trations yielded 96% and 90% average specificity for DogBact
and BacCan-UCD, respectively, when dog-associated Bacter-
oidales proportions of less than one percent were considered
non-detect.
� Overall, given the variability of results among the eight
laboratories it can be concluded that both assays performed
equally well in this study.
Acknowledgments
This study was primarily funded by a Clean Beach Initiative
grant from the California Water Resources Control Board. It
was also supported in part by Oceans and Human Health
Center grants from NSF and NIEHS (NSF 0CE0432368/0911373
and NIEHS P50 ES12736, respectively). Work in the Wuertz
laboratory was funded by the Division of Environmental
Analysis of the California Department for Transportation
contract no. 43A0259. Information has been subjected to the
U.S. EPA Agency’s peer and administrative review and has
been approved for external publication. Any opinions
expressed in this paper are those of the author(s) and do not
necessarily reflect the official positions and policies of the
U.S. EPA. Any mention of trade names or commercial prod-
ucts does not constitute endorsement or recommendation
for use.
Appendix A. Supplementary data
Supplementary data related to this article can be found at
http://dx.doi.org/10.1016/j.watres.2013.03.062.
r e f e r e n c e s
Ahmed, W., Powell, D., Goonetilleke, A., Gardner, T., 2008.Detection and source identification of faecal pollution innon-sewered catchment by means of host-specificmolecular markers. Water Science and Technology 58 (3),579e586.
Armbruster, D.A., Pry, T., 2008. Limit of blank, limit of detectionand limit of quantitation. The Clinical Biochemist Reviews 29(Suppl. i), 49e52.
Bagcigil, A.F., Ikiz, S., Dokuzeylul, B., Basaran, B., Or, E.,Ozgur, N.Y., 2007. Fecal shedding of Salmonella spp. in dogs.Journal of Veterinary Medical Science 69 (7), 775e777.
Baptiste, K.E., Williams, K., Willams, N.J., Wattret, A., Clegg, P.D.,Dawson, S., Corkill, J.E., O’Neill, T., Hart, C.A., 2005.Methicillin-resistant staphylococci in companion animals.Emerging Infectious Diseases 11 (12), 1942e1944.
Boehm, A.B., Van De Werfhorst, L.C., Griffith, J.F., Holden, P.A.,Jay, J.A., Shanks, O.C., Wang, D., Weisberg, S.B., 2013.Performance of forty-one microbial source tracking methods:a twenty-seven laboratory evaluation study. Water Research47 (18), 6812e6828.
CODEX, 2010. Guidelines on Performance Criteria and Validationof Methods for Detection, Identification and Quantification ofSpecific DNA Sequences and Specific Proteins in Foods. CodexAlimentarius Commission e WHO, Rome. Codex Committeeon Methods of Analysis and Sampling CAC/GL 74-2010.
Damborg, P., Top, J., Hendrickx, A.P.A., Dawson, S.,Willems, R.J.L., Guardabassi, L., 2009. Dogs are a reservoir ofampicillin-resistant Enterococcus faecium lineages associatedwith human infections. Applied and EnvironmentalMicrobiology 75 (8), 2360e2365.
Dick, L.K., Bernhard, A.E., Brodeur, T.J., Domingo, J.W.S.,Simpson, J.M., Walters, S.P., Field, K.G., 2005a. Hostdistributions of uncultivated fecal Bacteroidales bacteria revealgenetic markers for fecal source identification. Applied andEnvironmental Microbiology 71 (6), 3184e3191.
Dick, L.K., Simonich, M.T., Field, K.G., 2005b. Microplatesubtractive hybridization to enrich for Bacteroidales geneticmarkers for fecal source identification. Applied andEnvironmental Microbiology 71 (6), 3179e3183.
Ebentier, D.L., Hanley, K.T., Cao, Y., Badgley, B., Boehm, A.B.,Ervin, J.S., Goodwin, K.D., Gourmelon, M., Griffith, J.F.,Holden, P.A., Kelty, C.A., Lozach, S., McGee, C., Peed, L.A.,Raith, M., Ryu, S., Sadowsky, M.J., Scott, E.A., SantoDomingo, J., Schriewer, A., Sinigalliano, C.D., Shanks, O.C.,Van de Werfhorst, L.C., Wang, D., Wuertz, S., Jay, J.A., 2013.Evaluation of the repeatability and reproducibility of a suiteof PCR-based microbial source tracking methods. WaterResearch 47 (18), 6839e6848.
Ervin, J.S., Russell, T.L., Layton, B.A., Yamahara, K.M., Wang, D.,Sassoubre, L.M., Cao, Y., Kelty, C.A., Sivaganesan, M.,Boehm, A.B., Holden, P.A., Weisberg, S.B., Shanks, O.C., 2013.Characterization of fecal concentrations in human and otheranimal sources by physical, culture-based, and quantitativereal-time PCR methods. Water Research 47 (18), 6883e6896.
Garfield, L., Walker, M., 2008. Microbial water quality andinfluences of fecal accumulation from a dog exercise area.Journal of Environmental Health 71 (4), 24e29.
Gookin, J.L., Stauffer, S.H., Coccaro, M.R., Marcotte, M.J.,Levy, M.G., 2007. Optimization of a species-specificpolymerase chain reaction assay for identification ofPentatrichomonas hominis in canine fecal specimens. AmericanJournal of Veterinary Research 68 (7), 783e787.
Hagedorn, C., Blanch, A.R., Harwood, V.J., 2011. Microbial SourceTracking: Methods, Applications, and Case Studies. Springer,New York.
Houf, K., De Smet, S., Bare, J., Daminet, S., 2008. Dogs as carriers ofthe emerging pathogen Arcobacter. Veterinary Microbiology130 (1e2), 208e213.
Kern, J., Petrauskas, B., McClellan, P., Shanholtz, V.O.,Hagedorn, C., 2002. Advances in water monitoring research.In: Younos, T. (Ed.), Water Resource Publications. LLC,Highlands Ranch, CO.
wat e r r e s e a r c h 4 7 ( 2 0 1 3 ) 6 9 0 9e6 9 2 06920
Kildare, B.J., Leutenegger, C.M., McSwain, B.S., Bambic, D.G.,Rajal, V.B., Wuertz, S., 2007. 16S rRNA-based assays forquantitative detection of universal, human-, cow-, anddog-specific fecal Bacteroidales: a Bayesian approach. WaterResearch 41 (16), 3701e3715.
Layton, B., Cao, Y., Ebentier, D., Hanley, K.T., Van DeWerfhorst, L.C., Wang, D., Madi, T., Whitman, R.,Byappanahalli, M., Balleste, E., Meijer, W.G., Schriewer, A.,Wuertz, S., Converse, R., Noble, R., Srinivasan, S., Rose, J., SooLee, C.S., Lee, J., Sheilds, J., Stewart, J., Reischer, G.,Farnleitner, A., Sinigalliano, C.D., Rodrigues, R., Lozach, S.,Gourmelon, M., Peed, L., Shanks, O., Jay, J.A., Holden, P.A.,Boehm, A.B., Griffith, J.F., 2013. Performance of human fecalanaerobe-associated PCR-based assays in a multi-laboratorymethod evaluation study. Water Research 47 (18), 6897e6908.
Lee, D.Y., Weir, S.C., Lee, H., Trevors, J.T., 2010. Quantitativeidentification of fecal water pollution sources by TaqMan real-time PCR assays using Bacteroidales 16S rRNA genetic markers.Applied Microbiology and Biotechnology 88 (6), 1373e1383.
Moodley, A., Stegger, M., Bagcigil, A.F., Baptiste, K.E., Loeffler, A.,Lloyd, D.H., Williams, N.J., Leonard, N., Abbott, Y., Skov, R.,Guardabassi, L., 2006. spa typing of methicillin-resistantStaphylococcus aureus isolated from domestic animals andveterinary staff in the UK and Ireland. Journal of AntimicrobialChemotherapy 58 (6), 1118e1123.
Nuttall, T., Williams, N., Saunders, R., Dawson, S., 2008.Methicillin-resistant staphylococci in companion animals.European Journal of Companion Animal Practice 18, 280e282.
Papini, R., Marangi, M., Mancianti, F., Giangaspero, A., 2009.Occurrence and cyst burden of Giardia duodenalis in dog faecaldeposits from urban green areas: implications forenvironmental contamination and related risks. PreventiveVeterinary Medicine 92 (1e2), 158e162.
Raith, M.R., Kelty, C.A., Griffith, J.F., Schriewer, A., Wuertz, S.,Mieszkin, S., Gourmelon, M., Reischer, G., Farnleitner, A.H.,Ervin, J., Holden, P.A., Ebentier, D.L., Jay, J.A., Boehm, A.B.,Aw, T.G., Rose, J.B., Meijer, W.G., Balleste, E., Sivaganesan, M.,Shanks,O.C., 2013.ComparisonofPCRandquantitativereal-timePCRmethods for the characterization of ruminant and cattlefecal pollution sources. Water Research 47 (18), 6909e6920.
Reischer, G.H., Kasper, D.C., Steinborn, R., Mach, R.L.,Farnleitner, A.H., 2006. Quantitative PCR method for sensitivedetection of ruminant fecal pollution in freshwater andevaluation of this method in alpine karstic regions. Appliedand Environmental Microbiology 72 (8), 5610e5614.
Rosario, K., Nilsson, C., Lim, Y.W., Ruan, Y.J., Breitbart, M., 2009.Metagenomic analysis of viruses in reclaimed water.Environmental Microbiology 11 (11), 2806e2820.
Schriewer, A., Miller, W.A., Byrne, B.A., Miller, M.A., Oates, S.,Conrad, P.A., Hardin, D., Yang, H.H., Chouicha, N., Melli, A.,Jessup, D., Dominik, C., Wuertz, S., 2010. Presence ofBacteroidales as a predictor of pathogens in surface waters ofthe central California coast. Applied and EnvironmentalMicrobiology 76 (17), 5802e5814.
Shanks, O.C., White, K., Kelty, C.A., Hayes, S., Sivaganesan, M.,Jenkins, M., Varma, M., Haugland, R.A., 2010a. Performanceassessment PCR-based assays targeting Bacteroidales geneticmarkers of bovine fecal pollution. Applied and EnvironmentalMicrobiology 76 (5), 1359e1366.
Shanks, O.C., White, K., Kelty, C.A., Sivaganesan, M., Blannon, J.,Meckes, M., Varma, M., Haugland, R.A., 2010b. Performance ofPCR-based assays targeting Bacteroidales genetic markers ofhuman fecal pollution in sewage and fecal samples.Environmental Science and Technology 44 (16), 6281e6288.
Silkie, S.S., Nelson, K.L., 2009. Concentrations of host-specific andgeneric fecal markers measured by quantitative PCR in rawsewage and fresh animal feces. Water Research 43 (19),4860e4871.
Sinigalliano, C.D., Ervin, J., Van De Werfhorst, L.C., Badgley, B.,Balleste, E., Bartkowiak, J., Boehm, A.B., Byappanahalli, M.,Goodwin, K.D., Gourmelon, M., Griffith, J.F., Holden, , Jay, J.A.,Layton, B., Lee, C.S., Lee, J., Meijer, W.G., Noble, R., Raith, M.,Ryu, H., Sadowsky, M.J., Schriewer, A., Wang, D., Wanless, D.,Whitman, R., Wuertz, S., Domingo, J.W.S. Multi-laboratoryevaluations of the performance of Catellicoccusmarimammalium PCR assays developed to target gull fecalsources. Water Research 47 (18), 6883e6896.
Sinigalliano, C.D., Fleisher, J.M., Gidley, M.L., Solo-Gabriele, H.M.,Shibata, T., Plano, L.R.W., Elmir, S.M., Wanless, D.,Bartkowiak, J., Boiteau, R., Withum, K., Abdelzaher, A.M.,He, G.Q., Ortega, C., Zhu, X.F., Wright, M.E., Kish, J.,Hollenbeck, J., Scott, T., Backer, L.C., Fleming, L.E., 2010.Traditional and molecular analyses for fecal indicator bacteriain non-point source subtropical recreational marine waters.Water Research 44 (13), 3763e3772.
Stewart, J.R., Boehm, A.B., Dubinsky, E.A., Tong, T.-T.,Goodwin, K.D., Griffith, J.F., Vijayavel, K., Noble, R.T.,Shanks, O.C., Weisberg, S.B., 2013. Recommendationsfollowing a multi-laboratory comparison of microbial sourcetracking methods. Water Research 47 (18), 6829e6838.
Tambalo, D.D., Fremaux, B., Boa, T., Yost, C.K., 2012a.Persistence of host-associated Bacteroidales gene markersand their quantitative detection in an urban andagricultural mixed prairie watershed. Water Research 46(9), 2891e2904.
Tambalo, D.D., Boa, T., Liljebjelke, K., Yost, C.K., 2012b. Evaluationof two quantitative PCR assays using Bacteroidales andmitochondrial DNA markers for tracking dog fecalcontamination in waterbodies. Journal of MicrobiologicalMethods 91 (3), 459. (RLIN).
Tringe, S.G., Rubin, E.M., 2005. Metagenomics: DNA sequencing ofenvironmental samples. Nature Reviews Genetics 6 (11),805e814.
US-EPA, 2006. In: Water, O.O. (Ed.), Method 1600: Enterococci inWater by Membrane Filtration Using Membrane-EnterococcusIndoxyl-beta-D-Glucoside Agar (mEI), EPA 821-R-06e009EPA-821-R-06-009. U.S. Environmental Protection Agency:Office of Water.
US-EPA, 2010. In: Method B: Bacteroidales in Water by TaqManQuantitative Polymerase Chain Reaction (qPCR) Assay,EPA-822-R-10e003. U.S. Environmental Protection Agency:Office of Water.
Wang, D., Silkie, S.S., Nelson, K.L., Wuertz, S., 2010. Estimatingtrue human and animal host source contribution inquantitative microbial source tracking using the Monte Carlomethod. Water Research 44 (16), 4760e4775.
Weese, J.S., Dick, H., Willey, B.M., McGeer, A., Kreiswirth, B.N.,Innis, B., Low, D.E., 2006. Suspected transmission ofmethicillin-resistant Staphylococcus aureus between domesticpets and humans in veterinary clinics and in the household.Veterinary Microbiology 115 (1e3), 148e155.
Wright, M.E., Solo-Gabriele, H.M., Elmir, S., Fleming, L.E., 2009.Microbial load from animal feces at a recreational beach.Marine Pollution Bulletin 58 (11), 1649e1656.
Zhu, X.F., Wang, J.D., Solo-Gabriele, H.M., Fleming, L.E., 2011. Awater quality modeling study of non-point sources atrecreational marine beaches. Water Research 45 (9),2985e2995.