Performance, Energy and Thermal Considerations of SMT and CMP architectures Yingmin Li, David...
19
Performance, Energy and Thermal Considerations of SMT and CMP architectures Yingmin Li, David Brooks, Zhigang Hu, Kevin Skadron Dept. of Computer Science, University of Virginia Division of Engineering and Applied Sciences, Havard Un iversity IBM T.J.Watson Research Center
-
Upload
kathleen-calver -
Category
Documents
-
view
218 -
download
0
Transcript of Performance, Energy and Thermal Considerations of SMT and CMP architectures Yingmin Li, David...
Performance, Energy and Thermal Considerations of SMT and CMP architectures
Yingmin Li, David Brooks, Zhigang Hu, Kevin Skadron
Dept. of Computer Science, University of VirginiaDivision of Engineering and Applied Sciences, Havard University
IBM T.J.Watson Research Center
2
© 2
005,
Yin
gmin
Li
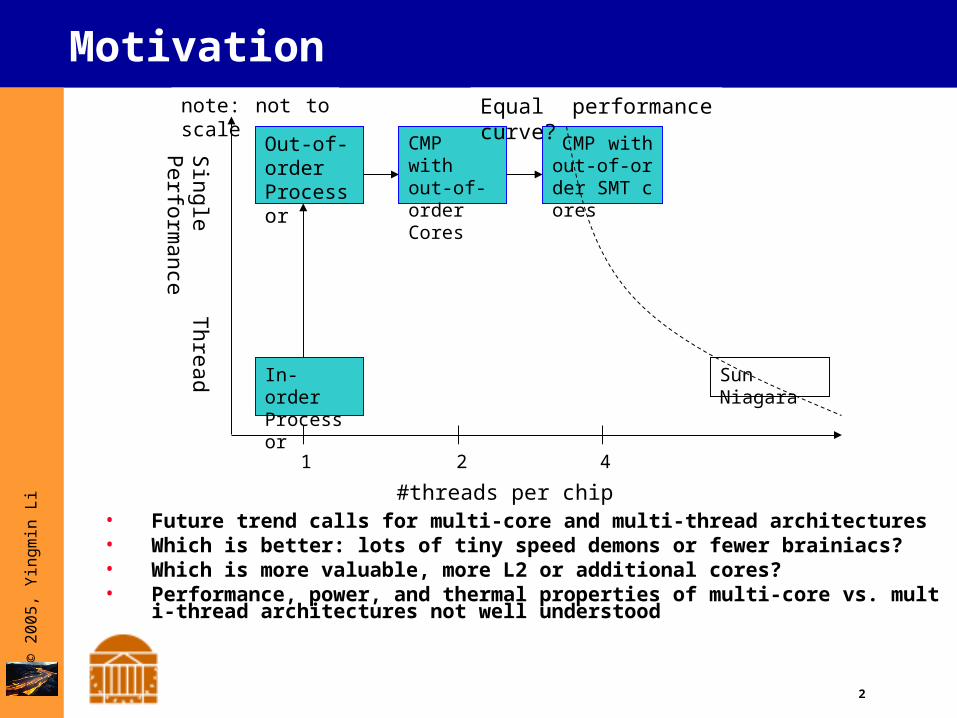
Motivation
• Future trend calls for multi-core and multi-thread architectures• Which is better: lots of tiny speed demons or fewer brainiacs?• Which is more valuable, more L2 or additional cores?• Performance, power, and thermal properties of multi-core vs. multi-thread arch
itectures not well understood
In-order Processor
Out-of-order Processor
CMP with out-of-order Cores
CMP with out-of-order SMT cores
Sun Niagara
Single T
hread Perform
ance
note: not to scale
1 2 4
#threads per chip
Equal performance curve?
3
© 2
005,
Yin
gmin
Li
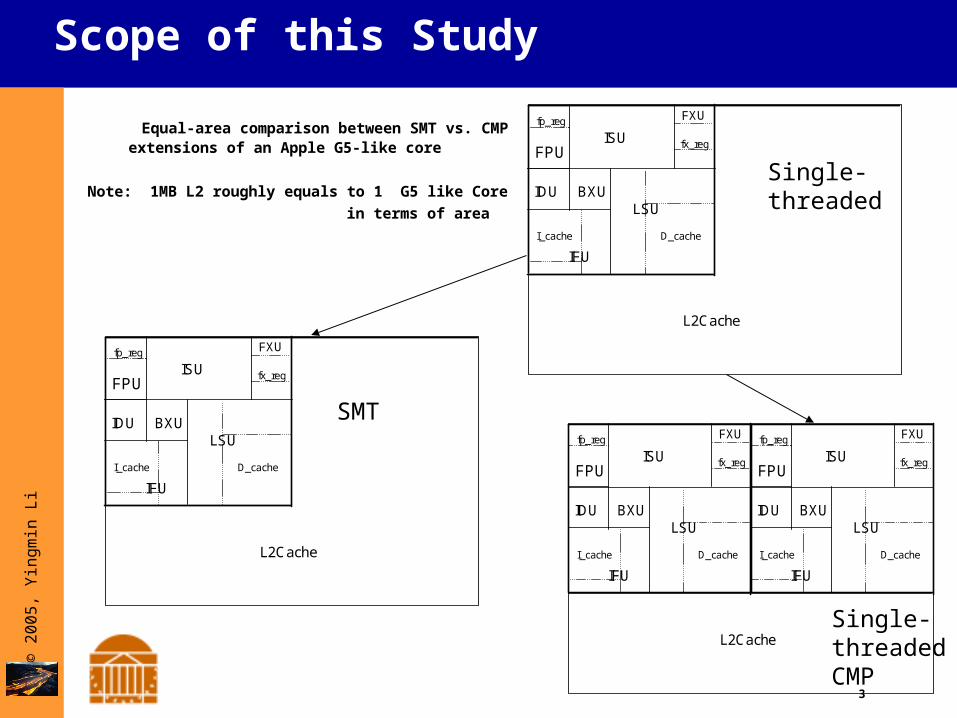
Scope of this Study
Equal-area comparison between SMT vs. CMP extensions of an Apple G5-like core
Note: 1MB L2 roughly equals to 1 G5 like Core
in terms of area
ISUfp_reg FXU
fx_regFPU
IDU BXU
I_cache D_cache
IFU
LSU
L2Cache
L2Cache
ISUfp_reg FXU
fx_regFPU
IDU BXU
I_cache D_cache
IFU
LSU
ISUfp_reg FXU
fx_regFPU
IDU BXU
I_cache D_cache
IFU
LSU
ISUfp_reg FXU
fx_regFPU
IDU BXU
I_cache D_cache
IFU
LSU
L2Cache
Single- threaded
SMT
Single-threaded CMP
4
© 2
005,
Yin
gmin
Li
Outline
• Modeling / Model Validation
• SMT vs. CMP performance, power and thermal analysis (without DTM)
• SMT vs. CMP performance, power and thermal analysis (with DTM)
• Conclusions and future work
5
© 2
005,
Yin
gmin
Li
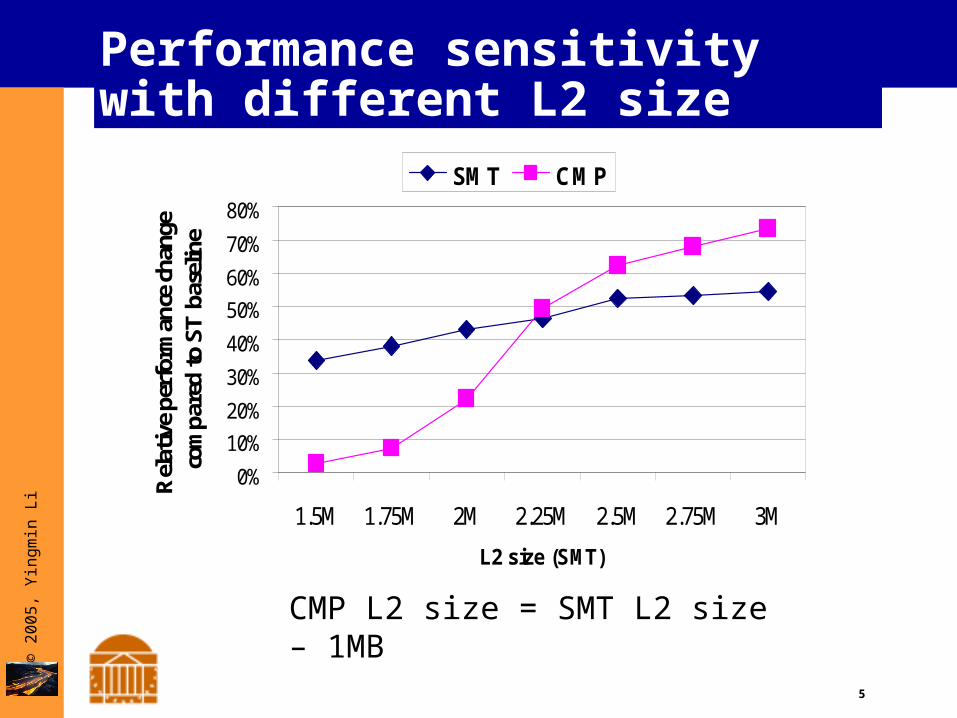
Performance sensitivity with different L2 size
0%
10%
20%
30%
40%
50%
60%
70%
80%
1.5M 1.75M 2M 2.25M 2.5M 2.75M 3M
L2 size (SMT)
Rel
ativ
e pe
rfor
man
ce c
hang
e co
mpa
red
to S
T b
asel
ine
SMT CMP
CMP L2 size = SMT L2 size – 1MB

6
© 2
005,
Yin
gmin
Li
Modeling and Validation
• Performance: Turandot with SMT and CMP augmentations, validated against Power4 preRTL model
• Power: PowerTimer with SMT and CMP augmentations, validated against CPAM power data extracted from circuit
• Temperature: Hotspot from UVA integrated with Turandot/PowerTimer, validated with test chips at UVA
7
© 2
005,
Yin
gmin
Li
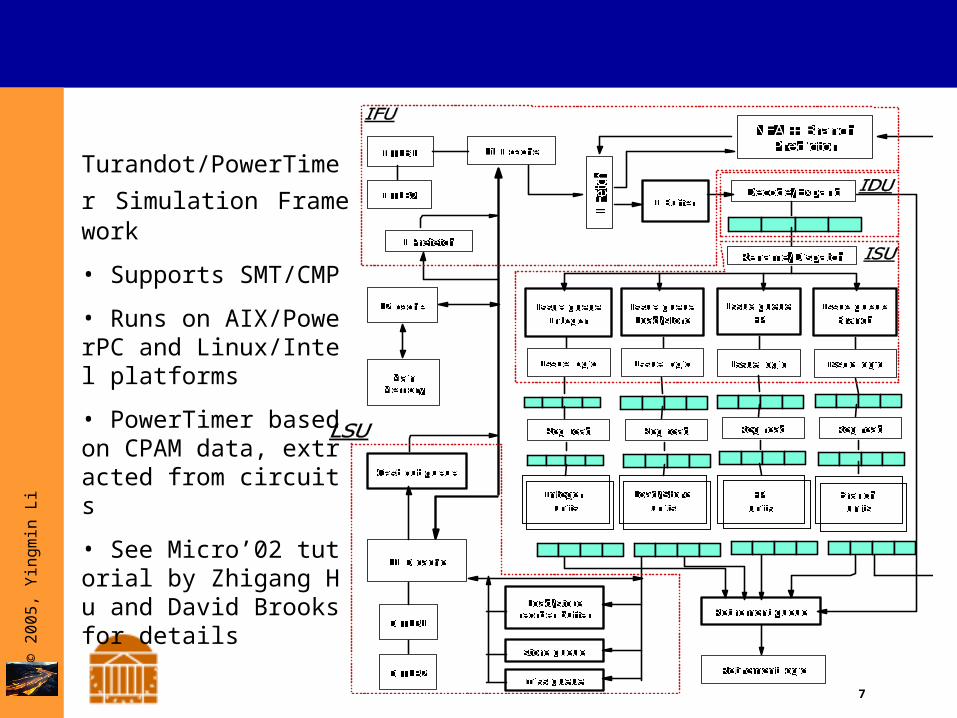
Turandot/PowerTimer Si
mulation Framework
• Supports SMT/CMP
• Runs on AIX/PowerPC and Linux/Intel platforms
• PowerTimer based on CPAM data, extracted from circuits
• See Micro’02 tutorial by Zhigang Hu and David Brooks for details
8
© 2
005,
Yin
gmin
Li
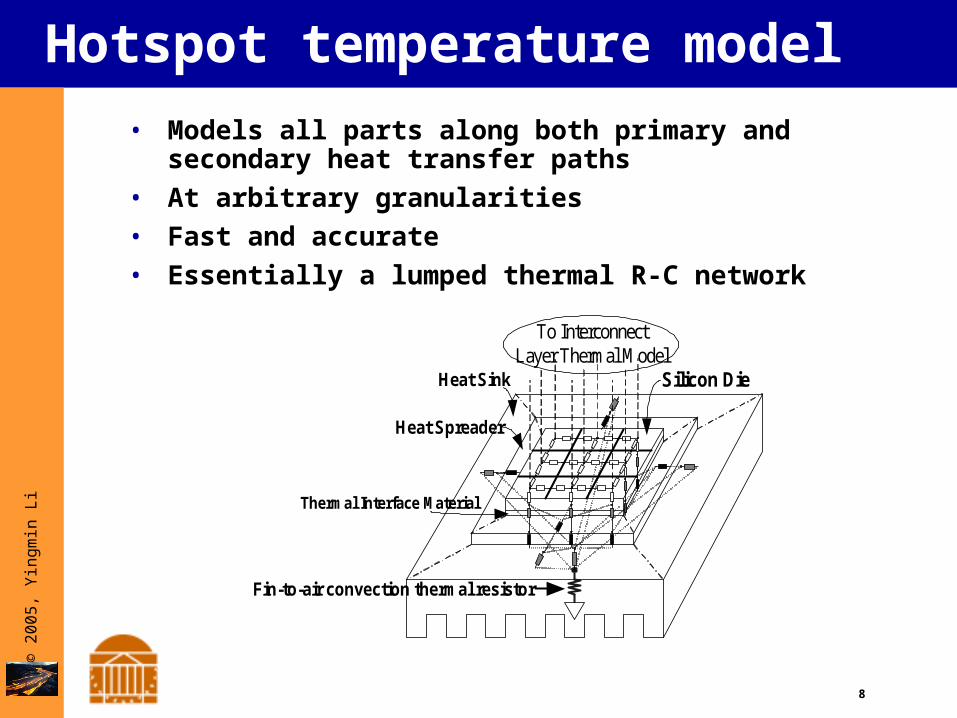
Hotspot temperature model
To InterconnectLayer Thermal Model
Heat Sink Silicon Die
Heat Spreader
Thermal Interface Material
Fin-to-air convection thermal resistor
• Models all parts along both primary and secondary heat transfer paths
• At arbitrary granularities
• Fast and accurate
• Essentially a lumped thermal R-C network

9
© 2
005,
Yin
gmin
Li
Peak Temperature of The Hottest Spot for SMT and CMP
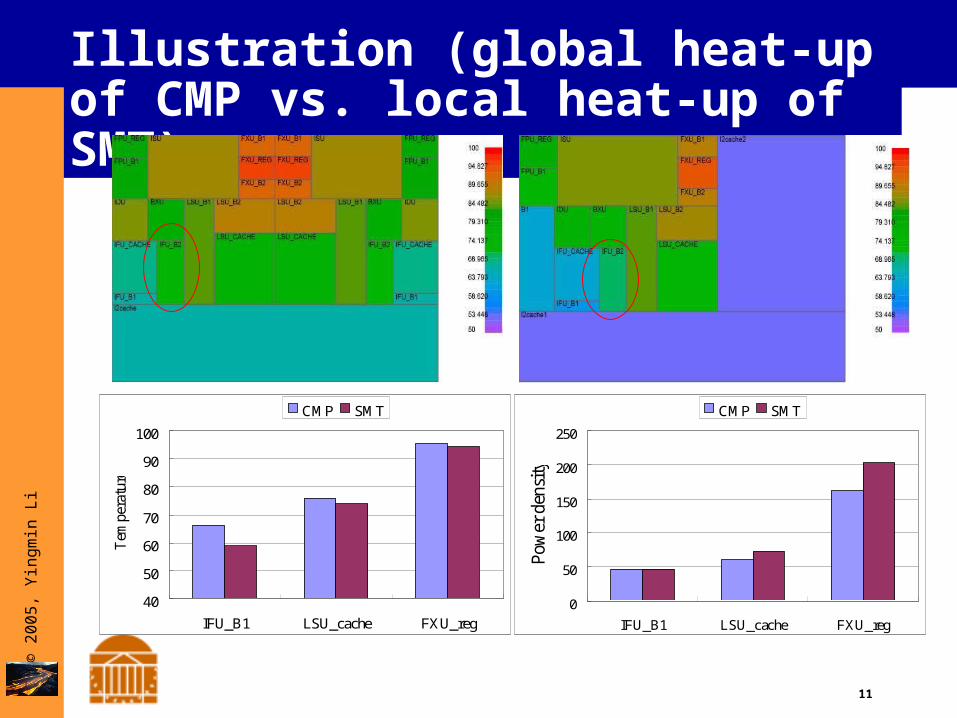
3 heat-up mechanisms
• Unit self heating determined by the power density of the unit
• Global heating through TIM (thermal interface material) and spreader
• Lateral thermal coupling between neighboring units
50
55
60
65
70
75
80
85
90
95
Tem
per
atu
re (
Cel
siu
s)
10
© 2
005,
Yin
gmin
Li
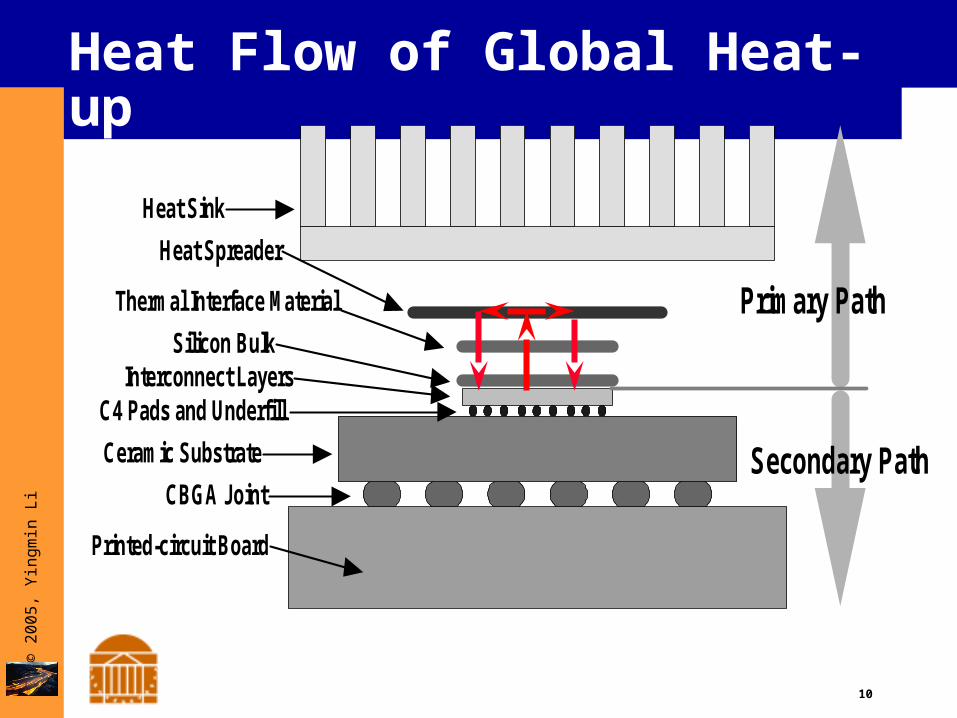
Heat Flow of Global Heat-up
Heat Sink
Heat Spreader
Thermal Interface Material
Silicon BulkInterconnect Layers
C4 Pads and Underfill
Ceramic Substrate
CBGA Joint
Printed-circuit Board
Primary Path
Secondary Path
11
© 2
005,
Yin
gmin
Li
Illustration (global heat-up of CMP vs. local heat-up of SMT)
40
50
60
70
80
90
100
IFU_B1 LSU_cache FXU_reg
Tem
pera
ture
CMP SMT
0
50
100
150
200
250
IFU_B1 LSU_cache FXU_reg
Pow
er d
ensi
ty
CMP SMT
12
© 2
005,
Yin
gmin
Li
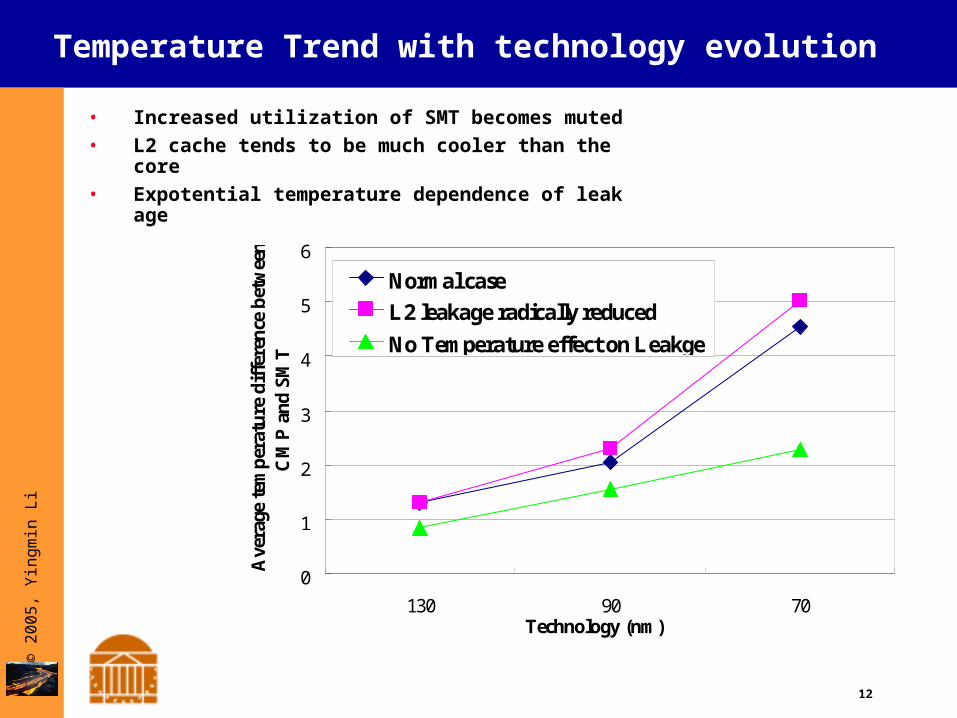
Temperature Trend with technology evolution
0
1
2
3
4
5
6
130 90 70Technology (nm)
Ave
rage
tem
per
atu
re d
iffe
ren
ce b
etw
een
CM
P a
nd
SM
TNormal case
L2 leakage radically reduced
No Temperature effect on Leakge
• Increased utilization of SMT becomes muted
• L2 cache tends to be much cooler than the core
• Expotential temperature dependence of leakage

13
© 2
005,
Yin
gmin
Li
SMT vs. CMP performance and power efficiency analysis (without DTM)
-80%-60%-40%-20%
0%20%40%60%80%
100%120%140%160%180%200%
IPC
PO
WE
R
EN
ER
GY
EN
ER
GY
DE
LA
Y
EN
ER
GY
DE
LA
Y^2
Rel
ativ
e ch
ange
com
pare
d to
ST
bas
elin
e
2-way SMT dual-core CMP
SMT is superior for memory bound(high-l2-cache-miss rate) benchmarks while CMP is superior for non memory bound benchmarks
Compute-bound Memory-bound
-80%-60%-40%-20%
0%20%40%60%80%
100%120%140%160%180%200%
IPC
PO
WE
R
EN
ER
GY
EN
ER
GY
DE
LA
Y
EN
ER
GY
DE
LA
Y^2
Rel
ativ
e ch
ange
com
pare
d to
ST
bas
elin
e
2-way SMT dual-core CMP

14
© 2
005,
Yin
gmin
Li
The impact of changing L2 size: Examples
-80%
-60%
-40%
-20%
0%
20%
40%
60%
80%
100%
IPC
POW
ER
EN
ER
GY
EN
ER
GY
DE
LA
Y
EN
ER
GY
DE
LA
Y^2
Rel
ativ
e ch
ange
com
pare
d w
ith
bas
elin
e ST
wit
h2M
B L
2
SMT with 2MB L2 SMT with 3MB L2
CMP with 1MB L2 CMP with 2MB L213.26.092.54
MCF+MCF MCF+VPR
Stays memory bound when L2 size changes
Changes from memory bound to non memory bound when L2 size changes
-80%
-60%
-40%
-20%
0%
20%
40%
60%
80%
100%
IPC
POW
ER
EN
ER
GY
EN
ER
GY
DE
LA
Y
EN
ER
GY
DE
LA
Y^2
Rel
ativ
e ch
ange
com
par
ed w
ith
bas
elin
e S
T w
ith
2MB
L2
SMT with 2MB L2 SMT with 3MB L2
CMP with 1MB L2 CMP with 2MB L21.35 2.33 3.72
15
© 2
005,
Yin
gmin
Li
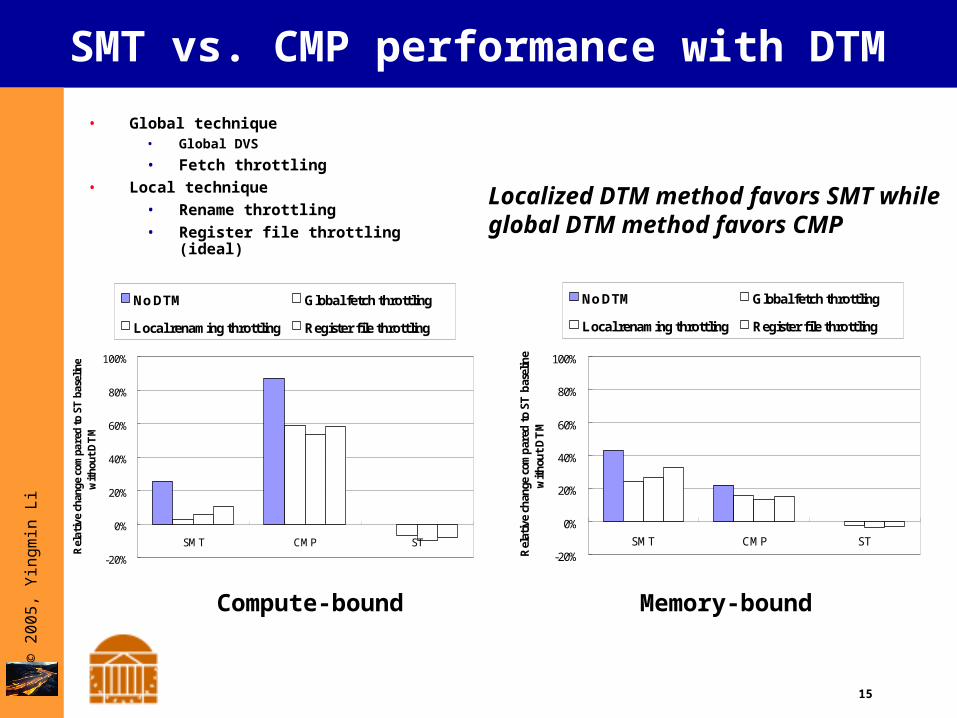
SMT vs. CMP performance with DTM
-20%
0%
20%
40%
60%
80%
100%
SMT CMP ST
Rel
ativ
e ch
ange
com
pare
d to
ST
bas
elin
ew
itho
ut D
TM
No DTM Global fetch throttling
Local renaming throttling Register file throttling
Localized DTM method favors SMT while global DTM method favors CMP
• Global technique• Global DVS
• Fetch throttling
• Local technique
• Rename throttling
• Register file throttling (ideal)
Compute-bound Memory-bound
-20%
0%
20%
40%
60%
80%
100%
SMT CMP ST
Rel
ativ
e ch
ange
com
pare
d to
ST
bas
elin
ew
ith
out
DT
M
No DTM Global fetch throttling
Local renaming throttling Register file throttling

16
© 2
005,
Yin
gmin
Li
SMT energy efficiency with DTM
-80%
-60%
-40%
-20%
0%
20%
40%
60%
80%
100%
POWER ENERGY ENERGYDELAY
ENERGYDELAY^2
Rel
ativ
e ch
ange
com
par
ed w
ith
bas
elin
ew
ith
out
DT
M
No DTM Fetch throttling
Rename throttling Register file throttling
Localized method can lead to better energy-delay product result compared with global method in some cases.
Compute-bound Memory-bound
-80%
-60%
-40%
-20%
0%
20%
40%
60%
80%
100%
POWER ENERGY ENERGYDELAY
ENERGYDELAY^2
Rel
ativ
e ch
ange
com
par
ed w
ith
bas
elin
ew
ith
out
DT
M
No DTM Fetch throttling
Rename throttling Register file throttling
17
© 2
005,
Yin
gmin
Li
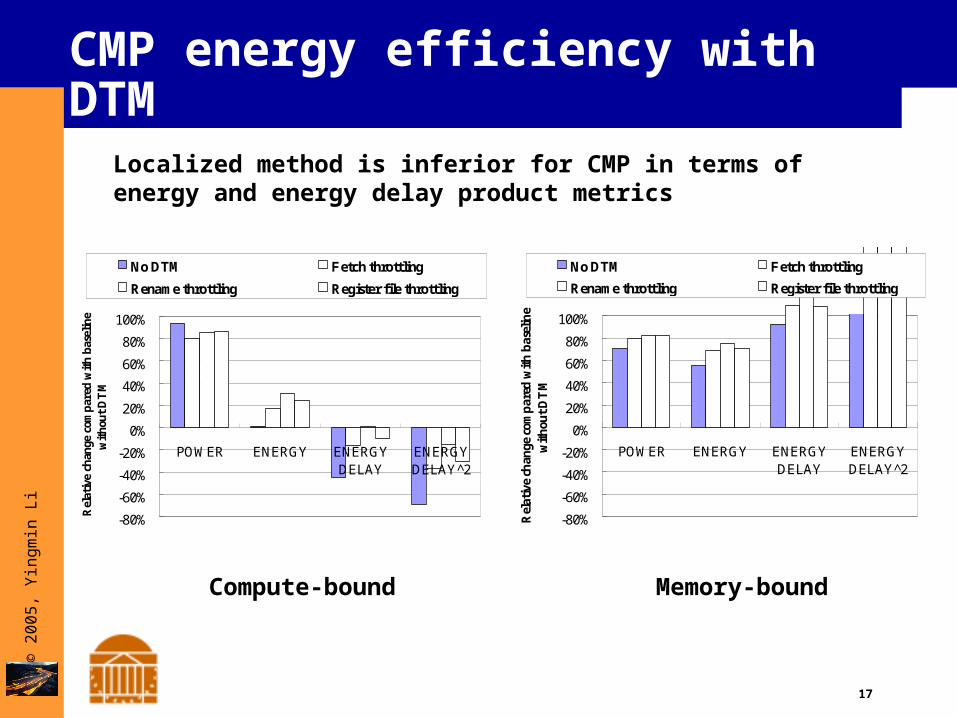
CMP energy efficiency with DTM
-80%
-60%
-40%
-20%
0%
20%
40%
60%
80%
100%
POWER ENERGY ENERGYDELAY
ENERGYDELAY^2
Rel
ativ
e ch
ange
com
pare
d w
ith
base
line
wit
hout
DT
M
No DTM Fetch throttling
Rename throttling Register file throttling
Localized method is inferior for CMP in terms of energy and energy delay product metrics
Compute-bound Memory-bound
-80%
-60%
-40%
-20%
0%
20%
40%
60%
80%
100%
POWER ENERGY ENERGYDELAY
ENERGYDELAY^2
Rel
ativ
e ch
ange
com
par
ed w
ith
bas
elin
ew
ith
out
DT
M
No DTM Fetch throttling
Rename throttling Register file throttling1.10
1.211.09 1.9
2.172.37
2.061.94
2.07
18
© 2
005,
Yin
gmin
Li
Conclusions
• With the same chip area, SMT performs better than CMP for memory bound benchmarks while CMP performs better than SMT for non memory bound benchmarks with Apple G5 like architecture.
• The thermal heating effects are quite different for CMP and SMT
• CMP machines are clearly hotter than SMT machines with leaky technology
• Different DTM technique favors different architecture
19
© 2
005,
Yin
gmin
Li
Future Work
• Consider significantly larger amounts of thread-level parallelism and hybrids between CMP and SMT cores
• The impact of varying core complexity on the performance of SMT and CMP, and explore a wider range of design options, like SMT fetch policies.
• Explore server-oriented workloads