Performance comparison and investigation of two different ...
17
J Ther Eng, Vol. 7, No. 5, pp. 1039–1055, July, 2021 ABSTRACT In this study, the comprehensive thermodynamic, exergoeconomic and environmental per- formance of two multigeneration systemsfuelled by biomass and solar energy is surveyed. e multigeneration system A utilizes municipal solid waste and solar energy to produce power, heating, cooling, fresh water, and hydrogen which is considered to be located in the north of Iran with a moderate climate. Whereas, the multigeneration system B consumes bagasse and solar energy to supply power, heating, cooling, liquefied natural gas, and freshwater which is assumed to be located in the south of Iran with a hot climate. e results of the study show thatsystem B provides better performance from a thermodynamic viewpoint with energy and exergy efficiencies of 82.45% and 15.75%. Moreover, according to the outputs of exergoeco- nomic modelling, system B presents better performance because of lower capital costs. Finally, environmental profit is attained by accomplishing system B because of avoiding 1.14 million tons of NO x and 0.31 million tons of CO 2 depletion to the atmosphere per year. In the end, through conducting a parametric study, the effect of key parameters on the thermodynamic, economic, and environmental performances of two systems is discussed. Cite this article as: Heidarnejad P, Noorpoor A. Performance comparison and investigation of two different renewable energy fueled multigeneration systems. J Thermal Eng 2021;7(5):1039-1055. Journal of ermal Engineering Web page info: https://jten.yildiz.edu.tr DOI: 10.18186/thermal.977707 Research Article Performance comparison and investigation of two different renewable energy fueled multigeneration systems Parisa HEIDARNEJAD 1 , Alireza NOORPOOR 1, * 1 School of Environment, College of Engineering, University of Tehran, Tehran, Iran ARTICLE INFO Article history Received: 22 May 2019 Accepted: 21 August 2019 Key words: Biomass; Environmental assessment; Exergoeconomic; Exergy; Multigeneration; Solar Published by Yıldız Technical University Press, İstanbul, Turkey Copyright 2021, Yıldız Technical University. is is an open access article under the CC BY-NC license (http://creativecommons.org/licenses/by-nc/4.0/). *Corresponding author. *E-mail address: [email protected] This paper was recommended for publication in revised form by Regional Editor Mustafa Kılıç INTRODUCTION In recent years, researchers have focused on renewable energy fuelled integrated energy systems as a promoted solution to enhance the efficiency of energy systems, lower fossil fuel depletion and lower environmental effects. Multi-generation systems are presented as energy systems which have the ability to supply different commodities simultaneously. Due to the complexity of the multi-gen- eration systems, the arrangement, demand type, climate zone, and the available energy sources, the design of these systems necessitates detailed examination. erefore, applying a universal model to extract the design of the
Transcript of Performance comparison and investigation of two different ...
J Ther Eng, Vol. 7, No. 5, pp. 1039–1055, July, 2021
ABSTRACT
In this study, the comprehensive thermodynamic, exergoeconomic and environmental per-formance of two multigeneration systemsfuelled by biomass and solar energy is surveyed. The multigeneration system A utilizes municipal solid waste and solar energy to produce power, heating, cooling, fresh water, and hydrogen which is considered to be located in the north of Iran with a moderate climate. Whereas, the multigeneration system B consumes bagasse and solar energy to supply power, heating, cooling, liquefied natural gas, and freshwater which is assumed to be located in the south of Iran with a hot climate. The results of the study show thatsystem B provides better performance from a thermodynamic viewpoint with energy and exergy efficiencies of 82.45% an d 15.75%. Mo reover, according to th e ou tputs of exergoeco-nomic modelling, system B presents better performance because of lower capital costs. Finally, environmental profit is attained by accomplishing system B because of avoiding 1.14 million tons of NOx and 0.31 million tons of CO2 depletion to the atmosphere per year. In the end, through conducting a parametric study, the effect of key parameters on the thermodynamic, economic, and environmental performances of two systems is discussed.
Cite this article as: Heidarnejad P, Noorpoor A. Performance comparison and investigation of two different renewable energy fueled multigeneration systems. J Thermal Eng 2021;7(5):1039-1055.
Journal of Thermal EngineeringWeb page info: https://jten.yildiz.edu.tr
DOI: 10.18186/thermal.977707
Research Article
Performance comparison and investigation of two different renewable energy fueled multigeneration systems
Parisa HEIDARNEJAD1 , Alireza NOORPOOR1,*1School of Environment, College of Engineering, University of Tehran, Tehran, Iran
ARTICLE INFO
Article historyReceived: 22 May 2019Accepted: 21 August 2019
Key words:Biomass; Environmental assessment; Exergoeconomic; Exergy; Multigeneration; Solar
Published by Yıldız Technical University Press, İstanbul, TurkeyCopyright 2021, Yıldız Technical University. This is an open access article under the CC BY-NC license (http://creativecommons.org/licenses/by-nc/4.0/).
*Corresponding author.*E-mail address: [email protected]
This paper was recommended for publication in revised form by Regional Editor Mustafa Kılıç
INTRODUCTIONIn recent years, researchers have focused on renewable
energy fuelled integrated energy systems as a promoted solution to enhance the efficiency of energy systems, lower fossil fuel depletion and lower environmental effects. Multi-generation systems are presented as energy systems
which have the ability to supply different commodities simultaneously. Due to the complexity of the multi-gen-eration systems, the arrangement, demand type, climate zone, and the available energy sources, the design of these systems necessitates detailed examination. Therefore, applying a universal model to extract the design of the

J Ther Eng, Vol. 7, No. 5, pp. 1039–1055, July, 20211040
system is fundamental. Several studies have focused on energy, exergy, economic and environmental analyses of multi-generation systems with renewable energies as input. For example, Boyaghchi and Heidarnejad [1] pro-posed the model of a CCHP (CombinedCooling, Heating and Power) system with the purpose of thermodynamic and thermoeconomic and determined the optimum design of the system by employing GA (Genetic Algorithm). Findings showed that exergy efficiency and product cost rate increases by 27% and 17% in summer cases and 13% and 4% in winter cases. Economic and environmental analyses of a biomass fed multi-generation system were carried out by Jana and De [2]. Results presented that up to 20% reduction in energy consumption and 25kt/y avoidance of CO2 discharge is achievable. Caliskan [3] performed a comparative analysis of renewable and nat-ural gas as energy sources for a building including ther-modynamic, economic and environmental viewpoints. It was presented that the system with solar energy is the most favourable. Noorpoor et al. [4] suggested a thermo-dynamic model for a multi-generation system based on biomass and solar energy with the purpose of generating electricity, water, cooling, and heating. The role of applying optimisation methods in trigeneration systems was repre-sented by Al Moussawi et al. [5] in which the categories of optimisation and decision making methods were investi-gated. In a study, Bellos and Tzivanidis [6] proposed a solar fuelledtrigeneration system operating with different fluids. They presented that Toluene yields the best performance. Khanmohammadi et al. [7]developed a comprehensive model for a solar-based integrated system. In a study, Di Somma et al. [8] introduced the distributed energy systems as a promising alternative for sustainable development. They applied the exergy principles as a complementary tool to economic assessment to design a sustainable energy supply. The innovation of this research is specifying the best structure of the distributed energy system regarding minimising total annual cost and maximising the exergy efficiency. The results showed that the total annual cost is reduced by 21% while the exergy input to the system is reducedby 36% in the optimal case in comparison to the base case. Calise et al. [9]suggested a novel multi-genera-tion system for an island in Italy to provide electric power, freshwater, cooling, and heating consuming solar and geothermal sources. Ganjehsarabi et al. [10] conducted the thermodynamic modelling of a solar-assisted inte-grated system in terms of energy and exergy analyses. They pointed out that by integrating the solar organic Rankine cycle, its exergy efficiency improves about 5%. In compar-ative research, Sahoo et al. [11] studied the advantages of a solar and biomass-fuelled multi-generation system. Results indicate that the studied system has the potential to pro-duce energy 78.12% higher than the conventional system. Bellos and Tzivanidis [12]performed the optimisation of a solar-based CCHP system. In this study, thermodynamic
efficiencies and savings cash flow were nominated as the objective functions. The thermodynamic modelling of an integrated energy system applying waste energy of bio-mass gasification was evaluated by Boyaghchi et al. [13]. In the mentioned research, two decision-makers were intro-duced to define the optimum scheme. Thermodynamic, thermoeconomic andmulti-criteriaoptimisation of bio-mass and solar fuelledmulti-generation system was con-ducted by Ghasemi et al. [14]. Multi-objectiveoptimisation caused to extract the Pareto front. In another work, the prediction of the performance of a novel polygeneration system based on biomass gasification was performed by Khanmohammadi and Atashkari [15]. In this study, the findings of exergy modelling presented that the gasifier and combustion chamber contributes 84% of the total irrevers-ibilities. Moreover, the multi-criteriaoptimisation using GA has been applied in this research to find the optimal states of the studied configuration considering two con-flicting objective functions such as exergy efficiency and total cost rate. Yilmaz [16]performed the sensitive analy-sis of a solar-based multi-generation system considering the thermodynamic aspect. It resulted that the mentioned system produces 19MW electricity with energy and exergy efficiencies of 79% and 48%, respectively. Wang et al. [17]developed a detailed optimisation model of an integrated energy system regarding economics, autonomy and car-bon emissions. In a different study including energy and exergy analysis of fuel cell-based integrated energy system, Nalbant et al. [18] presented a novel approach of assessing the integrated energy system with renewable sources. The results demonstrated that the stoichiometric ratio of the anode is the most influential parameter which affect the exergetic efficiency up to 37.4%. Ganjehsarabi [19] inves-tigated the thermodynamic and thermoeconomic perfor-mances of a geothermal based integrated energy system by trying different mixed refrigerants as the working fluid of the cycle.
Since the type of demand, environmental conditions like the type of biomass and the intensity of solar radia-tion and environment temperature are associated to the climate zone; it is one of the parameters which affect the efficiency of multi-generation systems. Some studies have surveyed the effect of the climate zone on the productiv-ity of the multi-generation systems. Mateus and Oliveira [20] evaluated the performance of a solar fuelled inte-grated energy system for three different climate zone inGermany, Portugal, and Italy as well as for three types ofbuilding such as residential, hotel and office. comprehen-sive assessment of a BCCHP (Building Combined CoolingHeating and Power) system for five climate zones of Chinawere investigated by Jiang-Jiang et al. [21]. Sigarchian et al.[22] assessed the performance of three multi-generationsystems from thermodynamic, economic and environ-mental viewpoints. Results presented that in cold climatezones, the multi-generation system yields the reduction
J Ther Eng, Vol. 7, No. 5, pp. 1039–1055, July, 2021 1041
of CO2 emission to about 27% while this value is 41% for hot climate zones. In a comparative study, the impact of the system configuration on the thermodynamic and ther-moeconomic performances of two trigeneration system based on industrial waste heat was assessed by Heidarnejad et al. [23]. In the mentioned study, the energy and exergy efficiencies and product cost rate of both systems were stud-ied and discussed. In two complementary studies, Doseva and Chakyrova [24, 25] presented the thermodynamic and thermoeconomic analyses of a biogas based cogeneration plant which is located in Bulgaria. The energetic and exer-getic efficiencies of the plant calculated to be 53.3% and 34.6%. Thermoeconomicmodelling was performed based on SPECO (specific exergy cost) method which resulted to achieve a cost for produced electric power by system of about 0.19 €/kWh.
In order to specify the effect of geographical region on thermodynamic, economic and environmental perfor-mances of the integrated energy systems, two multi-gen-eration systems with different sources and productions are regarded and investigated for north and south regions of Iran. This case has not been taken into account by previ-ous researchers which can be addressed by modelling and comparing the performance of two multigeneration sys-tems driven by biomass and solar energy in two cities (Sari and Ahvaz) of Iran. System A is considered to be located in Sari city with the problem of surplus MSW (Municipal Solid Waste). System B is assumed to be located in Ahvaz city with rich resources of natural gas which is proposed to be converted to the LNG. In the present work, exer-goeconomic analysis and environmental evaluation of both systems as well as energetic and exergetic modelling are performed. The comparative study is applied based on com-prehensive analyses in order to evaluate the feasibility of multi-generation systems regarding the available sources, type of demands and geographical region.
THEORY
The energetic, exergetic, economic and environmen-tal modelling of two proposed multi-generation systems which is explained below is performed by developing code in EES (Engineering Equation Software) software [26] on the basicof energy, exergy and exergoeconomic balances applied for each component of both systems. Finally, the environmental assessment of system A and system B is car-ried out regarding emission factors related to renewable energy sources and fossil fuels.
The layouts of multi-generation system A and multi-generation system B are illustrated in Figure 1. As it is clear in Figure 1, system A includes PTC (Parabolic Trough Solar Collectors), MSW combustion chamber, Rankine cycle, heat exchanger, DEAC (Double Effect Absorption Chiller), MED (Multi Effect Desalination) and PEM (Proton Exchange Membrane) electrolyser. Solar
energy and energy of MSW combustion haveutilised the system A. The oil circulating in the tube of the collector is Therminol VP-1 and absorbs the heat of solar energy. On the other hand, MSW is combusted as an auxiliary fuel to eliminate the fluctuations of solar energy in order to have a constant supply. The steam of the Rankine cycle absorbs the provided heat and enters the turbine to produce electricity through an electric generator. A share of electricity is uti-lised by PEM electrolyser to separate water into hydrogen and oxygen. The output stream of the turbine is hot enough to make heating and cooling effects in the heat exchanger and DEAC, respectively. Hot gasses leaving the combustor have sufficient energy to drive a MED and extract the fresh-water from seawater during a four-stage evaporation and condensation process.
As it is obvious in Figure 1, system B is identical to sys-tem A except forthe bagasse combustion chamber and LNG (Liquefied Natural Gas) subsystem. In this system, bagasse as a valuable agricultural waste is combusted in the com-bustor as a complementary resource. The fraction of elec-tricity generated by the electric generator is consumed by the compressor of the LNG subsystem in order to raise the pressure of natural gas to the desired pressure. Then the gas is passed along a throttling valve and converted to liquid natural gas.
Thermodynamic and exergoeconomic analyses and environmental investigation of two multi-generation sys-tems are accomplished through the below assumptions:
(a) The subsystems function at steady-state andpotential and kinetic energies and exergies arenegligible.
(b) The pressure and heat losses in the pipes and ther-mal equipments excluding MED are not takeninto account.
(c) The dead state condition is assumed to have a tem-perature of 298 K and a pressure of 100 kPa.
(d) The natural gas and air are assumed to be idealgasses.
(e) Isentropic efficiencies of turbines and pumps arepresumed to be 80% and 70%.
(f) The seawater salinity is considered to be 40 g/kg.(g) The desalination subsystem has four effects.(h) The sun temperature is considered Ts = 6000 K.(i) Working fluid of double effect absorption chiller is
the solution of LiBr-H2O.(j) Higher heating values of MSW and bagasse are
approximately equal to chemical exergy [27], andefficiencies of both combustors are 80%.
(k) The operating temperature in the evaporator ofDEAC is 10°C.
(l) Average monthly solar radiation on the horizon-tal surface and average air temperature for Sariand Ahvaz cities are considered according to theamounts reported in [28] (See Figures 2 and 3).

J Ther Eng, Vol. 7, No. 5, pp. 1039–1055, July, 20211042
Figure 1. The schematics of multi-generation system A and multi-generation system B.

J Ther Eng, Vol. 7, No. 5, pp. 1039–1055, July, 2021 1043
Energetic and Exergetic ModelingEnergetic and exergetic modelling is performed based
on forming energy and exergy balances for each compo-nent of the two proposed multi-generation systems in a steady-state process as below:
Q m h 12
V gz
m h 12
V gz
in in in2
in
out out out2
out
� � ����
��� �
� ����
��
�
�� �� W (1)
1TT
Q m ex m ex W Ex0
ii in in out out D�
�
��
�
�� � � � �� �
(2)
where Q and W are related to heat and work rate passing through the boundaries, m· represents the mass flow rate, h and s corresponds to specific enthalpy and entropy, ExD and Ti indicate the exergy destruction rate and the temperature in which heat transfer occurs.
Specific exergy of a mass flow comprises of physical and chemical exergy parts:
ex ex exph ch� � (3)
ex h h T s sph
0 0 0� �� � � �� � (4)
ex x ex RT x lnxchi i
ch0 i i
i 1
n
i 1
n
� ��
��
�
��
���� (5)
According to the above equations, energy and exergy equations for subsystems of the polygeneration systems are
formed and given through Tables 1 and 2, respectively in Appendix A.
Exergoeconomic Modeling Exergoeconomic modelling is a consolidated tool of
exergy and economic methods which has the capability in determining the cost flows and product cost rate in the integrated energy systems considering the role of ineffi-ciencies of the components. In this section, exergoeco-nomic balances are formulated for each subsystem of the two multi- generation systems as below and are presented in Appendix B, Table 3 in order to evaluate the exergoeco-nomic performance of the studied systems for better com-parison [29, 30]:
c Ex c W c Ex
c Ex Z
out out kk
w,k k q,k q,k
in in kk
k
� � � � �
� � �
�
� (6)
C c Exi i i= (7)
Z Z ZCRF PEC
Nk kCI
kOM k� � �
� ���3600
(8)
CRFi i
i
n
n��� �
�� � �
1
1 1 (9)
In which Zk is donated for investment cost rate of the kth component which is the summation of capital investment and operating and maintenance costs. cw and cq account for
Figure 2. Average monthly solar radiation on the horizontal surface and average air temperature for Sari city (36.5659° N, 53.0586° E).
Figure 3. Average monthly solar radiation on the hori-zontal surface and average air temperature for Ahvaz city (31.3183° N, 48.6706° E).

J Ther Eng, Vol. 7, No. 5, pp. 1039–1055, July, 20211044
cost per exergy of work and heat. The maintenance factor (δ) is assumed to be 1.06 and the annual operation hours of the system (N) is usually considered to be 7446 h/year. PECk of all subsystems of two multi-generation systems are listed in Appendix B, Table 3. i and n account for the interest rate and lifetime of the system which isconsidered to be 10% and 20 years.
Enviromental Impact Assessment The assessment of any type of emission from any com-
bustion process is performed applying its relevant emission factor. Because of the high concentration of CO2 and NOx emissions among other greenhouse gas emissions and pol-lutants, the amount of CO2/NOxemitted along with any use-ful output of the system is obtained through the following model:
m .PCO ,NO CO ,NOP
2 x 2 x�� (10)
Where P in general can be used for any type of output like electricity, cooling or heating in kWh and φP
CO2,NOx is
the emission factor for producing any kind of energy out-put and is defined in kg/kWh as the amount of CO2/NOx emitted per unit of energy output. In the other hand, the amount of CO2/NOx emission from a process depends on the type of fuel combusted specifically carbon content, combustion condition, and heating value as well as the efficiency of the energy conversion device. Therefore the equation (10) can be rewritten by assuming a different factor φF
CO2,NOx presenting the amount of CO2/NOx emit-
ted per unit of energy input to the device. Regarding the ratio of energy output to energy input as related effi-ciency, the equation (10) can be converted to a function of emission factor of energy input, the amount of energy input F and the efficiency of the device simultaneously as below:
m = .P = . P = .FCO ,NO CO ,NOP
CO ,NOF
CO ,NOF
2 X 2 X 2 X 2 X� �
�� (11)
Where η is the efficiency related to the generation of the specific amount of P from the energy input of F.
Emission reduction (ER) brought by the renewable energy based multi-generation systems can be introduced by ER indicator through the below relation. ER indicator highlights the privilege of integrating renewable energy sources with multi-generation systems to multi-generation systems using fossil fuels. The ER indicator is calculated as follows:
ERm m
mCO ,NO
CO ,NO
RN
CO ,NO
FF
CO ,NO
FF2 X
2 X 2 X
2 X
�� � � � �
� � (12)
In which, (mCO2,NOx)RN and (mCO2,NOx)
FF are referred to the amount of CO2/NOx emission related to the multi- generation system fuelled by renewable energy and fossil fuel, respectively.
RESULTS AND DISCUSSION
In this section, results of energy, exergy and exergoeco-nomic modelling of two studied systems are presented and discussed. The mathematical model extracted from the mentioned equations is solved by means of EES software. System1 is considered to be located in the north of Iran with a moderate climate and have sufficient amounts of MSW while the second system is considered to be located in the south of Iran with a hot climate and benefits from sufficient amounts of bagasse as a by-product of sugar-cane. The findings of the modelling of systems illustrated in Figure 1 are shown in Table 4 and Figures 4–6. As it is presented in Table 4, the amounts of power, cooling, and heating energy are lower for system A due to the lower mass flow rate of working fluid in the cycle which results in lower energy and exergy performances. Since the aver-age of solar radiation on a horizontal surface for Ahvaz is higher than Sari, the share of solar energy in total energy input to system B (solar fraction) is calculated to be 86% which means consuming less biomass while this value is 44% for the system A.
Results of exergoeconomic analysis such as investment cost rates are achieved based on the results of exergoeco-nomic modelling and demonstrated by Figure 4. It is con-cluded that system B is more affordable regarding the lower investment cost rate. As it is clear, the investment cost rate of the turbine is higher for system A while the investment cost rate of biomass combustor is lower. The higher investment cost rate of biomass combustor in system A is achieved due to requiring the larger capacity of MSW combustor to cover the lower LHV and lower solar fraction.
According to emission factors reported by [33–35] and heat values listed in Table 4 for natural gas, MSW and bagasse combustion, the amount of CO2 and NOx emission for both systems in two modes are calculated and demon-strated in Figures 5 and 6.
Considering the multi-generation system A in two modes, the results of the environmental assessment are obtained; mode1 (Sys A-FF): the system using natural gas as an energy source while in mode 2 (Sys A-MSW): the system benefiting MSW combustion and solar energy to yield the same outputs. According to the results, system A requires 279.84 MW of primary energy to provide the products which are supplied in mode 1 by natural gas combustion in a boiler with an average efficiency of 80%. Assuming the emission factors for natural gas �CO
NG kgCO MWh2
183 2� / [36] and φNO
NGx = 0.15kgNOx/MWh [33], the amount of
CO2 and NOx discharged by system B in mode 1 is calcu-lated (Figures 5 and 6). In mode 2, system1 is fed by solar

J Ther Eng, Vol. 7, No. 5, pp. 1039–1055, July, 2021 1045
energy with zero-emission and the heat of MSW combus-tion. Considering the emission factors for MSW
φNO
MSWx =
313kgCO2 /MWh [36] and φNO
MSWx = 0.66kgNOx/MWh [37],
the amount of CO2 and NOx emitted by system A in mode 2 is calculated and reported in Figures 5 and 6.
Multi-generation system B is investigated in two modes; mode1 (Sys B-FF): the system using natural gas as an energy source while in mode 2 (Sys B-Bag): the system utilising bagasse combustion and solar energy to provide the same products. System B requires 228.32 MW of primary energy to provide the products and is fed in mode 1 by natural gas combustion in a boiler with an average efficiency of 80%. Assuming the emission factors for natural gas, the amount of emission by system B in mode 1 is calculated.In mode 2, system B is fed by solar energy and the heat of bagasse com-bustion. Assuming the emission factors for bagasse φNO
NGx =
329kgNOx/MWh [36] and φNOMSW
x = 66kgNOx/MWh [34], the
amount of emission by system B in mode 2 is calculated and reported in Figures 5 and 6.
Obviously, the CO2 andNOx emission of multi-genera-tion system A is higher than of multi-generation system B. This is observed because; the heat value of bagasse is more than MSW (see Table 4) which leads to consume more bio-mass fuel in system A in comparison to system B.
Focusing on the ER indicators of both systems, it is con-cluded that by applying renewable sources in system A in the northern region of Iran, about 1.3 million tons of NOx are avoided annually to discharge to the atmosphere (ERNOx
= 90%). Besides, it is a sustainable solution for solid waste management in that area.
On the other hand, system B with renewable energy sources presents significant environmental benefits in
Table 1. Thermodynamic performances of system A and system B
Performance parameter System A System B Performance parameter System A System B
Total energy input (MW) 253.28 230 Generated hydrogen (kg/h) 587.60 -Energy input by solar energy (MW) 112.40 198.69 Exergy of generated hydrogen (kW) 25.48 -Total exergy input (MW) 344.16 231.27 Generated LNG (kg/h) - 3,279Exergy input by solar energy (MW) 104.96 185.54 Exergy of generated LNG (MW) - 38.23Exergy input by MSW combustion (MW) 239.20 - Total exergy destruction rate (MW) 311.59 212.35Exergy input by bagasse combustion (MW) - 45.71 MSW feed (kg/s) 82.45 -Generated electricity (MW) 30.33 31.28 Bagasse feed (kg/s) - 5.31Generated heating power (MW) 20.76 21.40 Solar fraction (%) 44 86Exergy of heating power (MW) 3.41 3.52 LHV of bagasse* (kJ/kg) - 6,903Generated cooling power (MW) 113.10 137.17 LHV of MSW** (kJ/kg) 2,716 -Exergy of cooling power (MW) 3.42 3.53 LHV of natural gas (kJ/kg) 45,543Generated fresh water (m3/h) 187.78 12.09 Energy efficiency (%) 85.27 82.45Exergy of generated fresh water (MW) 5.10 0.33 Exergy efficiency (%) 11.4 15.75
* LHV of bagasse is estimated through Von Pritzelwitz formula provided by [31] and bagasse characterisation for Ahvaz.** The prediction of LHV is based on the formulation provided by Dulong [32] and waste characterisation for Sari.
Figure 4. Exergoeconomic performance of system A and system B.

J Ther Eng, Vol. 7, No. 5, pp. 1039–1055, July, 20211046
the southern region of Iran so whichleads to the avoid-ance of about 0.3 million tons of CO2 emissions to the atmosphere (ERCO2 = 72%). Moreover, system B prevents the emission of NOx to about 1.14 million tons annually with ERNOx
. 93%. Furthermore, consuming the unem-ployed bagasse in that area efficiently is the positive side effect of applying biomass and solar energy as the fuel of system B.
These achievements point out the superiority of renew-able energy based multi-generation system to conventional ones.
Validation of PEM and PTC For proving the reliability of the results, the model of
the main components should validate with data provided in the literature review. The PEM model is compared with experimental data of [38]. The results are provided in
Figure 7. Moreover, the PTC model has been validated with the results of [39] and are shown in Figure 8. Accordingto Figures 7 and 8 there is a good agreement between the pres-ent model of PEM and PTC and mentioned studies.
Parametric Study In this segment, the results gained from the effect of
two key parameters on the thermodynamic, economic and environmental performances of system A and system B are discussed and compared. In this manner, local time and LHV are selected as understudy parameters. On the other hand, the impact of these parameters are surveyed on the energy and exergy efficiencies, investment cost rate and the amount of NOx and CO2 emissions of system and system B through Figures 9–11.
The effect of the lower heat value of bagasse and MSW on energy and exergy efficiencies is plotted in Figure 9(a).
Figure 5. Amount of CO2 emissions for system A and system B.
Figure 7. Validation of PEM model.
Figure 6. Amount of NOx emissions for system A and system B.
Figure 8. Validation of PTC model.

J Ther Eng, Vol. 7, No. 5, pp. 1039–1055, July, 2021 1047
As observed with the rise of LHV, the energy and exergy efficiencies of both systems would increase negligibly because lower LHV means higher mass flow rate of bio-mass required maintaining the production constant and as a result, the energy and exergy fed to the system A and system B by biomass energy are almost unchanged. The variation of energy and exergy efficiencies of system A and system B in a day is shown in Figure 9(b). It is seen that the energy efficiencies of both systems have the minimum values in the midday, 85.21% for system A and 85.33% for system B. On the other hand, in the midday, maximum val-ues of exergy efficiencies occur which means the best exer-getic performance for both systems, 11.44% for system A and 15.64% for system B.
In Figure 10(a), the effect of the lower heat value of bagasse and MSW on investment cost rates is displayed. Accordingly as shown in this figure, an increase in the LHV has brought about a decrease in the investment cost
rates of system A and system B as much as 45% and 2%, respectively. This phenomenon occurs because consum-ing biomass with higher LHV causes a lower biomass mass flow rate and as a result lower investment cost rate of biomass combustor. Additionally, the variation of invest-ment cost rates of system A and system B during a day is graphed in Figure 10(b). As seen, due to an increase in the energy input to the system by solar energy in the midday, the investment cost rates of solar collectors and biomass combustor reach their minimum values, therefore the overall investment cost rates of system A and system B decreases.
At the end of parametric analysis, the examination of the effect of LHV andlocal time on the amount of CO2 and NOx emission for system1 and system B is addressed in Figures 11(a) and 9(b), respectively. It is observed that con-suming the biomass with higher LHV results in a reduction of NOx emission (about 62% for system1 and about 40%
Figure 9. a) The effect of LHV on energy and exergy effi-ciencies of system A and system B, b) the variation of ener-gy and exergy efficiencies of system A and system B during a day.
Figure 10. a) The effect of LHV on investment cost rates of system A and system B, b) the variation of investment cost rates of system A and system B during a day.

J Ther Eng, Vol. 7, No. 5, pp. 1039–1055, July, 20211048
first one and LNG in the second one. Results demonstrate that system B performs more efficiently from a technical viewpoint with energy and exergy efficiencies of 82.45% and 15.75%. This occurs because system A compensates for the shortcoming of solar energy by combusting more bio-mass with a lower heat value in comparison to system B. From the viewpoints of exergoeconomic, system B is more desired, because requiring more biomass energy means the larger capacity of biomass combustor which leads to higher investment cost for system A. Further, the assessment of environmental effects reveals that system B with avoidance of 1.14 million tons of NOx and 0.3 million tons of CO2 emissions is more beneficial than the same system driven by natural gas. Finally, a comprehensive parametric study is conducted in order to investigate the role of key parameters like LHV of biomass and local time in the thermodynamic, economic and environmental performances of system1 and system B. From the results, it is concluded that the regions with higher intensity of solar radiation and heating value of biomass as a backup fuel arefavourable for establishing multigeneration systems.
Since multi-generation systems are complex networks consisting of multiple sources, multiple commodities and diverse configurations, the comparative and comprehensive study assist to extract a strategy of designing these systems for different locations, available sources and demands in a country considering technical, economic and environmen-tal limits with the purpose of maximum profitability.
NOMENCLATURE
Aa Aperture area (m2)Ar Receiver area (m2)Cp Specific heat capacity c Cost per exergy unit ($/kW)Ċ Cost rate ($/s)DL Membrane thicknessEact Activation energyex Specific exergy (kJ/kg)Ex Exergy (kW)F Faraday constant (C/mol)F Fuel FR Removal factor g Gravity of earth (m/s2) G Gibbs free energy (kJ)Gb Beam solar radiation (W/m2)h Specific enthalpy (kJ/kg)H Enthalpy (kJ)i Interest rateJ Density of flow (C/s)J0 Exchange current density (C/s)
Figure 11. a) The effect of LHV on the amount of CO2 and NOx emission for system1 and system B, b) the variation of the amount of CO2 and NOx emission for system1 and system B during a day.
for system B) and also the rate of CO2 emission (about 62% for system1 and about 40% for system B).As illustrated in Figure 11(b), the amount of NOx emission for system1 and system B reaches minimum values in the midday (138,817 t/y for system1 and 91,347 t/y for system B). The highest amount of solar radiation takes place in the midday which results in a decrement of required biomass as a backup fuel. Therefore the amount of CO2 and NOx emission for both systems drops.
CONCLUSION
In this study, two solar and biomass-based multi-gen-eration systems are proposed for the north and south of Iran and analysed thermodynamically, economically and environmentally. System A is fed by MSW and solar energy and system B utilizes bagasse and solar energy. Both sys-tems are similar in productions except forhydrogen in the

J Ther Eng, Vol. 7, No. 5, pp. 1039–1055, July, 2021 1049
APPENDIX A. ENERGY AND EXERGY EQUATIONS FOR SYSTEM A AND SYSTEM B
Table 1. Governing energy equations for all subsystems of system A and system B [27, 32, 40–44]
Subsystems Governing energy equations
Parabolic trough collectorm C T T A F S
AA
U T Tin oil p oil out oil in oil a Rr
aL in oil, , , , ,�� � � � �� ��
0���
�
��
�� �
��
PTCR L in oil r
b a
F U T T AG A
0 0( ),
Biomass combustor �BC bio bio air air in w out w in wm LHV m h m h h� �� � � �� � , , ,
Turbine
W m h h
WW
turb in w in w out w
is turbturb
is turb
� �� ��
, , ,
,,
�
Pump
W m h h
WW
turb in w in w out w
is turbturb
is turb
� �� ��
, , ,
,,
�
Double effect absorption chiller
W m P P
WW
is pump in w w out w in w
is pumpis pump
pump
, , , ,
,,
� �� �
�
�
�
Heat exchanger
E m h hheating in w out w in w� �� �, , ,
Evaporator m C T T m h hin oil p oil in oil out oil in w out w in w, , , , , , ,�� � � �� �
Economizer m C T T m h hin oil p oil in oil out oil in w out w in w, , , , , , ,�� � � �� �
Multi effect desalination
m m
m C T T m
tot pw pw eff ii
in exh p exh in exh out exh i
, , ,
, , , ,
�
�� � ��
4
nn pw swh h�� �Liquefying natural gas
W m TPP
Ymm
h h
c NG NGNG out
NG in
LNG
NG
NG in NG o
��
���
�
���
� ��
ln ,
,
, , uut
NG in LNG sath h, ,�Electrolyser � � �H G T S
N JF
N
W J V V V
H out H O reacted
PEM act a act c
� �
� �
� � �
2 220
, ,
, , ��� �� � ��
��
���
�
��
�
V
x xT
ohm
� � �[ ( )] . ( ) . ] exp[0 5139 0 326 1268 1303
1
�
��
� �
��
��� �
�� �
�
( ) ,[ ( )]
exp,,
xD
x R dxx
J JZF
RT
a c
Lc PEM
L
o iact i
0
���
�
�� �
��
��
�
��
�
���
�
��
�
�
exp( )
, ,
sin
,
,
�
�
1 ZFRT
i a c
RTF
act i
act i hh , ,
exp , ,
,
,,
� �
���
�
��� �
� ��
��
�
�� �
1
2JJ
i a c
J JERT
i a c
o i
o i iref act i
J Ther Eng, Vol. 7, No. 5, pp. 1039–1055, July, 20211050
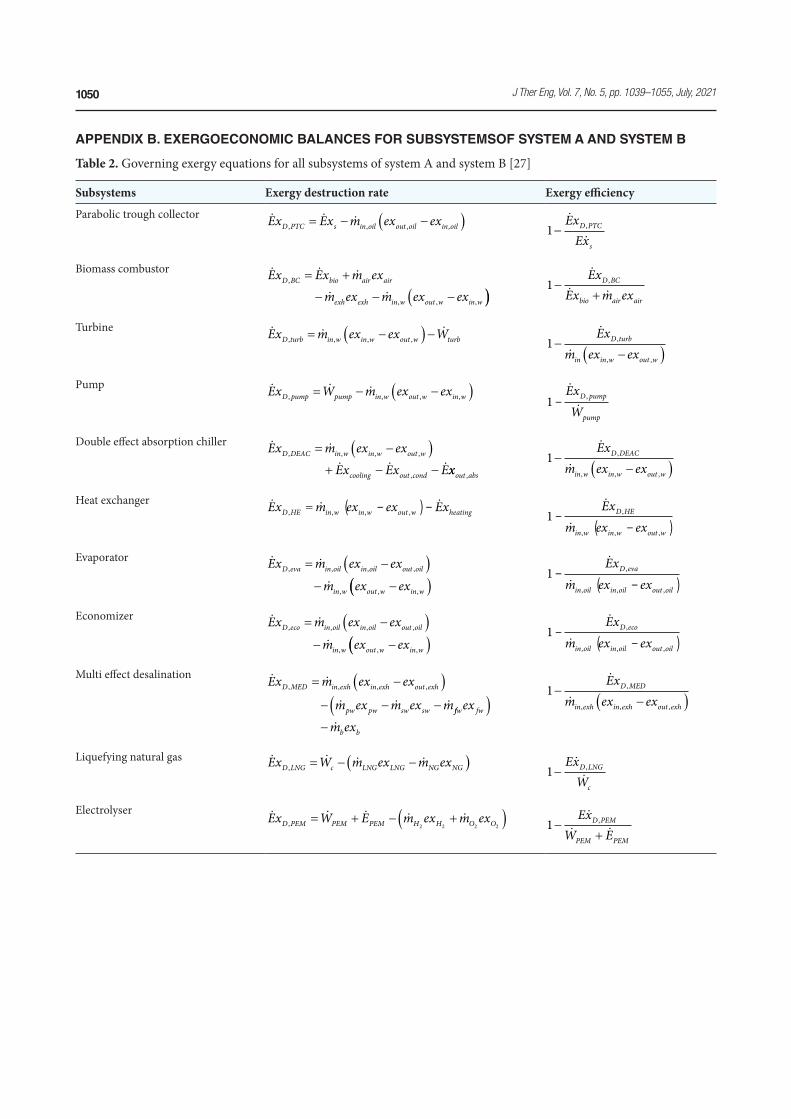
APPENDIX B. EXERGOECONOMIC BALANCES FOR SUBSYSTEMSOF SYSTEM A AND SYSTEM B
Table 2. Governing exergy equations for all subsystems of system A and system B [27]
Subsystems Exergy destruction rate Exergy efficiency
Parabolic trough collector
Ex Ex m ex exD PTC s in oil out oil in oil, , , ,� � �� � 1−
ExEx
D PTC
s
,
Biomass combustor
Ex Ex m ex
m ex m ex exD BC bio air air
exh exh in w out w in w
,
, , ,
� �
� � �� ��1�
�
ExEx m ex
D BC
bio air air
,
Turbine
Ex m ex ex WD turb in w in w out w turb, , , ,� �� � � 1��� �
Exm ex ex
D turb
in in w out w
,
, ,
Pump
Ex W m ex exD pump pump in w out w in w, , , ,� � �� �1-
ExW
D pump
pump
,
Double effect absorption chiller
Ex m ex ex
Ex Ex ED DEAC in w in w out w
cooling out cond
, , , ,
,
� �� �� � � xxout abs,
1��� �
Exm ex ex
D DEAC
in w in w out w
,
, , ,
Heat exchanger
Ex m ex ex ExD HE in w in w out w heating, , , ,= -( )- 1--( )
Exm ex ex
D HE
in w in w out w
,
, , ,
Evaporator
Ex m ex ex
m ex exD eva in oil in oil out oil
in w out w in w
, , , ,
, , ,
� �� �� ��� �
1--( )
Exm ex ex
D eva
in oil in oil out oil
,
, , ,
Economizer
Ex m ex ex
m ex exD eco in oil in oil out oil
in w out w in w
, , , ,
, , ,
� �� �� ��� �
1--( )
Exm ex ex
D eco
in oil in oil out oil
,
, , ,
Multi effect desalination
Ex m ex ex
m ex m ex mD MED in exh in exh out exh
pw pw sw sw
, , , ,� �� �� � � ffw fw
b b
ex
m ex� �
�
1��� �
Exm ex ex
D MED
in exh in exh out exh
,
, , ,
Liquefying natural gas
Ex W m ex m exD LNG c LNG LNG NG NG, � � �� � 1−Ex
WD LNG
c
,
Electrolyser
Ex W E m ex m exD PEM PEM PEM H H O O, � � � �� �2 2 2 2 1�
�
ExW E
D PEM
PEM PEM
,

J Ther Eng, Vol. 7, No. 5, pp. 1039–1055, July, 2021 1051
APPENDIX B. EXERGOECONOMIC BALANCES FOR SUBSYSTEMS OF SYSTEM A AND SYSTEM B
Table 3. Exergoeconomic balances for all subsystems of system A and system B [14, 27, 45]
Subsystems Exergoeconomic balance Auxiliary relation Purchase equipment cost, PEC ($)
Parabolic trough collector C Z C Cin oil PTC s out oil, ,+ + = cs = 0 PEC APTC a= ( )250
Biomass combustor
C C C Z CC
bio air in w BC out w
out exh
� � � �
�, ,
,
ccc
out exh
air
bio
, =
=
=
000
PEC QBC BC= ( )1000
Turbine
C Z C Cin w turb out w Wturb, ,+ = + c cin w out w, ,= PEC Wturb turb
is turb
� � �
��� �
�
�
��
�
�
��
�
�
��
�
�
3880 5
1 0 05
1
0 7
3
.
.
.
,
����
���
��
�
��
�
��
�
��
�
���
�
���1 5
86610 42
exp.
Tin
Pump
C Z C Cin w pump W out wpump, ,� � � c cW Wpump turb
= PEC WPump Pump= ( )35400 71
.
Double effect absorption chiller
C Z C Cin w DEAC out w cooling, ,+ = + c cin w out w, ,= PEC QDEAC cooling= ( )115950 73
.
Heat exchanger C Z C Cin w HE out w heating, ,+ = + c cin w out w, ,=
PECA
HEHE�
�
��
�
��130
0 093
0 78
.
.
Evaporator C C Z C Cin w in oil eva out w out oil, , , ,+ + = + c cin oil out oil, ,=
PECA
evaeva�
�
��
�
��130
0 093
0 78
.
.
Economizer C C Z C Cin w in oil eco out w out oil, , , ,+ + = + c cin oil out oil, ,=
PECA
ecoeco�
�
��
�
��130
0 093
0 78
.
.
Multi effect desalination
C C C Z C
C Csw fw in exh MED out exh
pw b
� � � �
� �, ,
cc cc
sw
in exh out exh
b
=
= =
=
00
0, ,
PEC mMED pw= ( )1542
Liquefying natural gas
C C Z CNG W LNG LNGc+ + = c cW Wc turb
= PEC mLNG LNG= ( )( )1400 31536
Electrolyser
C C C Z
C CW E w in PEM
H O
PEM PEM� � �
� �,
2 2
c cW WPEM turb
= PEC WPEM PEM= ( )1000

J Ther Eng, Vol. 7, No. 5, pp. 1039–1055, July, 20211052
Jref Pre-exponential factorm· Mass flow rate (kg/s)m Mass (kg)n Lifetime of the systemN Annual operation hours N Molar flow rate (mole/s)P ProductR Universal gas constantRPEM Overall ohmic resistances Specific entropy (kJ/kg.K)S Heat absorbed by the receiver Sys System T Temperature (°C)UL Coefficient of overall heat loss of collector (W/m2 .K)V Velocity (m/s) V0 Reversible potentialVact,a Activation potential of the anodeVact,c Activation potential of the cathodeVohm Ohmic overpotential of the electrolyteW Power (kW)x Molar fraction x Depth in the membrane (m)y Ratio of liquefied natural gas to natural gasZ Investment cost ($)Z Height (m)Z Number of electrons involved per reactionZ Investment cost rate ($/s) Greek Symbolsα Symmetrical factorη Energy efficiency (%)ε Exergy efficiency (%)η Optical efficiency (%)φ Emission factorλ Water contents at the anode-membrane interfaceλact Activation overpotential of an electrodeλc Water contents at the cathode-membrane interfaceν Specific volume (m3/kg)δ Maintenance factorθ(x) Local ionic conductivity of the PEMAbbreviationCRF Capital Recovery FactorDEAC Double Effect Absorption ChillerEES Engineering Equation SolverER Emission Reduction HHV High Heating Value
HTG High Temperature GeneratorLHV Low Heating Value LiBr Litume BromideLNG Liquefying of Natural GasMED MultiEffectDesalinationMSW Municipal Solid WastePEC Purchase Equipment CostPEM Proton Exchange MembranePTC ParabolicTroughsolarCollectorSubscripts0 Reference statea Anodeabs Absorber of double effect absorption chillerair Air b brineBC Biomass Combustor bio biomassc Compressor c Cathode cond Condenser D Destructioneff Effect of multi effect desalination systemexh Exhaust gas of biomass combustion out outleteco Economizereva Evaporator fw Feedwater HE Heat exchangeri Component/streamin Inletis Isentropic oil Therminol VP-1 oilpw Fresh waterq Heats solarss Strong solution of LiBrsw Sea water tot TotalTurb Turbinew Workw Water ws Weak solution of LiBrSuperscriptsch Chemical NG Natural Gas

J Ther Eng, Vol. 7, No. 5, pp. 1039–1055, July, 2021 1053
CI Capital InvestmentP Product
FF Fossil Fuel OM Operation and Maintenance RN Renewable energy F Fuel ph Physical
DATA AVAILABILITY STATEMENT
No new data were created in this study. The published publication includes all graphics collected or developed during the study.
CONFLICT OF INTEREST
The author declared no potential conflicts of interest with respect to the research, authorship, and/or publication of this article.
ETHICS
There are no ethical issues with the publication of this manuscript.
REFERENCES
[1] Boyaghchi FA, Heidarnejad P. Thermoeconomic assessment and multi objective optimization of a solar micro CCHP based on Organic Rankine Cycle for domestic application. Energy Convers Manag 2015; 97: 224–234. doi: https://doi.org/10.1016/j.enconman.2015.03.036.
[2] Jana K, De S. Sustainable polygeneration design and assessment through combined thermodynamic, economic and environmental analysis. Energy 2015; 91: 540–555. doi: https://doi.org/10.1016/j.energy.2015.08.062.
[3] Caliskan H. Thermodynamic and environmen-tal analyses of biomass, solar and electrical energy options based building heating applications. Renew Sustainable Energy Rev 2015; 43: 1016–1034. doi: https://doi.org/10.1016/j.rser.2014.11.094.
[4] Noorpoor A, Heidarnejad P, Hashemian N, Ghasemi A. A thermodynamic model for exergetic performance and optimization of a solar and bio-mass-fuelled multigeneration system. Energy Equip Syst 2016; 4(2): 281–289. doi: https://10.22059/ees.2016.23044.
[5] Al Moussawi H, Fardoun F, Louahlia-Gualous H. Review of tri-generation technologies: Design evaluation, optimization, decision-making, and selection approach. Energy Convers Manag 2016;
120: 157–196. doi: https://doi.org/10.1016/j.enconman.2016.04.085.
[6] Bellos E, Tzivanidis C. Parametric analysis and opti-mization of a solar driven trigeneration system based on ORC and absorption heat pump. J Clean Prod 2017; 161: 493–509. doi: https://doi.org/10.1016/j.jclepro.2017.05.159.
[7] Khanmohammadi S, Heidarnejad P, Javani N, Ganjehsarabi H. Exergoeconomic analysis and multi objective optimization of a solar based inte-grated energy system for hydrogen production. Int J Hydrog Energy 2017; 42(33): 21443–21453. doi: https://doi.org/10.1016/j.ijhydene.2017.02.105.
[8] Di Somma M, Yan B, Bianco N, Graditi G, Luh PB, Mongibello L, et al. Multi-objective design opti-mization of distributed energy systems through cost and exergy assessments. Appl Energy 2017; 204: 1299–1316. doi: https://doi.org/10.1016/j.apenergy.2017.03.105.
[9] Calise F, Macaluso A, Piacentino A, Vanoli L. A novel hybrid polygeneration system supplying energy and desalinated water by renewable sources in Pantelleria Island. Energy 2017; 137: 1086–1106. doi: https://doi.org/10.1016/j.energy.2017. 03.165.
[10] Ganjehsarabi H, Asker M, Seyhan AK, editors. Energy and exergy analyses of a solar assisted combined power and cooling cycle. 2016 IEEE International Conference on Renewable Energy Research and Applications (ICRERA); 2016 20–23 Nov. 2016; Birmingham.
[11] Sahoo U, Kumar R, Pant P, Chaudhary R. Development of an innovative polygeneration pro-cess in hybrid solar-biomass system for combined power, cooling and desalination. Appl Therm Eng 2017; 120: 560–567. doi: https://doi.org/10.1016/j.applthermaleng.2017.04.034.
[12] Bellos E, Tzivanidis C. Multi-objective optimiza-tion of a solar driven trigeneration system. Energy 2018; 149: 47–62. doi: https://doi.org/10.1016/j.energy.2018.02.054.
[13] Boyaghchi FA, Chavoshi M, Sabeti V. Multi-generation system incorporated with PEM electrolyzer and dual ORC based on biomass gas-ification waste heat recovery: Exergetic, economic and environmental impact optimizations. Energy 2018; 145: 38–51. doi: https://doi.org/10.1016/j.energy.2017.12.118.
[14] Ghasemi A, Heidarnejad P, Noorpoor A. A novel solar-biomass based multi-generation energy system including water desalination and lique-faction of natural gas system: Thermodynamic and thermoeconomic optimization. J Clean Prod 2018; 196: 424–437. doi: https://doi.org/10.1016/j.jclepro.2018.05.160.

J Ther Eng, Vol. 7, No. 5, pp. 1039–1055, July, 20211054
[15] Khanmohammadi S, Atashkari K. Modeling and multi-objective optimization of a novel biomass feed polygeneration system integrated with multi effect desalination unit. Therm Sci Eng Prog 2018; 8: 269-283. doi: https://doi.org/10.1016/j.tsep.2018. 08.003.
[16] Yilmaz F. Thermodynamic performance evaluation of a novel solar energy based multigeneration system. Appl Therm Eng 2018; 143: 429–437. doi: https://doi.org/10.1016/j.applthermaleng.2018.07.125.
[17] Wang Y, Wang X, Yu H, Huang Y, Dong H, Qi C, et al. Optimal Design of Integrated Energy System Considering Economics, Autonomy and Carbon Emissions. J Clean Prod 2019. doi: https://doi.org/10.1016/j.jclepro.2019.03.025.
[18] Nalbant Y, Colpan CO, Devrim Y. Energy and exergy performance assessments of a high tempera-ture-proton exchange membrane fuel cell based integrated cogeneration system. Int J Hydrog Energy 2019. doi: https://doi.org/10.1016/j.ijhydene.2019. 01.252.
[19] Ganjehsarabi H. Mixed refrigerant as working fluid in Organic Rankine Cycle for hydrogen pro-duction driven by geothermal energy. Int J Hydrog Energy 2019; 44(34): 18703–18711. doi: https://doi.org/10.1016/j.ijhydene.2018.11.231.
[20] Mateus T, Oliveira AC. Energy and economic anal-ysis of an integrated solar absorption cooling and heating system in different building types and cli-mates. Appl Energy 2009; 86(6): 949–957. doi: https://doi.org/10.1016/j.apenergy.2008.09.005.
[21] Jiang-Jiang W, Chun-Fa Z, You-Yin J. Multi-criteria analysis of combined cooling, heating and power systems in different climate zones in China. Appl Energy 2010; 87(4): 1247–1259. doi: https://doi.org/10.1016/j.apenergy.2009.06.027.
[22] Sigarchian SG, Malmquist A, Martin V. Design Optimization of a Small-Scale Polygeneration Energy System in Different Climate Zones in Iran. Energies 2018; 11(5): 1-19. doi: https://doi.org/10.3390/en11051115.
[23] Heidarnejad P, Noorpoor A, Dincer I. Chapter 2.19 - Thermodynamic and Thermoeconomic Comparisons of Two Trigeneration Systems. In: Dincer I, Colpan CO, Kizilkan O, editors. Exergetic, Energetic and Environmental Dimensions: Academic Press; 2018. p. 551–567.
[24] Doseva N, Chakyrova D. Energy and Exergy Analysis of Cogeration System with Biogas Engines. Journal of Thermal Engineering 2015; 1(3): 391–401. doi: 10.18186/jte.75021.
[25] Chakyrova D, Doseva N. Thermoeconomic Analysis of Biogas Engines Powered Cogeneration System. Journal of Thermal Engineering 2019; 5(2): 93–107. doi: 10.18186/thermal.532210.
[26] Klein SA. Engineering Equation Solver (EES). from https://https://fchart.com/ees/; 2013.
[27] Frangopoulos CA. Exergy, Energy System Analysis and Optimization-Volume I: Exergy and Thermodynamic Analysis. UK: EOLSS Publications, 2009.
[28] NASA Surface meteorology and Solar Energy. 2013. Available from: https://eosweb.larc.nasa.gov/cgi-bin/sse/daily.cgi/.
[29] Bejan A, Tsatsaronis G, Moran M. Thermal design and optimization. Canada: John Wiley & Sons Inc., 1996.
[30] Frangopoulos CA. Exergy, Energy System Analysis and Optimization-Volume II: Thermoeconomic Analysis, Modeling, Simulation and Optimization in Energy Systems. UK: EOLSS Publications, 2009.
[31] Hugot E. Handbook of cane sugar engineering. USA: Elsevier, 2014.
[32] Tchobanoglous G, Theisen H, Vigil S. Integrated solid waste management: engineering principles and management issues. 2nd ed. USA: McGraw Hill, 1993.
[33] Compilation of air pollutant emission factors 1: Stationary Point and Area Sources Chapter 3: Stationary Internal Combustion Sources, AP-42. New York: EPA, 1979.
[34] EPA. Compilation of air pollutant emission fac-tors. New York: Environmental Protection Agency, 1979.
[35] AP-42, Compilation of air pollutant emission fac-tors, Volume 1: Stationary Point and Area Sources Chapter 2: Solid Waste Disposal New York: EPA, 1979.
[36] Emission Factor for Greenhouse Gas Inventories. 2018. Available from: https://epa.gov/sites/produc-tion/files/2018-03/documents/emission-factors_mar_2018_0.pdf.
[37] Bernt J. Good Practice Guidance and Uncertainty Management in National Greenhouse Gas Inventories: Emissions from Waste Incineration. Montreal: IPCC, 2000.
[38] Ioroi T, Yasuda K, Siroma Z, Fujiwara N, Miyazaki Y. Thin film electrocatalyst layer for unitized regener-ative polymer electrolyte fuel cells. Journal of Power sources 2002; 112(2): 583–587. doi.
[39] Al-Sulaiman FA. Exergy analysis of parabolic trough solar collectors integrated with combined steam and organic Rankine cycles. Energy Convers Manag 2014; 77: 441–449. doi.
[40] Cengel AY, Boles MA. Thermodynamics: An engi-neering approach. New York: McGraw Hill, 2008.
[41] Kalogirou S. solar energy engineering: processes and systems. UK: Elsevier, 2009.
[42] Dincer I. Refrigeration systems and applications. UK: John Wiley & Sons, 2017.

J Ther Eng, Vol. 7, No. 5, pp. 1039–1055, July, 2021 1055
[43] Ni M, Leung MK, Leung DY. Energy and exergy analysis of hydrogen production by a proton exchange membrane (PEM) electrolyzer plant. Energy Convers Manag 2008; 49(10): 2748–2756. doi: https://doi.org/10.1016/j.enconman.2008.03. 018.
[44] Gurau V, Barbir F, Liu H. An analytical solution of a half‐cell Model for PEM fuel cells. J Electrochem Soc 2000; 147(7): 2468–2477. doi: https://doi:10.1149/1.1393555.
[45] Kotas TJ. The exergy method of thermal plant anal-ysis. Reprint ed. Malabar, Fla.: Krieger Pub., 1995.