Performance Briefing Fiscal Year March 2020 · 2020-05-19 · TDK Corporation Corporate...
32
TDK Corporation Corporate Communications Group May 15, 2020 Performance Briefing Fiscal Year March 2020
Transcript of Performance Briefing Fiscal Year March 2020 · 2020-05-19 · TDK Corporation Corporate...
TDK CorporationCorporate Communications Group
May 15, 2020
Performance BriefingFiscal Year March 2020
Performance Briefing Fiscal Year March 2020 © TDK Corporation 2020Corporate Communications Group May 15, 2020 2
●Consolidated Results for FY March 2020Tetsuji Yamanishi, Executive Vice President
●Consolidated Full Year Projections for FY March 2021Shigenao Ishiguro, President & CEO

Performance Briefing Fiscal Year March 2020 © TDK Corporation 2020Corporate Communications Group May 15, 2020 3
Consolidated Results forFY March 2020
Tetsuji YamanishiExecutive Vice President
Performance Briefing Fiscal Year March 2020 © TDK Corporation 2020Corporate Communications Group May 15, 2020 4
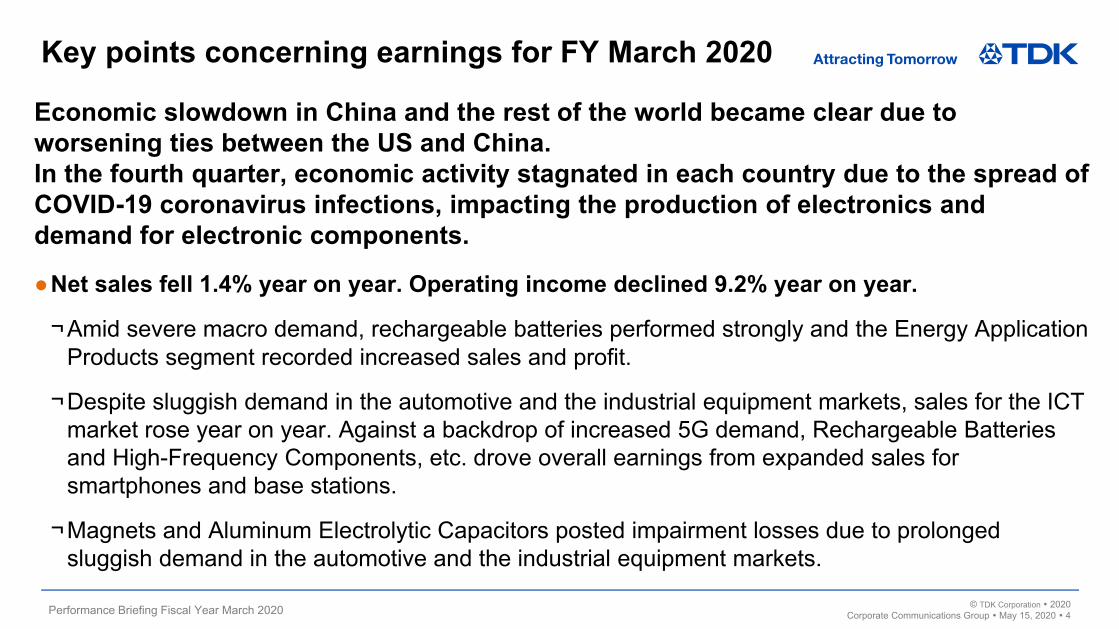
Key points concerning earnings for FY March 2020
Economic slowdown in China and the rest of the world became clear due to worsening ties between the US and China.In the fourth quarter, economic activity stagnated in each country due to the spread of COVID-19 coronavirus infections, impacting the production of electronics and demand for electronic components.
●Net sales fell 1.4% year on year. Operating income declined 9.2% year on year.
¬Amid severe macro demand, rechargeable batteries performed strongly and the Energy Application Products segment recorded increased sales and profit.
¬Despite sluggish demand in the automotive and the industrial equipment markets, sales for the ICT market rose year on year. Against a backdrop of increased 5G demand, Rechargeable Batteries and High-Frequency Components, etc. drove overall earnings from expanded sales for smartphones and base stations.
¬Magnets and Aluminum Electrolytic Capacitors posted impairment losses due to prolonged sluggish demand in the automotive and the industrial equipment markets.

Performance Briefing Fiscal Year March 2020 © TDK Corporation 2020Corporate Communications Group May 15, 2020 5
Consolidated full year results for FY March 2020
Yen billions %
Net sales 1,381.8 1,363.0 (18.8) -1.4Operating income 107.8 97.9 (9.9) -9.2
Operating income margin 7.8% 7.2% -0.6 pt -Income before income taxes 115.6 95.9 (19.7) -17.0Net income 82.2 57.8 (24.4) -29.7
Earning per share (JPY) 651.02 457.47 - -US$ (JPY) 110.94 108.82EURO (JPY) 128.48 120.92
Change
(Yen billions)FY March 2019full year results
FY March 2020full year results
Appreciated by 1.9%Appreciated by 5.9%
Ex-rate
Ex-rate impact to net sales &operating income
Net sales:Decreased by about 40.7 billion YenOperating income:Decreased by about 3.1 billion Yen

Performance Briefing Fiscal Year March 2020 © TDK Corporation 2020Corporate Communications Group May 15, 2020 6
58.4
39.1
19/3 20/3
433.4 395.5
19/3 20/3
FY March 2020 results- Passive Components segment
Net sales 395.5 billion yen (down 8.7% year on year)Operating income 39.1 billion yen (down 33.0% year on year)
● Ceramic Capacitors¬ Sales and profit decreased year on year.¬ Sales increased to the automotive and the ICT markets.¬ Sales decreased to the industrial equipment market and distributors.
● Aluminum Electrolytic Capacitors and Film Capacitors¬ Sales and profit decreased year on year.¬ Sales decreased to the industrial equipment and the automotive markets.¬ Impairment loss recorded in 4Q.
● Inductive Devices¬ Sales and profit decreased year on year.¬ Sales to the automotive and the industrial equipment markets and
distributors decreased year on year.● High-Frequency Components
¬ Sales and profit increased year on year.¬ Sales increased to the ICT market (5G related).
● Piezoelectric Material Products and Circuit Protection Components¬ Sales and profit decreased year on year.
Net sales(Yen billions)
Operating income(OP margin)
(Yen billions)
13.5%9.9%
19/3: FY March 2019

Performance Briefing Fiscal Year March 2020 © TDK Corporation 2020Corporate Communications Group May 15, 2020 7
-22.1 -25.0
19/3 20/3
76.5 77.9
19/3 20/3
FY March 2020 results- Sensor Application Products segment
Net sales 77.9 billion yen (up 1.8% year on year)Operating loss -25.0 billion yen (up ―% year on year)
● Sensors¬ Sales of conventional products (Temperature and Pressure Sensors,
and Hall Sensors) to the automotive and the industrial equipment markets declined, with earnings also worsening.
¬ Earnings from TMR Sensors rose, driven by dramatic growth in sales to the automotive and the ICT markets.
¬ In MEMS Sensors, sales of Motion Sensors and MEMS Microphones increased due to the expansion in the customer base and in the application base.
Net sales(Yen billions)
Operating loss
(Yen billions)
19/3: FY March 2019

Performance Briefing Fiscal Year March 2020 © TDK Corporation 2020Corporate Communications Group May 15, 2020 8
17.0
0.4
19/3 20/3
272.8
219.7
19/3 20/3
FY March 2020 results- Magnetic Application Products segment
Net Sales 219.7 billion yen (down 19.5% year on year)Operating income 0.4 billion yen (down 97.6% year on year)
● HDD Heads and HDD Suspension Assemblies¬ While HDD assembly volume dropped significantly year on year, the
profitability of HDD heads improved.¬ The profitability of HDD Suspension Assemblies also improved.
● Magnets¬ Sales and profit decreased year on year.¬ Sales decreased mainly to the automotive and the industrial equipment
markets.¬ Impairment loss recorded in 4Q.
Net sales(Yen billions)
Operating income(OP margin)
(Yen billions)
6.2%0.2%
19/3: FY March 2019
Performance Briefing Fiscal Year March 2020 © TDK Corporation 2020Corporate Communications Group May 15, 2020 9
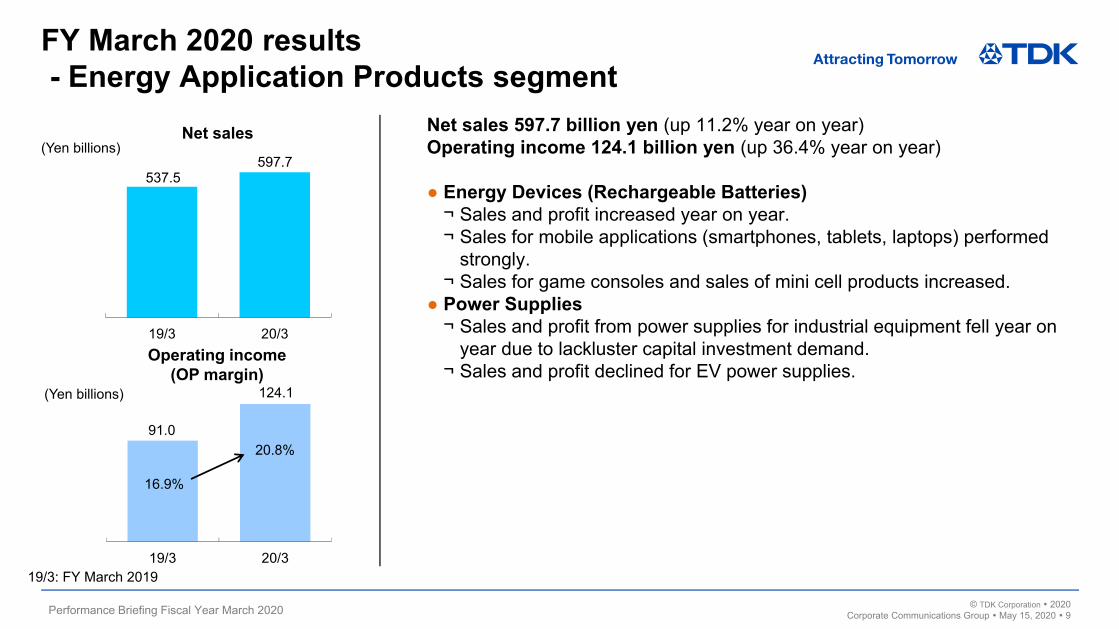
91.0
124.1
19/3 20/3
537.5 597.7
19/3 20/3
FY March 2020 results- Energy Application Products segment
Net sales 597.7 billion yen (up 11.2% year on year)Operating income 124.1 billion yen (up 36.4% year on year)
● Energy Devices (Rechargeable Batteries)¬ Sales and profit increased year on year.¬ Sales for mobile applications (smartphones, tablets, laptops) performed
strongly.¬ Sales for game consoles and sales of mini cell products increased.
● Power Supplies¬ Sales and profit from power supplies for industrial equipment fell year on
year due to lackluster capital investment demand.¬ Sales and profit declined for EV power supplies.
Net sales(Yen billions)
Operating income(OP margin)
(Yen billions)
16.9%
20.8%
19/3: FY March 2019
Performance Briefing Fiscal Year March 2020 © TDK Corporation 2020Corporate Communications Group May 15, 2020 10
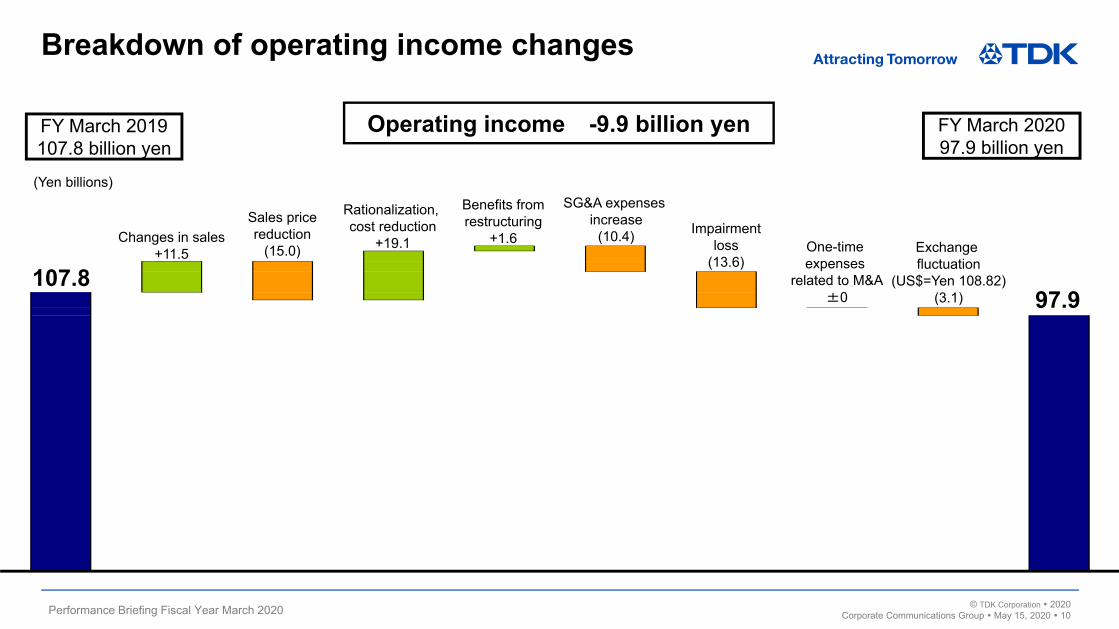
Breakdown of operating income changes
Operating income -9.9 billion yenFY March 2019107.8 billion yen
FY March 202097.9 billion yen
97.9107.8
Changes in sales+11.5
Sales pricereduction
(15.0) Exchange fluctuation
(US$=Yen 108.82)(3.1)
Rationalization, cost reduction
+19.1
Benefits fromrestructuring
+1.6
SG&A expenses increase
(10.4)
(Yen billions)
One-time expenses
related to M&A±0
Impairmentloss
(13.6)

Performance Briefing Fiscal Year March 2020 © TDK Corporation 2020Corporate Communications Group May 15, 2020 11
FY March 2020 quarterly results by segmentYen billions % Yen billions %
Capacitors 42.3 37.3 37.7 (4.6) -10.9 0.4 1.1Inductive Devices 34.3 34.8 33.0 (1.3) -3.8 (1.8) -5.2
Other Passive Components 25.3 26.3 26.3 1.0 4.0 0.0 0.0Passive Components 101.9 98.3 97.0 (4.9) -4.8 (1.3) -1.3
Sensor Application Products 17.3 20.3 18.7 1.4 8.1 (1.6) -7.9Magnetic Application Products 60.5 57.9 51.8 (8.7) -14.4 (6.1) -10.5
Energy Application Products 111.8 161.2 118.3 6.5 5.8 (42.9) -26.6Other 17.6 17.9 14.5 (3.1) -17.6 (3.4) -19.0
309.1 355.6 300.4 (8.7) -2.8 (55.2) -15.5
13.3 10.6 6.7 (6.6) -49.6 (3.9) -36.8
(7.2) (5.5) (7.0) 0.2 - (1.5) -
4.8 5.2 (11.5) (16.3) - (16.7) -
12.1 40.5 14.7 2.6 21.5 (25.8) -63.7
(2.8) (2.5) (5.8) (3.0) - (3.3) -
20.3 48.4 (3.0) (23.3) - (51.4) -
(7.4) (8.0) (8.4) (1.0) - (0.4) -
12.9 40.4 (11.4) (24.3) - (51.8) -Operating income margin 4.2% 11.4% - - pt - - pt -
110.23 108.74 109.05125.18 120.34 120.32
Sub totalCorporate and eliminations
Total
Operating incom
e
Passive Components
Magnetic Application Products
Ex-rate
US$ (JPY)EURO (JPY)
Energy Application ProductsOther
Sensor Application Products
QoQ change (C)-(B)
(Yen billions)
4Q ofFY March 2019
(A)
3Q ofFY March 2020
(B)
4Q ofFY March 2020
(C)
YoY change(C)-(A)
Total
Net sales
Performance Briefing Fiscal Year March 2020 © TDK Corporation 2020Corporate Communications Group May 15, 2020 12
Consolidated Full Year Projectionsfor FY March 2021
Shigenao IshiguroPresident & CEO

Performance Briefing Fiscal Year March 2020 © TDK Corporation 2020Corporate Communications Group May 15, 2020 13
Quarterly World GDP GrowthY o Y% CQ4/2019 CQ1/2020 CQ2/2020 CQ3/2020 CQ4/2020 CY2020Worldwide +3.4 -3.1 -8.0 -3.1 -2.3 -4.0
‐20
‐15
‐10
‐5
0
5
10
CQ4/2019 CQ1/2020 CQ2/2020 CQ3/2020 CQ4/2020
Worldwide USA EU Japan China
Worldwide
USA
EU
China
Japan
(Source: Nomura Global Market Research)

Performance Briefing Fiscal Year March 2020 © TDK Corporation 2020Corporate Communications Group May 15, 2020 14
Production Trend (Unit: Mil. unit) FY2020 FY2021 (Y o Y)
Automobile* 87 75 (‐14%)
therein xEV 4.4 4.9 (+11%)
Smartphone 1,365 1,240 (‐9%)
therein 5G Smartphone 43 376 (x 9)
HDD 309 265 (‐14%)
therein Nearline 56 62 (+10%)
Notebook PC 162 163 (+1%)
Tablet 122 127 (+5%)
Market forecast of FY March 2021
*The number of Automobile includes commercial vehicles.
Performance Briefing Fiscal Year March 2020 © TDK Corporation 2020Corporate Communications Group May 15, 2020 15
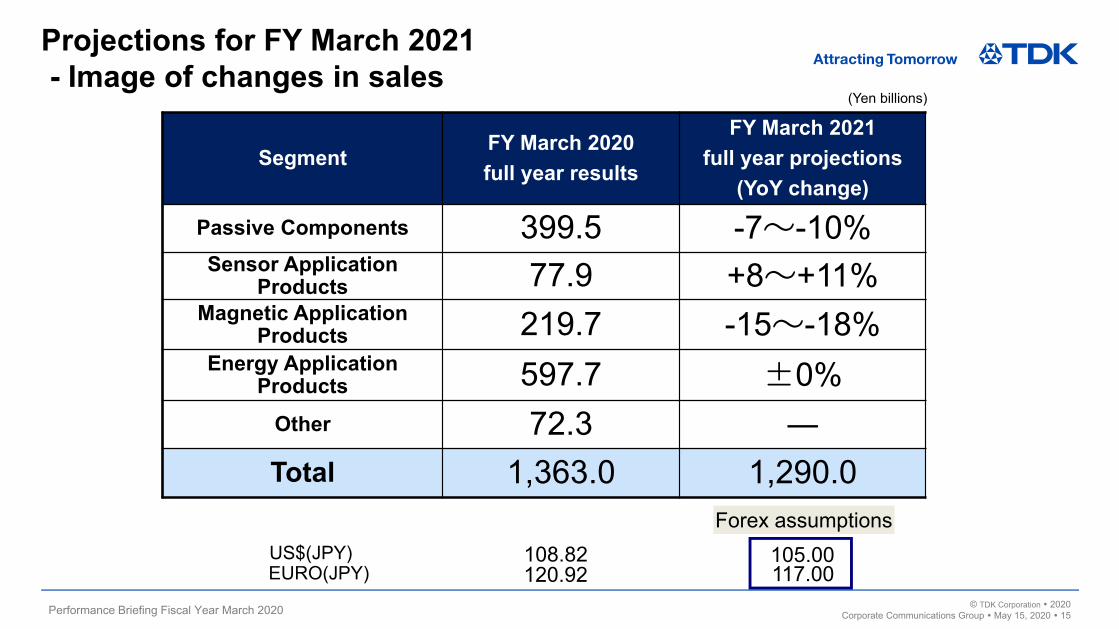
Projections for FY March 2021- Image of changes in sales
SegmentFY March 2020full year results
FY March 2021 full year projections
(YoY change)
Passive Components 399.5 -7~-10%Sensor Application
Products 77.9 +8~+11%Magnetic Application
Products 219.7 -15~-18%Energy Application
Products 597.7 ±0%Other 72.3 ―Total 1,363.0 1,290.0
US$(JPY) 108.82 105.00EURO(JPY) 120.92 117.00
Forex assumptions
(Yen billions)
Performance Briefing Fiscal Year March 2020 © TDK Corporation 2020Corporate Communications Group May 15, 2020 16
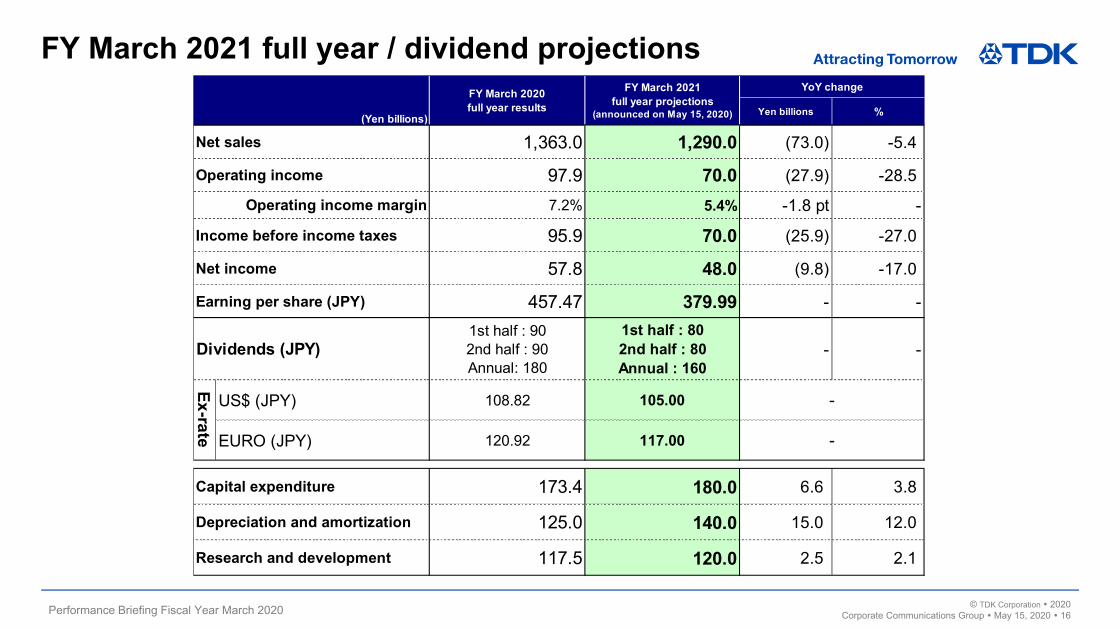
FY March 2021 full year / dividend projections
Yen billions %
1,363.0 1,290.0 (73.0) -5.4
97.9 70.0 (27.9) -28.5
7.2% 5.4% -1.8 pt -
95.9 70.0 (25.9) -27.0
57.8 48.0 (9.8) -17.0
457.47 379.99 - -1st half : 902nd half : 90Annual: 180
1st half : 802nd half : 80Annual : 160
- -
US$ (JPY) 108.82 105.00
EURO (JPY) 120.92 117.00
173.4 180.0 6.6 3.8
125.0 140.0 15.0 12.0
117.5 120.0 2.5 2.1
Capital expenditure
Depreciation and amortization
Research and development
-
-
Operating income margin
Income before income taxes
Net income
Earning per share (JPY)
Dividends (JPY)
Ex-rate
FY March 2021full year projections
(announced on May 15, 2020)
YoY change
Net sales
Operating income
(Yen billions)
FY March 2020full year results

Performance Briefing Fiscal Year March 2020 © TDK Corporation 2020Corporate Communications Group May 15, 2020 17
Strengthening the Financial Base in FY March 2021
● The spread of coronavirus infections has had an impact and improvements to the financial structure will be delayed. ● During Fiscal Year March 2021 we will maintain positive free cash flow while preparing for future growth.
¬ Make growth investments expected to expand future earnings on a priority basis.¬ Maintain fund-raising capacity while strengthening financial base.¬ Implement shareholder returns with a target dividend payout ratio of 30% over the cumulative period of the Medium-
Term Plan.
Steadily recover growth investments executed towards transforming business earnings model Execute further growth investments based on well-balanced capital allocation Steadily recover growth investments executed towards transforming business earnings model Execute further growth investments based on well-balanced capital allocation
Negative free cash flowsNegative free cash flows
Positive free cash flowsPositive free cash flows
Well-balanced capital allocation Growth investments Shareholder returns Repayment of interest-bearing debt
Well-balanced capital allocation Growth investments Shareholder returns Repayment of interest-bearing debt
Capital efficiency・ Operating income margin Over 10%・ ROE Over 14%
Capital efficiency・ Operating income margin Over 10%・ ROE Over 14%
Financial soundness・ Stockholders’ equity ratio Over 50%・ Net cash
Financial soundness・ Stockholders’ equity ratio Over 50%・ Net cash
Financial Targets for the FY March 2021 - The Final Year of the Medium-Term Plan (announced in 2018)Financial Targets for the FY March 2021 - The Final Year of the Medium-Term Plan (announced in 2018)Shareholder Returns・ Increase dividends stably through
growth of income per share・ Target a 30% dividend payout ratio
Shareholder Returns・ Increase dividends stably through
growth of income per share・ Target a 30% dividend payout ratio
Mid-Term Financial Strategy (announced in 2018)
Performance Briefing Fiscal Year March 2020 © TDK Corporation 2020Corporate Communications Group May 15, 2020 18
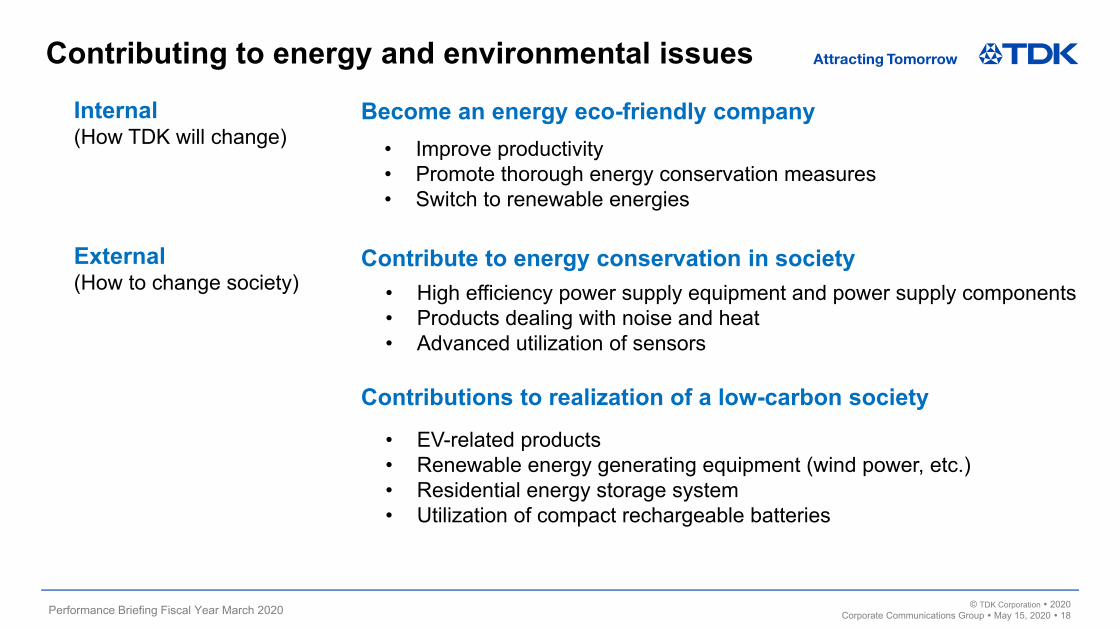
Contributing to energy and environmental issues
Contribute to energy conservation in society
Internal(How TDK will change)
External(How to change society)
• Improve productivity• Promote thorough energy conservation measures• Switch to renewable energies
Become an energy eco-friendly company
• EV-related products• Renewable energy generating equipment (wind power, etc.)• Residential energy storage system• Utilization of compact rechargeable batteries
Contributions to realization of a low-carbon society
• High efficiency power supply equipment and power supply components• Products dealing with noise and heat• Advanced utilization of sensors
Performance Briefing Fiscal Year March 2020 © TDK Corporation 2020Corporate Communications Group May 15, 2020 19
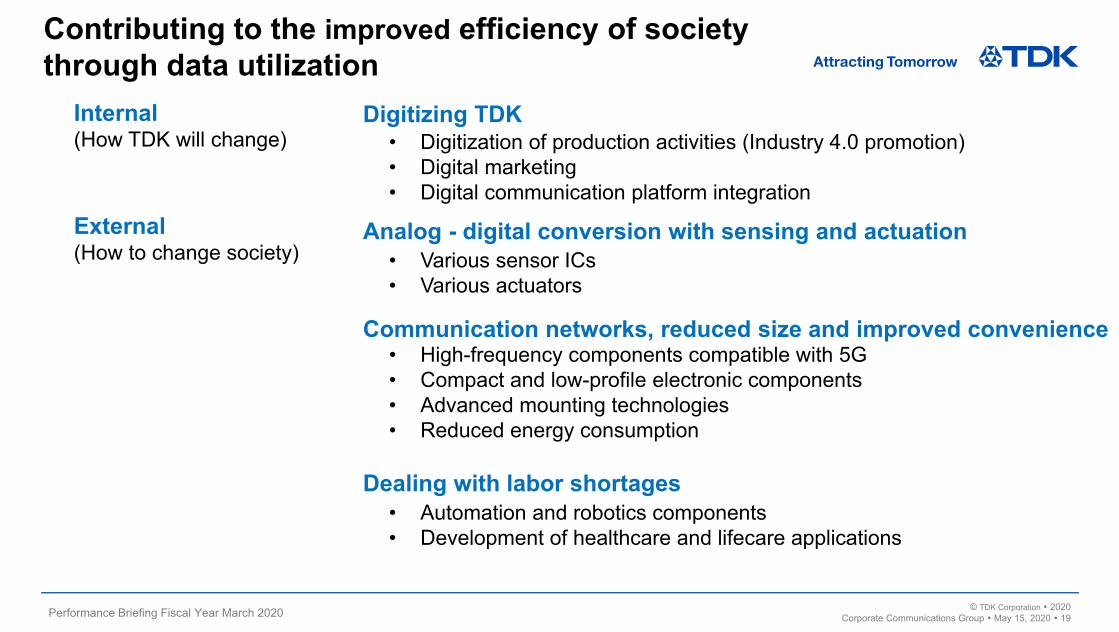
Contributing to the improved efficiency of society through data utilization
Analog - digital conversion with sensing and actuation
• Digitization of production activities (Industry 4.0 promotion)• Digital marketing• Digital communication platform integration
Digitizing TDK
• High-frequency components compatible with 5G• Compact and low-profile electronic components• Advanced mounting technologies• Reduced energy consumption
Communication networks, reduced size and improved convenience
• Various sensor ICs• Various actuators
Dealing with labor shortages• Automation and robotics components• Development of healthcare and lifecare applications
Internal(How TDK will change)
External(How to change society)
Performance Briefing Fiscal Year March 2020 © TDK Corporation 2020Corporate Communications Group May 15, 2020 20
Supplementary Data

Performance Briefing Fiscal Year March 2020 © TDK Corporation 2020Corporate Communications Group May 15, 2020 21
Financial position
(Yen billions) March end, 2018 March end, 2019 March end, 2020 Change2019-2020
Total assets 1,905.2 1,992.5 1,943.4 -49.1Total liabilities 1,074.0 1,108.7 1,094.8 -13.9Stockholder’s equity 824.6 877.3 844.0 -33.3
(comprehensive income) -119.5 -124.4 -190.1 -65.7Stockholder’s equity ratio 43.3% 44.0% 43.4% -0.6 pt
Cash and cash equivalents,short-term investments, marketable securities 323.3 329.7 365.3 35.6
Interest-bearing debt (*1) 483.0 520.3 424.7 -95.6Net cash (*2) -159.7 -190.6 -59.4 131.2
323.3 329.7 365.3
483.0 520.3424.7
(159.7) (190.6)
(59.4)
(200)
0
200
400
600
March end, 2018 March end, 2019 March end, 2020
Cash and cash equivalents, short-term investments Interest-bearing debt Net cash(Yen billions)
*1: Short-term debt + Current installments of long-term debt + Long-term debt, excluding current installments (except operating lease obligations)*2: Cash and cash equivalents - Interest-bearing debt

Performance Briefing Fiscal Year March 2020 © TDK Corporation 2020Corporate Communications Group May 15, 2020 22
Cash flows(Yen billions)
(Yen billions) March end, 2018 March end, 2019 March end, 2020 Change2019-2020
Capital expenditures 178.6 173.6 173.4 -0.2
Depreciation and amortization 92.2 106.6 125.0 18.4
91.3
140.3
222.4
(246.1)
(140.2)
(42.0)
(154.8)
0.1
180.4
(250)
(200)
(150)
(100)
(50)
0
50
100
150
200
250
March end, 2018 March end, 2019 March end, 2020
Operating cash flow Investment cash flow Free cash flow

Performance Briefing Fiscal Year March 2020 © TDK Corporation 2020Corporate Communications Group May 15, 2020 23
Quarterly sales and operating income by segment
1Q 2Q 3Q 4Q Total 1Q 2Q 3Q 4Q TotalCapacitors 44.5 43.9 42.7 42.3 173.3 39.3 39.6 37.3 37.7 153.9
Inductive Devices 38.9 39.5 37.3 34.3 150.0 34.1 35.7 34.8 33.0 137.6Other Passive Components 29.3 28.7 26.7 25.3 110.1 24.8 26.6 26.3 26.3 104.0
Passive Components 112.7 112.1 106.7 101.9 433.4 98.3 101.9 98.3 97.0 395.5Sensor Application Products 18.9 20.6 19.7 17.3 76.5 18.1 20.8 20.3 18.7 77.9
Magnetic Application Products 70.5 75.4 66.4 60.5 272.8 55.5 54.5 57.9 51.8 219.7Energy Application Products 125.6 154.8 145.4 111.8 537.5 144.5 173.7 161.2 118.3 597.7
15.4 16.0 12.6 17.6 61.6 20.4 19.4 17.9 14.5 72.3343.1 378.9 350.8 309.1 1,381.8 336.8 370.2 355.6 300.4 1,363.0
14.0 16.4 14.7 13.3 58.4 10.3 11.4 10.6 6.7 39.1(4.9) (4.6) (5.5) (7.2) (22.1) (7.0) (5.5) (5.5) (7.0) (25.0)3.5 0.9 7.8 4.8 17.0 3.3 3.5 5.2 (11.5) 0.4
Energy Application Products 21.0 33.3 24.6 12.1 91.0 26.5 42.5 40.5 14.7 124.1(1.0) (1.7) (1.2) (2.8) (6.7) 0.3 (0.6) (2.5) (5.8) (8.6)32.5 44.4 40.5 20.3 137.6 33.4 51.2 48.4 (3.0) 130.0(7.1) (7.6) (7.7) (7.4) (29.8) (8.4) (7.3) (8.0) (8.4) (32.2)
25.4 36.8 32.8 12.9 107.8 25.0 43.9 40.4 (11.4) 97.9109.09 111.50 112.90 110.23 110.94 110.10 107.39 108.74 109.05 108.82130.16 129.63 128.87 125.18 128.48 123.57 119.48 120.34 120.32 120.92
Other
FY March 2020
(Yen billions)
FY March 2019
Net sales
Corporate and eliminations
Total
Ex-rate
US$ (JPY)
EURO (JPY)
Total
Operating incom
e
Passive Components
Sub total
Sensor Application ProductsMagnetic Application Products
Other
Performance Briefing Fiscal Year March 2020 © TDK Corporation 2020Corporate Communications Group May 15, 2020 24
167.6
87.5 91.3
178.6
92.2102.6
173.6
106.6 115.2
173.4
125.0 117.5
180.0
140.0120.0
0
50
100
150
200
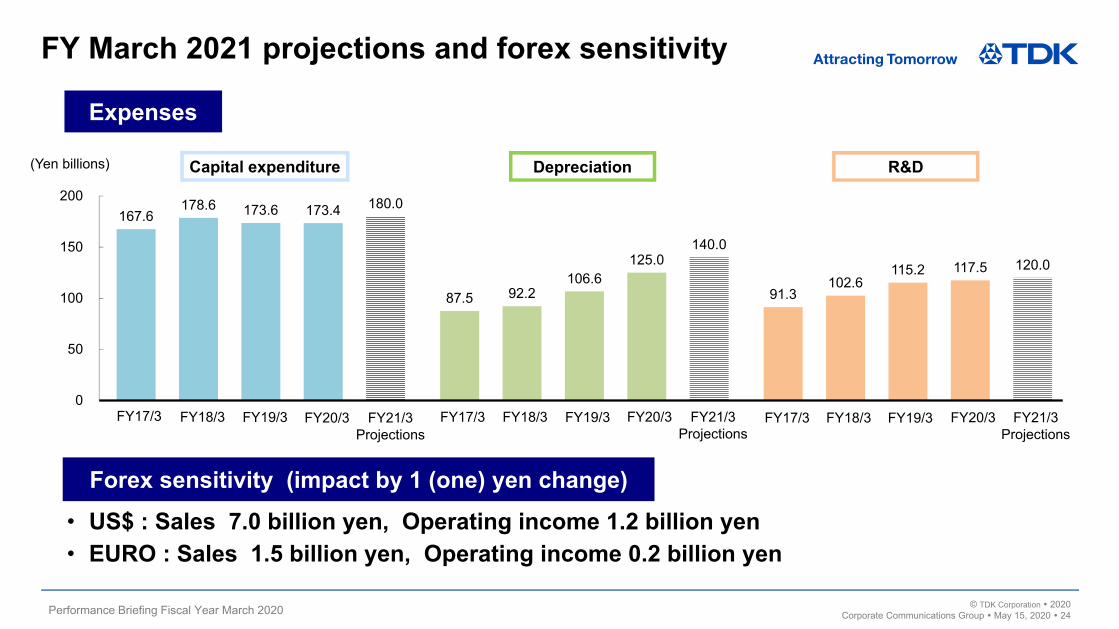
FY March 2021 projections and forex sensitivity
(Yen billions) Capital expenditure Depreciation R&D
FY17/3 FY18/3 FY19/3 FY20/3
Expenses
Forex sensitivity (impact by 1 (one) yen change)・ US$ : Sales 7.0 billion yen, Operating income 1.2 billion yen・ EURO : Sales 1.5 billion yen, Operating income 0.2 billion yen
FY21/3Projections
FY17/3 FY18/3 FY19/3 FY20/3 FY21/3Projections
FY17/3 FY18/3 FY19/3 FY20/3 FY21/3Projections
Performance Briefing Fiscal Year March 2020 © TDK Corporation 2020Corporate Communications Group May 15, 2020 25
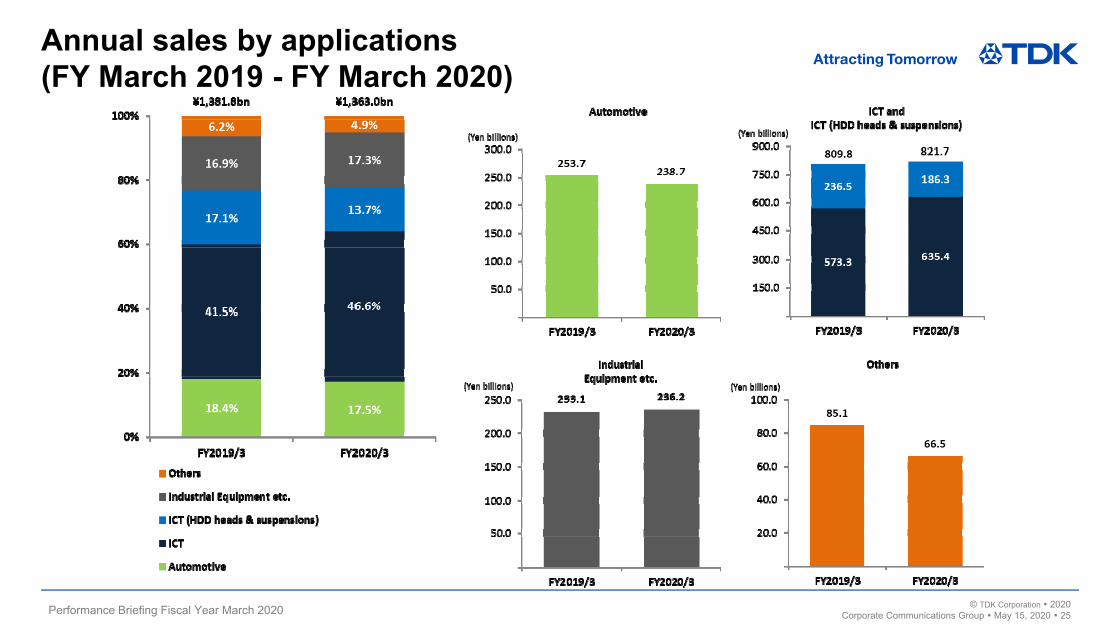
Annual sales by applications (FY March 2019 - FY March 2020)
Performance Briefing Fiscal Year March 2020 © TDK Corporation 2020Corporate Communications Group May 15, 2020 26
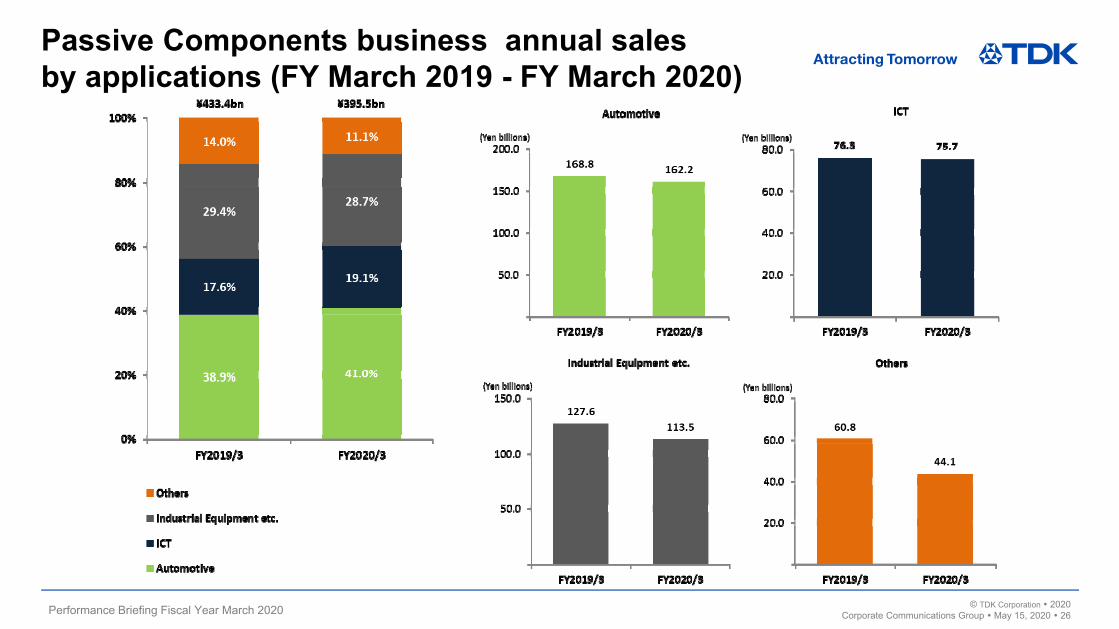
Passive Components business annual sales by applications (FY March 2019 - FY March 2020)

Performance Briefing Fiscal Year March 2020 © TDK Corporation 2020Corporate Communications Group May 15, 2020 27
Quarterly sales by applications (FY March 2019 - FY March 2020)

Performance Briefing Fiscal Year March 2020 © TDK Corporation 2020Corporate Communications Group May 15, 2020 28
Passive Components business quarterly sales by applications (FY March 2019 - FY March 2020)

Performance Briefing Fiscal Year March 2020 © TDK Corporation 2020Corporate Communications Group May 15, 2020 29

Performance Briefing Fiscal Year March 2020 © TDK Corporation 2020Corporate Communications Group May 15, 2020 30
Performance Briefing Fiscal Year March 2020 © TDK Corporation 2020Corporate Communications Group May 15, 2020 31
Cautionary statements with respect to forward-looking statements
This material contains forward-looking statements, including projections, plans, policies, management strategies, targets, schedules, understandings, and evaluations about TDK, or its group companies (TDK Group). These forward-looking statements are based on the current forecasts, estimates, assumptions, plans, beliefs, and evaluations of the TDK Group in light of the information currently available to it, and contain known and unknown risks, uncertainties, and other factors. The TDK Group therefore wishes to caution readers that, being subject to risks, uncertainties, and other factors, the TDK Group’s actual results, performance, achievements, or financial position could be materially different from any future results, performance, achievements, or financial position expressed or implied by these forward-looking statements, and the TDK Group undertakes no obligation to publicly update or revise any forward-looking statements after the issue of this material except as provided for in laws and ordinances.
The electronics markets in which the TDK Group operates are highly susceptible to rapid changes, risks, uncertainties, and other factors that can have significant effects on the TDK Group including, but not limited to, shifts in technology, fluctuations in demand, prices, interest and foreign exchange rates, and changes in economic environments, conditions of competition, laws and regulations. Also, since the purpose of these materials is only to give readers a general outline of business performance, many numerical values are shown in units of a billion yen. Because original values, which are managed in units of a million yen, are rounded off, the totals, differences, etc. shown in these materials may appear inaccurate. If detailed figures are necessary, please refer to our financial statements and supplementary materials.
Text data including Q&A of performance briefing will be uploaded on following site.https://www.tdk.com/corp/en/ir/ir_events/conference/2020/4q_1.htm