Performance Based Seismic Design of the Gigafactory c.ymcdn.com/sites/ · PDF filePerformance...
13
2017 SEAOC CONVENTION PROCEEDINGS 1 Performance Based Seismic Design of the Gigafactory in Tesla Time John Osteraas, Ph.D., P.E., Principal Engineer Jeffrey Hunt, Ph.D., P.E., Managing Engineer Exponent, Inc. Menlo Park, CA Gregory Luth, Ph.D., S.E., President Gregory P. Luth & Associates Santa Clara, CA Abstract When completed, the Tesla Gigafactory currently under construction outside Reno, Nevada, will be the world’s largest building. Each structural module is 70 feet tall on a brace-free footprint of a third of a million square feet with multiple stories and design floor loadings of 350 pounds per square foot. The extremely aggressive design and construction schedule required completion of the design of the lateral system (confined to the building perimeter) before overall interior floor configuration, manufacturing equipment layout, and mass were determined. Thus, it was necessary to design a lateral system capable of accommodating dramatic vertical and horizontal mass irregularities. Rocking strongbacks were employed to enforce first mode response regardless of vertical mass distribution. Lateral forces are resisted by a combination of Buckling Restrained Braced Frames (BRBFs) and sacrificial slotted plates (Krawinkler Fuses or KFs) which are all designed to yield simultaneously at the elastic design limit, providing robust damping. All other structural members are designed to develop the full capacity of the BRBs and KFs while remaining elastic. Introduction The Tesla Gigafactory 1 (“Gigafactory”) is a massive factory located near Reno, Nevada largely dedicated to the manufacture of lithium-ion batteries and battery packs. When completed, the Gigafactory is expected to be the world’s largest building by footprint. While a single contiguous building, the Gigafactory is comprised of multiple independent multi-story rectangular structures (modules), allowing the Gigafactory to be built in phases so that Tesla can begin manufacturing immediately inside the finished portions. Limited production at the factory began in the first quarter of 2016, and mass production of cells began in January 2017. By January 2017, approximately 30 percent of the Gigafactory had been built. An artist’s rendering of the completed Gigafactory is shown in Figure 1. The footprint of the completed building will be approximately six million square feet, the area of 100 football fields. Figure 1. Artist’s rendering of the completed Gigafactory (Tesla, 2017a). Figure 2. Aerial image of the Gigafactory taken in January 2017 (Tesla, 2017b).
-
Upload
trinhduong -
Category
Documents
-
view
217 -
download
0
Transcript of Performance Based Seismic Design of the Gigafactory c.ymcdn.com/sites/ · PDF filePerformance...
2017 SEAOC CONVENTION PROCEEDINGS
1
Performance Based Seismic Design of the Gigafactory in Tesla Time
John Osteraas, Ph.D., P.E., Principal Engineer
Jeffrey Hunt, Ph.D., P.E., Managing Engineer Exponent, Inc.
Menlo Park, CA
Gregory Luth, Ph.D., S.E., President Gregory P. Luth & Associates
Santa Clara, CA
Abstract When completed, the Tesla Gigafactory currently under construction outside Reno, Nevada, will be the world’s largest building. Each structural module is 70 feet tall on a brace-free footprint of a third of a million square feet with multiple stories and design floor loadings of 350 pounds per square foot. The extremely aggressive design and construction schedule required completion of the design of the lateral system (confined to the building perimeter) before overall interior floor configuration, manufacturing equipment layout, and mass were determined. Thus, it was necessary to design a lateral system capable of accommodating dramatic vertical and horizontal mass irregularities. Rocking strongbacks were employed to enforce first mode response regardless of vertical mass distribution. Lateral forces are resisted by a combination of Buckling Restrained Braced Frames (BRBFs) and sacrificial slotted plates (Krawinkler Fuses or KFs) which are all designed to yield simultaneously at the elastic design limit, providing robust damping. All other structural members are designed to develop the full capacity of the BRBs and KFs while remaining elastic. Introduction The Tesla Gigafactory 1 (“Gigafactory”) is a massive factory located near Reno, Nevada largely dedicated to the manufacture of lithium-ion batteries and battery packs. When completed, the Gigafactory is expected to be the world’s largest building by footprint. While a single contiguous building, the Gigafactory is comprised of multiple independent multi-story rectangular structures (modules), allowing the Gigafactory to be built in phases so that Tesla can begin manufacturing immediately inside the finished portions. Limited production at the factory began in the first quarter of 2016, and mass production of cells began in
January 2017. By January 2017, approximately 30 percent of the Gigafactory had been built. An artist’s rendering of the completed Gigafactory is shown in Figure 1. The footprint of the completed building will be approximately six million square feet, the area of 100 football fields.
Figure 1. Artist’s rendering of the completed Gigafactory (Tesla, 2017a).
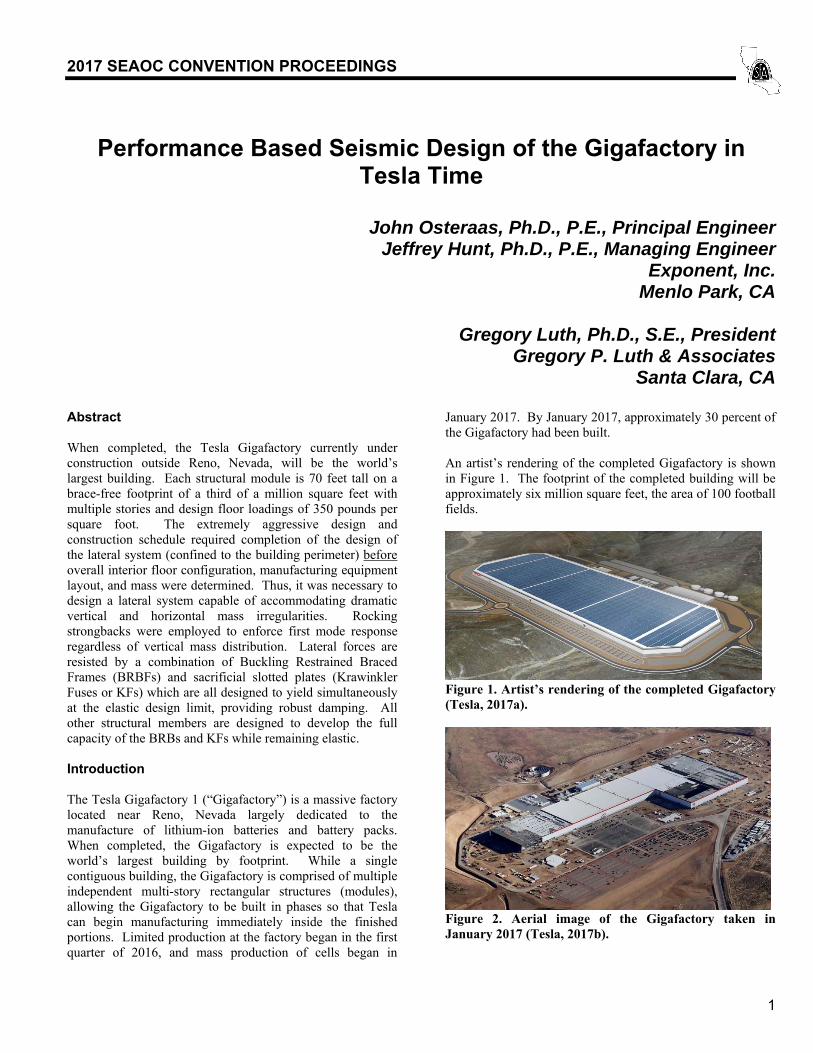
Figure 2. Aerial image of the Gigafactory taken in January 2017 (Tesla, 2017b).
2017 SEAOC CONVENTION PROCEEDINGS
2
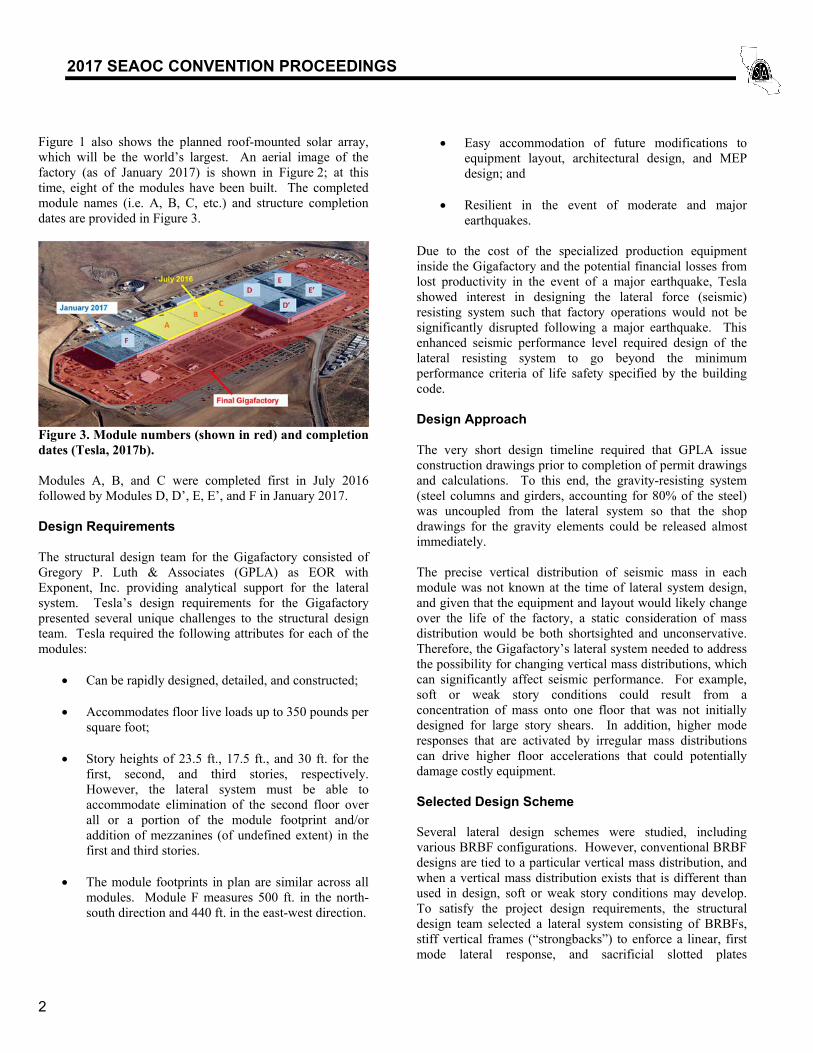
Figure 1 also shows the planned roof-mounted solar array, which will be the world’s largest. An aerial image of the factory (as of January 2017) is shown in Figure 2; at this time, eight of the modules have been built. The completed module names (i.e. A, B, C, etc.) and structure completion dates are provided in Figure 3.
Figure 3. Module numbers (shown in red) and completion dates (Tesla, 2017b). Modules A, B, and C were completed first in July 2016 followed by Modules D, D’, E, E’, and F in January 2017. Design Requirements The structural design team for the Gigafactory consisted of Gregory P. Luth & Associates (GPLA) as EOR with Exponent, Inc. providing analytical support for the lateral system. Tesla’s design requirements for the Gigafactory presented several unique challenges to the structural design team. Tesla required the following attributes for each of the modules:
Can be rapidly designed, detailed, and constructed;
Accommodates floor live loads up to 350 pounds per square foot;
Story heights of 23.5 ft., 17.5 ft., and 30 ft. for the first, second, and third stories, respectively. However, the lateral system must be able to accommodate elimination of the second floor over all or a portion of the module footprint and/or addition of mezzanines (of undefined extent) in the first and third stories.
The module footprints in plan are similar across all
modules. Module F measures 500 ft. in the north-south direction and 440 ft. in the east-west direction.
Easy accommodation of future modifications to equipment layout, architectural design, and MEP design; and
Resilient in the event of moderate and major earthquakes.
Due to the cost of the specialized production equipment inside the Gigafactory and the potential financial losses from lost productivity in the event of a major earthquake, Tesla showed interest in designing the lateral force (seismic) resisting system such that factory operations would not be significantly disrupted following a major earthquake. This enhanced seismic performance level required design of the lateral resisting system to go beyond the minimum performance criteria of life safety specified by the building code. Design Approach The very short design timeline required that GPLA issue construction drawings prior to completion of permit drawings and calculations. To this end, the gravity-resisting system (steel columns and girders, accounting for 80% of the steel) was uncoupled from the lateral system so that the shop drawings for the gravity elements could be released almost immediately. The precise vertical distribution of seismic mass in each module was not known at the time of lateral system design, and given that the equipment and layout would likely change over the life of the factory, a static consideration of mass distribution would be both shortsighted and unconservative. Therefore, the Gigafactory’s lateral system needed to address the possibility for changing vertical mass distributions, which can significantly affect seismic performance. For example, soft or weak story conditions could result from a concentration of mass onto one floor that was not initially designed for large story shears. In addition, higher mode responses that are activated by irregular mass distributions can drive higher floor accelerations that could potentially damage costly equipment. Selected Design Scheme Several lateral design schemes were studied, including various BRBF configurations. However, conventional BRBF designs are tied to a particular vertical mass distribution, and when a vertical mass distribution exists that is different than used in design, soft or weak story conditions may develop. To satisfy the project design requirements, the structural design team selected a lateral system consisting of BRBFs, stiff vertical frames (“strongbacks”) to enforce a linear, first mode lateral response, and sacrificial slotted plates
2017 SEAOC CONVENTION PROCEEDINGS
3
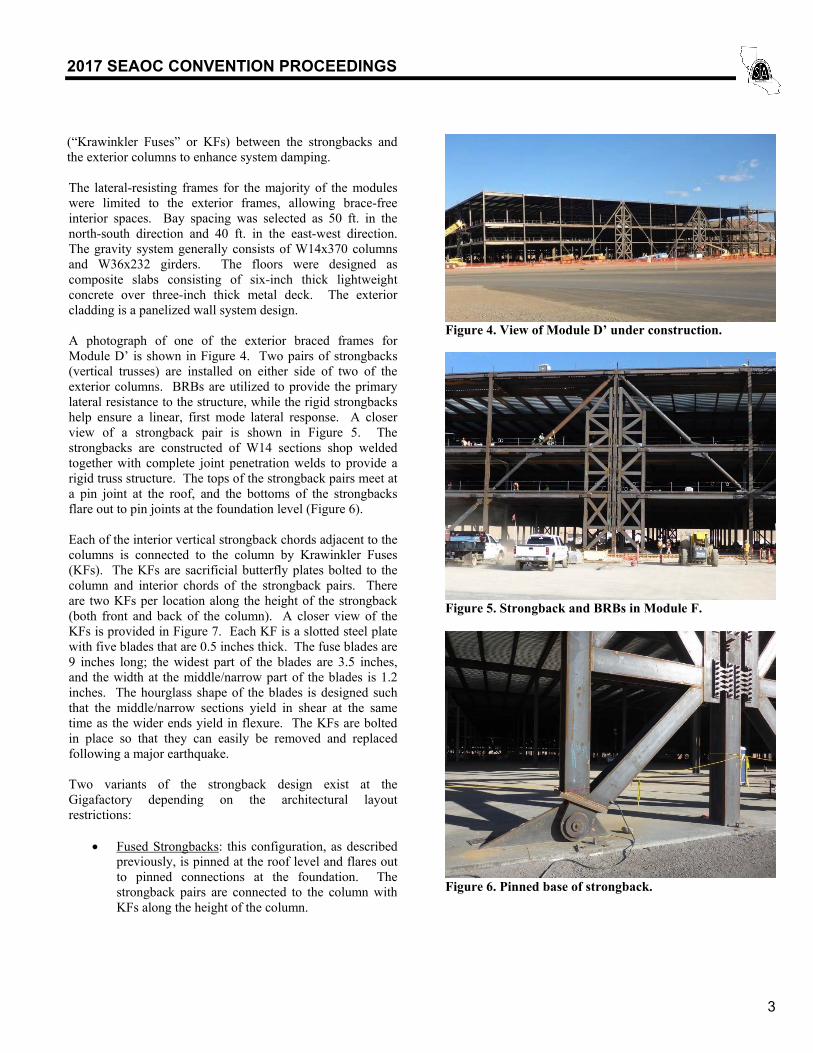
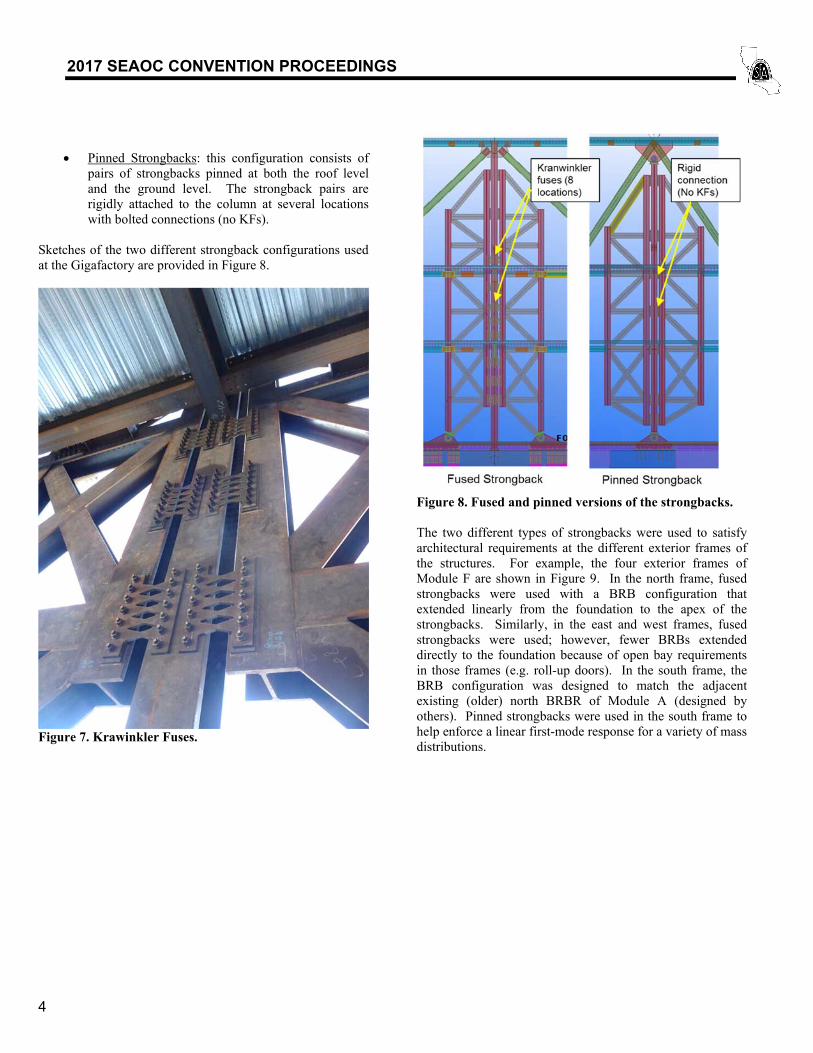
(“Krawinkler Fuses” or KFs) between the strongbacks and the exterior columns to enhance system damping. The lateral-resisting frames for the majority of the modules were limited to the exterior frames, allowing brace-free interior spaces. Bay spacing was selected as 50 ft. in the north-south direction and 40 ft. in the east-west direction. The gravity system generally consists of W14x370 columns and W36x232 girders. The floors were designed as composite slabs consisting of six-inch thick lightweight concrete over three-inch thick metal deck. The exterior cladding is a panelized wall system design. A photograph of one of the exterior braced frames for Module D’ is shown in Figure 4. Two pairs of strongbacks (vertical trusses) are installed on either side of two of the exterior columns. BRBs are utilized to provide the primary lateral resistance to the structure, while the rigid strongbacks help ensure a linear, first mode lateral response. A closer view of a strongback pair is shown in Figure 5. The strongbacks are constructed of W14 sections shop welded together with complete joint penetration welds to provide a rigid truss structure. The tops of the strongback pairs meet at a pin joint at the roof, and the bottoms of the strongbacks flare out to pin joints at the foundation level (Figure 6). Each of the interior vertical strongback chords adjacent to the columns is connected to the column by Krawinkler Fuses (KFs). The KFs are sacrificial butterfly plates bolted to the column and interior chords of the strongback pairs. There are two KFs per location along the height of the strongback (both front and back of the column). A closer view of the KFs is provided in Figure 7. Each KF is a slotted steel plate with five blades that are 0.5 inches thick. The fuse blades are 9 inches long; the widest part of the blades are 3.5 inches, and the width at the middle/narrow part of the blades is 1.2 inches. The hourglass shape of the blades is designed such that the middle/narrow sections yield in shear at the same time as the wider ends yield in flexure. The KFs are bolted in place so that they can easily be removed and replaced following a major earthquake. Two variants of the strongback design exist at the Gigafactory depending on the architectural layout restrictions:
Fused Strongbacks: this configuration, as described previously, is pinned at the roof level and flares out to pinned connections at the foundation. The strongback pairs are connected to the column with KFs along the height of the column.
Figure 4. View of Module D’ under construction.
Figure 5. Strongback and BRBs in Module F.
Figure 6. Pinned base of strongback.
2017 SEAOC CONVENTION PROCEEDINGS
4
Pinned Strongbacks: this configuration consists of
pairs of strongbacks pinned at both the roof level and the ground level. The strongback pairs are rigidly attached to the column at several locations with bolted connections (no KFs).
Sketches of the two different strongback configurations used at the Gigafactory are provided in Figure 8.
Figure 7. Krawinkler Fuses.
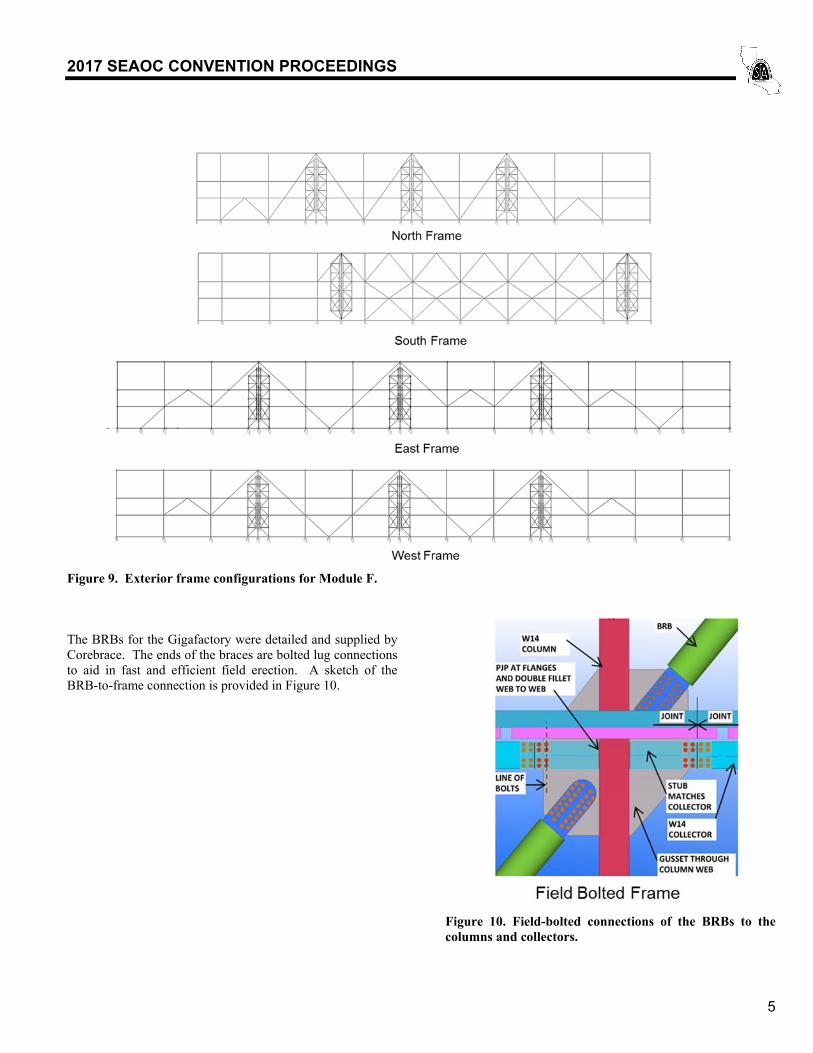
Figure 8. Fused and pinned versions of the strongbacks. The two different types of strongbacks were used to satisfy architectural requirements at the different exterior frames of the structures. For example, the four exterior frames of Module F are shown in Figure 9. In the north frame, fused strongbacks were used with a BRB configuration that extended linearly from the foundation to the apex of the strongbacks. Similarly, in the east and west frames, fused strongbacks were used; however, fewer BRBs extended directly to the foundation because of open bay requirements in those frames (e.g. roll-up doors). In the south frame, the BRB configuration was designed to match the adjacent existing (older) north BRBR of Module A (designed by others). Pinned strongbacks were used in the south frame to help enforce a linear first-mode response for a variety of mass distributions.
2017 SEAOC CONVENTION PROCEEDINGS
5
Figure 9. Exterior frame configurations for Module F. The BRBs for the Gigafactory were detailed and supplied by Corebrace. The ends of the braces are bolted lug connections to aid in fast and efficient field erection. A sketch of the BRB-to-frame connection is provided in Figure 10.
Figure 10. Field-bolted connections of the BRBs to the columns and collectors.
2017 SEAOC CONVENTION PROCEEDINGS
6
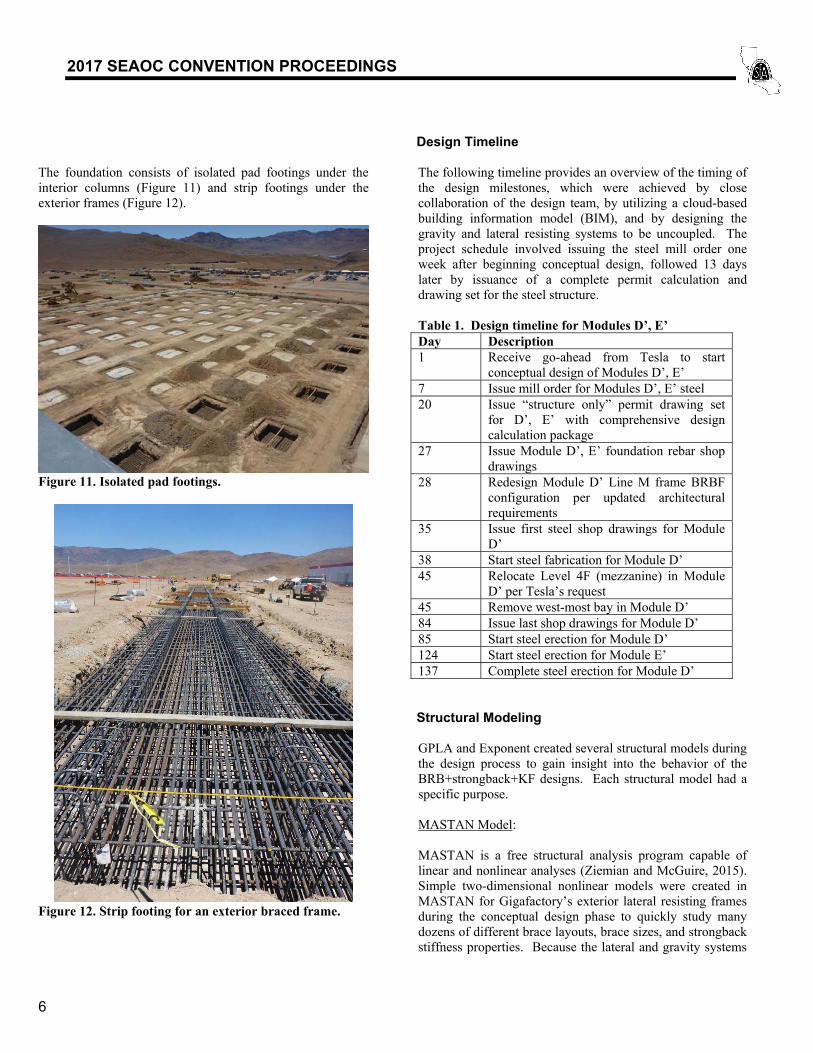
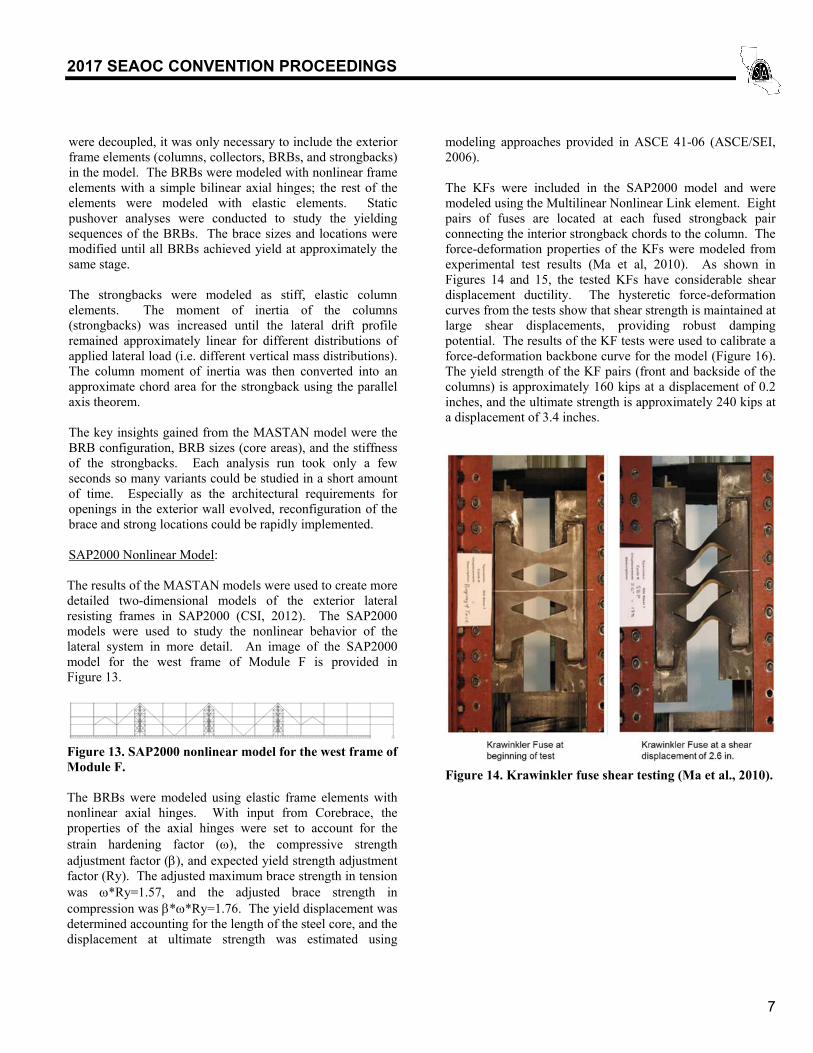
The foundation consists of isolated pad footings under the interior columns (Figure 11) and strip footings under the exterior frames (Figure 12).
Figure 11. Isolated pad footings.
Figure 12. Strip footing for an exterior braced frame.
Design Timeline The following timeline provides an overview of the timing of the design milestones, which were achieved by close collaboration of the design team, by utilizing a cloud-based building information model (BIM), and by designing the gravity and lateral resisting systems to be uncoupled. The project schedule involved issuing the steel mill order one week after beginning conceptual design, followed 13 days later by issuance of a complete permit calculation and drawing set for the steel structure. Table 1. Design timeline for Modules D’, E’ Day Description 1 Receive go-ahead from Tesla to start
conceptual design of Modules D’, E’ 7 Issue mill order for Modules D’, E’ steel 20 Issue “structure only” permit drawing set
for D’, E’ with comprehensive design calculation package
27 Issue Module D’, E’ foundation rebar shop drawings
28 Redesign Module D’ Line M frame BRBF configuration per updated architectural requirements
35 Issue first steel shop drawings for Module D’
38 Start steel fabrication for Module D’ 45 Relocate Level 4F (mezzanine) in Module
D’ per Tesla’s request 45 Remove west-most bay in Module D’ 84 Issue last shop drawings for Module D’ 85 Start steel erection for Module D’ 124 Start steel erection for Module E’ 137 Complete steel erection for Module D’ Structural Modeling GPLA and Exponent created several structural models during the design process to gain insight into the behavior of the BRB+strongback+KF designs. Each structural model had a specific purpose. MASTAN Model: MASTAN is a free structural analysis program capable of linear and nonlinear analyses (Ziemian and McGuire, 2015). Simple two-dimensional nonlinear models were created in MASTAN for Gigafactory’s exterior lateral resisting frames during the conceptual design phase to quickly study many dozens of different brace layouts, brace sizes, and strongback stiffness properties. Because the lateral and gravity systems
2017 SEAOC CONVENTION PROCEEDINGS
7
were decoupled, it was only necessary to include the exterior frame elements (columns, collectors, BRBs, and strongbacks) in the model. The BRBs were modeled with nonlinear frame elements with a simple bilinear axial hinges; the rest of the elements were modeled with elastic elements. Static pushover analyses were conducted to study the yielding sequences of the BRBs. The brace sizes and locations were modified until all BRBs achieved yield at approximately the same stage. The strongbacks were modeled as stiff, elastic column elements. The moment of inertia of the columns (strongbacks) was increased until the lateral drift profile remained approximately linear for different distributions of applied lateral load (i.e. different vertical mass distributions). The column moment of inertia was then converted into an approximate chord area for the strongback using the parallel axis theorem. The key insights gained from the MASTAN model were the BRB configuration, BRB sizes (core areas), and the stiffness of the strongbacks. Each analysis run took only a few seconds so many variants could be studied in a short amount of time. Especially as the architectural requirements for openings in the exterior wall evolved, reconfiguration of the brace and strong locations could be rapidly implemented. SAP2000 Nonlinear Model: The results of the MASTAN models were used to create more detailed two-dimensional models of the exterior lateral resisting frames in SAP2000 (CSI, 2012). The SAP2000 models were used to study the nonlinear behavior of the lateral system in more detail. An image of the SAP2000 model for the west frame of Module F is provided in Figure 13.
Figure 13. SAP2000 nonlinear model for the west frame of Module F. The BRBs were modeled using elastic frame elements with nonlinear axial hinges. With input from Corebrace, the properties of the axial hinges were set to account for the strain hardening factor (), the compressive strength adjustment factor (), and expected yield strength adjustment factor (Ry). The adjusted maximum brace strength in tension was *Ry=1.57, and the adjusted brace strength in compression was **Ry=1.76. The yield displacement was determined accounting for the length of the steel core, and the displacement at ultimate strength was estimated using
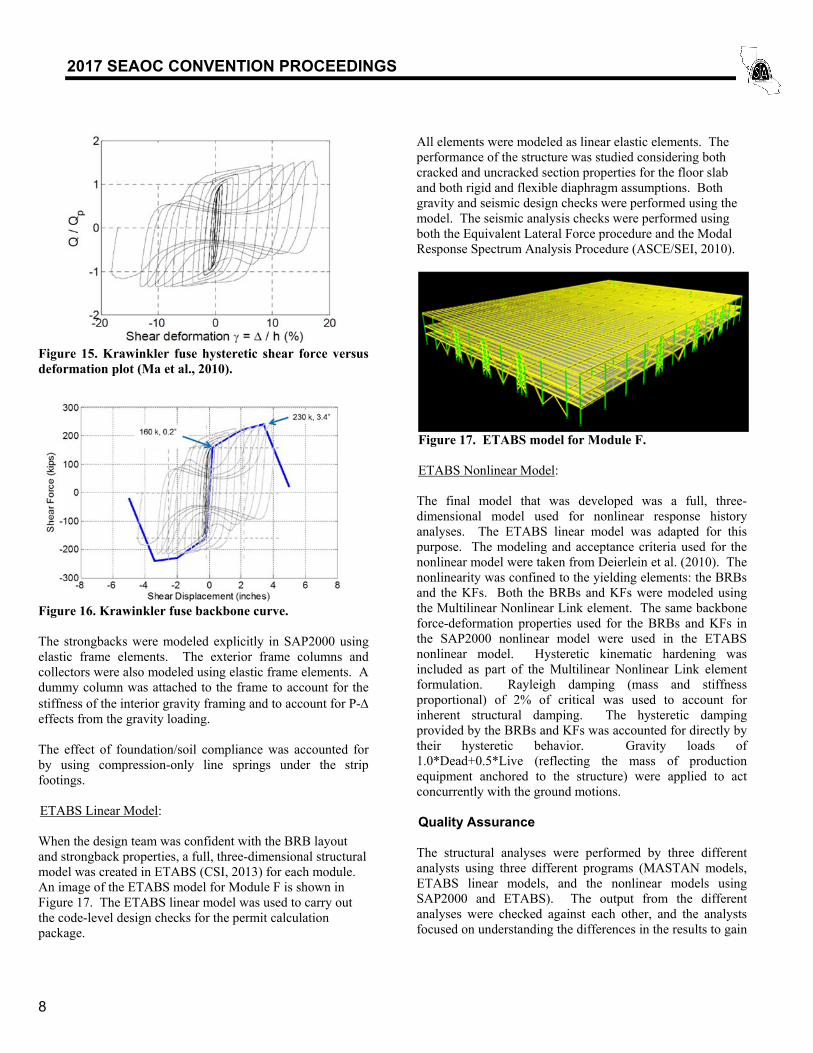
modeling approaches provided in ASCE 41-06 (ASCE/SEI, 2006). The KFs were included in the SAP2000 model and were modeled using the Multilinear Nonlinear Link element. Eight pairs of fuses are located at each fused strongback pair connecting the interior strongback chords to the column. The force-deformation properties of the KFs were modeled from experimental test results (Ma et al, 2010). As shown in Figures 14 and 15, the tested KFs have considerable shear displacement ductility. The hysteretic force-deformation curves from the tests show that shear strength is maintained at large shear displacements, providing robust damping potential. The results of the KF tests were used to calibrate a force-deformation backbone curve for the model (Figure 16). The yield strength of the KF pairs (front and backside of the columns) is approximately 160 kips at a displacement of 0.2 inches, and the ultimate strength is approximately 240 kips at a displacement of 3.4 inches.
Figure 14. Krawinkler fuse shear testing (Ma et al., 2010).
2017 SEAOC CONVENTION PROCEEDINGS
8
Figure 15. Krawinkler fuse hysteretic shear force versus deformation plot (Ma et al., 2010).
Figure 16. Krawinkler fuse backbone curve. The strongbacks were modeled explicitly in SAP2000 using elastic frame elements. The exterior frame columns and collectors were also modeled using elastic frame elements. A dummy column was attached to the frame to account for the stiffness of the interior gravity framing and to account for P- effects from the gravity loading. The effect of foundation/soil compliance was accounted for by using compression-only line springs under the strip footings. ETABS Linear Model: When the design team was confident with the BRB layout and strongback properties, a full, three-dimensional structural model was created in ETABS (CSI, 2013) for each module. An image of the ETABS model for Module F is shown in Figure 17. The ETABS linear model was used to carry out the code-level design checks for the permit calculation package.
All elements were modeled as linear elastic elements. The performance of the structure was studied considering both cracked and uncracked section properties for the floor slab and both rigid and flexible diaphragm assumptions. Both gravity and seismic design checks were performed using the model. The seismic analysis checks were performed using both the Equivalent Lateral Force procedure and the Modal Response Spectrum Analysis Procedure (ASCE/SEI, 2010).
Figure 17. ETABS model for Module F. ETABS Nonlinear Model: The final model that was developed was a full, three-dimensional model used for nonlinear response history analyses. The ETABS linear model was adapted for this purpose. The modeling and acceptance criteria used for the nonlinear model were taken from Deierlein et al. (2010). The nonlinearity was confined to the yielding elements: the BRBs and the KFs. Both the BRBs and KFs were modeled using the Multilinear Nonlinear Link element. The same backbone force-deformation properties used for the BRBs and KFs in the SAP2000 nonlinear model were used in the ETABS nonlinear model. Hysteretic kinematic hardening was included as part of the Multilinear Nonlinear Link element formulation. Rayleigh damping (mass and stiffness proportional) of 2% of critical was used to account for inherent structural damping. The hysteretic damping provided by the BRBs and KFs was accounted for directly by their hysteretic behavior. Gravity loads of 1.0*Dead+0.5*Live (reflecting the mass of production equipment anchored to the structure) were applied to act concurrently with the ground motions. Quality Assurance The structural analyses were performed by three different analysts using three different programs (MASTAN models, ETABS linear models, and the nonlinear models using SAP2000 and ETABS). The output from the different analyses were checked against each other, and the analysts focused on understanding the differences in the results to gain
2017 SEAOC CONVENTION PROCEEDINGS
9
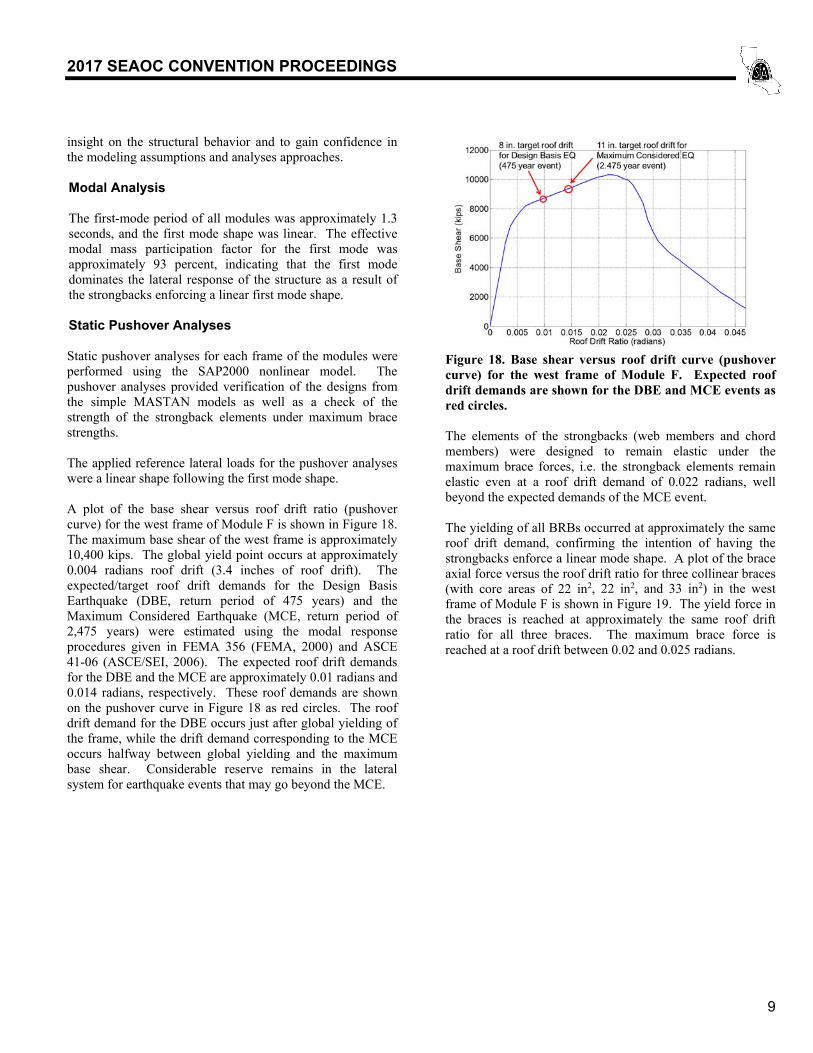
insight on the structural behavior and to gain confidence in the modeling assumptions and analyses approaches. Modal Analysis The first-mode period of all modules was approximately 1.3 seconds, and the first mode shape was linear. The effective modal mass participation factor for the first mode was approximately 93 percent, indicating that the first mode dominates the lateral response of the structure as a result of the strongbacks enforcing a linear first mode shape. Static Pushover Analyses Static pushover analyses for each frame of the modules were performed using the SAP2000 nonlinear model. The pushover analyses provided verification of the designs from the simple MASTAN models as well as a check of the strength of the strongback elements under maximum brace strengths. The applied reference lateral loads for the pushover analyses were a linear shape following the first mode shape. A plot of the base shear versus roof drift ratio (pushover curve) for the west frame of Module F is shown in Figure 18. The maximum base shear of the west frame is approximately 10,400 kips. The global yield point occurs at approximately 0.004 radians roof drift (3.4 inches of roof drift). The expected/target roof drift demands for the Design Basis Earthquake (DBE, return period of 475 years) and the Maximum Considered Earthquake (MCE, return period of 2,475 years) were estimated using the modal response procedures given in FEMA 356 (FEMA, 2000) and ASCE 41-06 (ASCE/SEI, 2006). The expected roof drift demands for the DBE and the MCE are approximately 0.01 radians and 0.014 radians, respectively. These roof demands are shown on the pushover curve in Figure 18 as red circles. The roof drift demand for the DBE occurs just after global yielding of the frame, while the drift demand corresponding to the MCE occurs halfway between global yielding and the maximum base shear. Considerable reserve remains in the lateral system for earthquake events that may go beyond the MCE.
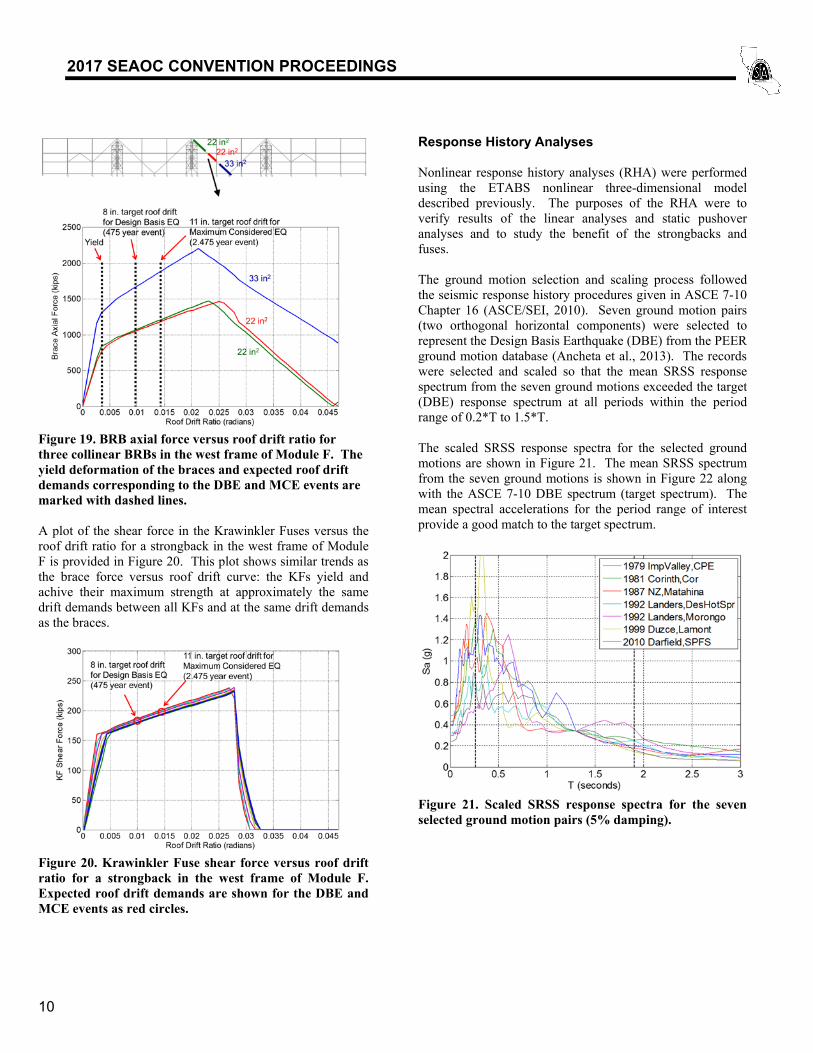
Figure 18. Base shear versus roof drift curve (pushover curve) for the west frame of Module F. Expected roof drift demands are shown for the DBE and MCE events as red circles. The elements of the strongbacks (web members and chord members) were designed to remain elastic under the maximum brace forces, i.e. the strongback elements remain elastic even at a roof drift demand of 0.022 radians, well beyond the expected demands of the MCE event. The yielding of all BRBs occurred at approximately the same roof drift demand, confirming the intention of having the strongbacks enforce a linear mode shape. A plot of the brace axial force versus the roof drift ratio for three collinear braces (with core areas of 22 in2, 22 in2, and 33 in2) in the west frame of Module F is shown in Figure 19. The yield force in the braces is reached at approximately the same roof drift ratio for all three braces. The maximum brace force is reached at a roof drift between 0.02 and 0.025 radians.
2017 SEAOC CONVENTION PROCEEDINGS
10
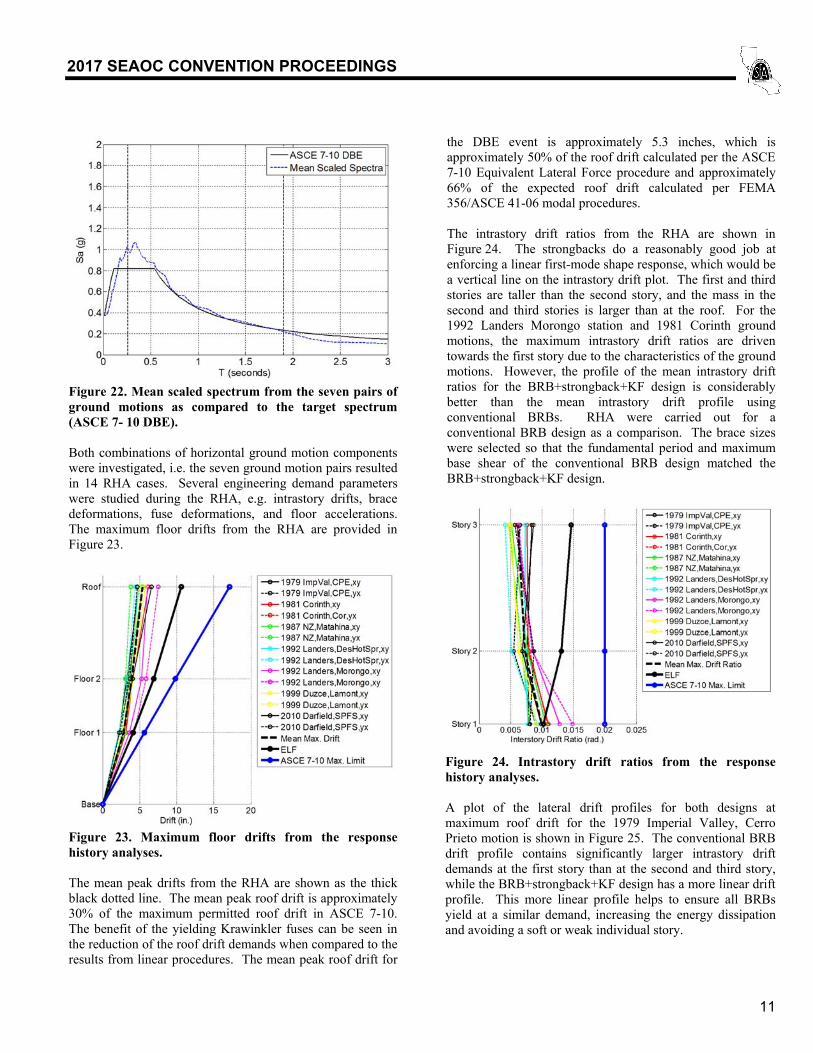
Figure 19. BRB axial force versus roof drift ratio for three collinear BRBs in the west frame of Module F. The yield deformation of the braces and expected roof drift demands corresponding to the DBE and MCE events are marked with dashed lines. A plot of the shear force in the Krawinkler Fuses versus the roof drift ratio for a strongback in the west frame of Module F is provided in Figure 20. This plot shows similar trends as the brace force versus roof drift curve: the KFs yield and achive their maximum strength at approximately the same drift demands between all KFs and at the same drift demands as the braces.
Figure 20. Krawinkler Fuse shear force versus roof drift ratio for a strongback in the west frame of Module F. Expected roof drift demands are shown for the DBE and MCE events as red circles.
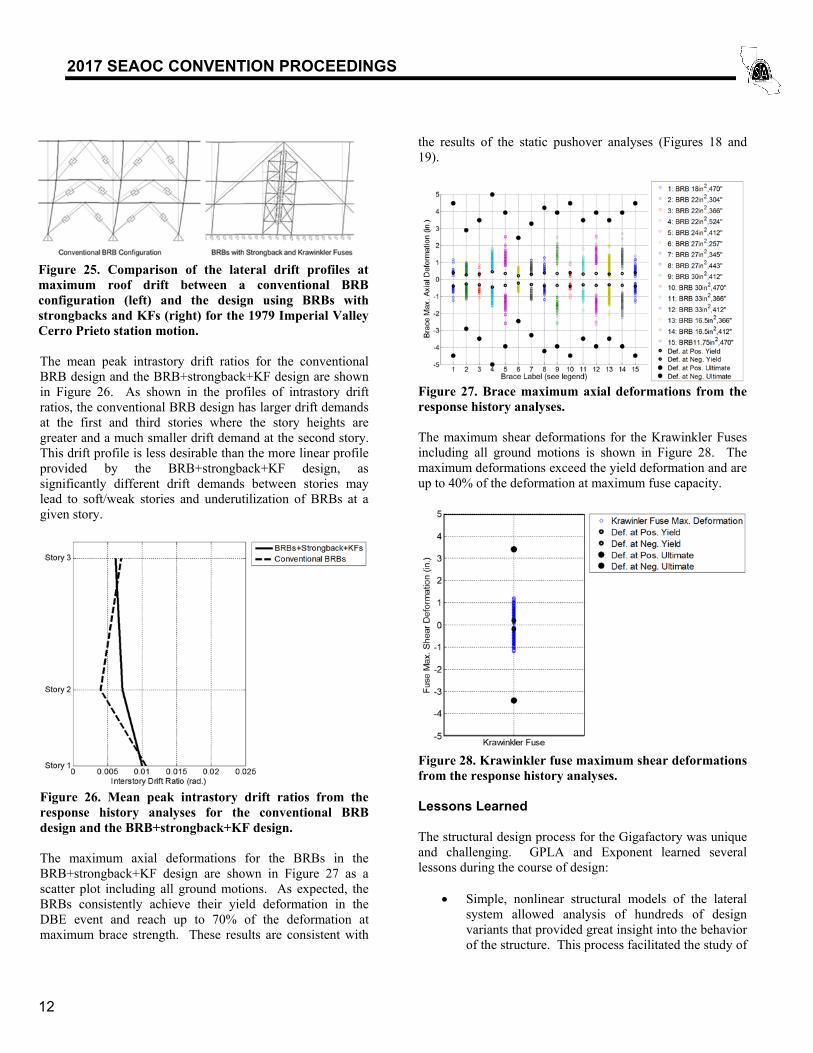
Response History Analyses Nonlinear response history analyses (RHA) were performed using the ETABS nonlinear three-dimensional model described previously. The purposes of the RHA were to verify results of the linear analyses and static pushover analyses and to study the benefit of the strongbacks and fuses. The ground motion selection and scaling process followed the seismic response history procedures given in ASCE 7-10 Chapter 16 (ASCE/SEI, 2010). Seven ground motion pairs (two orthogonal horizontal components) were selected to represent the Design Basis Earthquake (DBE) from the PEER ground motion database (Ancheta et al., 2013). The records were selected and scaled so that the mean SRSS response spectrum from the seven ground motions exceeded the target (DBE) response spectrum at all periods within the period range of 0.2*T to 1.5*T. The scaled SRSS response spectra for the selected ground motions are shown in Figure 21. The mean SRSS spectrum from the seven ground motions is shown in Figure 22 along with the ASCE 7-10 DBE spectrum (target spectrum). The mean spectral accelerations for the period range of interest provide a good match to the target spectrum.
Figure 21. Scaled SRSS response spectra for the seven selected ground motion pairs (5% damping).
2017 SEAOC CONVENTION PROCEEDINGS
11
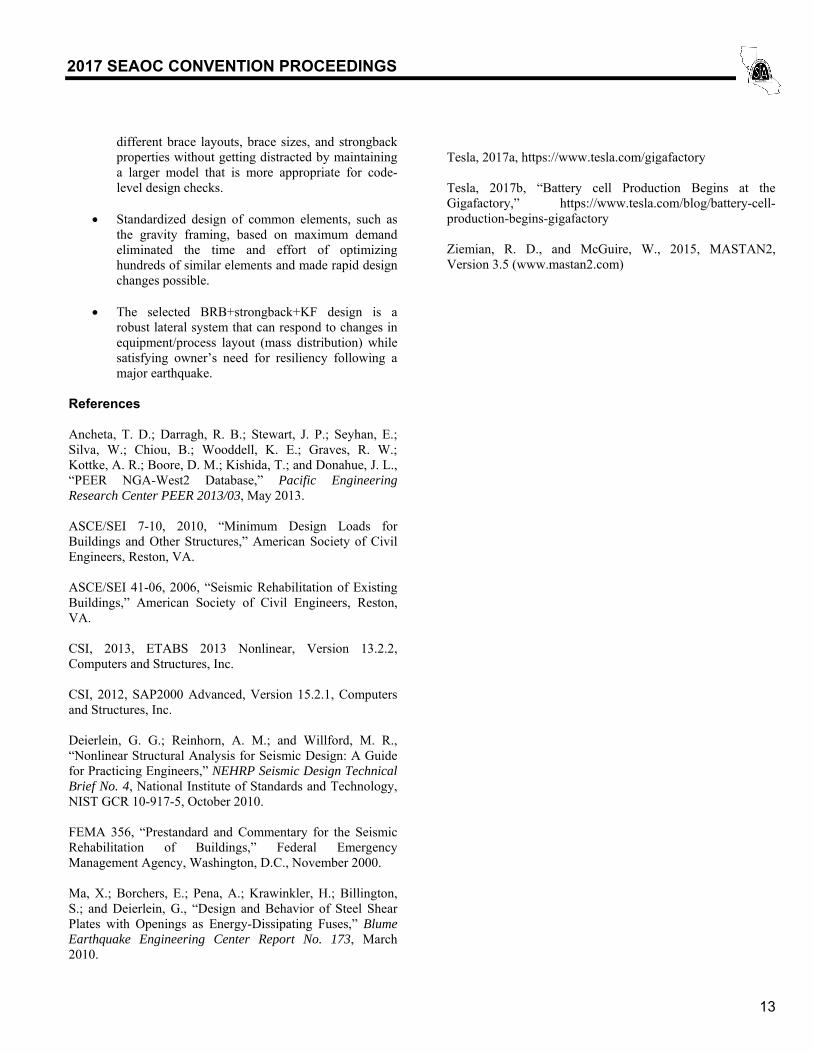
Figure 22. Mean scaled spectrum from the seven pairs of ground motions as compared to the target spectrum (ASCE 7- 10 DBE). Both combinations of horizontal ground motion components were investigated, i.e. the seven ground motion pairs resulted in 14 RHA cases. Several engineering demand parameters were studied during the RHA, e.g. intrastory drifts, brace deformations, fuse deformations, and floor accelerations. The maximum floor drifts from the RHA are provided in Figure 23.
Figure 23. Maximum floor drifts from the response history analyses. The mean peak drifts from the RHA are shown as the thick black dotted line. The mean peak roof drift is approximately 30% of the maximum permitted roof drift in ASCE 7-10. The benefit of the yielding Krawinkler fuses can be seen in the reduction of the roof drift demands when compared to the results from linear procedures. The mean peak roof drift for
the DBE event is approximately 5.3 inches, which is approximately 50% of the roof drift calculated per the ASCE 7-10 Equivalent Lateral Force procedure and approximately 66% of the expected roof drift calculated per FEMA 356/ASCE 41-06 modal procedures. The intrastory drift ratios from the RHA are shown in Figure 24. The strongbacks do a reasonably good job at enforcing a linear first-mode shape response, which would be a vertical line on the intrastory drift plot. The first and third stories are taller than the second story, and the mass in the second and third stories is larger than at the roof. For the 1992 Landers Morongo station and 1981 Corinth ground motions, the maximum intrastory drift ratios are driven towards the first story due to the characteristics of the ground motions. However, the profile of the mean intrastory drift ratios for the BRB+strongback+KF design is considerably better than the mean intrastory drift profile using conventional BRBs. RHA were carried out for a conventional BRB design as a comparison. The brace sizes were selected so that the fundamental period and maximum base shear of the conventional BRB design matched the BRB+strongback+KF design.
Figure 24. Intrastory drift ratios from the response history analyses. A plot of the lateral drift profiles for both designs at maximum roof drift for the 1979 Imperial Valley, Cerro Prieto motion is shown in Figure 25. The conventional BRB drift profile contains significantly larger intrastory drift demands at the first story than at the second and third story, while the BRB+strongback+KF design has a more linear drift profile. This more linear profile helps to ensure all BRBs yield at a similar demand, increasing the energy dissipation and avoiding a soft or weak individual story.
2017 SEAOC CONVENTION PROCEEDINGS
12
Figure 25. Comparison of the lateral drift profiles at maximum roof drift between a conventional BRB configuration (left) and the design using BRBs with strongbacks and KFs (right) for the 1979 Imperial Valley Cerro Prieto station motion. The mean peak intrastory drift ratios for the conventional BRB design and the BRB+strongback+KF design are shown in Figure 26. As shown in the profiles of intrastory drift ratios, the conventional BRB design has larger drift demands at the first and third stories where the story heights are greater and a much smaller drift demand at the second story. This drift profile is less desirable than the more linear profile provided by the BRB+strongback+KF design, as significantly different drift demands between stories may lead to soft/weak stories and underutilization of BRBs at a given story.
Figure 26. Mean peak intrastory drift ratios from the response history analyses for the conventional BRB design and the BRB+strongback+KF design. The maximum axial deformations for the BRBs in the BRB+strongback+KF design are shown in Figure 27 as a scatter plot including all ground motions. As expected, the BRBs consistently achieve their yield deformation in the DBE event and reach up to 70% of the deformation at maximum brace strength. These results are consistent with
the results of the static pushover analyses (Figures 18 and 19).
Figure 27. Brace maximum axial deformations from the response history analyses. The maximum shear deformations for the Krawinkler Fuses including all ground motions is shown in Figure 28. The maximum deformations exceed the yield deformation and are up to 40% of the deformation at maximum fuse capacity.
Figure 28. Krawinkler fuse maximum shear deformations from the response history analyses. Lessons Learned The structural design process for the Gigafactory was unique and challenging. GPLA and Exponent learned several lessons during the course of design:
Simple, nonlinear structural models of the lateral system allowed analysis of hundreds of design variants that provided great insight into the behavior of the structure. This process facilitated the study of
2017 SEAOC CONVENTION PROCEEDINGS
13
different brace layouts, brace sizes, and strongback properties without getting distracted by maintaining a larger model that is more appropriate for code-level design checks.
Standardized design of common elements, such as
the gravity framing, based on maximum demand eliminated the time and effort of optimizing hundreds of similar elements and made rapid design changes possible.
The selected BRB+strongback+KF design is a
robust lateral system that can respond to changes in equipment/process layout (mass distribution) while satisfying owner’s need for resiliency following a major earthquake.
References Ancheta, T. D.; Darragh, R. B.; Stewart, J. P.; Seyhan, E.; Silva, W.; Chiou, B.; Wooddell, K. E.; Graves, R. W.; Kottke, A. R.; Boore, D. M.; Kishida, T.; and Donahue, J. L., “PEER NGA-West2 Database,” Pacific Engineering Research Center PEER 2013/03, May 2013. ASCE/SEI 7-10, 2010, “Minimum Design Loads for Buildings and Other Structures,” American Society of Civil Engineers, Reston, VA. ASCE/SEI 41-06, 2006, “Seismic Rehabilitation of Existing Buildings,” American Society of Civil Engineers, Reston, VA. CSI, 2013, ETABS 2013 Nonlinear, Version 13.2.2, Computers and Structures, Inc. CSI, 2012, SAP2000 Advanced, Version 15.2.1, Computers and Structures, Inc. Deierlein, G. G.; Reinhorn, A. M.; and Willford, M. R., “Nonlinear Structural Analysis for Seismic Design: A Guide for Practicing Engineers,” NEHRP Seismic Design Technical Brief No. 4, National Institute of Standards and Technology, NIST GCR 10-917-5, October 2010. FEMA 356, “Prestandard and Commentary for the Seismic Rehabilitation of Buildings,” Federal Emergency Management Agency, Washington, D.C., November 2000. Ma, X.; Borchers, E.; Pena, A.; Krawinkler, H.; Billington, S.; and Deierlein, G., “Design and Behavior of Steel Shear Plates with Openings as Energy-Dissipating Fuses,” Blume Earthquake Engineering Center Report No. 173, March 2010.
Tesla, 2017a, https://www.tesla.com/gigafactory Tesla, 2017b, “Battery cell Production Begins at the Gigafactory,” https://www.tesla.com/blog/battery-cell-production-begins-gigafactory Ziemian, R. D., and McGuire, W., 2015, MASTAN2, Version 3.5 (www.mastan2.com)