PERFORMANCE BASED PLANNING AND PROGRAMMING FOR PAVEMENT MANAGEMENT€¦ · ·...
63
PERFORMANCE-BASED PLANNING AND PROGRAMMING FOR PAVEMENT MANAGEMENT June 2016
Transcript of PERFORMANCE BASED PLANNING AND PROGRAMMING FOR PAVEMENT MANAGEMENT€¦ · ·...
PERFORMANCE-BASED PLANNING AND
PROGRAMMING FOR PAVEMENT
MANAGEMENT
June 2016
MICHIGAN DEPARTMENT OF TRANSPORTATION AND THE CENTER FOR AUTOMOTIVE RESEARCH ii

PERFORMANCE-BASED PLANNING AND PROGRAMMING FOR PAVEMENT MANAGEMENT
MICHIGAN DEPARTMENT OF TRANSPORTATION AND THE CENTER FOR AUTOMOTIVE RESEARCH iii
Sponsoring Organization:
Michigan Department of Transportation (MDOT)
425 Ottawa Street
P.O. Box 30050
Lansing, MI 48909
Performing Organization:
Center for Automotive Research (CAR)
3005 Boardwalk, Suite 200
Ann Arbor, MI 48108
Performance-based Planning and Programming for Pavement Management
June 2016
MDOT REQ. NO. 1259, Connected and Automated Vehicle Industry Coordination
Task A.7. ITS/CAV Data Support of Asset Management
Author(s):
Eric Paul Dennis, P.E., CAR
Adela Spulber, CAR
Managing Editor(s):
Richard Wallace, M.S., Director, Transportation Systems Analysis, CAR
Niles Annelin, Transportation Planner, MDOT
Additional Contributor(s):
Qiang Hong, CAR

MICHIGAN DEPARTMENT OF TRANSPORTATION AND THE CENTER FOR AUTOMOTIVE RESEARCH iv
ACKNOWLEDGMENTS
This document is a product of the Center for Automotive Research under a
State Planning and Research Grant administered by the Michigan Department
of Transportation.

PERFORMANCE-BASED PLANNING AND PROGRAMMING FOR PAVEMENT MANAGEMENT
MICHIGAN DEPARTMENT OF TRANSPORTATION AND THE CENTER FOR AUTOMOTIVE RESEARCH v
EXECUTIVE SUMMARY
Transportation agencies are frequently challenged by budget constraints to
maintain roadway pavements and other infrastructure in good condition. As a
result, it is critical that transportation infrastructure investments are cost-
effective and results-oriented. Performance-based Planning and
Programming (PBPP) is the application of performance management
principles within the planning and programming processes of transportation
agencies to achieve desired performance outcomes for a multimodal
transportation system. Transportation Asset Management (TAM) is strategic
and systematic process of operating, maintaining, upgrading, and expanding
physical assets effectively through their life cycle, and is ideally adopted
within a broad PBPP framework. For many, if not all, transportation agencies,
highway pavements are the most valuable asset that they manage. Thus,
performance (life-cycle) management of pavements is a critical component of
a TAM system.
Within pavement performance management, four primary metrics of
pavement condition are used: structural-adequacy/deflection, surface distress,
serviceability (smoothness), and surface friction. The most commonly
collected of these primary metrics are those that are required for federal
reporting. Under the National Highway Performance Program (NHPP)
introduced in the 2012 federal transportation funding bill (MAP-21) and
adopted by the 2015 FAST Act, states and are required to report surface
distress metrics of cracking, rutting, and faulting, as well as serviceability (in
the form of the International Roughness Index [IRI]). Dozens of other primary
and secondary metrics also can provide additional value.
The Michigan Department of Transportation (MDOT) has historically
operated a pavement management system based on a department-created
‘distress index’ (DI), which is then used to estimate the pavement’s remaining
service life (RSL). MDOT also uses a pavement rating scale (PASER) via
‘windshield survey’ to assess road conditions for the entire statewide system.
Under emerging federal regulations, MDOT will be required to adopted
specific PBPP practices including the development and use of a risk-based
Transportation Asset Management Plan (TAMP) for the statewide National
Highway System (NHS). The TAMP will be required to address metrics and
targets established by the NHPP, and thus will require MDOT to amend
established TAM practices.

MICHIGAN DEPARTMENT OF TRANSPORTATION AND THE CENTER FOR AUTOMOTIVE RESEARCH vi
Federal NHPP requirements set minimum standards for pavement
performance management, but states are encouraged to incorporate additional
metrics on pavement and other infrastructure assets in the state TAMP.
Advancing technologies may allow for the creation of novel metrics and
collection techniques that could expand the scope of Michigan’s TAMP and
facilitate more cost-efficient outcomes in all aspects of TAM. Technology
advances that could be integrated into a TAM program include:
Smartphone apps and crowdsourcing
Automated vehicle systems data
In situ structural health monitoring
Automated distress classification
Regardless of what data are collected, a transportation asset management
program must be appropriately designed to be capable of translating raw data
into useful, actionable information. Currently, the state-of-the-practice in
pavement design and performance management is a mechanistic-empirical
(M-E) approach favored by the American Association of State Highway and
Transportation Officials (AASHTO) and Federal Highway Administration
(FHWA). AASHTO published the Mechanistic-Empirical Pavement Design
Guide (MEPDG) in 2008 with associated design software. MDOT adopted the
MEPDG for pavement design in 2015. Fully utilizing improved pavement
design approaches and novel data types will require expanding the use of
coherent PBPP frameworks across the organization.
Further information regarding performance-based transportation asset
management and pavement performance management is available from the
FHWA Asset Management Program Office at http://www.fhwa.dot.gov/asset/,
and the AASHTO TAM Portal at http://www.tam-portal.com/.

PERFORMANCE-BASED PLANNING AND PROGRAMMING FOR PAVEMENT MANAGEMENT
MICHIGAN DEPARTMENT OF TRANSPORTATION AND THE CENTER FOR AUTOMOTIVE RESEARCH vii
TABLE OF CONTENTS
1 Introduction ........................................................................................................................... 1
1.1 Performance-based Planning and Programming ................................................................. 2
1.2 Transportation Asset Management ..................................................................................... 4
1.3 Pavement Performance Management ................................................................................. 5
1.4 Pavement Condition Measurement (Performance Indicators) ............................................ 6
2 Innovative Approaches to Pavement Condition Data Collection ................................... 13
2.1 Smartphone Accelerometry Indices .................................................................................. 13
2.2 Crowdsourcing Pavement Condition Data........................................................................ 14
2.3 Automated Vehicle Systems Data .................................................................................... 18
2.4 In Situ Structural Health Monitoring ................................................................................ 20
2.5 Automated Distress Classification .................................................................................... 20
3 Mechanistic-Empirical Pavement Performance Management ....................................... 23
3.1 Pavement Engineering and Design ................................................................................... 23
3.2 Performance Indicators (Pavement Condition Measurement) .......................................... 25
3.3 Calibration......................................................................................................................... 27
3.4 Traffic Modelling .............................................................................................................. 28
3.5 Pavement Management Systems....................................................................................... 30
4 Summary and Discussion .................................................................................................... 35
4.1 Adopting Performance-based Planning and Programming across the Enterprise ............ 35
4.2 Coordination and Guidance of Statewide Transportation Asset Management ................. 41
4.3 Legislative Options for Management of Expanded National Highway System ............... 43
4.4 Crowdsourcing Pavement Performance Measurement ..................................................... 43
4.5 Closing Remarks ............................................................................................................... 45
References .................................................................................................................................... 49
Appendix A: List of Abbreviations ........................................................................................... 53

MICHIGAN DEPARTMENT OF TRANSPORTATION AND THE CENTER FOR AUTOMOTIVE RESEARCH viii

PERFORMANCE-BASED PLANNING AND PROGRAMMING FOR PAVEMENT MANAGEMENT JUNE 2016
MICHIGAN DEPARTMENT OF TRANSPORTATION AND THE CENTER FOR AUTOMOTIVE RESEARCH 1
1 INTRODUCTION
Pavements and bridges are typically the most critical infrastructure assets
managed by transportation agencies. Measuring and forecasting the condition
of pavements is a central process in any transportation agency’s overall asset
management program. Many state departments of transportation and
Metropolitan Planning Agencies (MPOs) have adopted transportation asset
management (TAM) processes to promote effective use of department
resources. However, many TAM programs are structured such that it is
difficult to determine how effective investment strategies are at achieving
department performance goals.
With the passage of the MAP-211 federal transportation funding bill—and
subsequent FAST Act—the Federal Highway Administration (FHWA) will be
responsible to ensure that states and MPOs implement TAM processes that are
adequately performance-based. Pavement performance management is a
significant aspect of TAM, but TAM typically includes more assets than
pavements. This chapter provides background information on recent federal
requirements and required concepts.
FIGURE 1: HIERARCHY OF CONCEPTS DESCRIBED IN THIS CHAPTER
1 Full title of bill is Moving Ahead for Progress in the 21st Century Act.
Performance-based Planning and Programming (PBPP)
Transportation Asset Management (TAM)
Pavement Performance Management
Pavement Condition Measurement

INTRODUCTION
MICHIGAN DEPARTMENT OF TRANSPORTATION AND THE CENTER FOR AUTOMOTIVE RESEARCH 2
1.1 PERFORMANCE-BASED PLANNING AND PROGRAMMING
Performance-based planning and programming (PBPP) refers to the
application of performance management within the planning and
programming processes of transportation agencies to achieve desired
performance outcomes for a multimodal transportation system.2 This includes
a range of activities and products undertaken by a transportation agency
together with other agencies, stakeholders, and the public.
FIGURE 2: FRAMEWORK FOR PERFORMANCE-BASED PLANNING AND PROGRAMMING3
PBPP includes the development of a variety of planning documents including
long range transportation plans (LRTPs), Strategic Highway Safety Plans,
Asset Management Plans, the Congestion Management Process, Transit
Agency Asset Management Plans, and Safety Plans. Within the PBPP
framework, these plans are explicitly linked to programming documents
including State and MPO Transportation Improvement Programs (STIPs and
2 FHWA Performance-Based Planning and Programming Guidebook (Grant et al. 2013). 3 ibid.
PERFORMANCE-BASED PLANNING AND PROGRAMMING FOR PAVEMENT MANAGEMENT JUNE 2016
MICHIGAN DEPARTMENT OF TRANSPORTATION AND THE CENTER FOR AUTOMOTIVE RESEARCH 3
TIPs). PBPP attempts to ensure that transportation investment decisions are
made—both in long-term planning and short-term programming of projects—
based on their ability to meet established goals, objectives, and targets.4
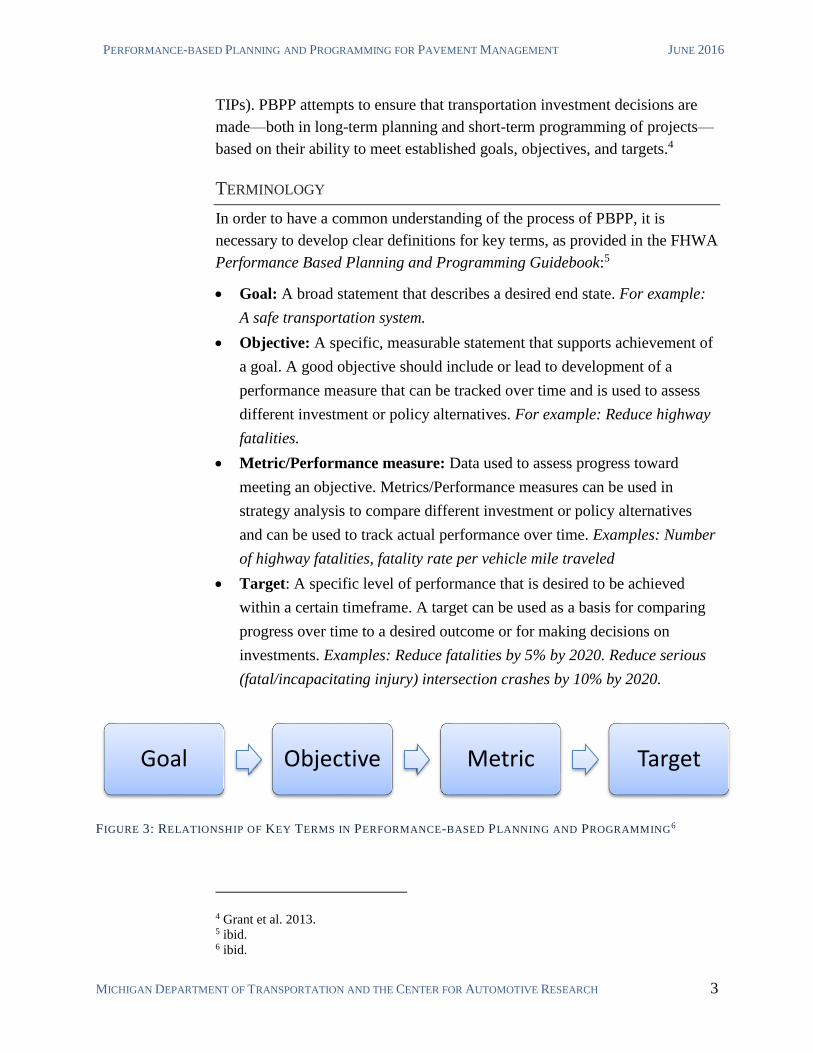
TERMINOLOGY
In order to have a common understanding of the process of PBPP, it is
necessary to develop clear definitions for key terms, as provided in the FHWA
Performance Based Planning and Programming Guidebook:5
Goal: A broad statement that describes a desired end state. For example:
A safe transportation system.
Objective: A specific, measurable statement that supports achievement of
a goal. A good objective should include or lead to development of a
performance measure that can be tracked over time and is used to assess
different investment or policy alternatives. For example: Reduce highway
fatalities.
Metric/Performance measure: Data used to assess progress toward
meeting an objective. Metrics/Performance measures can be used in
strategy analysis to compare different investment or policy alternatives
and can be used to track actual performance over time. Examples: Number
of highway fatalities, fatality rate per vehicle mile traveled
Target: A specific level of performance that is desired to be achieved
within a certain timeframe. A target can be used as a basis for comparing
progress over time to a desired outcome or for making decisions on
investments. Examples: Reduce fatalities by 5% by 2020. Reduce serious
(fatal/incapacitating injury) intersection crashes by 10% by 2020.
FIGURE 3: RELATIONSHIP OF KEY TERMS IN PERFORMANCE-BASED PLANNING AND PROGRAMMING6
4 Grant et al. 2013. 5 ibid. 6 ibid.
Goal Objective Metric Target
INTRODUCTION
MICHIGAN DEPARTMENT OF TRANSPORTATION AND THE CENTER FOR AUTOMOTIVE RESEARCH 4
1.2 TRANSPORTATION ASSET MANAGEMENT
Asset management is a strategic and systematic process of operating,
maintaining, and improving physical assets, with a focus on both engineering
and economic analysis based upon quality information, to identify a structured
sequence of maintenance, preservation, repair, rehabilitation, and replacement
actions that will achieve and sustain a desired state of good repair over the
lifecycle of the assets at minimum practicable cost.7
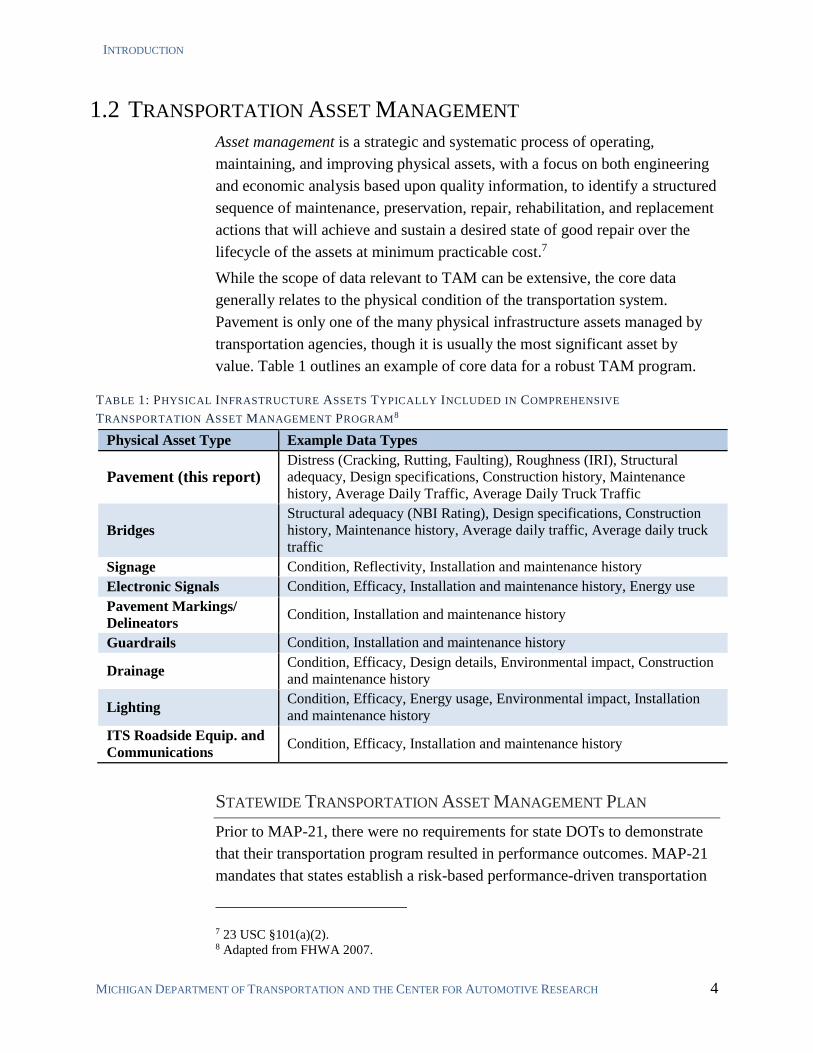
While the scope of data relevant to TAM can be extensive, the core data
generally relates to the physical condition of the transportation system.
Pavement is only one of the many physical infrastructure assets managed by
transportation agencies, though it is usually the most significant asset by
value. Table 1 outlines an example of core data for a robust TAM program.
TABLE 1: PHYSICAL INFRASTRUCTURE ASSETS TYPICALLY INCLUDED IN COMPREHENSIVE
TRANSPORTATION ASSET MANAGEMENT PROGRAM8
STATEWIDE TRANSPORTATION ASSET MANAGEMENT PLAN
Prior to MAP-21, there were no requirements for state DOTs to demonstrate
that their transportation program resulted in performance outcomes. MAP-21
mandates that states establish a risk-based performance-driven transportation
7 23 USC §101(a)(2). 8 Adapted from FHWA 2007.
Physical Asset Type Example Data Types
Pavement (this report) Distress (Cracking, Rutting, Faulting), Roughness (IRI), Structural
adequacy, Design specifications, Construction history, Maintenance
history, Average Daily Traffic, Average Daily Truck Traffic
Bridges Structural adequacy (NBI Rating), Design specifications, Construction
history, Maintenance history, Average daily traffic, Average daily truck
traffic
Signage Condition, Reflectivity, Installation and maintenance history
Electronic Signals Condition, Efficacy, Installation and maintenance history, Energy use
Pavement Markings/
Delineators Condition, Installation and maintenance history
Guardrails Condition, Installation and maintenance history
Drainage Condition, Efficacy, Design details, Environmental impact, Construction
and maintenance history
Lighting Condition, Efficacy, Energy usage, Environmental impact, Installation
and maintenance history
ITS Roadside Equip. and
Communications Condition, Efficacy, Installation and maintenance history

PERFORMANCE-BASED PLANNING AND PROGRAMMING FOR PAVEMENT MANAGEMENT JUNE 2016
MICHIGAN DEPARTMENT OF TRANSPORTATION AND THE CENTER FOR AUTOMOTIVE RESEARCH 5
asset management plan (TAMP). This plan shall include strategies leading to a
program of projects that supports specific goals and associated metrics.
The state asset management plan will be required within 18 months of
promulgation of the final rulemaking for the revised federal-aid highway
program. Per statue, the plan will include:9
1. A summary listing of the pavement and bridge assets on the National
Highway System in the State, including a description of the condition of
those assets
2. Asset management objectives and measures
3. Performance gap identification
4. Lifecycle cost and risk management analysis
5. A financial plan
6. Investment strategies
As of March 2016, final rules for transportation asset management planning
and pavement performance management have not been officially adopted.
However, rules have been proposed and are now being finalized. In addition
to pavement and bridge performance measures, the TAMP will include
metrics on safety, environmental impact, congestion, and performance. The
TAMP will be required only to include pavement and bridge assets on NHS
routes, but states are encouraged to include additional routes and
transportation assets.10
Further information regarding performance-based transportation asset
management and pavement performance management is available from the
FHWA Asset Management Program Office at http://www.fhwa.dot.gov/asset/,
and the AASHTO TAM Portal at http://www.tam-portal.com/.
1.3 PAVEMENT PERFORMANCE MANAGEMENT11
A pavement performance management system is a central component in a
TAM program. Many transportation agencies have adopted software-based
pavement management systems to partially automate tracking and decision-
9 23 U.S.C.USC § 119(e) 10 23 CFR Part 490 [ Docket No. FHWA-2013-0053] RIN 2125-AF53 11 Pavement performance management may also be referred to as pavement life-cycle
management, pavement preservation, or simply pavement management. These terms are
considered synonymous for the purposes of this report.

INTRODUCTION
MICHIGAN DEPARTMENT OF TRANSPORTATION AND THE CENTER FOR AUTOMOTIVE RESEARCH 6
support functions of pavement performance management.12 The goal is a
decision-support system that is perpetually gathering data and applying it to
achieve optimized system conditions in terms of selected pavement
performance metrics.13
NATIONAL HIGHWAY PERFORMANCE PROGRAM
As required by stature in MAP-21, FHWA has created the National Highway
Performance Program (NHPP) that will replace reporting requirements for the
Highway Performance Monitoring System (HPMS).14 NHPP covers the
National Highway System (NHS)—the network of highways determined to be
of strategic importance to the nation’s economy, mobility, and defense.
MDOT is responsible for 5,227 miles of NHS, over half of MDOT’s trunkline
mileage. Additionally, MAP-21 expanded NHS to include all roads classified
as principle arterials—many of which are outside of MDOT jurisdiction.
1,201 miles of NHS mainline (about 19% of Michigan’s total NHS mileage)
must now be managed by local transportation authorities.15 When the NHPP is
finalized, both state and MPO asset management practices will have to be
updated to accommodate new TAM planning and reporting requirements.
1.4 PAVEMENT CONDITION MEASUREMENT (PERFORMANCE
INDICATORS)
This report concentrates specifically on the pavement management component
of TAM (which also has some implications for bridge management).
PRIMARY PAVEMENT DATA CATEGORIES
Pavement condition and performance generally can be described by four
primary data categories:16
Structural Adequacy/Deflection
Surface Distress
Serviceability/Ride-quality
12 TRB 2009. 13 FHWA 2007. NHPP will require metrics only on pavement and bridges in the required
Transportation Asset Management Plan, but states are encouraged to include additional
assets. 14 23 U.S.C 119; 23 U.S.C 104(f); 49 USC 5334(i). 15 http://mdotcf.state.mi.us/public/maps_nfc/nhsmaps.cfm, accessed August 2015. 16 MDOT and CAR 2013.

PERFORMANCE-BASED PLANNING AND PROGRAMMING FOR PAVEMENT MANAGEMENT JUNE 2016
MICHIGAN DEPARTMENT OF TRANSPORTATION AND THE CENTER FOR AUTOMOTIVE RESEARCH 7
Surface Friction
These categories are further discussed below.
Structural Adequacy/Deflection
Structural adequacy describes the load-bearing capacity of a pavement.
Measuring structural adequacy involves evaluation of deflection data within a
context of pavement properties and performance demand. Deflection data
collection requires specialized measurement equipment called a
deflectometer.17 Structural adequacy is valuable in forecasting the condition of
pavement under predicted loading scenarios.
Surface Distress
Surface distress was traditionally assessed via visual sampling of the
pavement surface. Historically, these inspections were performed by engineers
walking a representative portion of the pavement and recording the type,
severity, and extent of defects. Manual collection and classification of distress
data is becoming increasingly rare with the advent of automated image
recognition software.18 More than three-dozen distinct types of pavement
distresses have been defined;19 however, only a few metrics are widely
measured, including those required for reporting to the National Highway
Performance Program (NHPP). These are: percentage cracking,20 rutting,21
and faulting.22
Serviceability/Ride-quality23
Serviceability is essentially an evaluation of the pavement interaction with a
typical highway vehicle. Similarly, ‘ride-quality’ (smoothness) reflects the
17 MDOT and CAR 2013. 18 http://nwpma-online.org/presentations/2014/changemethodpavedatacollect-dynatest.pdf
accessed March 2016. 19 ASTM D6433. 20 Federal NHPP reporting requires values for cracking length, and cracking percent. A robust
TAM database would ideally provide detail on the type of cracking observed. For example,
in flexible (asphalt) pavements, distresses such as fatigue cracking, longitudinal cracking,
and transverse cracking likely indicate different modes of pavement failure and underlying
causes. 21 Rutting is a measurement of depression in the surface of an asphalt pavement, usually
caused by plastic deformation of the pavement or base layer. 22 Faulting is a measurement of vertical movement in a slab of Portland Cement Concrete
(PCC) adjacent to a joint or crack. 23 Also known as ‘smoothness,’ or ‘roughness,’ this metric essentially refers to variation of
pavement from ideal planar surface.

INTRODUCTION
MICHIGAN DEPARTMENT OF TRANSPORTATION AND THE CENTER FOR AUTOMOTIVE RESEARCH 8
experience of human users within such vehicles. Serviceability/ride-quality
measures are most often expressed in terms of the International Roughness
Index (IRI).24 IRI will be a required component of the NHPP and state/MPO
TAMPs.
Surface Friction
Surface friction relates to the skid-resistance of the pavement. Poor surface
friction of a pavement is a safety issue because vehicles might have longer
stopping distances or increased likelihood of control loss. Values for friction
are complicated by pavement macro-texture (texture that allows drainage in
order to prevent hydroplaning), micro-texture (the actual texture of the stone
aggregate particles and binder), changes in micro-texture due to aggregate
polishing, the tire type (including its rubber composition), and tread pattern.25
SUBJECTIVE PAVEMENT SURFACE RATINGS
A pavement surface rating (PSR)26 is an observation-based system used to rate
pavements, usually by ‘windshield survey.’27,28 Various transportation
departments have historically developed PSRs as a low-cost method of
assessing pavement condition. As PSR scales are inherently subjective,
pavement surface ratings are not adaptable to an M-E-based asset
management program.29 Subjective ratings were allowed for some reporting
requirements under the HPMS, but will not be allowed under the NHPP.30
SECONDARY PAVEMENT DATA CATEGORIES
The primary pavement data types, discussed above, are direct measurements
of pavement condition or performance. Often, such primary metrics are
combined and/or manipulated to create a new secondary metric. Many
transportation agencies have developed formulas to obtain secondary metrics
24 MDOT and CAR 2013. 25 MDOT and CAR 2013. 26 Defined in FHWA 2015. 27 The HPMS Field Manual also refers to this as “Present Serviceability Rating..” 28 Two PSRs are currently used in Michigan, “sufficiency,” and PASER. Sufficiency is a 1-5
scale rating to report condition of trunklines. (Measurement of Sufficiency is scheduled to
cease in 2016.) The PSR, ‘PASER’ is currently used in Michigan. PASER is a 1-10
pavement rating scale that has been standardized by TAMC to assess pavement condition
statewide. 29 MDOT and CAR 2013. 30 PSRs were permitted to substitute for IRI for some NHS reporting requirements, but will no
longer be accepted under MAP-21 revisions (FHWA 2015, pp. 362, 366, 387).

PERFORMANCE-BASED PLANNING AND PROGRAMMING FOR PAVEMENT MANAGEMENT JUNE 2016
MICHIGAN DEPARTMENT OF TRANSPORTATION AND THE CENTER FOR AUTOMOTIVE RESEARCH 9
such as remaining service life (RSL), or various pavement condition indices
(PCIs).
Composite Pavement Condition Indices
Many transportation agencies combine primary metrics—such as surface
distress and IRI—to obtain a new, composite index reflecting the overall
pavement condition. One established pavement condition index (PCI) was
established by the US Army Corps of Engineers and has been standardized by
ASTM International.31,32 Federal reporting (NHPP) requires individual
distress metrics to be reported (cracks, rutting, faulting). However, these same
metrics are often used to create a composite, secondary metric for internal
agency use.33
Remaining Service Life
Primary pavement condition and performance metrics provide only a non-
temporal (snapshot) assessment of pavement condition. Effective TAM
programs must be capable of accurately predicting pavement performance and
condition. Such a process requires estimation of a pavement's remaining
service life (RSL).
The RSL represents “the period of time under specified site conditions during
which a pavement's structural or functional condition is expected to remain
within stated limits, provided that appropriate routine and preventative
maintenance are carried out.”34
RSL is a critical concept within the NHPP and TAM. The prevailing state-of-
art for calculating pavement RSL is based on mechanistic-empirical methods
as developed by NCHRP Project 1-37A.35,36 This will be further discussed in
Chapter 3.
31 ASTM D6433 and ASTM E2840. 32 MDOT uses an internally -developed composite PCI called the “MDOT Distress Index
(DI).” The MDOT DI is subsequently used to calculate RSL. 33 MDOT’s distress index (DI) is a composite metric calculated from individual distress
metrics. 34 Titus-Glover et al. 2010. 35 “The Mechanistic-Empirical Design Guide for New and Rehabilitated Pavement
Structures.” NCHRP 1-37A. 2004. 36 MDOT uses a logistical simple-regression-based method to calculate RSL. (Michigan
Office of the Auditor General 2012.)

INTRODUCTION
MICHIGAN DEPARTMENT OF TRANSPORTATION AND THE CENTER FOR AUTOMOTIVE RESEARCH 10
NATIONAL HIGHWAY PERFORMANCE PROGRAM
Under proposed NHPP requirements, states will be required to report IRI,
cracking percent, rutting, and faulting (as with previous HPMS requirements).
However, states were previously able to use statistical sampling methods to
provide this data on the NHS network. When the new regulations become
effective, states will be required to provide full-extent data (no sampling) on
an annual basis for the Interstate system, and biennially for non-Interstate
NHS routes.
TABLE 2: NATIONAL HIGHWAY PERFORMANCE PROGRAM REPORTING REQUIREMENTS
NHPP Reporting Interstate NHS Non-Interstate NHS
Scope
Full extent of mainline highway37
Rightmost travel lane or one consistent lane within
segment if rightmost lane is not available
Both directions of travel One direction of travel
Max Segment Length 0.1 mile
Frequency Annual Biennial
Metrics
International Roughness Index (IRI) Cracking (percent) Rutting (ACC pavements) Faulting (PCC pavements)
To ensure that pavement condition metrics are collected consistently, FHWA
is adopting AASHTO data collection standards. The specific proposed
protocols are shown in Table 3, below. The primary metrics described in
Table 3 will then be converted to a good/fair/poor rating by FHWA. States
and MPOs will be required to set ratings goals in their transportation asset
management plans,38 and may incur more stringent federal oversight and
funding restrictions if targets are not met.
37 Sampling per current HPMS methods will be allowed until 2020. 38 This is the TAMP described supra Section 1.2.

PERFORMANCE-BASED PLANNING AND PROGRAMMING FOR PAVEMENT MANAGEMENT JUNE 2016
MICHIGAN DEPARTMENT OF TRANSPORTATION AND THE CENTER FOR AUTOMOTIVE RESEARCH 11
39 Standard for IRI data collection device 40 Standard for IRI data collection method 41 Not applicable to continuously reinforced concrete pavements (CRCP). 42 Manual cracking data collection 43 Automated cracking data collection 44 Transverse cracking is not included in calculation of CRCP cracking_percent formula. 45 Applicable only to asphalt pavement (HMA) 46 Applicable only to jointed Portland cement concrete pavement (PCC)
TABLE 3: NATIONAL HIGHWAY PERFORMANCE PROGRAM REPORTING STANDARDS
Data Metric Proposed Standard
International
Roughness Index
(IRI)
AASHTO M328-1439 and AASHTO R57-1440
Cracking_Percent41 AASHTO R55-10 (2013)42 or AASHTO PP67-14 and PP68-1443
Cracking_Percent
(CRCP)
Percent of pavement surface with longitudinal cracking
and/or punchouts, spalling, or other visible defects (as
described in HPMS Field Manual).44
Rutting45 AASHTO R48-10 (2003) or AASHTO PP69-14 and PP70-14
Faulting46 AASHTO R36-13

INTRODUCTION
MICHIGAN DEPARTMENT OF TRANSPORTATION AND THE CENTER FOR AUTOMOTIVE RESEARCH 12
PERFORMANCE-BASED PLANNING AND PROGRAMMING FOR PAVEMENT MANAGEMENT JUNE 2016
MICHIGAN DEPARTMENT OF TRANSPORTATION AND THE CENTER FOR AUTOMOTIVE RESEARCH 13
2 INNOVATIVE APPROACHES TO PAVEMENT
CONDITION DATA COLLECTION
Transportation asset management is an increasingly data-based process as new
opportunities for data collection arise, known data-collection methods
decrease in cost, and researchers find new ways to use data to characterize
pavement performance. This chapter introduces new potential sources of data
that could be valuable in pavement performance management programs.47
2.1 SMARTPHONE ACCELEROMETRY INDICES
There have been several research projects aimed at using the accelerometers
and GPS receivers in smartphones to derive road roughness measurements.
Some projects have aimed at attempting to capture useful data in a limited
number of traversals (as opposed to crowdsourcing), as could be performed by
agency employees.
MDOT/UMTRI DATA PROBE
MDOT has investigated the possibility of using MDOT maintenance vehicles
to obtain pavement condition data. MDOT’s research attempted to correlate
smartphone accelerometry data with existing pavement metrics (e.g., IRI,
PASER). While researchers found some correlation between smartphone
accelerometry and IRI, the resulting data was not precise enough to be of use
in TAM or pavement condition reporting.48
One barrier to MDOT’s approach is that the data capture was limited to
MDOT fleet vehicles, which could be expected to make only a limited number
of passes over most sections of road within a given time period. In fact,
MDOT had hoped to capture useable data after only a single pass. Such an
approach requires carefully controlling various factors in the data-capture
process that are not feasible in typical conditions.49 A more promising
47 The pavement data collection methods discussed in this chapter could be used to augment
TAM, but would not likely be capable of replacing data required for federal reporting which
must be collected per AASHTO/FHWA standards. 48 Belzowski 2014; Belzowski 2015. Additionally, such methods would not currently be
acceptable for federal reporting even if perfectly correlated to ‘true’ IRI because NHPP
requirements dictate standardized data collection methods as described in Table 3. 49 MDOT and CAR 2013, pp. 20-21.
INNOVATIVE APPROACHES TO PAVEMENT CONDITION DATA COLLECTION
MICHIGAN DEPARTMENT OF TRANSPORTATION AND THE CENTER FOR AUTOMOTIVE RESEARCH 14
approach to using smartphone data to assess pavement condition is to
aggregate multiple data points from numerous passes, as discussed below.
NDSU ROAD IMPACT FACTOR
The Upper Great Plains Transportation Institute at North Dakota State
University (NDSU) has developed a method of using smartphone
accelerometry to derive an index of pavement roughness called the road
impact factor (RIF). The RIF index has shown to correlate to IRI, but can be
derived from any vehicle at any speed.50 Precision similar to that achieved by
a standardized IRI profilometer can be achieved in a limited number of passes
(as few as seven) when a single vehicle is used at a relatively consistent speed
and the smartphone is precisely mounted within the vehicle.51 An extension of
this method, called time-wavelength-intensity-transform (TWIT) can obtain
pavement roughness data with less control over variables, but requires
substantially more passes.52 The TWIT method could be employed in a
passive crowdsourcing method, as discussed below.
2.2 CROWDSOURCING PAVEMENT CONDITION DATA
ACTIVE CROWDSOURCED REPORTING
Many transportation agencies (including MDOT)53 already crowdsource data
on potholes and road issues by allowing system users to report issues via
phone or web applications.54 But such methods cannot easily provide a timely
and accurate system-wide perspective. Traditional web reporting tools require
the user to manually input relatively detailed location information; many users
likely perceive this process as a barrier. Additionally, many users are not
familiar with MDOTs trunkline system and the distribution of jurisdiction for
public roads between state, county, and local entities.
50 Bridgelall and Daleiden 2015. 51 Such a method would not be acceptable for federal reporting even if perfectly correlated to
‘true’ IRI because NHPP requirements dictate standardized data collection methods as
described in. Table 3. 52 Bridgelall 2014. 53 MDOT maintains a web service to allow users to report potholes on state trunklines:
http://www.michigan.gov/mdot/0,1607,7-151-9615_30883_30885-69798--,00.html,
accessed August 2015. 54 Dennis, Wallace, and Reed 2015.

PERFORMANCE-BASED PLANNING AND PROGRAMMING FOR PAVEMENT MANAGEMENT JUNE 2016
MICHIGAN DEPARTMENT OF TRANSPORTATION AND THE CENTER FOR AUTOMOTIVE RESEARCH 15
Crowdsourcing of pavement condition is likely more effective with
applications that are able to accept reports across jurisdictions and agencies.
Many services offer convenient features such as complaint classification and
support in routing citizen reports to appropriate agencies. One such app,
SeeClickFix, has become a popular service and has been adopted by many
public agencies as an official citizen engagement platform.55 In the UK, the
national government has deployed a pothole reporting app with nationwide
scope. UK’s app was specifically designed to allow bicyclists to report road
conditions that pose a safety hazard to bikes, but the app is available for all
road users.56
These citizen-reporting crowdsourcing methods are important public-relations
tools for transportation agencies. In the absence of sanctioned citizen
reporting methods, citizens might opt to self-deploy reporting platforms. Such
grassroots platforms could be beneficial, but agencies risk losing control of
the process. Such citizen-deployed platforms are often created to publically
shame agencies into action.57,58
Most existing pothole-reporting mechanisms are focused on reactive
operations and maintenance activities. The data is not often stored and
incorporated into asset management programs. One challenge in using such
methods for TAM is generating enough public participation to obtain useful
system-wide data.59 Another challenge is assuring that the data does not lead
to uneven distribution of resources and entrenchment of existing
socioeconomic inequalities due to demographic biases in users of such an
app.60 Despite the challenges, if structured and managed properly, the data
generated by these citizen reporting systems could provide value in
determining recurring problems, patterns, and impact on public satisfaction.
55 http://gov.seeclickfix.com/ accessed August 2015. 56 http://www.fillthathole.org.uk/ accessed August 2015. 57 Ermoshina 2014. 58 One example of such a shame-based reporting platform is a program in Panama City,
implemented by a local television station, that installed sensors in city potholes that
recorded each time the pothole was struck by a vehicle and tweeted about the event to local
officials.
(http://www.slate.com/blogs/future_tense/2015/06/12/potholes_in_panama_city_tweet_at_l
ocal_government_until_they_get_fixed.html accessed August 2015.) 59 One transportation agency in France has contracted with the national post service (which
travels nearly all roads within the network) to collect pavement condition data on a network
level. (http://www.sudouest.fr/2014/03/06/le-gers-cartographie-l-etat-de-son-reseau-routier-
grace-a-la-poste-1482678-2703.php, accessed August 2015.) 60 Kate Crawford. “Think Again: Big Data.” Foreign Policy. May 10, 2013.

INNOVATIVE APPROACHES TO PAVEMENT CONDITION DATA COLLECTION
MICHIGAN DEPARTMENT OF TRANSPORTATION AND THE CENTER FOR AUTOMOTIVE RESEARCH 16
Obtaining such data is more likely with automated (i.e., passive)
crowdsourcing applications, as discussed below.
PASSIVE CROWDSOURCED REPORTING
Many research organizations and transportation agencies are pursuing low-
cost pavement condition measurement using connected vehicles or devices.
Consumer-grade sensors have been shown capable of detecting potholes,
rough pavement, and low friction areas.61 Many research projects have
demonstrated the ability of smartphone accelerometry to measure pavement
roughness.62
Roadroid
One instance of a pavement condition monitoring mobile application that has
been deployed is called Roadroid. Developed in Sweden, Roadroid uses a
combination of vehicle calibration and repeated measurements to obtain
usable data. Roadroid data can be collected with a standard Android smart
phone and typical passenger vehicle. Frequent data collection allows agencies
to monitor roughness changes over time. This can give early warnings of
changes and damage, enable new ways to work in the operational road
maintenance management, and can serve as a guide for more accurate surveys
for strategic asset management and pavement planning. Collected
measurement data are wirelessly transferred via a web service to an internet
mapping server with spatial filtering functions.63
FIGURE 4: ROADROID WEB GIS TOOL SHOWING CROWDSOURCED PAVEMENT CONDITIONS (SOURCE:
FORSLӦF AND JONES 2015)
61 MDOT and CAR 2013. 62 E.g., Bridgelall 2013; Bridgelall 2014. 63 http://www.roadroid.com/

PERFORMANCE-BASED PLANNING AND PROGRAMMING FOR PAVEMENT MANAGEMENT JUNE 2016
MICHIGAN DEPARTMENT OF TRANSPORTATION AND THE CENTER FOR AUTOMOTIVE RESEARCH 17
Roadroid can provide estimated IRI by correlating android smartphone
accelerometry data to known vehicle types through experimentally determined
formulas, or can allow the user to calibrate IRI measurement to the specific
vehicle if an appropriate reference road is available. Roadroid estimated IRI
was found to be “moderately correlated” with true IRI (R2=0.515). Roadroid
developers acknowledge that this is not an appropriate replacement for precise
IRI measurement, but intend the program as a monitoring system and
alternative to subjective rating systems.64 The system has been deployed as a
contract service, though developers acknowledge that it would have even
higher value as a crowdsourcing application.65
Obtaining the required number of data points to monitor an entire road
network likely requires crowdsourcing data measurement to public
volunteers.66 Using crowdsourcing to obtain pavement condition would more
likely be successful with development and implementation of novel metrics
developed specifically to make use of smartphone-based crowdsourced data
(rather than attempting to recreate IRI or other existing metric).67 The most
challenging component of such a project would likely be obtaining sufficient
public participation.
StreetBump
An example of an application that captures pavement data without trying to
approximate pre-existing metrics is StreetBump, deployed by the City of
Boston. StreetBump is a smartphone accelerometry-based application to
identify potholes. It was originally deployed as a tool for city employees.68
However, the city opened the application for public use and has collected
valuable data from this crowdsourcing effort. For example, the city
determined that the majority of recorded “bumps” were related to pavement-
embedded castings (e.g., manhole covers, drainage grates, utility grates).
These utility infrastructure features are not owned by the city, but by various
utility companies. Armed with the StreetBump data demonstrating the impact
64 Forslӧf and Jones 2015. Such a method would not be acceptable for federal reporting even
if perfectly correlated to ‘true’ IRI because NHPP requirements dictate standardized data
collection methods as described in Table 3. 65 Islam et al. 2013. 66 MDOT and CAR 2013, pp. 21-25. 67 MDOT and CAR 2013, pp. 27-28. 68 Carrera, Guerin, and Thorp 2013.

INNOVATIVE APPROACHES TO PAVEMENT CONDITION DATA COLLECTION
MICHIGAN DEPARTMENT OF TRANSPORTATION AND THE CENTER FOR AUTOMOTIVE RESEARCH 18
that casting were having on ride quality, the City of Boston was able to
pressure utility companies to repair many in-road castings.69
Street Bump data is uploaded by users to the city via open311, where back-
office software identifies potholes that need to be fixed. 70 The servers to
which the app sends data are hosted by Connected Bits, with the data stored in
a MongoDB database. City users can generate queries to analyze the data
collected in that database.71 StreetBump’s creators believe that if the app were
to demand less interaction from users (e.g., manually starting the app and
sending data) the potential for useful data collection would increase.72
2.3 AUTOMATED VEHICLE SYSTEMS DATA
In most cases, any data generated by automated vehicle systems is solely for
internal use of the system.73 However, this is only a result of architectural
design. There are no hard barriers to off-loading vehicle data if system
designers allow for it. Developers of automated vehicle systems have begun
exploring system and network architectures that would allow for automated
vehicle systems to share data with transportation authorities for purposes of
pavement condition assessment.
JAGUAR LAND ROVER PUBLIC DATA RESEARCH
Jaguar Land Rover is developing a method to detect, predict, and share data
on potholes. The pothole system is designed primarily to improve automated
vehicle performance (by avoiding potholes). As an added benefit, Jaguar Land
Rover’s research team is working with Coventry City Council (UK) to
understand how road profile information gathered by this technology could be
shared with road authorities, and exactly what data would be most useful for
their roads maintenance teams to identify and prioritize repairs.74
69 Eric Moskowitz. “App shows jarring role of cast-metal covers in Boston.” The Boston
Globe. December 16, 2012. 70 open311 (by SeeClickFix) is a citizen-engagement platform available for public agencies.
http://seeclickfix.com/open311/v2 accessed August 2015. 71 O’Leary 2013. 72 Carrera, Guerin, and Thorp 2013. 73 Hong, Wallace, and Krueger 2014. 74 http://www.landrover.com/experiences/news/pothole-detection.html, accessed August 2015

PERFORMANCE-BASED PLANNING AND PROGRAMMING FOR PAVEMENT MANAGEMENT JUNE 2016
MICHIGAN DEPARTMENT OF TRANSPORTATION AND THE CENTER FOR AUTOMOTIVE RESEARCH 19
Google, now famously developing
self-driving cars in California and
elsewhere, has filed a patent for
“systems and methods for monitoring
and reporting road quality.”75 Google’s
patent envisions using embedded
vehicle sensors and localization data to
continuously monitor road conditions.
Programming embedded in the vehicle
head unit would convert sensor
readings into road-quality metrics and
transmit pertinent data through a
mobile network to a central server for
distribution in road quality reports and
to improve driving directions and
mapping software.76
Google’s patent appears directed at detecting malfunctions in vehicle sensors.
However, this system, if implemented, would create a network-wide map of
pavement roughness. Between Google’s self-driving car program, and
Android Auto (operating system for vehicle head units), Google is well
positioned to implement this program at some future date. Transportation
agencies should remain aware of Google’s activities in this area and consider
engaging with the company for access to any pavement condition data that is
generated.
OTHER POTENTIAL PARTNERS
Jaguar and Google’s interest in developing network-wide pavement roughness
data suggests that other automated technology developers might be interested
in pursuing similar methods to measure road quality. Mercedes has
implemented a cloud-based vehicle-to-vehicle communication system in the E
Class sedan to distribute information on travel conditions. Several
automakers, including GM, have put substantial effort into reading pavement
markings for automated driving. In addition to traditional automotive industry,
75 Sean O’Kane. “Google could track potholes to help you avoid them down the road.” The
Verge. August 25, 2015. 76 Patent No. US 9,108,640 B2. August 8, 2015.
FIGURE 5: GOOGLE PATENT NO. US 9,108,640 B2

INNOVATIVE APPROACHES TO PAVEMENT CONDITION DATA COLLECTION
MICHIGAN DEPARTMENT OF TRANSPORTATION AND THE CENTER FOR AUTOMOTIVE RESEARCH 20
companies known to be developing highly-capable automated vehicle systems
include HERE, Uber, and Apple.
2.4 IN SITU STRUCTURAL HEALTH MONITORING
Many research projects have experimented with embedding sensors with
bridge and pavement infrastructure to measure strain and record load history.
MDOT has implemented such sensors as part of a structural health monitoring
system on the Cut River Bridge in the upper peninsula.77 In a separate project,
Road Weather Information Systems (RWIS), MDOT has installed temperature
and moisture sensors on pavement surfaces and subsurfaces to feed into
environmental sensor stations. The data from such sensors is aimed for
maintenance crews, but could also be useful for performance management.
Such data could be used to precisely measure pavement deterioration rates and
develop mechanistic models for pavement deterioration.
Infrastructure-embedded sensors are relatively rare, due
partially to cost of installation and maintenance.
Traditional sensors must be powered and wired,
requiring fragile data and power support systems. One
potential solution to these issues is the advancement of
self-powered sensors. Such sensors operate
independent of an external power source by minimizing
power requirements and incorporating a permanent
long-life battery or capability to harvest kinetic energy
(from structural vibration or mechanical strain).78
Future development of self-powered in-pavement
sensors could provide valuable data to pavement
performance management programs.
2.5 AUTOMATED DISTRESS CLASSIFICATION
Network-level pavement condition assessment is often driven more by
reporting requirements than a desire improve pavement performance
management. For most reporting, including for the federal NHPP, metrics are
converted into general good/fair/poor categories.79 Classifying pavement
77 Darwish et al. 2015. 78 Lajnef et al. 2013. 79 NHPP requires reporting of individual metrics (IRI, cracking, rutting, faulting) which are
then translated into a good/fair/poor rating.
FIGURE 6: SELF-POWERED WIRELESS
PAVEMENT STRAIN SENSOR (SOURCE:
RHIMI ET AL. 2012)
PERFORMANCE-BASED PLANNING AND PROGRAMMING FOR PAVEMENT MANAGEMENT JUNE 2016
MICHIGAN DEPARTMENT OF TRANSPORTATION AND THE CENTER FOR AUTOMOTIVE RESEARCH 21
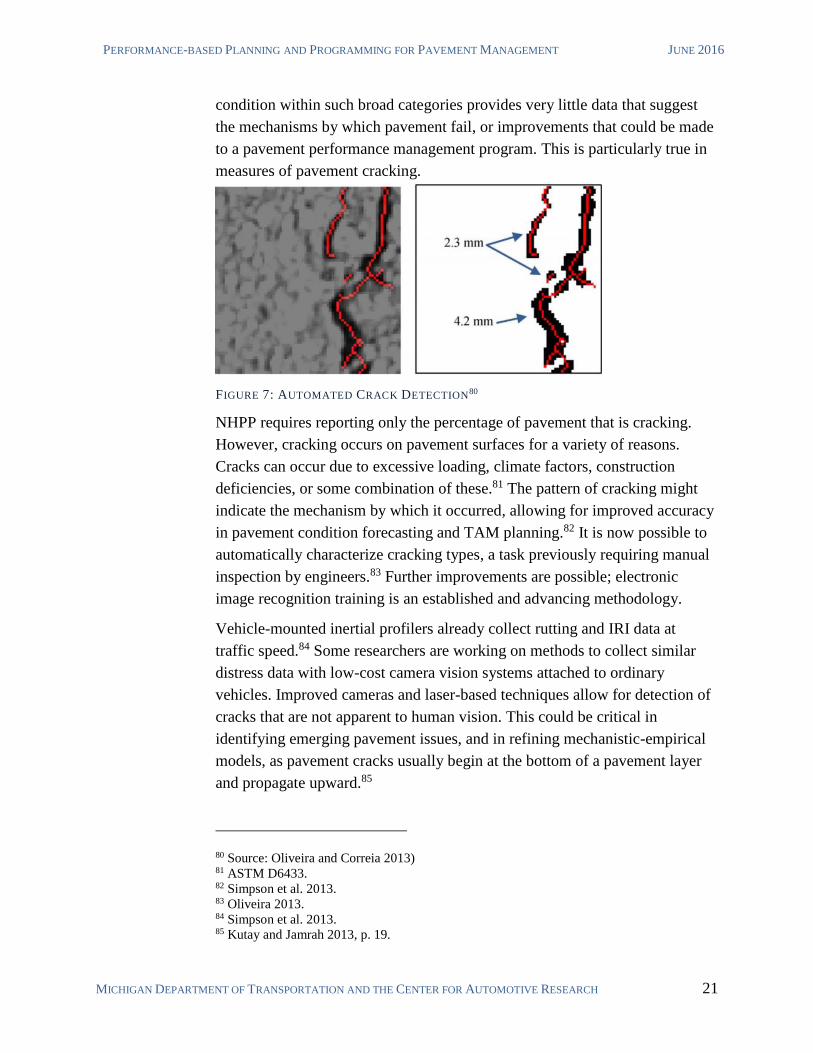
condition within such broad categories provides very little data that suggest
the mechanisms by which pavement fail, or improvements that could be made
to a pavement performance management program. This is particularly true in
measures of pavement cracking.
FIGURE 7: AUTOMATED CRACK DETECTION80
NHPP requires reporting only the percentage of pavement that is cracking.
However, cracking occurs on pavement surfaces for a variety of reasons.
Cracks can occur due to excessive loading, climate factors, construction
deficiencies, or some combination of these.81 The pattern of cracking might
indicate the mechanism by which it occurred, allowing for improved accuracy
in pavement condition forecasting and TAM planning.82 It is now possible to
automatically characterize cracking types, a task previously requiring manual
inspection by engineers.83 Further improvements are possible; electronic
image recognition training is an established and advancing methodology.
Vehicle-mounted inertial profilers already collect rutting and IRI data at
traffic speed.84 Some researchers are working on methods to collect similar
distress data with low-cost camera vision systems attached to ordinary
vehicles. Improved cameras and laser-based techniques allow for detection of
cracks that are not apparent to human vision. This could be critical in
identifying emerging pavement issues, and in refining mechanistic-empirical
models, as pavement cracks usually begin at the bottom of a pavement layer
and propagate upward.85
80 Source: Oliveira and Correia 2013) 81 ASTM D6433. 82 Simpson et al. 2013. 83 Oliveira 2013. 84 Simpson et al. 2013. 85 Kutay and Jamrah 2013, p. 19.
INNOVATIVE APPROACHES TO PAVEMENT CONDITION DATA COLLECTION
MICHIGAN DEPARTMENT OF TRANSPORTATION AND THE CENTER FOR AUTOMOTIVE RESEARCH 22
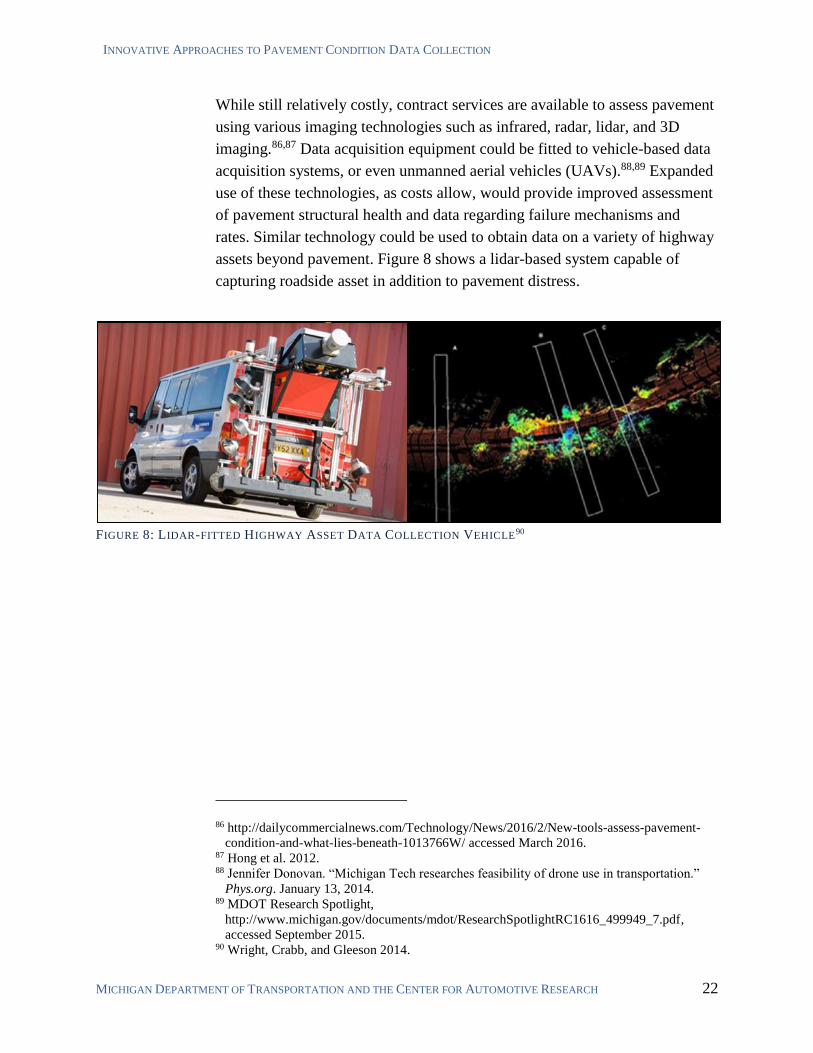
While still relatively costly, contract services are available to assess pavement
using various imaging technologies such as infrared, radar, lidar, and 3D
imaging.86,87 Data acquisition equipment could be fitted to vehicle-based data
acquisition systems, or even unmanned aerial vehicles (UAVs).88,89 Expanded
use of these technologies, as costs allow, would provide improved assessment
of pavement structural health and data regarding failure mechanisms and
rates. Similar technology could be used to obtain data on a variety of highway
assets beyond pavement. Figure 8 shows a lidar-based system capable of
capturing roadside asset in addition to pavement distress.
FIGURE 8: LIDAR-FITTED HIGHWAY ASSET DATA COLLECTION VEHICLE90
86 http://dailycommercialnews.com/Technology/News/2016/2/New-tools-assess-pavement-
condition-and-what-lies-beneath-1013766W/ accessed March 2016. 87 Hong et al. 2012. 88 Jennifer Donovan. “Michigan Tech researches feasibility of drone use in transportation.”
Phys.org. January 13, 2014. 89 MDOT Research Spotlight,
http://www.michigan.gov/documents/mdot/ResearchSpotlightRC1616_499949_7.pdf,
accessed September 2015. 90 Wright, Crabb, and Gleeson 2014.

PERFORMANCE-BASED PLANNING AND PROGRAMMING FOR PAVEMENT MANAGEMENT JUNE 2016
MICHIGAN DEPARTMENT OF TRANSPORTATION AND THE CENTER FOR AUTOMOTIVE RESEARCH 23
3 MECHANISTIC-EMPIRICAL PAVEMENT
PERFORMANCE MANAGEMENT
Data is only valuable if it can be put to good use. Many existing pavement
performance management programs were developed for specific data types.
Many of these programs have become structured through architecture and
practice such that it is difficult to change and adapt to new data types and
methods. Most of the novel technologies described in Chapter 2 could not
easily be integrated into a pavement management system that is not
sufficiently robust.
The state-of-the-practice in pavement performance management is now
considered to be a mechanistic-empirical (M-E) approach, administered
within a broader performance-based planning and programming framework.
An M-E pavement management system is practically required to take
advantage of new data sources as described in the previous chapter. M-E
pavement performance management is described in this chapter.
3.1 PAVEMENT ENGINEERING AND DESIGN
In the late 1950s, AASHTO conducted a large-scale study to determine how
traffic and pavement structure contribute to the deterioration of highway
pavements.91 The results were used to develop the first and subsequent
versions of the AASHTO Guide for Design of Pavement Structures. Today’s
demands on the transportation system, however, are significantly different
from those that existed half a century ago, and applying classic design
approaches to present-day situations has become problematic.
Traditionally, pavement engineers have taken a strictly empirical approach to
highway design, which is based exclusively on the results of experimentation
and the observation of those results (i.e., empirical evidence). On the other
end of the spectrum is the mechanistic design approach, which uses materials
characterization and theories of mechanics to relate structural behavior and
performance to traffic loading and environmental changes. A mechanistic-
empirical approach combines the best of both. In 2004, a National
Cooperative Highway Research Program (NCHRP) project developed a new
91 Previous to 1973 AASHTO was known as AASHO.
MECHANISTIC-EMPIRICAL PAVEMENT PERFORMANCE MANAGEMENT
MICHIGAN DEPARTMENT OF TRANSPORTATION AND THE CENTER FOR AUTOMOTIVE RESEARCH 24
pavement design guide for AASHTO based on a mechanistic-empirical
approach.92
The resulting AASHTO Mechanistic-Empirical Pavement Design Guide
(MEPDG) was published in 2008, along with supporting software.93 The two
fundamental differences between the classic Guide for Design of Pavement
Structures and the MEPDG are that the MEPDG predicts multiple
performance indicators, and it provides a direct tie between materials,
structural design, construction, climate, traffic, and pavement management
systems. Overall, MEPDG outlines a structured design process that has three
basic elements:94
1. The model used to predict critical pavement responses (strains, stresses,
deflections, etc.), as a function of traffic and climatic loading (the
mechanistic part)
2. Materials characterization procedures that support and are consistent with
the mechanistic model
3. Defined relationships between the critical pavement response parameter
and field-observed distress (the empirical part).
The MEPDG provides a uniform and comprehensive set of procedures for the
analysis and design of new and rehabilitated pavements. The MEPDG
employs common design parameters for traffic, materials, subgrade, climate,
and reliability for most pavement types, and can be used to develop alternative
designs using a variety of materials and construction procedures. Furthermore,
the MEPDG provides recommendations for the structure (layer materials and
thickness) of new and rehabilitated pavements, including procedures to select
pavement layer thickness, rehabilitation treatments, subsurface drainage,
foundation improvement strategies, and other design features.
MDOT adopted the MEPDG for pavement design in 2015.95 A critical
implication of using the MEPDG is that the upcoming federal reporting and
planning requirements for NHPP/TAMP have been harmonized with MEPDG
performance criteria and default end-of-life values.
92 TRB 2004. 93 AASHTO 2008. 94 ibid. 95 MDOT 2015a.

PERFORMANCE-BASED PLANNING AND PROGRAMMING FOR PAVEMENT MANAGEMENT JUNE 2016
MICHIGAN DEPARTMENT OF TRANSPORTATION AND THE CENTER FOR AUTOMOTIVE RESEARCH 25
3.2 PERFORMANCE INDICATORS (PAVEMENT CONDITION
MEASUREMENT)
MEPDG is not a direct thickness-design procedure (as was the previous
AASHTO Pavement Design Guide). It describes an analysis tool for the
designer to use in an iterative approach. The output from the MEPDG is
predicted distresses and IRI (smoothness) at a selected reliability level.
Specifically, the MEPDG is used to evaluate a trial design (combination of
layer types, layer thickness, and design features) for a given set of site
conditions and failure criteria at a specified level of reliability. The MEPDG
includes transfer functions and regression equations that are used to predict
various performance indicators.96
FIGURE 9: MEPDG OUTPUT—PREDICTED IRI AND RELIABILITY (SOURCE: AASHTO
2008)97
96 IRI and the primary distresses predicted by the MEPDG model have been selected by
FHWA as required reporting for the NHPP. 97 In the MEPDG, IRI is predicted empirically as a function of pavement distresses, site
factors, and initial IRI (AASHTO 2008, p. 30.)

MECHANISTIC-EMPIRICAL PAVEMENT PERFORMANCE MANAGEMENT
MICHIGAN DEPARTMENT OF TRANSPORTATION AND THE CENTER FOR AUTOMOTIVE RESEARCH 26
The specific performance indicators predicted by the MEPDG are as
follows:98
FOR ASPHALT PAVEMENT99
1. Total rut depth and relative impact from individual layers
2. Non-load-related transverse cracking
3. Load-related alligator cracking (bottom initiated cracks)
4. Load-related longitudinal cracking (surface initiated cracks)
5. Reflection cracking in HMA overlays
6. Smoothness (IRI)
FOR RIGID (PCC) JOINTED PLAIN CONCRETE PAVEMENT100
1. Mean joint faulting
2. Joint load transfer efficiency (LTE)
3. Load-related transverse slab cracking (includes both bottom and surface
initiated cracks)
4. Joint spalling (also embedded into the IRI prediction model)
5. Smoothness (IRI)
FOR RIGID (PCC) CONTINUOUSLY REINFORCED CONCRETE
PAVEMENT (CRCP)101
1. Crack spacing and crack width
2. Load transfer efficiency (LTE)
3. Punchouts
4. Smoothness (IRI)
Not all performance indicators predicted by the MEPDG must necessarily be
used as design criteria. Pavement engineers and TAM planners can adjust the
inputs based on available data. The performance criteria recommended as
design criteria are given in Table 4 on the following page.
98 AASHTO 2008, pp. 15-16. 99 Total rutting, percent cracking, and IRI are required for all NHS routes under federal
TAMP/NHPP requirements. 100 Total faulting, percent cracking, and IRI are required for all NHS routes under federal
TAMP/NHPP requirements. 101 Percent cracking (including punchouts and spalling) and IRI are required for all NHS
routes under federal TAMP/NHPP requirements.
PERFORMANCE-BASED PLANNING AND PROGRAMMING FOR PAVEMENT MANAGEMENT JUNE 2016
MICHIGAN DEPARTMENT OF TRANSPORTATION AND THE CENTER FOR AUTOMOTIVE RESEARCH 27
3.3 CALIBRATION
Pavement-ME design software includes default pavement distress models to
predict performance over a pavement life cycle. The adoption of an effective
mechanistic-empirical pavement design program requires determining local
bias in the Pavement-ME global distress models, establishing the causes of
such bias whenever possible, and updating the default settings with local
calibration coefficients for each distress and IRI prediction model.102 The
corrected coefficients are estimated by minimizing the error between
predicted and measured distress.
Obtaining all inputs for the pavement design process can be time-consuming,
but these data are what improves the MEPDG over other design procedures.
Additionally, the MEPDG allows for variability in the design process when
data is not available. MEPDG allows pavement engineers to determine design
102 Buch et al. 2013, p. 4.
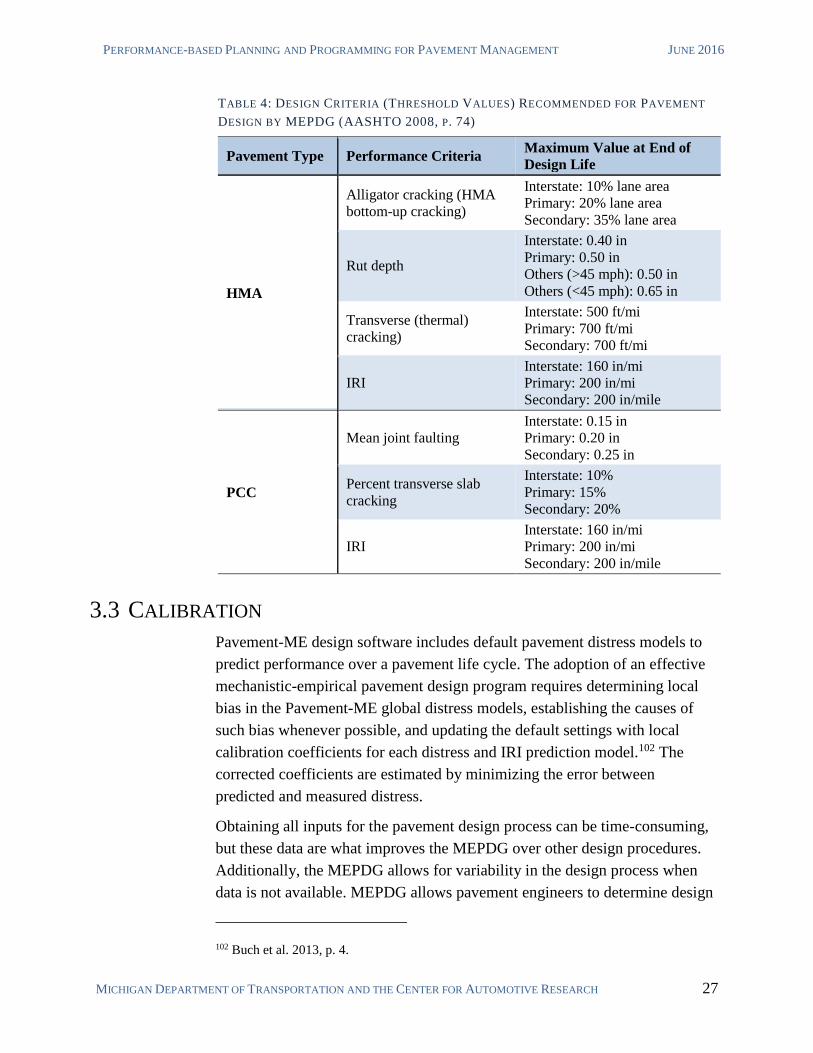
TABLE 4: DESIGN CRITERIA (THRESHOLD VALUES) RECOMMENDED FOR PAVEMENT
DESIGN BY MEPDG (AASHTO 2008, P. 74)
Pavement Type Performance Criteria Maximum Value at End of
Design Life
HMA
Alligator cracking (HMA
bottom-up cracking)
Interstate: 10% lane area
Primary: 20% lane area
Secondary: 35% lane area
Rut depth
Interstate: 0.40 in
Primary: 0.50 in
Others (>45 mph): 0.50 in
Others (<45 mph): 0.65 in
Transverse (thermal)
cracking)
Interstate: 500 ft/mi
Primary: 700 ft/mi
Secondary: 700 ft/mi
IRI
Interstate: 160 in/mi
Primary: 200 in/mi
Secondary: 200 in/mile
PCC
Mean joint faulting
Interstate: 0.15 in
Primary: 0.20 in
Secondary: 0.25 in
Percent transverse slab
cracking
Interstate: 10%
Primary: 15%
Secondary: 20%
IRI
Interstate: 160 in/mi
Primary: 200 in/mi
Secondary: 200 in/mile

MECHANISTIC-EMPIRICAL PAVEMENT PERFORMANCE MANAGEMENT
MICHIGAN DEPARTMENT OF TRANSPORTATION AND THE CENTER FOR AUTOMOTIVE RESEARCH 28
coefficients using a hierarchical structure in which the effort required to
quantify a given input is selected based on the importance of the project,
importance of the input, and the resources at the disposal of the user.103
Pavement-ME allows for local calibration of climate and geological factors,
subject to available data. Most important is local calibration of traffic impact,
as discussed in the following section.
3.4 TRAFFIC MODELLING
Most pavement distresses are caused by repeated truck traffic loads.104
Characterization of truck traffic is a key data element for structural design of
pavement. Accordingly, the MEPDG allows for detailed classification of
traffic patterns expected over the life of the pavement.
ROADWAY-SPECIFIC INPUTS105
1. Initial Two-Way Average Annual Daily Truck Traffic (AADTT)—AADTT
has a significant effect on the predicted pavement performance indicators
and represents a weighted average between weekday and weekend truck
traffic. AADTT can be obtained from WIM data, automated vehicle
counters, or manual traffic counts. The value entered into the MEPDG
software is the forecasted AADTT after the roadway is opened to traffic or
the rehabilitation has been completed.
2. Percent Trucks in Design Lane—The percent of truck in the design lane
typically is determined by estimating the percentage of truck traffic in the
design lane relative to all truck traffic in one direction. However, the
definition used in the MEPDG is slightly different; it is defined by the
primary truck class for the roadway.
3. Percent Trucks in Design Direction—This value represents the percent of
trucks in the design direction relative to all trucks using the roadway in
both directions. This value can be estimated from AVC data or manual
vehicle count data.
4. Operational Speed—Truck speed has affects the predicted dynamic
modulus (E*) of HMA and, thus, resulting distresses. Lower speeds result
103 AASHTO 2008. 104 Some distresses can be caused, or exacerbated, by climactic and/or geological factors.
Pavement damage caused by light vehicles is typically minimal (TRB 2002). 105 AASHTO 2008, pp. 79-80.

PERFORMANCE-BASED PLANNING AND PROGRAMMING FOR PAVEMENT MANAGEMENT JUNE 2016
MICHIGAN DEPARTMENT OF TRANSPORTATION AND THE CENTER FOR AUTOMOTIVE RESEARCH 29
in higher incremental damage values calculated by the MEPDG (more
fatigue cracking and deeper ruts or faulting). Thus, the posted truck speed
limit can be used to evaluate trial designs, unless the pavement is located
in a special low-speed area.
5. Growth of Truck Traffic—The truck class mix forecast has a significant
effect of predicted pavement performance and can be determined with
information about the commodities being transported through the project
location. The growth of truck traffic is difficult to estimate accurately
because many site and social-economic factors are relevant that are
difficult, if not impossible, to predict over 20 years or more. The traffic or
planning departments (or both) within an agency can be consulted to
estimate the increase in truck traffic over time.
WEIGH-IN-MOTION-EXTRACTED INPUTS106
1. Axle-Load Spectra—A histogram or distribution of axle loads for a
specific axle type (single, tandem, tridem, and quad). In other words, the
number of axle applications within a specific axle-load range, as obtained
from weigh-in-motion data.
2. Hourly Distribution Factors—The percentage of trucks using a facility for
each hour of the day.
3. Monthly Distribution Factors—This value defines the distribution of truck
volumes on a monthly basis in a typical year.
4. Normalized Axle-Load Spectra—The normalized axle-load spectra is a
normalized histogram of axle loads for a specific axle type. To determine
the normalized load spectra, the number of axle applications weighed
within a specific load range for an axle type is divided by the total number
of axles weighed for that axle type.
5. Normalized Truck Volume Distribution—The normalized truck volume
distribution is a normalized distribution of the different truck classes
within the traffic stream. To determine the normalized truck class volume
distribution, the number of trucks counted within a specific classification
is divided by the total number of trucks counted.
106 AASHTO 2008, pp. 80-82.

MECHANISTIC-EMPIRICAL PAVEMENT PERFORMANCE MANAGEMENT
MICHIGAN DEPARTMENT OF TRANSPORTATION AND THE CENTER FOR AUTOMOTIVE RESEARCH 30
6. Truck Classification Distribution—The distribution of the number of truck
applications for each truck classification for all trucks counted. Trucks are
defined as vehicle classes 4 through 13 using the FHWA classifications.
Finally, the MEPDG provides (7.) a Truck Traffic Classification (TTC) group
rating. This index defines 17 unique TTC groups with normalized axle-load
spectra and truck volume distribution, derived from observed count data.
Based on TTC rating, the MEPDG provides default values for the normalized
axle-load spectra and normalized truck classification volume distributions.
These values would ideally be adjusted to local traffic projections, subject to
available data (data items 1-6).
FIGURE 10: MOST HIGHWAY PAVEMENT DAMAGE IS CAUSED BY HEAVY TRUCKS
3.5 PAVEMENT MANAGEMENT SYSTEMS
Most state transportation agencies, including MDOT, employ pavement
management system (PMS) software for decision support in selection of
highway projects. A pavement management system allows agencies to make
better investment decisions by projecting and minimizing network-level life-
cycle costs, rather than adopting a simple ‘worst-first’ approach.107 Strategic
maintenance might require treating pavement when they are still in good
condition—before the pavement shows signs of structural failure.
Appropriately using PMS software for pavements designed with MEPDG
methods requires adopting MEPDG performance indicators.108 A
rehabilitation strategy should not be pursued without first determining the
107 Tan and Cheng 2011. 108 AASHTO 2008, p. 24; Also see supra, section 3.2.

PERFORMANCE-BASED PLANNING AND PROGRAMMING FOR PAVEMENT MANAGEMENT JUNE 2016
MICHIGAN DEPARTMENT OF TRANSPORTATION AND THE CENTER FOR AUTOMOTIVE RESEARCH 31
causes and mechanisms of the distress.109 Pavement management frameworks
that do not adopt established MEPDG metrics are not capable of taking
advantage of improved modelling capabilities of M-E design. Pavement
management systems should include regular assessment of MEPDG
performance design criteria, as shown in Table 4 on page 27.
Under federal regulatory guidelines established by MAP-21 and confirmed by
the FAST Act, state transportation departments and MPOs will be responsible
to develop a transportation asset management plan (TAMP) that includes PMS
tools that utilize the metrics emphasized in the MEPDG. The TAMP will be
required to include at minimum bridge and pavement assets of the NHS.
However, agencies that wish to apply TAM to other assets are encouraged to
do so within the framework of the federally-required TAMP.
FHWA PAVEMENT HEALTH TRACK
The FHWA has developed the Pavement Health Track (PHT) Analysis Tool
to determine the health of a pavement network in terms of the pavement's RSL
using models developed by FHWA for the Highway Economic Requirements
System (HERS)110 and the National Pavement Cost Models. These pavement
performance models are simplified versions of the models and procedures
used in the AASHTO MEPDG.111
Pavement health can be determined for different pavement types under
various conditions such as climate or whether it is in a rural or urban
environment. RSL can be reported as both the weighted average RSL of all
distresses or as the RSL for one particular distress for a given section of
pavement or the entire network. The program provides an option for inputs on
material properties, climate, and loading to predict the future remaining
service life of the pavement. If the data is not available, the program contains
a compiled data set that uses data from such sources as the FHWA Long-Term
Pavement Performance program and National Climate Data Center databases
as default inputs. This compiled data set meets the needs of the RSL
predictive models.112
109 Buch et al. 2013, pp. 21-28. 110 HERS-ST is an engineering/economic analysis (EEA) tool that uses engineering standards
to identify highway deficiencies, and then applies economic criteria to select the most cost-
effective mix of improvements for system-wide implementation
(https://www.fhwa.dot.gov/infrastructure/asstmgmt/hersindex.cfm accessed April 2016). 111 https://www.fhwa.dot.gov/publications/focus/10aug/01.cfm accessed April 2016. 112 ibid.

MECHANISTIC-EMPIRICAL PAVEMENT PERFORMANCE MANAGEMENT
MICHIGAN DEPARTMENT OF TRANSPORTATION AND THE CENTER FOR AUTOMOTIVE RESEARCH 32
A modular design allows for future expansion of the software's capabilities,
including adding such features as the ability to develop and display the bridge
health index for a particular corridor and to estimate pavement asset values,
the impact of various maintenance and rehabilitation plans on RSL, and
reconstruction needs. Additional future capabilities could include the ability to
detect uneven distribution of RSL, integrate benefit and cost models from
HERS, and incorporate State-specific pavement models or calibrated
pavement performance coefficients.113,114
113 ibid. 114 More information regarding Pavement Health Track is available at
https://www.fhwa.dot.gov/pavement/healthtrack/pubs/technical/technical.pdf.

PERFORMANCE-BASED PLANNING AND PROGRAMMING FOR PAVEMENT MANAGEMENT JUNE 2016
MICHIGAN DEPARTMENT OF TRANSPORTATION AND THE CENTER FOR AUTOMOTIVE RESEARCH 33
FIGURE 11 TYPICAL DIFFERENCES BETWEEN EMPIRICAL DESIGN PROCEDURES AND
AN INTEGRATED M-E DESIGN SYSTEM, IN TERMS OF HMA-MIXTURE
CHARACTERIZATION115
115 AASHTO 2008.
(Old) (New)

MECHANISTIC-EMPIRICAL PAVEMENT PERFORMANCE MANAGEMENT
MICHIGAN DEPARTMENT OF TRANSPORTATION AND THE CENTER FOR AUTOMOTIVE RESEARCH 34

PERFORMANCE-BASED PLANNING AND PROGRAMMING FOR PAVEMENT MANAGEMENT JUNE 2016
MICHIGAN DEPARTMENT OF TRANSPORTATION AND THE CENTER FOR AUTOMOTIVE RESEARCH 35
4 SUMMARY AND DISCUSSION
Roadway pavement is typically the most significant asset for a transportation
agency. Thus, effective pavement performance management is an essential
component of a successful Transportation Asset Management (TAM)
program. TAM is a decision-making framework designed to optimize
transportation investment.116
As technology advances, transportation agencies have an expanding array of
potential new approaches to obtain data about pavement condition.117
However, the types of data most useful to assessing pavement condition have
long been established, and most methods at acquiring such data have been
standardized. While there are expanding possibilities to collect new types of
data, far more potential exists to improve existing TAM programs by making
better use of existing metrics.
FHWA and AASHTO have recognized the state-of-the-practice in pavement
performance management to include mechanistic-empirical approaches within
a broad performance-based planning and programming (PBPP) framework.
4.1 ADOPTING PERFORMANCE-BASED PLANNING AND
PROGRAMMING ACROSS THE ENTERPRISE
State DOTs and MPOs will be required to adopt a basic M-E TAM program
within a PBPP framework through development of a Transportation Asset
Management Plan (TAMP) for the National Highway System (NHS). Such
principles represent recognized best practices in TAM and should be
embraced broadly within agencies.
PAVEMENT DESIGN AND ENGINEERING
MDOT transitioned to M-E pavement design in Spring 2015. MDOT
pavement engineers now use Pavement-ME, an AASHTOWare software
product that enables use of the AASHTO Mechanistic-Empirical Pavement
Design Guide (MEPDG).118
Pavement-ME allows MDOT engineers to design pavement based on M-E
prediction of specific distresses over time, accounting for degradation by
116 supra Section 1.2, p. 2. 117 supra Chapter 2, p. 10. 118 MDOT 2015.

SUMMARY AND DISCUSSION
MICHIGAN DEPARTMENT OF TRANSPORTATION AND THE CENTER FOR AUTOMOTIVE RESEARCH 36
weather and traffic loading based on mechanistic-empirical models. A number
of different material inputs are required, and accurate measurement of these
inputs is crucial for the accuracy of the distress predictions.
Per revisions to the Federal Highway Aid Program introduced in MAP-21 and
reaffirmed by the FAST Act, MDOT and Michigan’s MPOs will be required
to develop a Transportation Asset Management Plan (TAMP) incorporating
PBPP principles for the National Highway System (NHS) that incorporates
MEPDG metrics and methods. Fully realizing the benefits of the MEPDG will
require broad institutional adaption within MDOT, including pavement
performance management beyond NHS facilities.
PROJECT SELECTION AND PROGRAMMING
As discussed above, MDOT has enabled state-of-the-practice pavement
design by adopting the AASHTO MEPDG and supporting software. This
approach can enable MDOT pavement engineers to optimize pavement design
for local conditions and continually improve design parameters, but it might
not result in improvement in pavement life-cycle performance unless asset
management and maintenance activities also adopt mechanistic-empirical
frameworks.
Many of the metrics that MDOT currently uses to assess the life-cycle
performance and condition of pavement are incongruent with M-E theory. The
MEPDG model assumes that all distress types are uncoupled.119 Thus,
composite pavement metrics such as DI and PASER cannot be used in
mechanistic-empirical pavement performance management.120,121
MDOT currently calculates RSL from a composite distress index (DI), and is
able to estimate pavement condition degradation reasonably well at the
aggregated (state-wide) system-level. However, the performance of individual
projects can vary significantly. Using empirical methods only, MDOT is not
able to predict the performance of a specific pavement section, or determine
causes of variations in pavement performance.122 Further, appropriate
rehabilitation or maintenance strategies cannot be determined without
additional data; MDOT currently obtains such data in a “project scoping”
119 Buch et al. 2013, p. 4. 120 Buch et al. 2013; Abu-Lebdeh et al. 2003. 121 In contrast to M-E approach, MDOT pavement condition forecast models are simple
logistic regression models with pavement age as the independent variable (Abu-Lebdeh et
al. 2003). 122 Abu-Lebdeh et al. 2003.
PERFORMANCE-BASED PLANNING AND PROGRAMMING FOR PAVEMENT MANAGEMENT JUNE 2016
MICHIGAN DEPARTMENT OF TRANSPORTATION AND THE CENTER FOR AUTOMOTIVE RESEARCH 37
process that is initiated only after the pavement section has been selected for
replacement or rehabilitation.123 A mechanistic-empirical TAM system would
assist MDOT in identifying investment strategies that would achieve
maximum return on investment before a project is selected, and allow MDOT
to adopt best-practices in performance-based planning and programming
(PBPP).
MDOT TRANSPORTATION ASSET MANAGEMENT
MDOT will be required to use M-E metrics and principles to develop a
Transportation Asset Management Plan (TAMP) under statutory requirements
of MAP-21 and the FAST Act.124 The TAMP will be required only for NHS
routes, but states and MPOs are encouraged to include other transportation
assets within the plan. When MDOT develops a TAMP, the plan should
include all MDOT routes within a single framework. It will be inefficient to
have parallel TAM programs for the NHS and for the rest of MDOT’s
pavement system. MDOT should leverage the expertise and assistance
provided by FHWA to develop a state TAMP that is truly statewide—
including non-NHS routes.
Optimal pavement performance management is a comprehensive data-based
process. The efficacy of the MEPDG process for rehabilitation design hinges
on the availability and compatibility of performance (distress and roughness)
data, as well as various site-specific data.125 A rehabilitation strategy should
not be pursued with determining the causes and mechanisms of the distress.126
An ideal pavement management system would consist of a single database
integrating multiple data sets, such as those shown in Table 5.
Legacy practices involving calculation of DI and PASER would be
duplicative and could be phased-out. With adoption and continued application
of MEPDG design and performance management in coming years, MDOT
will be able to continually improve investment strategies as life-cycle models
are refined to reflect local performance.
123 MDOT 2015b. 124 FHWA. MEMO: INFORMATION: National Highway Performance Program (NHPP)
Implementation Guidance as Revised by the FAST Act. March 9, 2016. 125 Buch et al. 2013, p. 3. 126 Buch et al. 2013, pp. 21-28.

SUMMARY AND DISCUSSION
MICHIGAN DEPARTMENT OF TRANSPORTATION AND THE CENTER FOR AUTOMOTIVE RESEARCH 38
TABLE 5: EXAMPLE DATA FOR USE IN M-E PAVEMENT MANAGEMENT SYSTEM
Data Category Example Data Sets127
General and Project
Information
Project identities
Construction date
Restoration date(s)
Maintenance date(s)
Traffic opening date(s)
Analysis Parameters Initial smoothness (IRI)
Performance criteria (IRI, cracking, and faulting)
Climate Data Weather station near project, or interpolation of
multiple stations if data not available at site
Traffic Data
ADT, ADTT
Percent trucks
Vehicle speed data
Traffic volume and axle adjustment factors
Wheel location
Traffic wander
Drainage and Surface
Properties
Cross-slope
Length of drainage path
Surface absorptivity
Layer Definition and
Material Properties
Number of layers, description, material details
Mechanical and thermal properties
Traffic history
As suggested by the example data types in Table 5, embracing M-E pavement
performance management will require increased data collection efforts across
MDOT—necessitating active engagement from all departments involved in
any aspect of pavement design, construction, maintenance, performance
measurement, planning, and project selection.128 Legacy TAM frameworks
did not require such a detailed amount of data, and consequently MDOT is not
currently organized in such a way to facilitate use of such data even when the
data exists.
The importance of data collection became apparent when MSU and MDOT
researchers evaluated in-field pavement performance in Michigan to calibrate
local coefficients for Pavement-ME design software. This calibration process
is a critical step in adopting MEPDG and Pavement-ME software. Generally,
127 HPMS reporting requires data on only one lane of a multi-lane road. (in both directions for
interstate routes). A robust pavement performance management system would go beyond
these requirements to capture lane-level data, as many routes have different traffic
conditions and subsequent life-cycle performance and maintenance activities in differing
lanes. 128 See Tan and Cheng 2011 for relation to maintenance activities.

PERFORMANCE-BASED PLANNING AND PROGRAMMING FOR PAVEMENT MANAGEMENT JUNE 2016
MICHIGAN DEPARTMENT OF TRANSPORTATION AND THE CENTER FOR AUTOMOTIVE RESEARCH 39
the default (nationally calibrated) model does not perform well if the inputs
and performance data used to create the default model do not reflect local
conditions. When MDOT and MSU researchers began the calibration process
for Michigan projects, they found that much of the required data was
unavailable. Even when design information was available, tracking it down
proved to be arduous. Researchers had to estimate many of the parameters
required to develop local models of pavement performance.129
The MEPDG calibration process also exposed deficiencies in legacy
pavement engineering and condition assessment practices; the team identified
several projects that were observed to be failing at a significantly higher rate
than expected. The research team and MDOT attempted to identify any
construction or material related issues that might explain poor pavement
performance, but in all cases, “it was concluded that there was not enough
information available to determine why these sections were performing
poorly.”130 Lacking such data, MDOT engineers were unable to appropriately
calibrate the MEPDG design coefficients to local conditions.
MDOT’s ability to collect, archive, and access such data must improve to
optimize MEPDG design and subsequent TAM practices. Currently, MDOT’s
pavement management approach is arranged according to legacy practices in
which various aspects of TAM were loosely connected and performed by
independent divisions. MDOT has at least four independent statewide
operational divisions directly responsible for some aspect of pavement
performance management:131
Statewide Planning Division
Asset Management Division
Construction Field Services Division
Operations Field Services Division
These statewide offices are challenged to coordinate across institutional
boundaries to develop coherent statewide strategies for pavement performance
management. This coordination is made even more difficult as many aspects
129 Haider et al. 2014, pp. 67-84. 130 Haider et al. 2014, p. 63. Because no causes for poor pavement performance could be
identified, all pavement sections, including apparent outliers, were included in the
calibration model. This is not ideal. 131 April 2015 MDOT organizational chart,
http://www.michigan.gov/documents/orgchart011603_55427_7.pdf, accessed September
2015.

SUMMARY AND DISCUSSION
MICHIGAN DEPARTMENT OF TRANSPORTATION AND THE CENTER FOR AUTOMOTIVE RESEARCH 40
of planning, programming, engineering, construction, and maintenance are
distributed among MDOT’s seven regional offices, twenty transportation
service centers (TSCs), and thirty or so maintenance garages.
With previous pavement design and asset management practices, it was often
difficult to establish relationships between design, construction, maintenance,
and resulting pavement performance. With M-E pavement performance
management, any data has the potential to contribute to understanding of
pavement mechanics and empirical relationships. The entire history of a
pavement should be known if possible, down to the maintenance actions,
including reactive maintenance, plowing and salting. Such a wealth of data
could overwhelm traditional pavement performance strategies, but intelligent
decision-support software based on mechanistic-empirical theory is capable of
integrating a wide variety of data types into a coherent and logical asset
management plan.132 Good data becomes much more valuable and is, in fact,
essential in this process. This will require MDOT to adjust pavement
condition data collection methods to better provide the types of data utilized
by M-E theory and the MEPDG.
One benefit of a mechanistic-empirical approach to TAM is that models can
be expanded to incorporate a variety of factors beyond pavement
performance. The potential scope of TAM is limited only by the availability
of data and scope of models. This might allow potential projects to be better
assessed for return on investment regarding priorities beyond pavement. For
example, consider two potential projects (A and B) with equivalent pavement
RSL—with only enough budget for one of the projects within the next five
years. Project A has been identified as needing stormwater management
improvements; however, Project B has higher traffic demands and would
benefit from added ADA-compliant pedestrian facilities. A sufficiently robust
TAMS will be able to incorporate such variables in project identification,
selection, and design. Further, such a system would also be amenable to the
inclusion of new technology-based data sources such as those discussed in
Chapter 2.
132 Kutay and Jamrah 2013.

PERFORMANCE-BASED PLANNING AND PROGRAMMING FOR PAVEMENT MANAGEMENT JUNE 2016
MICHIGAN DEPARTMENT OF TRANSPORTATION AND THE CENTER FOR AUTOMOTIVE RESEARCH 41
4.2 COORDINATION AND GUIDANCE OF STATEWIDE
TRANSPORTATION ASSET MANAGEMENT
Municipal Planning Organizations (MPO’s), large counties, and large cities
are often responsible for the performance of extensive, complex, multimodal
transportation networks. In contrast with small and rural localities, these areas
would likely benefit from adopting coherent TAM programs incorporating M-
E pavement management principles. MPO’s will be subject to MAP-21
performance-based planning requirements and national measures with regards
to the interstates and NHS. Thus, MPO’s will be largely responsible for
coordinating county and city planning. However, MDOT is ultimately
accountable for the condition of the NHS within MPO boundaries.
FHWA proposes MPOs develop performance targets by either supporting
statewide targets, or developing their own.133 In order to promote a logical and
legible statewide TAM program, MPOs should be compelled to have self-
contained planning/programming operations that meet federal requirements.
To the extent practical, MPOs should mirror MDOT TAM practices, including
use of M-E methods to estimate RSL. This is particularly important for project
selection on trunklines and NHS facilities.
The AASHTO MEPDG might not be practically applied to all local roads, but
the adoption of M-E methods is the most likely way to improve performance
results. If there is room to improve investment decisions at the local level,
such improvements would be best attained with an M-E approach to pavement
performance management. MPOs should adopt M-E pavement design and
project selection to extent practical, while transitioning TAM programs to
support future expansion to more robust data-intensive methods.
MDOT can encourage a broad transition to PBPP frameworks and M-E TAM
by providing support and assistance to county, municipal, and MPO
transportation agencies. In addition to having a greater institutional capacity,
MDOT will have statewide performance data that will be valuable for smaller
agencies when calibrating M-E pavement design and TAM programs.
133 FHWA 2015, p. 327.

SUMMARY AND DISCUSSION
MICHIGAN DEPARTMENT OF TRANSPORTATION AND THE CENTER FOR AUTOMOTIVE RESEARCH 42
REAL-WORLD LIMITATIONS OF PERFORMANCE-BASED PLANNING
AND PROGRAMMING
A theoretical model of PBPP is a top-down administered system with unified
goals and targets based on objective system-wide metrics. Such a system can
be adopted only partially in real-world scenarios.
MDOT’s network of 9,700 miles of state trunkline highways and
approximately 4,413 bridges is managed by semi-autonomous regional
offices, transportation service centers, and maintenance garages—each with
unique regional needs and organizational culture. The state transportation
improvement program (STIP) is developed as an amalgam of local and
regional priorities identified in the annual “call for projects.” The final STIP is
ideally reflective of MDOT-set goals, metrics, priorities, and strategies, but
multiple actors influence the way in which MDOT priorities are reflected.
A statewide TAM program is further limited by the scope of MDOT
jurisdiction. MDOT has direct authority over only about eight percent of
Michigan’s total 120,000 or so linear miles of paved roads. The remaining
92% of road mileage is under the jurisdiction of counties and municipalities.
These local authorities have asset management programs ranging from fairly
robust to informal.134
Per federal planning requirements, project selection in metropolitan counties
is directed through the representative MPO, of which there are 13 in
Michigan. Construction is managed through sub-regional transportation
service centers, who often contract projects to county or local agencies, who
in turn often subcontract the actual construction. Routine maintenance of
trunklines is similarly divided; many maintenance services are performed
directly through MDOT maintenance garages, others are contracted to county
or local entities, and both MDOT and local agencies sometimes subcontract
maintenance tasks.
This division of responsibilities is not necessarily a bad thing, and would be
difficult to change in any case. MDOT is divided into regional entities, in part,
to allow for local knowledge and priorities to be incorporated into planning
and programming. However, this will make adoption of statewide PBPP
frameworks difficult. Regional offices and local agencies will necessarily
134 County and local agencies are not required to adopt an asset management plan. Municipal
agencies (though not counties) are allowed increased flexibility of fund usage if they do
develop an approved plan (MDOT and CAR 2013.)

PERFORMANCE-BASED PLANNING AND PROGRAMMING FOR PAVEMENT MANAGEMENT JUNE 2016
MICHIGAN DEPARTMENT OF TRANSPORTATION AND THE CENTER FOR AUTOMOTIVE RESEARCH 43
have to decide how to bound the rationality of M-E frameworks within local
contexts when responding to the annual statewide call for projects.
4.3 LEGISLATIVE OPTIONS FOR MANAGEMENT OF EXPANDED
NATIONAL HIGHWAY SYSTEM
MAP-21 expanded the NHS to include all principle arterials. As a result, the
state of Michigan is now ultimately responsible for the condition of 1,200
miles of pavement (as well as multiple bridges) owned by county or local
agencies. This is about 19% of NHS mileage statewide, and will be factored
into consideration when FHWA determines if Michigan is meeting
performance targets.
Considering that federal transportation funds might be influenced by NHS
performance measurements, Michigan could explore legislative approaches to
encourage local agencies to maintain NHS routes in good condition. For
example, municipalities could be compelled to dedicate a greater percentage
of state transportation funding on NHS routes until performance targets are
attained. Such provisions would be especially important for NHS-route bridge
and culvert conditions.135
4.4 CROWDSOURCING PAVEMENT PERFORMANCE
MEASUREMENT
A statewide transition to M-E pavement performance management principles
imposes challenges for data collection. The only way to improve pavement
performance and related investment decisions is to acquire enough data to
improve mechanistic-empirical pavement life-cycle models. Ideally, all data
types used by the MEPDG would be available for the entire system.
Unfortunately, this is not a realistic expectation, particularly for county and
local networks.
It would be very valuable to obtain a metric that could be consistently
collected for all public roads within the State of Michigan to provide an
objective network-level assessment of pavement condition. Regularly
collecting MEPDG metrics such as IRI and cracking would be cost-
prohibitive—and probably not necessary on low-volume roads.
135 FHWA 2015, pp. 373-377.

SUMMARY AND DISCUSSION
MICHIGAN DEPARTMENT OF TRANSPORTATION AND THE CENTER FOR AUTOMOTIVE RESEARCH 44
MDOT should explore deploying crowdsourcing methods, taking advantage
of smartphones and public volunteers, as an alternative to traditional
pavement data collection methods. The power of crowdsourced data is that
large data sets—collected from multiple sources—negates limitations in
generalizability of a single data source. Aggregated data should provide a
reasonably accurate model of the roadway system in relation to how an
average user experiences the system.136 Further, it is possible that this data
may correlate will to primary pavement performance metrics such as IRI.137
While crowdsourced data cannot provide a direct replacement for any current
metric, such data could be more valuable for a customer-service approach to
TAM than are traditional measures. Essential to TAM is creating the optimum
experience for users/customers of the transportation system with minimum
cost. Current objective measures relating to the ride-quality/serviceability of
pavement, such as IRI, generally create a model of the pavement from which
the ride quality is inferred. Subjective measures, on the other hand, use human
judgment to assess serviceability/ride-quality, but provide little value to a
mechanistic-empirical approach to TAM. Smartphone accelerometry data
could provide the best attributes of both data types; measuring serviceability
in an aggregated, but direct, objective metric.138 For example, crowdsourced
smartphone accelerometry could provide a measure of ‘pseudo-IRI’ for the
entire statewide network that could be correlated with true IRI collected for
the National Highway Performance Program. Crowdsourced pseudo-IRI could
not be used reporting/managing the NHS because NHPP explicitly requires
AASHTO standardized methods of data collection.139 However, pseudo-IRI
would allow MDOT to obtain a comparable metric for the rest of the
statewide network—improving the scope and utility of the Transportation
Asset Management Plan.140
One significant advantage of continuous crowdsourced data collection is the
potential to capture transient variations in pavement condition. Climate and
weather interacts with pavement in multiple ways. Pavements are subject to
136 MDOT and CAR 2013. 137 ibid. See also MDOT and CAR 2013. 138 MDOT and CAR 2013. 139 It is possible that future revisions of the Federal Aid Highway Program could allow for
developing crowdsourced methods to substitute for traditional data collection if such
methods prove useful and accurate. 140 Network-wide pavement condition measurement for all paved roads within the state is
currently performed with the subjective PASER scale. This metric is not amenable to use in
an M-E-based asset management system as will be required for the NHS.

PERFORMANCE-BASED PLANNING AND PROGRAMMING FOR PAVEMENT MANAGEMENT JUNE 2016
MICHIGAN DEPARTMENT OF TRANSPORTATION AND THE CENTER FOR AUTOMOTIVE RESEARCH 45
seasonal and diurnal forces that effect various measurements.141 Collecting
data on a continuous basis will detect these cyclical anomalies and add to
general understandings of pavement life cycles.142 Additionally, continual data
collection will counteract variances in traditional measures (e.g., rutting,
faulting, cracking) that occur when measurements are taken at different times
of year, day, temperature. Data that reflect the seasonal development of acute
distress points could result in increased accuracy in results from mechanistic-
empirically based decision-support software.
A barrier to deploying crowdsource methods is attracting a crowd. While the
technology that would allow for a smartphone app to generate crowdsourced
pseudo-IRI is mature and proven, MDOT would be challenged to recruit
enough users to provide enough data to be significant. One possibility may be
partnering with consumer-available applications that are already popular with
the traveling public. For example, accelerometry data capture could be an
extension of a navigation app like Waze. Drivers would opt-in to enable the
extension, and would then provide road condition data whenever they use
Waze.
4.5 CLOSING REMARKS
The USDOT—as well as state and local transportation agencies—have been
under pressure for several decades to improve the condition of the nation’s
transportation infrastructure. Improving pavement performance first requires
the ability to consistently measure pavement condition. Considering this,
FHWA has long required objective pavement condition/performance metrics
(such as IRI) within the Highway Performance Monitoring System (HPMS).
Consistently tracking such metrics enables transportation asset management
(TAM) programs to link past investment decisions to objective performance
results.
However, FHWA did not explicitly require that states and MPOs link
objective performance metrics to investment strategies through pavement
management systems or broader TAM programs. While many states
141 Simpson et al. 2013. 142 MDOT’s distress index (DI) measurement occasionally finds pavement sections that
spontaneously improve between readings. (e.g., a pavement found to be in fair condition one
year might be found to be in good condition two years later, even though no remediate
maintenance actions have been taken.) (Abu-Lebdeh 2003, p. 8) Assuming that distress data
collection is accurate and consistent, such anomalies could be explained by varying weather
conditions at the specific time of data collection.
SUMMARY AND DISCUSSION
MICHIGAN DEPARTMENT OF TRANSPORTATION AND THE CENTER FOR AUTOMOTIVE RESEARCH 46
developed TAM programs that allow future pavement conditions to be
forecast at a system-wide scale as related to funding amount, many programs
did not utilize mechanistic-empirical (ME) relationships to understand why
pavements may prematurely fail or how investment strategies could be
improved.
Provisions introduced within MAP-21 and elaborated by the FAST Act will
soon require that federal-aid highway funding administered through the new
National Highway Performance Program (NHPP) will utilize objective
performance-based planning and programming (PBPP). States and MPOs will
be required to develop a Transportation Asset Management Plan (TAMP) with
explicit targets related to objective metrics such as IRI, percent cracking,
rutting, and faulting. FHWA will require the TAMP to cover only pavements
and bridges on the National Highway System (NHS). However, FHWA
encourages transportation agencies to include a variety of transportation assets
within the TAMP, including those other than pavements and outside the NHS.
State DOTs and MPOs would benefit from leveraging the new PBPP
requirements to broadly re-configure existing transportation asset
management programs. Many existing TAM programs are based on broad
metrics (e.g., a composite ‘distress index’) or even subjective ratings (e.g.,
PASER). Use of such metrics does not allow for mechanical-empirical
relationships to be observed that would allow an agency to take advantage of
the AASHTO Mechanistic-Empirical Pavement Design Guide (MEPDG) or
better forecast pavement performance at the project level. As states and MPOs
develop PBPP frameworks and TAMP documents per federal requirements,
these frameworks should be embraced across entire agencies. Alternate
performance metrics and parallel TAM processes should be discontinued.
New technologies such as wireless sensors and connected vehicle data provide
exciting opportunities for agencies to improve TAM processes. However,
these technologies will be of greatest benefit within a comprehensive PBPP
framework and referenced within an M-E model of pavement life-cycle
performance. Transportation agencies should concentrate on reconfiguring
legacy TAM frameworks before attempting to utilize new data sources.
The development of state and MPO TAMPs, and related PBPP frameworks,
will not likely be a technical challenge. FHWA, AASHTO, and research
institutions have extensively studied and detailed how to implement such
programs, and provide extensive resources for state and local agencies. The
primarily challenges will likely be the reticence within agencies to transition

PERFORMANCE-BASED PLANNING AND PROGRAMMING FOR PAVEMENT MANAGEMENT JUNE 2016
MICHIGAN DEPARTMENT OF TRANSPORTATION AND THE CENTER FOR AUTOMOTIVE RESEARCH 47
away from legacy frameworks and practices that have become embedded in
the culture and knowledge-base of an agency.
State DOTs and MPOs should recognize the potential benefits available by
fully embracing Performance-based Planning and Programming frameworks,
including a comprehensive, risk-based Transportation Asset Management Plan
and Mechanical-Empirical pavement performance management. FHWA
resources are available to assist in adopting such best-practices, and
transportation agencies should implement such changes with enthusiasm.
Further information regarding performance-based TAM and pavement
performance management is available from the FHWA Asset Management
Program Office at http://www.fhwa.dot.gov/asset/, and the AASHTO TAM
Portal at http://www.tam-portal.com/.

SUMMARY AND DISCUSSION
MICHIGAN DEPARTMENT OF TRANSPORTATION AND THE CENTER FOR AUTOMOTIVE RESEARCH 48

PERFORMANCE-BASED PLANNING AND PROGRAMMING FOR PAVEMENT MANAGEMENT JUNE 2016
MICHIGAN DEPARTMENT OF TRANSPORTATION AND THE CENTER FOR AUTOMOTIVE RESEARCH 49
REFERENCES
This list includes sources referenced in the text that are considered central to understanding of
material. Minor references are included in footnotes only and are not listed in this section unless.
AASHTO. Mechanistic-Empirical Pavement Design Guide (MEPDG). 2008.
Abu-Lebdeh, Ghassan; Rick Lyles; Gilbert Baladi; Kamran Ahmed. “Development of
Alternative Pavement Distress Models.” Michigan State University, Dept. of Civil and
Environmental Engineering. November 2003.
Belzowski, Bruce. “Integrated Mobile Observations 2.0: Final Project Report.” August 1,
2014.
Bridgelall, Raj. “Connected Vehicle Approach for Pavement Roughness Evaluation.”
Journal of Infrastructure Systems, Volume 20, Issue 1. American Society of Civil
Engineers (ASCE). 2014.
Bridgelall, Raj. “Precision Bounds of Pavement Distress Localization with Connected
Vehicle Sensors.” Journal of Infrastructure Systems, Volume 21, Issue 3. American
Society of Civil Engineers (ASCE). 2015.
Bridgelall, Raj; Jerry Deleiden. “Assessing Pavement roughness in Urban Environments.”
Presentation to 27th Annual Road Profile Users’ Group Meeting, Raleigh, North
Carolina. November 2-5, 2015. http://www.rpug.org/download/2015/8-3-
Jerry%20Daleiden.pdf.
Buch, Neeraj; Karim Chatti; Syed W. Haider; Gilbert Baladi; Wouter Brink; Iman Harsini.
“Preparation for Implementation of the Mechanistic-Empirical Pavement Design Guide
in Michigan. Part 2: Evaluation of Rehabilitation Fixes.” Michigan Department of
Transportation, Michigan State University. August 2013.
Darwish, Ihab; Matthe Garratt; Matthew Longfield, Jr.; Zaid Hanna; Melissa Donoso.
“Infrastructure Monitoring Data Management.” Alfred Benesch & Company, MDOT.
Final Report. July 7, 2015.
Dennis, Eric Paul; Richard Wallace; Brian Reed. “Crowdsourced Transportation Systems
Data.” Michigan Department of Transportation and Center for Automotive Research.
February 2015.
Ermoshina, Ksenia. “Democracy as pothole repair: Civic applications and cyber-
empowerment in Russia.” Cyberpsychology: Journal of Psychosocial Research on
Cyberspace, 8(3), article 4. doi: 10.5817/CP2014-3-4. 2014.
REFERENCES AND APPENDICES
MICHIGAN DEPARTMENT OF TRANSPORTATION AND THE CENTER FOR AUTOMOTIVE RESEARCH 50
FHWA (Federal Highway Administration) of the USDOT. “Asset Management
Overview.” FHWA Office of Asset Management. FHWA-IF-08-008. December 2007.
FHWA (Federal Highway Administration). 23 CFR Part 90, National Performance
Management Measures; Assessing Pavement Condition for the National Highway
Performance Program and Bridge Condition for the National Highway Performance
Program; Proposed Rule. Federal Register, Vol. 80, No. 2. January 5, 2015.
Forslӧf, Lars; Hans Jones. “Roadroid: Continuous Road Monitoring with Smartphones.”
Journal of Civil Engineering and Architecture. Vol. 9. pp. 485-496. 2015.
Haider, Syed Waqar; Neeraj Buch; Wouter Brink; Karim Chatti; Gilbert Baladi.
“Preparation for Implementation of the Mechanistic-Empirical Pavement Design Guide
in Michigan. Part 3: Local Calibration and Validation of Pavement-ME Performance
Models.” Michigan Department of Transportation, Michigan State University.
November 2014.
Hong, Qiang; Richard Wallace; Gregory Krueger. “Connected vs. Automated Vehicles as
Generators of Useful Data.” MDOT and CAR. September 30, 2014.
Hong, Qiang; Richard Wallace; Theresa M. Ahlborn; Colin N. Brooks; Eric Paul Dennis;
Mike Forster. “Economic Evaluation of Commercial Remote Sensors for Bridge Health
Monitoring.” TRB Paper 13-3978. October 31, 2012.
Islam, Md Shahidul; William G. Buttlar. “Effect of Pavement Roughness on User Costs.”
2012 Annual Meeting of the Transportation Research Board. 2012.
Islam, Shahidula; William G. Buttlar; Roberto G. Aldunate; William R. Vavric.
“Measurement of Pavement Roughness Using an Android-Based Smartphone
Application.” 93rd Annual Meeting of the Transportation Research Board, Compendium
of Papers. 2013.
Kutay, M. Emin; Anas Jamrah. “Preparation for Implementation of the Mechanistic-
Empirical Pavement Design Guide in Michigan. Part 1: HMA Mixture
Characterization.” Michigan Department of Transportation, Michigan State University.
March 2013.
Lajnef, Nizar; Karim Chatti; Shantanu Chakrabartty, Mohamed Rhimi; Pikul Sarkar.
“Smart Pavement Monitoring System.” Michigan State University, FHWA. May 2013.
MDOT (Michigan Department of Transportation) and CAR (Center for Automotive
Research). “Pavement Condition Monitoring with Connected Vehicle Data.” August
2013.

PERFORMANCE-BASED PLANNING AND PROGRAMMING FOR PAVEMENT MANAGEMENT JUNE 2016
MICHIGAN DEPARTMENT OF TRANSPORTATION AND THE CENTER FOR AUTOMOTIVE RESEARCH 51
MDOT (Michigan Department of Transportation) Construction Field Services Division.
Michigan DOT User Guide For Mechanistic-Empirical Pavement Design. Interim
edition. March 2015a.
MDOT (Michigan Department of Transportation). Project Scoping Manual. August 2015b.
Michigan Office of the Auditor General. “Audit Report: Performance Audit of the
Measurement of State Highway Pavement Conditions.” (Michigan Department of
Transportation.) Report No. 591-0300-11. March 2012.
O’Leary, Daniel E. “Exploiting Big Data from Mobile Device Sensor-Based Apps:
Challenges and Benefits.” MIS Quarterly Executive, 12:4. Kelley School of Business,
University of Minnesota. December 2013.
Oliveira, Henrique. “Automatic Road Crack Detection and Characterization.” IEEE
Transactions on Intelligent Transportation Systems. Vol. 14, No. 1, March 2013.
Oliveira, Henrique; Paulo Lobato Correia. “Automatic Road Crack Detection and
Characterization.” IEEE Transactions on Intelligent Transportation Systems, Vol. 14,
No. 1. March 2013.
Rhimi, Mohamed; Nichilas A. Brake; Nizar Lajnef; Karim Chatti. “Interpretation of
Concrete Damage Using a Self-Powered Sensor.” 91st Annual Meeting of the
Transportation Research Board. 2012.
Simpson, Amy; Gonzalo Rada; Beth Visintine; Jonathan Groeger; Joseph Guerre.
“Improving FHWA’s Ability to Access Highway Infrastructure Health: Development of
Next Generation Pavement Performance Measures.” AMEC Environmental &
Infrastructure, Inc. Cambridge Systematics, Inc. FHWA. May 2013.
Tan, Sui G.; DingXin Cheng. “A Case Study: Using a Performance-based Approach to
Integrate Pavement Preservation into Pavement Management System.” 2012 Annual
Meeting of the Transportation Research Board. Submitted August 2011.
Titus-Glover, L., Fang, C., Alam, M., O’Toole, K., & Michael I, D. FHWA Office of Asset
Management. Pavement Health Track (PHT) RSL Forecasting Models. 2010.
TRB (Transportation Research Board). Special Report 267: “Regulation of Weights,
Lengths, and Widths of Commercial Motor Vehicles.” Washington, D.C. 2002.
TRB (Transportation Research Board, National Research Council). Guide for Mechanistic-
Empirical Design of New and Rehabilitated Pavement Structures. Washington, D.C.
2004.
TRB (Transportation Research Board). Quality Management of Pavement Condition Data
Collection: A Synthesis of Highway Practice. NCHRP Synthesis 401. 2009.
REFERENCES AND APPENDICES
MICHIGAN DEPARTMENT OF TRANSPORTATION AND THE CENTER FOR AUTOMOTIVE RESEARCH 52
Wright, Dean; G. Crabb; A Gleeson. “Use of Traffic Speed Lidar in Road Asset
Assessment.” Transportation Research Laboratory (TRL). Report PPR694. 2014.
Grant, Michael; Janet D’Ignazio; Alexander Bond; Alanna McKeeman. “Performance-
Based Planning and Programming Guidebook.” ICF International, Inc. FHWA (Federal
Highway Administration). September 2013.
SUPPLEMENTARY BIBLIOGRAPHY This list includes works that may expand understanding of key topics of this report but are not
directly referenced in the text.
Bridgelall, Raj. “Inertial Sensor Sample Rate Selection for Ride Quality Measures.” Journal
of Infrastructure Systems, Volume 21, Issue 2. American Society of Civil Engineers
(ASCE). 2015.
Bridgelall, Raj. “Precision Bounds of Pavement Deterioration Forecasts from Connected
Vehicles.” Journal of Infrastructure Systems, Volume 21, Issue 1. American Society of
Civil Engineers (ASCE). 2015.
Chen, Kongyang; Mingming Lu; Guang Tan; Jie Wu. “CRSM: Crowdsourcing Based Road
Surface Monitoring.” IEEE DOI 10.1109/HPCC.and.EUC.2013.308. 2013.
Dye Management Group, Inc. “Monitoring Highway Assets with Remote Technology.”
Michigan Department of Transportation. July 2014.
Eriksson, Jokob; Lewis Girod; Bret Hull; Ryan Newton; Samuel Madden; Hari Balakrishnan.
“The Pothole Patrol: Using a Mobile Sensor Network for Road Surface Monitoring” MIT
Computer Science and Artificial Intelligence Laboratory. MobiSys ’08, Breckenridge CO,
June 17-20, 2008.
Mednis, Artis; Girts Strazdins; Reinholds Zviedris; Georgijs Kanonirs; Leo Selavo. “Real
Time Pothole Detection Using Android Smartphones with Accelerometers.” University of
Latvia. IEEE DOI: 10.1109/DCOSS.2011.5982206. 2011.
Múčka, Peter. “Current approaches to quantify the longitudinal road roughness.”
International Journal of Pavement Engineering. 2015.
O’Toole, Kevin; Maks Alam; Leslie Titus-Glover. “Pavement Health Track (PHT) Analysis
Tool, Summary Report.” Battelle. FHWA. September 2013.
Robinson, Ralph. “Slippery Road Detection and Evaluation, Project Final Report.” University
of Michigan Transportation Research Institute (UMTRI). Michigan Department of
Transportation. 2012.

PERFORMANCE-BASED PLANNING AND PROGRAMMING FOR PAVEMENT MANAGEMENT JUNE 2016
MICHIGAN DEPARTMENT OF TRANSPORTATION AND THE CENTER FOR AUTOMOTIVE RESEARCH 53
APPENDIX A: LIST OF ABBREVIATIONS
AADTT Average Annual Daily Truck Traffic
AASHTO American Association of State Highway and Transportation Officials
ADA Americans with Disabilities Act
ADT Average Daily Traffic
ADTT Average Daily Truck Traffic
ASTM Formerly American Society for Testing and Materials. Now known as ASTM
International without direct reference to former abbreviation.
CAR Center for Automotive Research
CRCP Continuously Reinforced Concrete Pavement
DI Distress Index
DOT Department of Transportation
DTMB [Michigan] Department of Technology, Management, and Budget
FHWA Federal Highway Administration
ft Feet
GIS Geographical Information Systems
HERE Not an acronym. A digital mapping firm.
HMA Hot Mix Asphalt
HPMS Highway Performance Monitoring System
in Inches
IRI International Roughness Index
ITS Intelligent Transportation Systems
LTE Load Transfer Efficiency
LTPP Long Term Pavement Performance [Program]
MAP-21 Moving Ahead for Progress in the 21st Century
MDOT Michigan Department of Transportation
M-E Mechanistic-Empirical
MEPDG Mechanistic-Empirical Pavement Design Guide
mi Miles
REFERENCES AND APPENDICES
MICHIGAN DEPARTMENT OF TRANSPORTATION AND THE CENTER FOR AUTOMOTIVE RESEARCH 54
MPO Metropolitan Planning Organization
MSU Michigan State University
NBI National Bridge Inventory
NCHRP National Cooperative Highway Research Program
NDSU North Dakota State University
NHPP National Highway Performance Program
NHS National Highway System
PASER Pavement Surface Evaluation and Rating
PCC Portland Cement Concrete
PCI Pavement Condition Index
PMS Pavement Management System
PSR Pavement Surface Rating
R2 Coefficient of Determination (statistical function)
RIF Road Impact Factor
RSL Remaining Service Life
STIP State Transportation Improvement Program
TAM Transportation Asset Management
TAMP Transportation Asset Management Plan
TAMS Transportation Asset Management System
TRB Transportation Research Board
TSC Transportation Service Center
TTC Truck Traffic Classification
TWIT Time-wavelength-intensity-transform
UAV Unmanned Aerial Vehicle
UK United Kingdom
US United States
VFA Voids Filled with Asphalt
VMA Voids in Mineral Aggregate
WIM Weigh-in-Motion

PERFORMANCE-BASED PLANNING AND PROGRAMMING FOR PAVEMENT MANAGEMENT JUNE 2016
MICHIGAN DEPARTMENT OF TRANSPORTATION AND THE CENTER FOR AUTOMOTIVE RESEARCH 55


![Multiobjective optimization for pavement maintenance and rehabilitation programming ... · 2019. 7. 9. · Integer programming [4], optimal control theory [5], non-linear programming](https://static.fdocuments.us/doc/165x107/60b63cc728707f56fa4ed021/multiobjective-optimization-for-pavement-maintenance-and-rehabilitation-programming.jpg)