PERFORMANCE BASED PAYMENTS- BELIZE EXPERIENCE...
23
PERFORMANCE BASED PAYMENTS- BELIZE EXPERIENCE WITH CNCD’S Ramon Figueroa, M.D, M.P.H Director of Planning and Policy Analysis Unit Ministry of Health
Transcript of PERFORMANCE BASED PAYMENTS- BELIZE EXPERIENCE...

PERFORMANCE BASED PAYMENTS-
BELIZE EXPERIENCE WITH CNCD’S
Ramon Figueroa, M.D, M.P.H
Director of Planning and Policy Analysis Unit
Ministry of Health

PRESENTATION OUTLINE
• CONTEXT/BACKGROUND
• TIMELINE-CHANGES
• RESULTS
• DISCUSSION

BACKGROUND
• HEALTH SECTOR REFORM PROCESS: 1995-2001
• RE-DEFINING ORGANIZATION OF HEALTH SYSTEM:
INTRODUCTION OF NHI.
• PILOT PROJECT: 2001
• CONTRACTING HEALTH PROVIDERS: PCP’S
• PRIORITY HEALTH PROBLEMS:
– DIABETES
– HYPERTENSION
– ASTHMA

FRAMEWORK FOR P4P
1. Create ability to drive specific programs.
2. Improve quality and efficiency of care by ensuring
adherence to protocols and guidelines.
3. Promote team approach
4. Improve internal customer satisfaction
5. Improve external customer satisfaction: services with a
human face!
-Monthly Incentive Scheme:70/30
-Performance Bonus (5-10%)

Compliance, Enforcement, Penalty Cycles Incorporated into NHI Contracts
Compliance, Enforcement, Penalty/Reward Cycles
Facility Evaluation Contract monitoring Financial Twice/year
Patient Satisfaction Key Performance
Indicators
Financial Once/year
Clinical Audits (clinical
protocol compliance)
Key Performance
Indicators
Financial Yearly
Medical Record Audit Key Performance
Indicators
Financial Yearly
Medical Record Monitoring Informal
Recommendations
None Quarterly
NHI (Productivity
Indicators)
Contract terms Financial Monthly
NHI Database (Data entry
errors; Inconsistencies)
Contract terms Financial Monthly
Monthly Reports Contract Terms Financial Monthly
Pharmacy Audits/lab Informal
Recommendations
None Once a year
5

MONITORING AND EVALUATION- YEARLY MEASUREMENTS
Training, regular updates of protocols, involvement of Primary Care Providers
No Protocol Audits done
Implementation-contracting providers
Implementation Roadmap- P4P
2001 2002 2003 2004 2005 2006 2007 Today
6/11/14
Block Approach
Extension to S.S
1/06/2006
Kick Off
8/08/2001
Medical Records Audits
2008 2010 2011 2012
Standardized Medical recordChronic Disease Forms
Pilot evaluation
Monthly Incentive Scheme

Key Performance Indicators- InitialInitial Indicator Target Weight
Structure Indicators:
Compliance with equipment list and functionality 100% Compliance 10%
Complaint Mechanism: Yes / No 10%
a. Identify a readily accessible area to receive suggestions and complaints (suggestion Box).
b. Identify person who will receive and resolve complaints
Continuous Education Indicators: Yes/No 10%
GPs and Nurses trained in:
Trained in reporting and use of ICD- 10 Coding
Reporting:a. Monthly reports submitted to NHI on time in 95% of cases.b. Error rate below 10%c. Report include Members activity as Non Members (BHIS)
5%5%5%
Prevention Programs:
PAP smear target group above 60%
First trimester visit at 60% pregnant women .
Yes/No 10%
10%
Delivery of School education programs in: Yes/No 15%
- HIV/AIDS and STIS prevention.
-Nutrition
- Seatbelt usage for prevention of accidents
Development of Health Status Report on Registered Population based on established guidelines:
Yes/No 20%
Demographic Profile
-Status of Screening Programs
Epidemiological Status Profile

EVOLUTION OF KPI-2009PRIMARY CARE PROVIDERS Target Bonus Means of Verification
At least 90 percent of the GPs and nurses have received training
on protocols in the last year (Chronic Disease Management
Protocols)
90%
5% Report from PCP’s on training
with list of participants
signatures
Percentage of clinical records with incorporated forms and
complete information80%
15% Audits by NHI
System for suggestions/complaints in place Yes5% Facility Evaluation by NHI (direct
observation)
Percentage of complaints resolved within 2 weeks 80%5% Facility Evaluation by NHI (direct
observation)
At least 85 percent of PCP patients expressed full satisfaction
with regard to services received from the PCP85%
15% Patient Satisfaction Survey by
NHI
Percentage of women aged 21-64 who had a Pap smear test in
the last two years50%
10% Reports from PCP’s and data
analysis by NHI
Percentage of pregnant women with 1 prenatal care visits during
the first trimester50%
10% Reports from PCP’s and data
analysis by NHI
Percentage of high-risk pregnancy cases with at least 7 prenatal
care visits during their pregnancy period80%
10% Reports from PCP’s and data
analysis by NHI
Percentage of men ages 40-64 who had PSA test a during the
last 2 years50%
10% Reports from PCP’s and data
analysis by NHI
Compliance with Medical Protocols implementation (Diabetes,
Hypertension and Asthma)75%
15% Protocol Audits by NHI
100%

Evolution of KPI’s-2013
PRIMARY CARE PROVIDERS Target Score MRHC BMA BFLA BHP
No. of pregnant women with 1 prenatal
care visits during the first trimester/Total
number of pregnant women (Jan-Dec
2013)
60%20%
118/166
72%
147/171
85.9%
150/278
54%
168/241
69.7%
No. of high-risk pregnancy cases with at
least 7 prenatal care visits during their
pregnancy period/Total No. of High Risk
Pregnancies
90%20%
53/56
95%
77/79
96.2%
147/158
93%
21/23
91.3%
No. of Community Outreach Activities for
the Jan-Dec 2013 TWELVE100%
20%
16/12
100%
25/12
100%
18/12
100%
13/12
100%
No. of CMEs and Staff Development
Activities which should include yearly
revision of NCD protocols TWELVE
100% 20%
17/12
100%
16/12
100%
22/12
100%
12/12
100%
At least 85 percent of PCP patients
expressed full satisfaction with regard to
services received from the PCP
85% 20% 90% 91% 87% 89%
TotalPass 100% 100% 80% 100%

PRIMARY CARE PROVIDERS TargetBonus Means of Verification
Percentage of clinical records with incorporated standard medical record forms and complete information 85%20%
Medical Record Audits by
NHI
Compliance rate with Medical Protocols for Diabetes and Hypertension 80%20%
Protocol Audits by NHI
At least 80 percent of interviewed NHI registered members expressed full satisfaction with regard to
services received from their respective PCP.80%
20%
Patient Satisfaction
Survey by NHI
Percentage of pregnant women with 1 prenatal care received during the first trimester (less than 12 weeks
gestation).50%
10%
Reports from PCP’s and
data analysis by NHI
Percentage of high risk pregnancies delivered with at least 7 prenatal checks. 80%10%
Reports from PCP’s and
data analysis by NHI
Percent of children less than 3 years of age with Nutritional assessment at each encounter
numerator: Number of children less than 3 years of age seen at health facility or mobile clinic and have at
least weight measured and plotted on the growth chart in a given period
denominator: Total number of children less than 3 years of age seen at the health facility or mobile clinic
100% of
children
reaching the
health
system.
10%
Reports from PCPs
Percent of children with unsatisfactory growth [weight/age] who received Incaparina
numerator: Number of children less than 3 years of age with unsatisfactory growth [horizontal or
downward trend within normal values; low weight for age >-2SD] who received Incaparina at least once
within the last 30 days in a given period
denominator: total number of children less than 3 years of age diagnosed with unsatisfactory growth in a
given period
100% of
children
identified at
risk or
malnourished
10%
Reports from PCPs
KPI Pass 80%
Evolution of KPI’s-2014

Incentive payments (70/30)
Performance Checklist for monthly evaluation (simulation)
Item Standard Payment max Dr 1 Dr2 Dr3 Adm
from Encounter Form: monthly data
Efficiency Indicators: (70%) #REF!
1. Productivity per GP team/day 28-36 pts/shift #REF! $529 $529 $529
2. Rational drug usage (items/encounter) <=2 $1,985 $662 $529 $529
3. Rational imaging usage(items/encounter) <=1 $1,985 $662 $529 $529
4. Rational Laboratory
usage(items/encounter) <=4 $1,985 $662 $529 $529
Quality Indicators:(20%) #REF!
from Surveys/Inspections (bi-annual):
5. Patient satisfaction: survey >=80% #REF! $756
6. Medical Records Compliance >=99% $756 $756
7. Medical Audits 70% $756 $756
Administrative Indicators:(10%) #REF!
8. Unreported Encounters/Activities
<0.5% Margin of
error #REF! $567
9. Data entry errors
<1.0% Margin of
error $567 $567
MONTHLY INCENTIVE SCHEME

Results- Compliance with Protocols
57%
40%
62%
57%
68%
72%
32%
57%
77%
56%
43%
54%
74%
80%
0%
10%
20%
30%
40%
50%
60%
70%
80%
90%
2001 2004 2005 2006 2008 2010 2012
DIABETES AUDIT RESULTS BY YEAR DONE
BMA

Results-Compliance with Protocols
75%
59%
37%
54%
61%
68%
100%
75%
32%
77%
49%
59%
74%
100%
0%
20%
40%
60%
80%
100%
120%
2001 2004 2005 2006 2008 2010 2012
Hu
nd
red
s
HYPERTENSION AUDITS RESULTS BY YEAR DONE
IHC MR

Results
50%
81%
95%
80%
52%
70%
95% 95%
47%
54%
100% 100%
0%
20%
40%
60%
80%
100%
120%
2004 2008 2010 2012
Hu
nd
red
s
MEDICAL RECORDS AUDIT RESULTS BY YEAR DONE
BFLA BMA IHC MRHC

Cancer Screening Programs-2010 (6m)KPI BMA BFLA BHP Matron Roberts
Percentage of women aged
19-64 who had a Pap smear
test in the last two years
(50%)
1408/4059
35%
667/3560
19%
641/4010
16%
691/3677
19%
Jan.-Dec. 2009 32% 18% 17% 16%
Percentage of pregnant
women with 1 prenatal
care visits during the first
trimester (50%)
52/120
43%
67/168
40%
85/147
58%
61/101
60%
Jan.-Dec. 2009 30% 31% 56% 59%
Percentage of high-risk
pregnancy cases with at
least 7 prenatal care visits
during their pregnancy
period (80%)
16/29
55%
38/47
81%
24/24
100%
16/18
89%
Jan.-Dec. 2009 80% 95% 83% 83%
Percentage of men ages
over 50yrs of age who had
PSA test a during the last 2
years (50%)
355/814
43.6%
165/426
39%
311/649
48%
269/781
34%
Jan.-Dec. 2009 50% 34% 46% 35%

PRIMARY CARE PROVIDERS Target
Bonus Means of
Verification
Score
Coverage for biological (as per MOH schedule of vaccination); third dose coverage. BCG, 3rd DPT/HepB; 3rd OPV, 1st MMR.
95%
10%
(98.5%)
Reports from PCP’s
and data analysis by
NHI/MCH
10%
System for suggestions/complaints in place Yes
5%
Facility Evaluation by
NHI (direct
observation)
5%
At least 90 percent of PCP patients expressed full satisfaction with regard to services received from the PCP
90% 15%
(65%)
Patient Satisfaction
Survey by NHI
0%
Percentage of women aged 19-64 who had a Pap smear test in the last two years
50%
10%
2097/4185
(50%)
Reports from PCP’s
and data analysis by
NHI
10%
Percentage of pregnant women with 1 prenatal care visits during the first trimester
50%
10%
129/218
(59%)
Reports from PCP’s
and data analysis by
NHI
10%
Percentage of high-risk pregnancy cases with at least 7 prenatal care visits during their pregnancy period
80%
10%
71/81
(88%)
Reports from PCP’s
and data analysis by
NHI
10%
Percentage of men ages over 50yrs of age who had PSA test a during the last 2 years
50%
10%
509/604
(84%)
Reports from PCP’s
and data analysis by
NHI
10%
KPI PASS
80%
BMA PCP-2011
PRIMARY CARE PROVIDERS Target
Bonus Means of
Verification
Score
Coverage for biological (as per MOH schedule of vaccination); third dose coverage. BCG, 3rd DPT/HepB; 3rd OPV, 1st MMR.
95%
10%
(97%)
Reports from PCP’s
and data analysis by
NHI/MCH
10%
System for suggestions/complaints in place Yes
5% Facility Evaluation by
NHI (direct
observation)
5%
At least 90 percent of PCP patients expressed full satisfaction with regard to services received from the PCP
90% 15%
(57%)
Patient Satisfaction
Survey by NHI
0%
Percentage of women aged 19-64 who had a Pap smear test in the last two years
50%
10%
2175/3852
(57%)
Reports from PCP’s
and data analysis by
NHI
10%
Percentage of pregnant women with 1 prenatal care visits during the first trimester
50%
10%
149/217
69%
Reports from PCP’s
and data analysis by
NHI
10%
Percentage of high-risk pregnancy cases with at least 7 prenatal care visits during their pregnancy period
80%
10%
51/56
91%
Reports from PCP’s
and data analysis by
NHI
10%
Percentage of men ages over 50yrs of age who had PSA test a during the last 2 years
50%
10%
344/611
56%
Reports from PCP’s
and data analysis by
NHI
10%
KPI PASS
80%
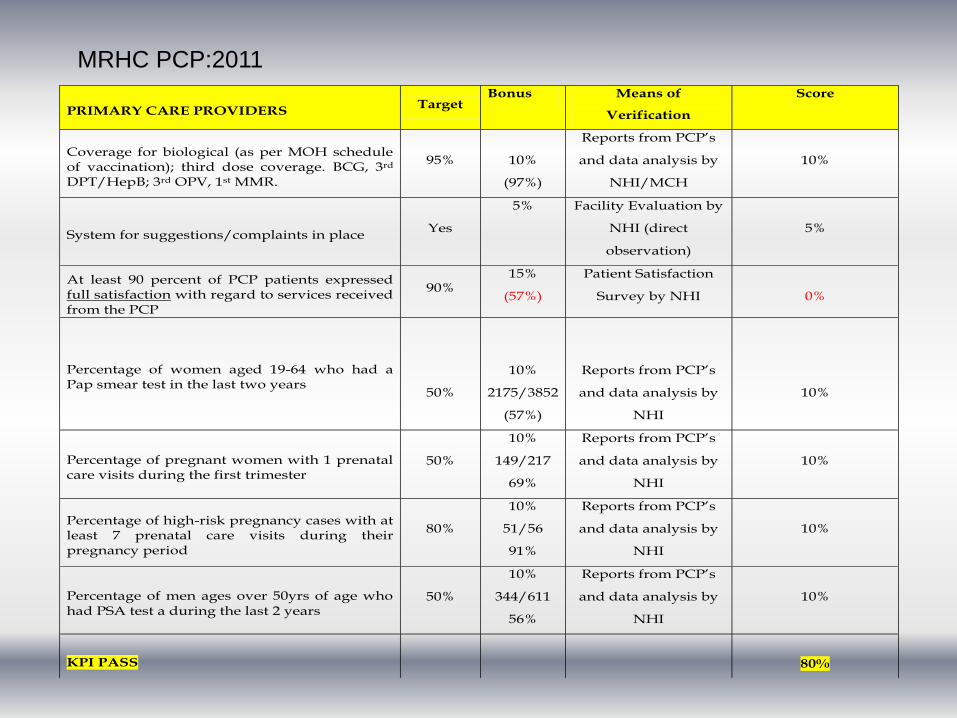
MRHC PCP:2011

PRIMARY CARE PROVIDERS Target
Bonus Means of
Verification
Score
Coverage for biological (as per MOH schedule of vaccination); third dose coverage. BCG, 3rd DPT/HepB; 3rd OPV, 1st MMR.
95%
10%
94%
Reports from PCP’s
and data analysis by
NHI/MCH
0%
System for suggestions/complaints in place Yes
5% Facility Evaluation by
NHI (direct
observation)
5%
At least 90 percent of PCP patients expressed full satisfaction with regard to services received from the PCP
90%
15%
(54%)
Patient Satisfaction
Survey by NHI
0%
Percentage of women aged 19-64 who had a Pap smear test in the last two years
50%
10%
1238/4076
(30%)
Reports from PCP’s
and data analysis by
NHI
0%
Percentage of pregnant women with 1 prenatal care visits during the first trimester
50%
10%
170/262
(65%)
Reports from PCP’s
and data analysis by
NHI
10%
Percentage of high-risk pregnancy cases with at least 7 prenatal care visits during their pregnancy period
80%
10%
50/70
(71%)
Reports from PCP’s
and data analysis by
NHI
0%
Percentage of men ages over 50yrs of age who had PSA test a during the last 2 years
50%
10%
561/640
(87.6%)
Reports from PCP’s
and data analysis by
NHI
10%
KPI
37%
BHP PCP:2011

19
Organization of medical records
BUILDING BLOCK APPROACH

BUILDING BLOCK APPROACH

BELIZE NCD PASSPORT
PILOT

SUMMARY
Lessons Learned STANDARDIZATION OF CARE IS IMPORTANT BUT PROVIDING
SUPPORTING SERVICES NECESSARY.
TRAINING IS IMPORTANT BUT NOT ENOUGH
TURNOVER OF MEDICAL STAFF (NEED ORIENTATION
PROGRAM)
MONITORING AND EVALUATION IS KEY TO SUCCESS
INVOLVEMENT OF STAKEHOLDERS IN SEEKING
IMPROVEMENTS IS ESSENTIAL.
FINANCIAL INCENTIVES PROVIDES THE DRIVING FORCE FOR
IMPROVEMENT- challenge with Public Sector
SIGNIFICANT IMPACT CAN ONLY BE ACHIEVED WHEN
COMMUNITY AND SERVICES WORK TOGETHER.
NCD PASSPORT: NEED TO BE SIMPLIFIED AND MADE PEOPLE
FRIENDLY!

THANK YOU!
GRACIAS!
MERCI!
Dank u!