DB Tools for Oracle User's Guide - SoftTree Technologies, Inc
Upload
truongkietCategory
view
221download
2
Copyright © SoftTree Technologies, Inc. 2005-2006
All rights reserved
DB Audit Expert™ 3.1
Performance Auditing Add-on Version 1.1 for Microsoft SQL Server 2000 & 2005
Supported database systems: Microsoft SQL Server 2000 Microsoft SQL Server 2005


Contents
-3-
Contents
About This Guide........................................................................................................................... 5 Intended Audience................................................................................................................... 5 Conventions Used in This Document ...................................................................................... 5 Abbreviations and Product Reference Terms.......................................................................... 6 Trademarks.............................................................................................................................. 6
CHAPTER 1, Overview of Performance Auditing Add-on ......................................................... 7 When to Use the Performance Auditing Add-on...................................................................... 7 Requirement ............................................................................................................................ 7 How It Works............................................................................................................................ 8 Guidelines ................................................................................................................................ 8
CHAPTER 2, Installation and Configuration ............................................................................... 9 System Audit Trail Installation and Management .................................................................... 9 Installing SQL Server Performance Auditing Add-on .............................................................. 9 Configuring System Audit Options......................................................................................... 10 Disabling Performance Auditing Events ................................................................................ 11 Disabling System Audit.......................................................................................................... 12
CHAPTER 3, Reports................................................................................................................... 13 Overview................................................................................................................................ 13 20 Most Frequent Top-Level SQL Queries............................................................................ 14 20 Most Frequent Stored Procedures ................................................................................... 15 All Top-Level SQL Queries .................................................................................................... 16 Average Execution Time by Stored Procedure ..................................................................... 17 Average Execution Time by SQL Query................................................................................ 17 SQL Queries Whose Execution Time Has Changed Over 20%............................................ 18 Stored Procedures Whose Execution Time Has Changed Over 20% .................................. 19 Top-Level SQL Query Execution Time Trends...................................................................... 19 Stored Procedures Execution Time Trends........................................................................... 20 Stored Procedures Cache Hits and Misses (Details) ............................................................ 21 Stored Procedures Cache Hits and Misses (Summary) ........................................................ 22 Long Running SQL Queries................................................................................................... 22 CPU Utilization by Application ............................................................................................... 23 CPU Utilization by Login ........................................................................................................ 24 SQL Agent Jobs CPU Utilization ........................................................................................... 24 CPU Utilization Bottlenecks and Timing ................................................................................ 25 CPU Utilization Trends .......................................................................................................... 26
Contents
-4-
Hourly Average CPU Utilization............................................................................................. 26 Daily Average CPU Utilization ............................................................................................... 27 I/O Utilization by Application .................................................................................................. 27 I/O Utilization by Login........................................................................................................... 28 I/O Utilization Trends ............................................................................................................. 28 Deadlocks .............................................................................................................................. 29 Lock Timeouts........................................................................................................................ 29 Active Sessions Trends ......................................................................................................... 30 Applications Running in SQL Server ..................................................................................... 31 Users Logging in to SQL Server ............................................................................................ 32 Cumulative SQL Server Load................................................................................................ 32 Data Output Trends ............................................................................................................... 34 Free/Used Data Space Usage Trends .................................................................................. 34 Free/Used Log Space Usage Trends .................................................................................... 35 Data Space Allocation Trends - Comparison by Database ................................................... 35 Log Space Allocation Trends - Comparison by Database..................................................... 36 Data and Log Space Details .................................................................................................. 36 Row Count Trends by Database............................................................................................ 37 Top 20 Fastest Growing Tables by Space ............................................................................ 38 Top 20 Fastest Growing Tables by Row Count..................................................................... 38 Tables Experiencing Full-Table Scans .................................................................................. 39 Backup Duration Trends ........................................................................................................ 40 Latest Backup Timing and Overlap ....................................................................................... 40 Overlapping SQL Agent Jobs ................................................................................................ 41 Database Errors and Exceptions........................................................................................... 42
APPENDIX A, Technical Support ............................................................................................... 44 APPENDIX B, Hardware and Software Requirements ............................................................. 46 APPENDIX C, Licensing.............................................................................................................. 47

About this guide
-5-
About This Guide
This manual describes the features of the DB Audit Performance Add-on for Microsoft SQL Server, including how to use the install and configure the add-on, use graphical user interface and performance audit and analysis reports.
Intended Audience
This document is for Database Administrators, Database Managers, System Administrators and Database Owners.
Conventions Used in This Document
This section describes the style conventions used in this document.
Italic
An italic font is used for filenames, URLs, emphasized text, and the first usage of technical terms.
Monospace
A monospaced font is used for code fragments and data elements.
Bold
A bold font is used for important messages, names of options, names of controls and menu items, and keys.
User Input
Keys are rendered in bold to stand out from other text. Key combinations that are meant to be typed simultaneously are rendered with "+" sign between the keys, such as:
Ctrl+F
Keys that are meant to be typed in sequence will be separated with commas, for example:
Alt+S, H
This would mean that the user is expected to type the Alt and S keys simultaneously and then to type the H key.
Graphical symbols
- This symbol is used to indicate DBMS specific options and issues and to mark useful auditing tips.
About this guide
-6-
- This symbol is used to indicate important notes.
Abbreviations and Product Reference Terms
DBMS – Database Management System
SQL Server – This refers to all versions of Microsoft® SQL Server™ database servers.
The terms ‘DB Audit Expert’ and ‘DB Audit’ are used interchangeably in this document – they both refer to the same product]
Trademarks
DB Audit, DB Audit Expert, DB Mail, 24x7 Automation Suite, 24x7 Scheduler, DB Tools for Oracle are trademarks of SoftTree Technologies, Inc.
Windows 95, Windows 98, Windows NT, Windows 2000, Windows XP are registered trademarks of Microsoft Corporation. UNIX is the registered trademark of the X/Open Consortium. Sun, SunOS, Solaris, SPARC are trademarks or registered trademarks of Sun Microsystems, Inc. Ultrix, Digital UNIX and DEC are trademarks of Digital Equipment Corporation. HP-UX is a trademark of Hewlett-Packard Co. IRIX is a trademark of Silicon Graphics, Inc. AIX is a trademark of International Business Machines, Inc. AT&T is a trademark of American Telephone and Telegraph, Inc.
Microsoft SQL Server is a registered trademark of Microsoft Corporation.
All other trademarks appearing in this document are trademarks of their respective owners. All rights reserved.

CHAPTER 2, Connecting To Your Database
-7-
CHAPTER 1, Overview of Performance Auditing Add-on
When to Use the Performance Auditing Add-on
If you are not satisfied with your SQL Server performance, you can add additional CPU or improve other hardware characteristics to boost overall performance. This seems to be obvious, the more CPUs your server has, the faster it can perform. However, the standard edition of SQL Server can support up to 4 CPUs only. For support for more than 4 CPUs, and up to 32 CPUs when using Windows 2000 or 2003 Datacenter Server, you will need to run SQL Server 2000 or 2005 Enterprise Edition.
A cheaper alternative to purchasing expensive hardware and software upgrades is tuning SQL Server configuration and applications and making them run more efficient.
DB Audit's Performance Auditing Add-on is designed to help database administrators and developers configure Microsoft SQL Server for maximum performance and help determine the cause of poor performance in a SQL Server environment. It also provides over 40 performance-focused reports for analyzing the CPU usage, input/output (I/O) and performance efficiency of SQL queries and the entire SQL Server environment.
DB Audit's Performance Auditing Add-on can collect and analyze statistical performance data that you cannot normally get from the Windows Performance Monitor. You can use the Windows Performance Monitor to monitor and analyze server activity on the top level, monitor hardware usage and bottlenecks. You can use DB Audit's Performance Auditing Add-on to X-ray the internal database activities and figure out which SQL queries and database operations create performance bottlenecks. You can then change the SQL Server configuration for maximum performance and tune poorly performed database queries and operations.
Requirement
The following prerequisites must be met in order to use the Performance Auditing Add-on:
• SQL Server 2000 or 2005 any edition (MSDE, Standard, Enterprise, etc…)
• DB Audit Expert version 2.7.58 or better installed
• System-event auditing must be installed and enabled in DB Audit Expert settings.
Important Notes: It is highly recommended that you do not use audit filters in order to collect he complete statistics and be able to get the true and complete picture of your server performance.
• SA permissions for SQL Server

CHAPTER 2, Connecting To Your Database
-8-
How It Works
DB Audit's Performance Auditing Add-on rely on the use of the following two methods:
1. Through the use of the DB Audit's system-event auditing capabilities audit system and user activities:
• Start and completion of various database queries, RPC calls, stored procedure executions, DBCC executions and more.
• Audit resource usage by queries, logons, applications, including CPU usage, I/O and so on
• Audit database locks • Logins and logouts
2. Through the use of periodically running statistics collection procedures collect and analyze database space usage, including data space allocation, log space allocation and performance.
Notes:
• The system-level database auditing is performed entirely on the server. DB Audit Expert uses SQL Server extended procedures and T-SQL commands to access the system audit trail information and manage system audit configuration and settings. Use DB Audit's graphical interface to enable and manage the system audit settings.
• You must have SA privileges in order to install, uninstall or manage system audit settings.
Guidelines
Consider the following general rules when devising an auditing strategy:
1. Evaluate your purpose for auditing. Once you have a clear understanding of the reasons for auditing, you can devise an appropriate auditing strategy and avoid unnecessary auditing. For example, suppose you have been asked to investigate database performance issues. This information by itself is not specific enough. What types of issues do you suspect or have noticed? A more focused auditing purpose might be to audit specific applications running during peak business hours. This purpose narrows the scope of auditing and the list of database object affected.
2. Audit knowledgeably. Audit the minimum number of statements, users, or objects required to get the targeted information. This prevents unnecessary audit information from cluttering the meaningful information and consuming valuable database storage space. Balance your need to gather sufficient performance information with your ability to store and process it. For example, if you are auditing to gather information about database activity, determine exactly what types of activities you are tracking, audit only the activities of interest, and audit only for the amount of time necessary to gather the information you desire. Do not audit objects if you are only interested in each session’s logical I/O information.
3. Because the volume of audit trail information usually grows very quickly, you should regularly archive audit records and purge the audit trail. Once you have collected the required information, archive the audit records of interest and purge the audit trail.

CHAPTER 2, Installation and Configuration
-9-
CHAPTER 2, Installation and Configuration
System Audit Trail Installation and Management
See DB Audit Expert User's Guide for help with audit trail management. The following topics are covered in the DB Audit User's Guide:
• Installing system audit trail
• Archiving system audit trail to a table
• Exporting system audit trail to a file
• Truncating system audit trail
• Scheduling periodic audit-trail purge
Installing SQL Server Performance Auditing Add-on
The front-end part of the SQL Server Performance Auditing Add-on is installed automatically with the DB Audit's Management Console. The following step describe how to install the back-end part:
1. Start DB Audit's SQL Server Performance Auditing tool from the Windows start menu
2. Connect to the database using either database connection profile previously configured in the DB Audit Management Console or enter new connection settings and then click Connect.
3. If the Reports dialog is configured to popup automatically after a new successful connection, close that dialog.
4. Click the Performance menu then click the Enable Performance Events Collections menu, or
alternatively click the Enable button on the toolbar. The Performance Collection Events dialog will appear.
CHAPTER 2, Installation and Configuration
-10-
5. Choose types of events and statistics you want to collect and then click the OK button. This will update the system audit configuration. In case if the Add Daily Statistics Collection Job option is checked, the Performance Add-on will create 2 statistics repository tables in the chosen repository database. These tables are DB_AUDIT.DB_SPACE and DB_AUDIT.TAB_SPACE. The Performance Add-on will also schedule "DB Audit Space Monitor" job using SQL Agent service local to the SQL Server.
Important Notes:
• SQL Server Agent service must be enabled in order for the Space Monitor job to run successfully.
• In order to manage audit options for SQL Server you must connect to your database as SA user who also has administrative privileges on the computer running SQL Server service.
Configuring System Audit Options
Use DB Audit Management Console to configure system audit options. The usage of the console is described in detail in DB Audit Expert User's Guide.
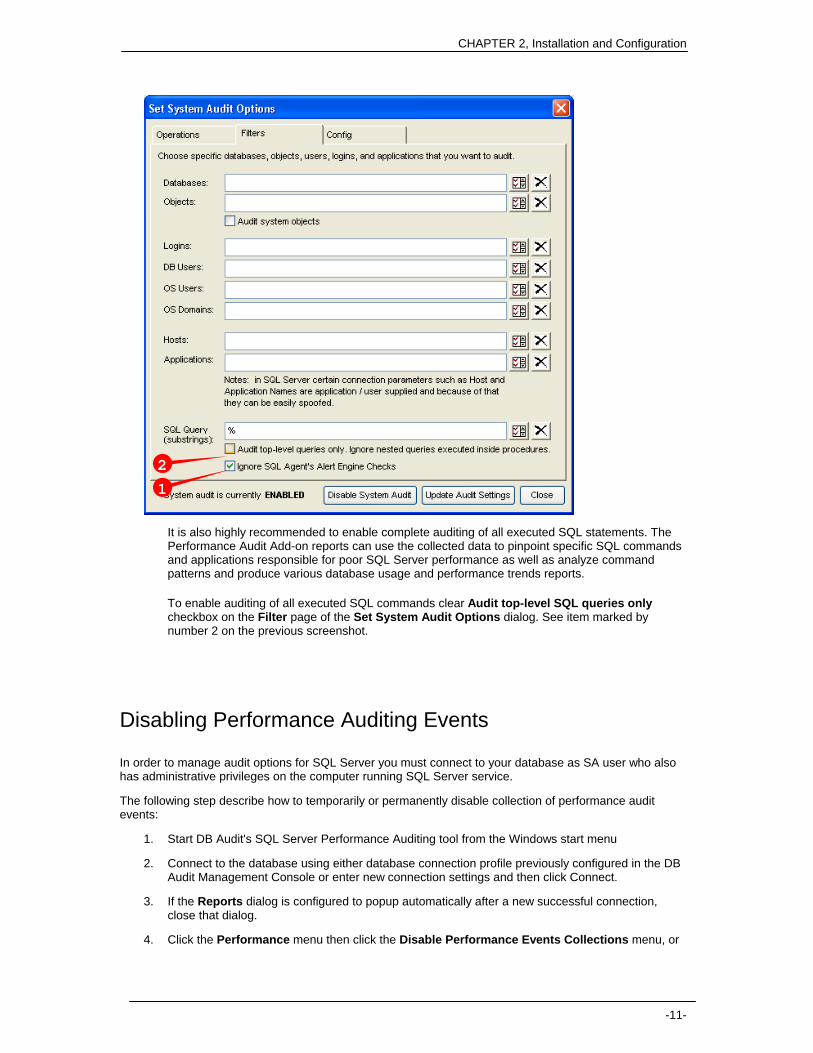
Important Notes: It is highly recommended that you do not use custom audit filters in order to collect the complete statistics and get the true and complete picture of your server performance. The only recommended exception is to disable auditing of events generated by the Alert Engine process, which is part of the SQL Server Agent service responsible for running scheduled jobs. Normally, if the SQL Agent service is enabled the Alert Engine generates a lot of database events and database traffic making it difficult to profile other applications. To disable the Alert Engine process monitoring select Alert Engine 's checkbox on the Filter page of the Set System Audit Options dialog. See item marked by number 1 on the following screenshot.
CHAPTER 2, Installation and Configuration
-11-
It is also highly recommended to enable complete auditing of all executed SQL statements. The Performance Audit Add-on reports can use the collected data to pinpoint specific SQL commands and applications responsible for poor SQL Server performance as well as analyze command patterns and produce various database usage and performance trends reports.
To enable auditing of all executed SQL commands clear Audit top-level SQL queries only checkbox on the Filter page of the Set System Audit Options dialog. See item marked by number 2 on the previous screenshot.
Disabling Performance Auditing Events
In order to manage audit options for SQL Server you must connect to your database as SA user who also has administrative privileges on the computer running SQL Server service.
The following step describe how to temporarily or permanently disable collection of performance audit events:
1. Start DB Audit's SQL Server Performance Auditing tool from the Windows start menu
2. Connect to the database using either database connection profile previously configured in the DB Audit Management Console or enter new connection settings and then click Connect.
3. If the Reports dialog is configured to popup automatically after a new successful connection, close that dialog.
4. Click the Performance menu then click the Disable Performance Events Collections menu, or
1
2

CHAPTER 2, Installation and Configuration
-12-
alternatively click the Enable button on the toolbar.
Disabling System Audit
System audit state can be managed using DB Audit Management Console. See DB Audit Expert User's Guide for help with audit trail management.

-13-
CHAPTER 3, Reports
Overview
The SQL Server Performance Auditing Add-on provides over 50 customizable reports that can be used for:
• Analyzing performance of individual applications and SQL queries both currently running and these that have been run since the Performance Auditing add-on has been installed and enabled.
• Analyzing overall server performance and throughput.
• Analyzing database and server usage trends.
• Identifying specific SQL queries and operations causing deadlocks.
• Identifying specific applications and users that are hogging system resources.
• Identifying database tables that needs proper indexing.
• Gathering and analyzing vital statistics required for database and system capacity planning
• Troubleshooting database errors and conflicts.
• And more…
The following step describe how to run the available reports:
1. Start DB Audit's SQL Server Performance Auditing tool from the Windows start menu
2. Connect to the database using either database connection profile previously configured in the DB Audit Management Console or enter new connection settings and then click Connect.
3. If the Reports dialog is not configured to popup automatically after a new successful connection, click the Performance menu then click the Performance Analysis Reports menu, or
alternatively click the Reports button on the toolbar. The Performance Monitoring and Analysis Reports dialog will appear.
4. In the report navigation tree choose the report you want to run.

-14-
5. In the Events Collected During drop-down list select the required period for the performance data analysis. If you choose a period starting earlier then time the Performance Add-on has been installed the report start time will be automatically adjusted to the timing of the very first event. (Optional) If you cannot find the required period choose [custom dates] item, which is the very last item available in the drop-down list. The Date Filter dialog will appear.
Enter the required date range and press the OK button to continue.
6. (Optional) After the report is displayed you can apply additional filters, change the default sorting, hide and display report columns and perform other customizations. See Chapter 7 in DB Audit Expert User's Guide for help with customizing reports, filtering sorting, exporting report data, and other report-handling options.
20 Most Frequent Top-Level SQL Queries This report returns SQL text and performance statistics for 20 most frequently executed SQL queries that have been executed during the chosen reporting period. The report takes into

-15-
account only directly executed SQL queries. Nested calls are ignored (in other words, SQL queries that are recursively invoked from stored procedures, user-defined functions and triggers are ignored). The following types of SQL statements are also ignored: SET, COMMIT, ROLLBACK, USE, WHILE.
Report usage and requirements:
• DB Audit system-level auditing must be installed and enabled.
• Performance audit events collection must be enabled. "Analyze executed SQL commands and RPC calls" event collector must be enabled. For more information on how to enable this see Installing SQL Server Performance Auditing Add-on topic in CHAPTER 2.
• Audit-time filters should not be used with the system-level auditing except these described in Configuring System Audit Options topic in CHAPTER 2.
The following columns are displayed on the report:
1. Program – Name of the program that executed the query.
2. SQL Text – Text of the SQL query, SQL batch or in case of RPC calls name of the executed stored procedure.
Note: The report displays first 255 characters of the query text if an ODBC connection is used for the report and first 4000 characters with all other connection types.
3. Total Runs – Number of times the program executed the query.
4. Total CPU Time – Total CPU time in seconds that took to execute all query runs.
Note: on multi-processor machines the Total CPU Time value may be higher then the Total Duration value if multiple processors are involved in the processing.
5. Total Page Reads – Total number of database pages SQL Server had to read from data cache or disk to process all query runs.
Note: Page size is 8KB.
6. Total Page Writes – Total number of database pages SQL Server had to write to data cache or disk to process all query runs.
7. Total Duration – Total time in seconds it took SQL Server to execute all query runs.
Note: Report results are grouped by both SQL query text and application name. As a result, similar queries executed by different applications are considered unique.
20 Most Frequent Stored Procedures This report returns names and performance statistics for 20 most frequently executed stored procedures that have been executed during the chosen reporting period. The report takes into account all directly and indirectly executed stored procedures including nested calls (in other words, stored procedures that are recursively invoked from other stored procedures, from user-defined functions and from triggers).
Report usage and requirements:
• DB Audit system-level auditing must be installed and enabled.

-16-
• Performance audit events collection must be enabled. "Analyze executed SQL commands and RPC calls" event collector must be enabled. For more information on how to enable this see Installing SQL Server Performance Auditing Add-on topic in CHAPTER 2.
• Audit-time filters should not be used with the system-level auditing except these described in Configuring System Audit Options topic in CHAPTER 2.
The following columns are displayed on the report:
1. Program – Name of the program that executed the stored procedure.
2. Stored Procedure Name – Name of the executed stored procedure.
3. Total Runs – Number of times the stored procedure was executed by the program.
4. Total CPU Time – Total CPU time in seconds that took to execute all stored procedure runs.
Note: on multi-processor machines the Total CPU Time value may be higher then the Total Duration value if multiple processors are involved in the processing.
5. Total Page Reads – Total number of database pages SQL Server had to read from data cache or disk to process all stored procedure runs.
Note: Page size is 8KB.
6. Total Page Writes – Total number of database pages SQL Server had to write to data cache or disk to process all stored procedure runs.
7. Total Duration – Total time in seconds it took SQL Server to execute all stored procedure runs.
Note: Report results are grouped by both stored procedure name and application name. As a result, procedures executed by different applications are considered unique.
All Top-Level SQL Queries This report returns SQL text and number of executions for all top-level SQL queries, batches and stored procedures executed during the chosen reporting period. The report takes into account only directly executed SQL queries. Nested calls are ignored (in other words, SQL queries that are recursively invoked from stored procedures, user-defined functions and triggers are not reported).
Report usage and requirements:
• DB Audit system-level auditing must be installed and enabled.
• Performance audit events collection must be enabled. "Analyze executed SQL commands and RPC calls" event collector must be enabled. For more information on how to enable this see Installing SQL Server Performance Auditing Add-on topic in CHAPTER 2.
• Audit-time filters should not be used with the system-level auditing except these described in Configuring System Audit Options topic in CHAPTER 2.
The following columns are displayed on the report:
1. Program – Name of the program that executed the query.
2. SQL Text – Text of the SQL query, SQL batch or in case of RPC calls name of the executed stored procedure.
-17-
Note: The report displays first 255 characters of the query text if an ODBC connection is used for the report and first 4000 characters with all other connection types.
3. Total Runs – Number of times the program executed the query.
Note: Report results are grouped by both SQL query text and application name. As a result, similar queries executed by different applications are considered unique.
Average Execution Time by Stored Procedure This report returns names and performance statistics for all stored procedures executed during the chosen reporting period. The report takes into account all directly and indirectly executed stored procedures including nested calls (in other words, stored procedures that are recursively invoked from other stored procedures, from user-defined functions and from triggers).
Report usage and requirements:
• DB Audit system-level auditing must be installed and enabled.
• Performance audit events collection must be enabled. "Analyze executed SQL commands and RPC calls" event collector must be enabled. For more information on how to enable this see Installing SQL Server Performance Auditing Add-on topic in CHAPTER 2.
• Audit-time filters should not be used with the system-level auditing except these described in Configuring System Audit Options topic in CHAPTER 2.
The following columns are displayed on the report:
1. Stored Procedure Name – Name of the executed stored procedure.
2. Total Runs – Number of times the stored procedure was executed.
3. Average CPU Time – Average CPU time in seconds that took to execute all stored procedure runs.
Note: on multi-processor machines the Average CPU Time value may be higher then the Average Duration value if multiple processors are involved in the processing.
4. Average Duration – Average execution time in seconds.
5. Mean Duration – Mean execution time in seconds (calculated using standard deviation methods).
Average Execution Time by SQL Query This report returns text and performance statistics for all SQL queries executed during the chosen reporting period. The report takes into account all directly and indirectly executed queries including nested calls (in other words, queries and stored procedures that are recursively invoked from other stored procedures, from user-defined functions and from triggers). The following types of SQL statements are ignored and displayed by this reports: SET, COMMIT, ROLLBACK, USE, WHILE.

-18-
Report usage and requirements:
• DB Audit system-level auditing must be installed and enabled.
• Performance audit events collection must be enabled. "Analyze executed SQL commands and RPC calls" event collector must be enabled. For more information on how to enable this see Installing SQL Server Performance Auditing Add-on topic in CHAPTER 2.
• Audit-time filters should not be used with the system-level auditing except these described in Configuring System Audit Options topic in CHAPTER 2.
The following columns are displayed on the report:
1. SQL Text – Text of the SQL query, SQL batch or in case of RPC calls name of the executed stored procedure.
Note: The report displays first 255 characters of the query text if an ODBC connection is used for the report and first 4000 characters with all other connection types.
2. Total Runs – Number of times the query was executed.
3. Average CPU Time – Average CPU time in seconds that took to execute all SQL query runs.
Note: on multi-processor machines the Average CPU Time value may be higher then the Average Duration value if multiple processors are involved in the processing.
4. Average Duration – Average execution time in seconds.
5. Mean Duration – Mean execution time in seconds (calculated using standard deviation methods).
SQL Queries Whose Execution Time Has Changed Over 20%
This report returns text and performance statistics for all SQL queries executed at least 10 times during the chosen reporting period and whose average execution time increased by at least 20%. The report takes into account all directly and indirectly executed queries including nested calls (in other words, queries and stored procedures that are recursively invoked from other stored procedures, from user-defined functions and from triggers). The following types of SQL statements are ignored and displayed by this reports: SET, COMMIT, ROLLBACK, USE, WHILE.
The report calculates average run time duration for the first five runs and the last five runs and compares their values.
Report usage and requirements:
• DB Audit system-level auditing must be installed and enabled.
• Performance audit events collection must be enabled. "Analyze executed SQL commands and RPC calls" event collector must be enabled. For more information on how to enable this see Installing SQL Server Performance Auditing Add-on topic in CHAPTER 2.
• Audit-time filters should not be used with the system-level auditing except these described in Configuring System Audit Options topic in CHAPTER 2.
-19-
The following columns are displayed on the report:
1. SQL Text – Text of the SQL query, SQL batch or in case of RPC calls name of the executed stored procedure.
Note: The report displays first 255 characters of the query text if an ODBC connection is used for the report and first 4000 characters with all other connection types.
2. Beginning Duration – Average execution time in seconds for the first 5 runs.
3. Ending Duration – Average execution time in seconds for the last 5 runs.
4. % Difference – Difference between beginning and ending duration expressed as percentage.
Stored Procedures Whose Execution Time Has Changed Over 20%
This report returns name and performance statistics for all stored procedures executed at least 10 times during the chosen reporting period and whose average execution time increased by at least 20%. The report takes into account all directly and indirectly executed procedures including nested calls (in other words, stored procedures that are recursively invoked from other stored procedures, from user-defined functions and from triggers).
The report calculates average run time duration for the first five runs and the last five runs and compares their values.
Report usage and requirements:
• DB Audit system-level auditing must be installed and enabled.
• Performance audit events collection must be enabled. "Analyze executed SQL commands and RPC calls" event collector must be enabled. For more information on how to enable this see Installing SQL Server Performance Auditing Add-on topic in CHAPTER 2.
• Audit-time filters should not be used with the system-level auditing except these described in Configuring System Audit Options topic in CHAPTER 2.
The following columns are displayed on the report:
1. Stored Procedure Name – Name of the executed stored procedure.
2. Beginning Duration – Average execution time in seconds for the first 5 runs.
3. Ending Duration – Average execution time in seconds for the last 5 runs.
4. % Difference – Difference between beginning and ending duration expressed as percentage.
Top-Level SQL Query Execution Time Trends This report displays changes in run-time duration for all top-level SQL queries executed during the chosen reporting period.

-20-
The following method is used for building the trend graph: The chosen reporting period is split into numerous equal time short intervals and the total queries execution time is calculated for each interval. All calculated totals are then connected together. A spike or drop indicated by the trend line means one of the following:
a) Significantly more (or less) queries have been executed during that time interval affecting the total duration for all queries and causing the database to spend more time executing all queries. For example, this could be caused by a new application deployed to SQL Server.
b) Average query execution time has significantly increased (or decreased) which could be caused by significantly more data processed by some queries because of a poor table indexing or poor application design.
c) Average query execution time has significantly increased (or decreased) which could be caused by heavy server load created by other processes that running outside of the SQL Server process.
d) Any combination of a), b) and c).
Report usage and requirements:
• DB Audit system-level auditing must be installed and enabled.
• Performance audit events collection must be enabled. "Analyze executed SQL commands and RPC calls" event collector must be enabled. For more information on how to enable this see Installing SQL Server Performance Auditing Add-on topic in CHAPTER 2.
• Audit-time filters should not be used with the system-level auditing except these described in Configuring System Audit Options topic in CHAPTER 2.
Graph description:
Trend line indicating duration of all executed SQL queries as a function of time.
Stored Procedures Execution Time Trends This report displays run-time duration trends graph for all stored procedures executed during the chosen reporting period.
The following method is used for building the trend graph: The chosen reporting period is split into numerous equal time short intervals and the total stored procedures execution time is calculated for each interval. All calculated totals are then connected together. A spike or drop indicated by the trend line means one of the following:
a) Significantly more (or less) stored procedures have been executed during that time interval affecting the total duration for all procedure calls and causing the database to spend more time executing all calls. For example, this could be caused by a new application deployed to SQL Server.
b) Average stored procedure execution time has significantly increased (or decreased) which could be caused by significantly more data processed by some procedures because of a poor table indexing or poor application design.
c) Average stored procedure execution time has significantly increased (or decreased) which could be caused by heavy server load created by other processes running outside

-21-
of the SQL Server process.
d) Any combination of a), b) and c).
Report usage and requirements:
• DB Audit system-level auditing must be installed and enabled.
• Performance audit events collection must be enabled. "Analyze executed SQL commands and RPC calls" event collector must be enabled. For more information on how to enable this see Installing SQL Server Performance Auditing Add-on topic in CHAPTER 2.
• Audit-time filters should not be used with the system-level auditing except these described in Configuring System Audit Options topic in CHAPTER 2.
Graph description:
Trend line indicating duration of all executed stored procedures as a function of time.
Stored Procedures Cache Hits and Misses (Details) This report displays procedure cache hits, misses and recompilation statistics for all stored procedures executed during the chosen reporting period. The results can be used to tune SQL Server memory allocation, in particular the amount of SQL Server memory used for the procedure cache. The results can be also used to determine if SQL Server performance is suffering because of frequent stored procedure code recompilations.
Report usage and requirements:
• DB Audit system-level auditing must be installed and enabled.
• Performance audit events collection must be enabled. "Collect stored procedure and data cache hits and misses" event collector must be enabled. For more information on how to enable this see Installing SQL Server Performance Auditing Add-on topic in CHAPTER 2.
• Audit-time filters should not be used with the system-level auditing except these described in Configuring System Audit Options topic in CHAPTER 2.
The following columns are displayed on the report:
1. Stored Procedure Name – Name of the executed stored procedure.
2. Total Runs – Number of times the stored procedure was executed.
3. Total Hits – Number of times the stored procedure code was found in the procedure cache, in other words, number of procedure runs when SQL Server found procedure code in the procedure cache and did not need to load it from disk.
4. Total Data Hits – Number of times the stored procedure code was found in the procedure cache as well as deterministic data returned by this procedure in the previous run. In other words, number of runs when SQL Server found both procedure code in the procedure cache and data returned by that procedure in the data cache as so it did not need to re-load or re-execute that procedure again.

-22-
5. Total Misses – Number of times the stored procedure code was not found in the procedure cache, in other words, number of procedure runs when SQL Server did not find procedure code in the procedure cache and needed to load it from disk.
Stored Procedures Cache Hits and Misses (Summary) This report displays summary procedure cache hits and misses graphs for all stored procedures executed during the chosen reporting period. The results can be used to tune SQL Server memory allocation, in particular the amount of SQL Server memory used for the procedure cache. The results can be also used to determine if SQL Server performance is suffering because of frequent stored procedure code recompilations.
Report usage and requirements:
• DB Audit system-level auditing must be installed and enabled.
• Performance audit events collection must be enabled. "Collect stored procedure and data cache hits and misses" event collector must be enabled. For more information on how to enable this see Installing SQL Server Performance Auditing Add-on topic in CHAPTER 2.
• Audit-time filters should not be used with the system-level auditing except these described in Configuring System Audit Options topic in CHAPTER 2.
Two summary graphs are displayed:
1. % Hits Summary – This pie graph shows percent of procedure cache hits vs. percent of procedure cache misses.
2. Hits, Misses and Recompilations Summary – This bar graphs shows compares the following values:
a) All Runs – Total number all procedure runs
b) Cache Hits – Total number of cache hits, in other words, number of runs when SQL Server found procedure code in the procedure cache and did not need to load it from disk.
c) Cache Misses – Total number of cache misses, in other words, number of runs when SQL Server did not find procedure code in the procedure cache and needed to re-load procedure code from disk.
d) Data Cache Hits – Total number of cache and data hits, in other words, number of runs when SQL Server found both procedure code in the procedure cache and data returned by that procedure in the data cache as so it did not need to re-load or re-execute that procedure again.
e) Recompiles – Total number of procedure runs when SQL Server had to recompile the procedure code before it could execute it.
Long Running SQL Queries This report returns text and performance statistics for long running SQL queries executed during the chosen reporting period. The report searches only queries that have been executed at least

-23-
10 times during the chosen period with mean duration 5 seconds or longer. The report takes into account all directly and indirectly executed queries including nested calls (in other words, queries and stored procedures that are recursively invoked from other stored procedures, from user-defined functions and from triggers).
The report can be used for searching and tuning poorly performing database applications.
Report usage and requirements:
• DB Audit system-level auditing must be installed and enabled.
• Performance audit events collection must be enabled. "Analyze executed SQL commands and RPC calls" event collector must be enabled. For more information on how to enable this see Installing SQL Server Performance Auditing Add-on topic in CHAPTER 2.
• Audit-time filters should not be used with the system-level auditing except these described in Configuring System Audit Options topic in CHAPTER 2.
The following columns are displayed on the report:
1. SQL Text – Text of the SQL query or SQL batch.
Note: The report displays first 255 characters of the query text if an ODBC connection is used for the report and first 4000 characters with all other connection types.
2. Total Runs – Number of times the query was executed.
3. Program Name – Name of the program that executed the query.
4. Average Duration – Average execution time in seconds.
5. Mean Duration – Mean execution time in seconds (calculated using standard deviation methods).
CPU Utilization by Application This report returns CPU usage statistics for all applications ran during the chosen reporting period. The report can be used for searching applications that are hogging database resources.
Report usage and requirements:
• DB Audit system-level auditing must be installed and enabled.
• Performance audit events collection must be enabled. "Analyze executed SQL commands and RPC calls" event collector must be enabled. For more information on how to enable this see Installing SQL Server Performance Auditing Add-on topic in CHAPTER 2.
• Audit-time filters should not be used with the system-level auditing except these described in Configuring System Audit Options topic in CHAPTER 2.
The following columns are displayed on the report:
1. Program– Name of the program.
2. Total Calls – Number of database calls made by the application. Only top-level SQL queries, SQL batches and stored procedure executions are counted.

-24-
3. Total CPU Time – Total CPU time in seconds that took to execute all database calls.
Note: on multi-processor machines the Total CPU Time value may be higher then the Total Duration value if multiple processors are involved in the processing.
4. Total Duration – Total time in seconds it took SQL Server to execute all database calls.
CPU Utilization by Login This report returns CPU usage statistics for all users who logged in to SQL Server during the chosen reporting period. The report can be used for searching users who are hogging database resources.
Report usage and requirements:
• DB Audit system-level auditing must be installed and enabled.
• Performance audit events collection must be enabled. "Analyze executed SQL commands and RPC calls" event collector must be enabled. For more information on how to enable this see Installing SQL Server Performance Auditing Add-on topic in CHAPTER 2.
• Audit-time filters should not be used with the system-level auditing except these described in Configuring System Audit Options topic in CHAPTER 2.
The following columns are displayed on the report:
1. Login – User login name.
2. Total Calls – Number of database calls made by the login. Only top-level SQL queries, SQL batches and stored procedure executions are counted.
3. Total CPU Time – Total CPU time in seconds that took to execute all database calls.
Note: on multi-processor machines the Total CPU Time value may be higher then the Total Duration value if multiple processors are involved in the processing.
4. Total Duration – Total time in seconds it took SQL Server to execute all database calls.
SQL Agent Jobs CPU Utilization This report returns CPU usage statistics for all SQL Agent jobs ran during the chosen reporting period. The report searches both local and remote jobs, including jobs executed by the local SQL Agent service and jobs executed by other SQL Agent services running on other SQL Servers.
The report can be used for searching automated processes that are hogging database resources.
Report usage and requirements:
• DB Audit system-level auditing must be installed and enabled.
• Performance audit events collection must be enabled. "Analyze executed SQL commands and RPC calls" event collector must be enabled. For more information on how to enable this see Installing SQL Server Performance Auditing Add-on topic in

-25-
CHAPTER 2.
• Audit-time filters should not be used with the system-level auditing except these described in Configuring System Audit Options topic in CHAPTER 2.
The following columns are displayed on the report:
1. Program – Name of the SQL Agent job and job step.
2. Total Calls – Number of database calls made by the job step. Only top-level SQL queries, SQL batches and stored procedure executions are counted.
3. Total CPU Time – Total CPU time in seconds that took to execute all database calls.
Note: on multi-processor machines the Total CPU Time value may be higher then the Total Duration value if multiple processors are involved in the processing.
4. Total Duration – Total time in seconds it took SQL Server to execute all database calls.
CPU Utilization Bottlenecks and Timing This report returns CPU usage statistics for applications and queries ran during the chosen reporting period that caused prolonged times of heavy CPU utilization. Such applications affect the overall SQL Server performance as well as the performance of other applications running on the same SQL Server.
The report can be used for searching poorly designed applications.
Report usage and requirements:
• DB Audit system-level auditing must be installed and enabled.
• Performance audit events collection must be enabled. "Analyze executed SQL commands and RPC calls" event collector must be enabled. For more information on how to enable this see Installing SQL Server Performance Auditing Add-on topic in CHAPTER 2.
• Audit-time filters should not be used with the system-level auditing except these described in Configuring System Audit Options topic in CHAPTER 2.
The following columns are displayed on the report:
1. Event Time – Timing of the heavy CPU utilization.
2. Program Name – Name of the program that made the database query.
3. SQL Text – Text of the SQL query, SQL batch or stored procedure name.
Note: The report displays first 255 characters of the query text if an ODBC connection is used for the report and first 4000 characters with all other connection types.
4. CPU Time – CPU time in seconds that took to execute the database calls.
Note: on multi-processor machines the CPU Time value may be higher then the Duration value if multiple processors are involved in the processing.
5. Duration – Time in seconds it took SQL Server to execute the database calls.

-26-
CPU Utilization Trends This report displays changes in CPU utilization during the chosen reporting period.
The following method is used for building the trend graph: The chosen reporting period is split into numerous equal time short intervals and the total CPU time used for all database operations is calculated for each interval. All calculated totals are then connected together.
This report can be used for server capacity planning and projecting future CPU requirements.
Report usage and requirements:
• DB Audit system-level auditing must be installed and enabled.
• Performance audit events collection must be enabled. "Analyze executed SQL commands and RPC calls" event collector must be enabled. For more information on how to enable this see Installing SQL Server Performance Auditing Add-on topic in CHAPTER 2.
• Audit-time filters should not be used with the system-level auditing except these described in Configuring System Audit Options topic in CHAPTER 2.
Graph description:
Trend line indicating total CPU time as a function of time.
Hourly Average CPU Utilization This report displays average hourly CPU utilization statistics. Hourly averages are calculated for all database operations executed during the chosen reporting period.
This report can be used for server capacity planning, load balancing and finding windows of low server activity suitable for running new or existing processes.
Report usage and requirements:
• DB Audit system-level auditing must be installed and enabled.
• Performance audit events collection must be enabled. "Analyze executed SQL commands and RPC calls" event collector must be enabled. For more information on how to enable this see Installing SQL Server Performance Auditing Add-on topic in CHAPTER 2.
• Audit-time filters should not be used with the system-level auditing except these described in Configuring System Audit Options topic in CHAPTER 2.
Graph description:
Bar graph displaying average total CPU usage time for each hour of day.

-27-
Daily Average CPU Utilization This report displays average daily CPU utilization statistics. Daily averages are calculated for all database operations executed during the chosen reporting period.
This report can be used for server capacity planning, load balancing and finding windows of low server activity suitable for running new or existing processes.
Report usage and requirements:
• DB Audit system-level auditing must be installed and enabled.
• Performance audit events collection must be enabled. "Analyze executed SQL commands and RPC calls" event collector must be enabled. For more information on how to enable this see Installing SQL Server Performance Auditing Add-on topic in CHAPTER 2.
• Audit-time filters should not be used with the system-level auditing except these described in Configuring System Audit Options topic in CHAPTER 2.
Graph description:
Bar graph displaying average total CPU usage time for each day of month.
I/O Utilization by Application This report returns Input/Output statistics for all applications ran during the chosen reporting period. The report can be used for searching applications that are hogging database resources.
Report usage and requirements:
• DB Audit system-level auditing must be installed and enabled.
• Performance audit events collection must be enabled. "Analyze executed SQL commands and RPC calls" event collector must be enabled. For more information on how to enable this see Installing SQL Server Performance Auditing Add-on topic in CHAPTER 2.
• Audit-time filters should not be used with the system-level auditing except these described in Configuring System Audit Options topic in CHAPTER 2.
The following columns are displayed on the report:
1. Program– Name of the program.
2. Total Calls – Number of database calls made by the application. Only top-level SQL queries, SQL batches and stored procedure executions are counted.
3. Total Page Reads – Total number of database pages SQL Server had to read from data cache or disk to process all database calls.
Note: Page size is 8KB.
4. Total Page Writes – Total number of database pages SQL Server had to write to data cache or disk to process all database calls.
-28-
I/O Utilization by Login This report returns Input/Output statistics for all users who logged in to SQL Server during the chosen reporting period. The report can be used for searching users who are hogging database resources.
Report usage and requirements:
• DB Audit system-level auditing must be installed and enabled.
• Performance audit events collection must be enabled. "Analyze executed SQL commands and RPC calls" event collector must be enabled. For more information on how to enable this see Installing SQL Server Performance Auditing Add-on topic in CHAPTER 2.
• Audit-time filters should not be used with the system-level auditing except these described in Configuring System Audit Options topic in CHAPTER 2.
The following columns are displayed on the report:
1. Login – User login name.
2. Total Calls – Number of database calls made by the login. Only top-level SQL queries, SQL batches and stored procedure executions are counted.
3. Total Page Reads – Total number of database pages SQL Server had to read from data cache or disk to process all database calls.
Note: Page size is 8KB.
4. Total Page Writes – Total number of database pages SQL Server had to write to data cache or disk to process all database calls.
I/O Utilization Trends This report displays changes in Input/Output utilization during the chosen reporting period.
The following method is used for building the trend graph: The chosen reporting period is split into numerous equal time short intervals and the total I/O used for all database operations is calculated for each interval. All calculated totals are then connected together.
This report can be used for server capacity planning and projecting future I/O requirements.
Report usage and requirements:
• DB Audit system-level auditing must be installed and enabled.
• Performance audit events collection must be enabled. "Analyze executed SQL commands and RPC calls" event collector must be enabled. For more information on how to enable this see Installing SQL Server Performance Auditing Add-on topic in CHAPTER 2.
• Audit-time filters should not be used with the system-level auditing except these described in Configuring System Audit Options topic in CHAPTER 2.
-29-
Graph description:
Page Reads – trend line indicating total page reads as a function of time.
Page Writes – trend line indicating total page writes as a function of time.
A legend is displayed on the bottom side of the graph indicating which line color is used for wich line.
Deadlocks This report returns applications, SQL queries and objects experiencing deadlocks during the chosen reporting period. The report takes into account all directly and indirectly executed queries including nested calls (in other words, queries and stored procedures that are recursively invoked from other stored procedures, from user-defined functions and from triggers).
The report can be used for searching and tuning database applications experiencing locking problems and figuring out specific SQL queries and database objects that are frequent causes of lock contention.
Report usage and requirements:
• DB Audit system-level auditing must be installed and enabled.
• Performance audit events collection must be enabled. "Monitor deadlocks and lock timeouts" event collector must be enabled. For more information on how to enable this see Installing SQL Server Performance Auditing Add-on topic in CHAPTER 2.
• Audit-time filters should not be used with the system-level auditing except these described in Configuring System Audit Options topic in CHAPTER 2.
The following columns are displayed on the report:
1. Event Time – Time when reported event occurred.
2. Program Name – Name of the program that executed the query.
3. Event Type – Type of lock event, either of the following: Deadlock, Deadlock chain.
4. SQL Text – Text of the SQL query or SQL batch.
Note: The report displays first 255 characters of the query text if an ODBC connection is used for the report and first 4000 characters with all other connection types.
5. Login Name – User login whose database session executed the query.
6. Object Name – Name of the database object experiencing the lock issue in cases of an object level lock or name of the database where the lock event occurred in case of a database level lock.
Lock Timeouts This report returns applications, SQL queries and objects experiencing lock acquisition timeouts

-30-
during the chosen reporting period. The report takes into account all directly and indirectly executed queries including nested calls (in other words, queries and stored procedures that are recursively invoked from other stored procedures, from user-defined functions and from triggers).
The report can be used for searching and tuning database applications experiencing locking problems and figuring out specific SQL queries and database objects that are frequent causes of lock contention.
Report usage and requirements:
• DB Audit system-level auditing must be installed and enabled.
• Performance audit events collection must be enabled. "Monitor deadlocks and lock timeouts" event collector must be enabled. For more information on how to enable this see Installing SQL Server Performance Auditing Add-on topic in CHAPTER 2.
• Audit-time filters should not be used with the system-level auditing except these described in Configuring System Audit Options topic in CHAPTER 2.
The following columns are displayed on the report:
1. Event Time – Time when reported event occurred.
2. Program Name – Name of the program that executed the query.
3. Event Type – Type of lock event: Lock wait timeout.
4. SQL Text – Text of the SQL query or SQL batch.
Note: The report displays first 255 characters of the query text if an ODBC connection is used for the report and first 4000 characters with all other connection types.
5. Login Name – User login whose database session executed the query.
6. Object Name – Name of the database object experiencing the lock issue in cases of an object level lock or name of the database where the lock event occurred in case of a database level lock.
Active Sessions Trends This report displays changes in number of active user session during the chosen reporting period. The report counts user connections ignoring all database connections established by internal SQL Server processes.
The following method is used for building the trend graph: The chosen reporting period is split into numerous equal time short intervals and the total number of distinct user sessions and running sessions is counted for each interval. All calculated totals are then connected together.
This report can be used for server capacity planning and projecting future CPU and memory requirements.
Report usage and requirements:
• DB Audit system-level auditing must be installed and enabled.
• Performance audit events collection must be enabled. "Analyze executed SQL commands and RPC calls" event collector must be enabled. For more information on how to enable this see Installing SQL Server Performance Auditing Add-on topic in CHAPTER 2.
-31-
• Audit-time filters should not be used with the system-level auditing except these described in Configuring System Audit Options topic in CHAPTER 2.
Graph description:
Trend line indicating total number of sessions running various database operations as a function of time.
Applications Running in SQL Server
This report returns names and performance statistics for all database applications that ran during the chosen reporting period. The report can be used for searching applications that are hogging database resources.
Report usage and requirements:
• DB Audit system-level auditing must be installed and enabled.
• Performance audit events collection must be enabled. "Analyze executed SQL commands and RPC calls" event collector must be enabled. For more information on how to enable this see Installing SQL Server Performance Auditing Add-on topic in CHAPTER 2.
• Audit-time filters should not be used with the system-level auditing except these described in Configuring System Audit Options topic in CHAPTER 2.
The following columns are displayed on the report:
1. Program – Name of the database program.
2. Total Runs – Number of times the application established and used a connection to the SQL Server. If an application establishes multiple simultaneous connections, each connection is counted separately.
3. Total CPU Time – Total CPU time in seconds that took SQL Server to execute all database queries sent from the application.
Note: on multi-processor machines the Total CPU Time value may be higher then the Total Duration value if multiple processors are involved in the processing.
4. Total Duration – Total time in seconds it took SQL Server to execute all database queries sent from the application. This time should be less or equal the total duration of all database connections made from the application.
5. Total Page Reads – Total number of database pages SQL Server had to read from data cache or disk to process all database queries sent from the application.
Note: Page size is 8KB.
6. Total Page Writes – Total number of database pages SQL Server had to write to data cache or disk to process all database queries sent from the application.
7. Total Rows – Total rows returned by SQL Server to the application while execution various database queries.

-32-
Users Logging in to SQL Server This report returns names and performance statistics for all users who logged in to SQL Server during the chosen reporting period. The report can be used for searching users who are hogging database resources.
Report usage and requirements:
• DB Audit system-level auditing must be installed and enabled.
• Performance audit events collection must be enabled. "Analyze executed SQL commands and RPC calls" event collector must be enabled. For more information on how to enable this see Installing SQL Server Performance Auditing Add-on topic in CHAPTER 2.
• Audit-time filters should not be used with the system-level auditing except these described in Configuring System Audit Options topic in CHAPTER 2.
The following columns are displayed on the report:
1. Login – User login name.
2. Total Sessions – Number of times a connection to the SQL Server had been established using the login. If a user runs applications establishing multiple simultaneous connections, each connection is counted separately.
3. Total CPU Time – Total CPU time in seconds that took SQL Server to execute all database queries sent by this login.
Note: on multi-processor machines the Total CPU Time value may be higher then the Total Duration value if multiple processors are involved in the processing.
4. Total Duration – Total time in seconds it took SQL Server to execute all database queries sent from this login sessions. This time should be less or equal the total duration of all database connections made using this login.
5. Total Page Reads – Total number of database pages SQL Server had to read from data cache or disk to process all database queries sent by this login.
Note: Page size is 8KB.
6. Total Page Writes – Total number of database pages SQL Server had to write to data cache or disk to process all database queries sent by this login.
7. Total Rows – Total rows returned by SQL Server to the user while execution various database queries sent by this login.
Cumulative SQL Server Load This report displays SQL Server load during the chosen reporting period. The load is a composite value calculated using weight factors for CPU usage, Input/Output and number of active user sessions. The following formula is used to calculate the composite load value:
CPU-weight * CPU-load + I/O-weight * I/O-load + Sessions-weight * Sessions-load
Load for each component is calculated as a ratio of current component value vs. its maximum value reached during the chosen report period.
By default the following weight factors are used:

-33-
CPU: 60%
I/O: 25%
Sessions: 15%
The weight factors can be customized as needed. Before running the report, DB Audit prompts to accept default weight values or enter user-defined values.
The entered values are remembered and used in all consecutive report runs until the are changed or default values restored using the Use Defaults button.
Note: The sum of all weight values must be equal 100%.
The following method is used for building the load graph: The chosen reporting period is split into numerous equal time short intervals and the total load is calculated for each interval. All calculated values are then connected together.
This report can be used for server capacity planning and projecting future CPU and memory requirements.
Report usage and requirements:
• DB Audit system-level auditing must be installed and enabled.
• Performance audit events collection must be enabled. "Analyze executed SQL commands and RPC calls" event collector must be enabled. For more information on how to enable this see Installing SQL Server Performance Auditing Add-on topic in CHAPTER 2.
• Audit-time filters should not be used with the system-level auditing except these described in Configuring System Audit Options topic in CHAPTER 2.
Graph description:
Trend line indicating cumulative SQL Server load as a function of time.

-34-
Data Output Trends This report displays changes in number of rows retrieved by all database applications during the chosen reporting period.
The following method is used for building the trend graph: The chosen reporting period is split into numerous equal time short intervals and the total number of retrieved rows is counted for each interval. All calculated totals are then connected together.
This report can be used for server capacity planning and projecting future requirements.
Report usage and requirements:
• DB Audit system-level auditing must be installed and enabled.
• Performance audit events collection must be enabled. "Analyze executed SQL commands and RPC calls" event collector must be enabled. For more information on how to enable this see Installing SQL Server Performance Auditing Add-on topic in CHAPTER 2.
• Audit-time filters should not be used with the system-level auditing except these described in Configuring System Audit Options topic in CHAPTER 2.
Graph description:
Trend line indicating total number of retrieved rows as a function of time.
Free/Used Data Space Usage Trends This report displays changes in database data space usage during the chosen reporting period.
The following method is used for building the trend graph: The chosen reporting period is split into numerous equal time short intervals and average daily free and used data space sizes are calculated for each interval and for each database. All calculated totals are then connected together.
This report can be used for server capacity planning, projecting space requirements and for performance tuning.
Report usage and requirements:
• Space statistics collection stored procedure and job DB_AUDIT.SP_SPACEMONITOR must be installed and scheduled as described in Installing SQL Server Performance Auditing Add-on topic in CHAPTER 2.
Graph description:
A separate graph is displayed for each database except TEMPDB. Up to 3 databases are displayed on each report page. Use the vertical scroll bar or Page Down/Page Up keyboard buttons to scroll report pages and review individual database graphs.
Each graph displays 2 trend lines:
Used Space –Trend line indicating total used data space as a function of time.
Free Space –Trend line indicating total free (unused) data space as a function of time.

-35-
Note: The sum of free and used space is not a constant value. Normally the size of used space keep increasing over time and the size of free space keeps decreasing until the size of transaction log files is grown. Data files can be shrunk or grown manually or resized automatically depending on your SQL Server settings.
A legend is displayed on the right hand side of the graph indicating which color is used for which line.
Free/Used Log Space Usage Trends This report displays changes in database transaction log space usage during the chosen reporting period.
The following method is used for building the trend graph: The chosen reporting period is split into numerous equal time short intervals and average daily free and used log space sizes are calculated for each interval and for each database. All calculated totals are then connected together.
This report can be used for server capacity planning, projecting space requirements and for performance tuning.
Report usage and requirements:
• Space statistics collection stored procedure and job DB_AUDIT.SP_SPACEMONITOR must be installed and scheduled as described in Installing SQL Server Performance Auditing Add-on topic in CHAPTER 2.
Graph description:
A separate graph is displayed for each database except TEMPDB. Up to 3 databases are displayed on each report page. Use the vertical scroll bar or Page Down/Page Up keyboard buttons to scroll report pages and review individual database graphs.
Each graph displays 2 trend lines:
Used Space –Trend line indicating total used space in transaction log files as a function of time.
Free Space –Trend line indicating total free (unused) space in transaction log files as a function of time.
Note: The sum of free and used transaction log space is not a constant value. Log truncations may occur at the completion of BACKUP LOG operations, at checkpoints, and in some other circumstances. Log files can be also grown or shrunk manually and automatically by SQL Server settings.
A legend is displayed on the bottom side of the graph indicating which line color is used for wich line.
Data Space Allocation Trends - Comparison by Database This report displays database data space usage statistics during the chosen reporting period.
-36-
The following method is used for building the trend graph: The chosen reporting period is split into numerous equal time short intervals and average daily used data space size is calculated for each interval and for each database. All calculated totals are then connected together.
This report can be used for server capacity planning, projecting space requirements and for performance tuning.
Report usage and requirements:
• Space statistics collection stored procedure and job DB_AUDIT.SP_SPACEMONITOR must be installed and scheduled as described in Installing SQL Server Performance Auditing Add-on topic in CHAPTER 2.
Graph description:
A separate used space trend line is displayed for each database as a function of time. TEMPDB is not displayed.
A legend is displayed on the bottom side of the graph indicating which color is used for which database.
Log Space Allocation Trends - Comparison by Database This report displays database transaction log space usage statistics during the chosen reporting period.
The following method is used for building the trend graph: The chosen reporting period is split into numerous equal time short intervals and average daily used log space size is calculated for each interval and for each database. All calculated totals are then connected together.
This report can be used for server capacity planning, projecting space requirements and for performance tuning.
Report usage and requirements:
• Space statistics collection stored procedure and job DB_AUDIT.SP_SPACEMONITOR must be installed and scheduled as described in Installing SQL Server Performance Auditing Add-on topic in CHAPTER 2.
Graph description:
A separate transaction log used space trend line as a function of time is displayed for each database. TEMPDB is not displayed.
A legend is displayed on the bottom side of the graph indicating which color is used for which database.
Data and Log Space Details This report displays detailed daily database space and transaction log space usage statistics during the chosen reporting period.

-37-
This report can be used for server capacity planning, projecting space requirements and for performance tuning.
Report usage and requirements:
• Space statistics collection stored procedure and job DB_AUDIT.SP_SPACEMONITOR must be installed and scheduled as described in Installing SQL Server Performance Auditing Add-on topic in CHAPTER 2.
The following columns are displayed on the report:
1. Database – Database name.
2. Date – Statistics date.
3. Data Total Allocated (MB) – Total size of all data files associated with the database specified in the Database column. The size value is expressed in Mbytes.
4. Data Used Space (MB) – Total used space in all data files associated with the database specified in the Database column. The size value is expressed in Mbytes.
5. Data Free Space (MB) – Total unused space in all data files associated with the database specified in the Database column. The size value is expressed in Mbytes.
6. Data Percent Free – Percent of unused space in all data files associated with the database specified in the Database column.
7. Log Total Allocated (MB) – Total size of all transaction log files associated with the database specified in the Database column. The size value is expressed in Mbytes.
8. Log Used Space (MB) – Total used space in all transaction log files associated with the database specified in the Database column. The size value is expressed in Mbytes.
9. Log Free Space (MB) – Total unused space in all transaction log files associated with the database specified in the Database column. The size value is expressed in Mbytes.
10. Log Percent Free – Percent of unused space in all transaction log files associated with the database specified in the Database column.
11. Is Log Stale? – YES value in this indicates that transaction logs are causing input/output timeouts affecting the database performance. Such logs need to be moved to a faster disk system.
Note: Log is considered stale if average I/O wait exceeds 20 milliseconds for any transaction log file associated with the database specified in the Database column.
Row Count Trends by Database This report displays row count changes for each database during the chosen reporting period.
The following method is used for building the trend graph: The chosen reporting period is split into numerous equal time short intervals and an average number of rows is counted for each interval and for each database. All calculated averages are then connected together.
This report can be used for server capacity planning and projecting future requirements.

-38-
Report usage and requirements:
• Space statistics collection stored procedure and job DB_AUDIT.SP_SPACEMONITOR must be installed and scheduled as described in Installing SQL Server Performance Auditing Add-on topic in CHAPTER 2.
Graph description:
A trend line indicating total number of stored rows as a function of time is displayed for each database.
A legend is displayed on the bottom side of the graph indicating which color is used for which database.
Top 20 Fastest Growing Tables by Space This report displays top 20 tables whose space allocation increased most during the chosen reporting period. Space allocation is calculated for both table data and table indexes.
The report takes into account only tables whose space allocation keeps increasing over time and not just a result of a single data load or temporary update. The report searches only tables that existed for at least 10 days and whose size has increased at least 10% during the chosen reporting period.
This report can be used for server capacity planning, projecting space requirements and for performance tuning.
Report usage and requirements:
• Space statistics collection stored procedure and job DB_AUDIT.SP_SPACEMONITOR must be installed and scheduled as described in Installing SQL Server Performance Auditing Add-on topic in CHAPTER 2.
The following columns are displayed on the report:
1. Table Name – Full table name in dot notation, including database and schema names.
2. Beginning Size (MB) – Amount of space allocated for the table data and table indexes at the beginning of the reporting period. The size value is expressed in Mbytes.
3. Ending Size (MB) – Amount of space allocated for the table data and table indexes at the end of the reporting period. The size value is expressed in Mbytes.
4. Difference (MB) – The difference between the ending and beginning size expressed in Mbytes.
5. % Difference – The percentage difference between the ending and beginning size.
Top 20 Fastest Growing Tables by Row Count This report displays top 20 tables whose row count change percentage increased most during the chosen reporting period.
The report takes into account only tables whose row count keeps increasing over time and not

-39-
just a result of a single data load or temporary update. The report searches only tables that existed for at least 10 days and whose row count increased at least 10% and at least by 1000 rows during the chosen reporting period
This report can be used for server capacity planning, projecting space requirements and for performance tuning.
Report usage and requirements:
• Space statistics collection stored procedure and job DB_AUDIT.SP_SPACEMONITOR must be installed and scheduled as described in Installing SQL Server Performance Auditing Add-on topic in CHAPTER 2.
The following columns are displayed on the report:
1. Table Name – Full table name in dot notation, including database and schema names.
2. Beginning Row Count – Number of rows at the beginning of the reporting period.
3. Ending Row Count – Number of rows at the end of the reporting period.
4. Difference– The difference between the ending and beginning row counts.
5. % Difference – The percentage difference between the ending and beginning row counts.
Tables Experiencing Full-Table Scans This report returns database applications and tables that are subject to full table scans (in other words, applications that read all data in a table to find the required row). The report analyzes 5000 SQL queries most frequently executed during the chosen reporting period. It searches SQL queries that are causing full table scans either directly or indirectly via views.
The report takes into account all directly and indirectly executed SQL queries including nested calls (in other words, queries and stored procedures that are recursively invoked from other stored procedures, from user-defined functions and from triggers). In order to avoid false positives and skip add-hoc queries the report takes into account only queries executed at least 10 times during the chosen reporting period.
This report can be used for discovering frequently used tables with inadequate indexes and identifying how these tables are queried so that proper indexes can be built. The report can be also used for discovering tables that have proper but unused indexes. Unused indexes are often found in tables having stale distribution statistics, which might be causing the SQL Server query optimizer to pick inefficient query execution plans avoiding use of existing indexes.
Report usage and requirements:
• DB Audit system-level auditing must be installed and enabled.
• Performance audit events collection must be enabled. "Analyze executed SQL commands and RPC calls" event collector must be enabled. For more information on how to enable this see Installing SQL Server Performance Auditing Add-on topic in CHAPTER 2.
• Audit-time filters should not be used with the system-level auditing except these described in Configuring System Audit Options topic in CHAPTER 2.
-40-
The following columns are displayed on the report:
1. Program – Name of the program that executed the query.
2. Table Name – Full table name in dot notation, including database and schema names.
3. Row Count – Current number of rows in the table.
4. Total Runs – Number of times the program executed the query.
5. Table Scan Condition – The table scan condition, usually part of the JOIN or WHERE clause of the executed query or the WHERE clause of the referenced view or both.
Note: The condition indicates what data the database engine have been searching for but could not find a suitable index for a fast data search.
6. SQL Query – The actual SQL query causing full table scan on the referenced table.
Backup Duration Trends This report displays change in duration of database backup processes during the chosen reporting period.
The following method is used for building the trend graph: The chosen reporting period is split into numerous equal time short intervals and an average backup duration is counted for each interval. All calculated average values are then connected together.
This report can be used for server capacity planning and projecting future requirements.
Report usage and requirements:
• DB Audit system-level auditing must be installed and enabled.
• Performance audit events collection must be enabled. "Analyze executed SQL commands and RPC calls" event collector must be enabled. For more information on how to enable this see Installing SQL Server Performance Auditing Add-on topic in CHAPTER 2.
• Audit-time filters should not be used with the system-level auditing except these described in Configuring System Audit Options topic in CHAPTER 2.
Graph description:
A separate graph is displayed for each database that has been backed up at least twice during the chosen reporting period. Each graphs displays a trend line indicating duration of database backup as a function of time. Up to 3 databases are displayed on each report page. Use the vertical scroll bar or Page Down/Page Up keyboard buttons to scroll report pages and review individual database graphs.
Latest Backup Timing and Overlap This report displays timing and durations of last backups performed during the chosen reporting period. The report also displays Gantt graph that demonstrates how database backups are scheduled and whether there are any overlaps.

-41-
This report can be used for server load balancing, capacity planning and projecting future requirements.
Report usage and requirements:
• DB Audit system-level auditing must be installed and enabled.
• Performance audit events collection must be enabled. "Analyze executed SQL commands and RPC calls" event collector must be enabled. For more information on how to enable this see Installing SQL Server Performance Auditing Add-on topic in CHAPTER 2.
• Audit-time filters should not be used with the system-level auditing except these described in Configuring System Audit Options topic in CHAPTER 2.
The following columns are displayed on the report:
1. Database Name – Name of the database.
2. Start Time – Backup start time.
3. End Time – Backup end time.
4. Duration – Backup duration that is a difference between the End Time and Start Time values expressed as a time value.
Graph description:
A Gantt graph displays horizontal bar for each database whose starting point matches backup start time and ending point matches backup end time.
Overlapping SQL Agent Jobs This report displays timing and durations of SQL jobs that ran on the last day of the chosen reporting period. The report takes into account only T-SQL jobs take at least 10 minutes to run and create noticeable load on the server (CPU time exceeds 5 seconds). Multiple T-SQL steps of the same job are considered as if they were separate jobs.
The report also displays Gantt graph that demonstrates how jobs are scheduled and whether there are any overlaps.
This report can be used for server load balancing, capacity planning and projecting future requirements.
Report usage and requirements:
• DB Audit system-level auditing must be installed and enabled.
• Performance audit events collection must be enabled. "Analyze executed SQL commands and RPC calls" event collector must be enabled. For more information on how to enable this see Installing SQL Server Performance Auditing Add-on topic in CHAPTER 2.
• Audit-time filters should not be used with the system-level auditing except these described in Configuring System Audit Options topic in CHAPTER 2.

-42-
The following columns are displayed on the report:
1. Job Name – Name of the job and the T-SQL step.
2. Start Time – Backup start time.
3. End Time – Backup end time.
4. Duration – Backup duration that is a difference between the End Time and Start Time values expressed as a time value.
Graph description:
A Gantt graph displays horizontal bar for each job whose starting point matches the step Start Time and ending point matches the step end time.
Database Errors and Exceptions
This report displays all database errors and exceptions that occurred during the chosen reporting period. The report takes into account only high severity error whose severity level is 10 or more points.
Note: Severity level is a user-defined value that can be used with RAISERROR system function. Errors reported by SQL Server system stored procedures usually have severity level 16 and up. Severity levels from 0 through 18 can be used by any user. Severity levels from 19 through 25 are used only by members of the sysadmin fixed server role. Severity levels from 20 through 25 are considered fatal.
This report can be aid in database troubleshooting.
Report usage and requirements:
• DB Audit system-level auditing must be installed and enabled
• Audit of error events and exceptions must be enabled. For more information read Configuring System Audit Options topic in CHAPTER 2.
The following columns are displayed on the report:
1. Error # – Error number.
2. Time – Time when the error occurred.
3. Error Message – Error message as it appears in sysmessages table.
4. SPID – system process id of the database session, commonly called SPID.
5. Login Name – User login name.
6. OS User Name – User network or operation system name.
7. Terminal – Name of the network computer running the program that experienced the error. This is what is also commonly called Host.
8. Program – Name of the program that experienced the error.
9. Object Type – Type of the object where the error occurred. This could be NULL if an error is

-43-
not object specific.
10. Object Name – Name of the object where the error occurred. If applicable, the name is reported in dot notation, including database and schema names.
11. Message Data – Error specific message data that are used with the Error Message parameter.
Note: See RAISERROR topic in your SQL Server Books documentation for more information on how error message and message data are used.

APPENDIX A, Technical Support
-44-
APPENDIX A, Technical Support
Your questions, comments, and suggestions are welcome.
For technical support email to [email protected] or use the on-line support form at http://www.softtreetech.com/Support.htm.
Please include your complete contact information when contacting us by email or fax:
Name___________________________________________________________________
Company________________________________________________________________
Address_________________________________________________________________
City, State/Zip, Country_____________________________________________________
Phone__________________________________________Fax______________________
Email____________________________________________________________________
Best Time to Reach you (specify time zone) _____________________________________
Operating System Information:
Which Client operating system are you using: MS Windows 95/98/Me/NT/2000/XP_______
Which DBMS and version are you connecting to: Oracle/SQL Server/ASE/ASA/DB2 _____
What is the host operation system on the computer running your DBMS: _______________
When reporting problems, please provide as much information as possible. Be sure to include the following information:
1 Is the problem reproducible? If so, how can this be reproduced? (detail each step)
2 What version of DB Audit Expert are you using?
3 If a dialog box with an error message was displayed, please include the full text of the dialog box, including the text in the title bar.
4 If the problem involves an external program, provide as much information as possible on this program.
Please include the serial number for your copy of DB Audit Expert. Use Help/About menu to look up the correct numbers. Registered users have priority support.
For registration information, purchasing or other sales information, please contact our sales department: [email protected] or dial +1 718 980-1827.
For general information, software updates, the latest information on known problems, and answers to frequently asked questions visit the DB Audit home page on the Web: http://www.softtreetech.com/dbaudit/.

APPENDIX A, Technical Support
-45-
We’re happy to help in any way we can, but if you’re having problems please check the DB Audit FAQ section first to see if your question is answered there.

APPENDIX B, Hardware and Software Requirements
-46-
APPENDIX B, Hardware and Software Requirements
Minimum Requirements
Client (DB Audit Management Console)
1 Intel or AMD-based workstation or server running one of the following operating system: • Windows 2003 • Windows XP • Windows 2000 • Windows NT 4.0 • Windows 95 • Windows 98 • Windows Me
2 At least 128 MB RAM
3 19 MB disk space for full installation
4 VGA monitor
5 Required database client software, either of the following: Windows 2003 • DB-Lib • ADODB (MDAC 2.1 or better) • ODBC
Note: If ODBC database interface is used, ODBC and ODBC database connectivity driver
Database Server
Any of the supported database servers: • Microsoft SQL Server 2000 • Microsoft SQL Server 2005

APPENDIX C, Licensing
-47-
APPENDIX C, Licensing
LICENSE TYPES
Management Console Single Server License: (1 Workstation & 1 Server)
Permits the license holder to install and use DB Audit Expert Management Console on 1 workstation, and to use that installation to manage and view auditing on a single local or network-connected database server.
Report Viewer Single User License: (1 Workstation & Unlimited Servers)
Permits the license holder to install and use DB Audit Expert Report Viewer application on 1 workstation, and to use that installation to run built-in reports as well as create, modify and run user-defined audit reports on an unlimited number of network-connected database servers.
Site License: (Unlimited Workstations & Unlimited Servers)
Permits the license holder to install and use DB Audit Expert on unlimited workstations within one geographical location such as office or building, and to manage and view auditing on an unlimited number of network-connected database servers.
SOFTWARE PRODUCT SINGLE USER LICENSE Copyright laws and international copyright treaties, as well as other intellectual property laws and treaties protect this SOFTWARE PRODUCT. The SOFTWARE PRODUCT is licensed, not sold. CAUTION: Loading this software onto a computer indicates your acceptance of the following terms. Please read them carefully. GRANT OF LICENSE: SoftTree Technologies, Inc. ("SoftTree Technologies") grants you a license to use the software ("Software"). A single person may personally use one registered copy of DB Audit Expert on one computer. Alternately, this Software may also be installed on a single workstation that is not used simultaneously by many users at the same time. RESTRICTIONS: Unregistered versions (shareware licensed copies) of the Software may be used for a period of not more than 30 days. After 30 days, you must either stop using the Software, or purchase a validly licensed copy. You must maintain all copyright notices on all copies of the Software. You may not sell copies of the Software to third parties without express written consent of SoftTree Technologies and under SoftTree Technologies' instruction. EVALUATION copies may be distributed freely without charge so long as the Software remains whole including but not limited to existing copyright notices, installation and setup utilities, help files, licensing agreement, In executing such an act as distributing without the similar copyright or license violation, to the maximum extent permitted by applicable law you may be held liable for loss of revenue to SoftTree Technologies or SoftTree Technologies' representatives due to loss of sales or devaluation of the Software or both. You must comply with all applicable laws regarding the use of the Software. COPYRIGHT: The Software is the proprietary product of SoftTree Technologies and is protected by copyright law. You acquire only the right to use the Software and do not acquire any rights of ownership.
APPENDIX C, Licensing
-48-
For your convenience, SoftTree Technologies provides certain Software components in the source code format. You may customize this code for your environment, but you agree not to publish, transfer, or redistribute in any other form both the original code and the modified code. You agree not to remove any product identification, copyright notices, or other notices or proprietary restrictions from the Software. You agree not to cause or permit the reverse engineering, disassembly, or decompilation of the Software. You shall not disclose the results of any benchmark tests of the Software to any third party without SoftTree Technologies' prior written approval. DESCRIPTION OF OTHER RIGHTS AND LIMITATIONS: You may not rent, lease or transfer the Software except as outlined under GRANT OF LICENSE - use and copy. Without prejudice to any other rights, SoftTree Technologies may terminate this Software LICENSE if you fail to comply with the terms and conditions of this Software LICENSE. In such event, you must destroy all copies of the Software and all of its component parts. WARRANTY DISCLAIMER: SoftTree Technologies provides this license on an "as is" basis without warranty of any kind; SoftTree Technologies disclaims all express and implied warranties, including the implied warranties of merchantability or fitness for a particular purpose. LIMITATION OF LIABILITY: SoftTree Technologies shall not be liable for any damages, including direct, indirect, incidental, special or consequential damages, or damages for loss of profits, revenue, data or data use, incurred by you or any third party, whether in an action in contract or tort, even if you or any other person has been advised of the possibility of such damages. SoftTree Technologies, Inc. Ilyce Ct 62, Staten Island NY, 10306 USA Copyright 1999-2005 (c) SoftTree Technologies, Inc. All Rights Reserved