
Performance Audit on Supply and Infrastructure Development for ...
121
Transcript of Performance Audit on Supply and Infrastructure Development for ...


i
Contents
Chapter Particular Page No. Preface iii Executive Summary v-xi
Chapter-1 Natural Gas - An Overview 1-6
1.1 NG Reserves in the country 1 1.2 Domestic Production of NG 2 1.3 National Demand for NG 2 1.4 Consumption of NG 4 1.5 India Hydrocarbon Vision 2025 5 1.6 Regulatory Framework 6
Chapter-2 Audit Framework 7-9
2.1 Audit Objectives 7 2.2 Scope of Audit 8 2.3 Audit Criteria 8 2.4 Response to Draft Audit Report 9
Chapter-3 Infrastructure Development 11-29
3.1 Transnational Pipelines 11 3.2 R-LNG Infrastructure 13 3.2.1 Initiatives for creating R-LNG Infrastructure 13 3.2.2 Development of R-LNG Infrastructure 14 3.2.3 Development of R-LNG Infrastructure after India Hydrocarbon
Vision 2025 16
3.3 Pipelines 20 3.3.1 Regional Imbalance in pipeline Infrastructure 21
3.3.2 Non Development of Gas Grid 21
3.3.3 Pipeline Policy 22
3.3.4 Authorization of pipelines by MoPNG 23
3.3.5 Authorization of Pipelines by PNGRB 27
3.3.6 Lack of effective monitoring of pipeline projects 28
Chapter-4 Impact of non-availability of NG/R-LNG 31-40
4.1 Fertilizer Sector 31
4.1.1 Payment of subsidy on imported Urea 32
4.1.2 Increase in cost of production due to use of costlier feedstock 35
4.2 Power Sector 36
4.3 Pipeline Infrastructure Providers 39

ii
Chapter-5 Supply of Natural Gas 41-56
5.1 Gas Allocation/Utilization Policy 41 5.2 Role of GAIL (India) Ltd. in supply of NG at regulated price 42 5.3 Absence of mechanism for monitoring end use of NG 43 5.3.1 Fertilizer Sector 43 5.3.2 Power Sector 47 5.3.3 Small Scale Consumers 50 5.4 Low off-take of allocated quantity by fertilizer units 51 5.5 Marketing Margin on supply of NG 54
Chapter-6 Conclusion and Recommendations 57-59
6.1 Conclusion 57 6.2 Recommendations 58 Annexure- 1 to 26 61-95
Glossary 97-100
Abbreviations 101-103

iii

Report No. 6 of 2015
v
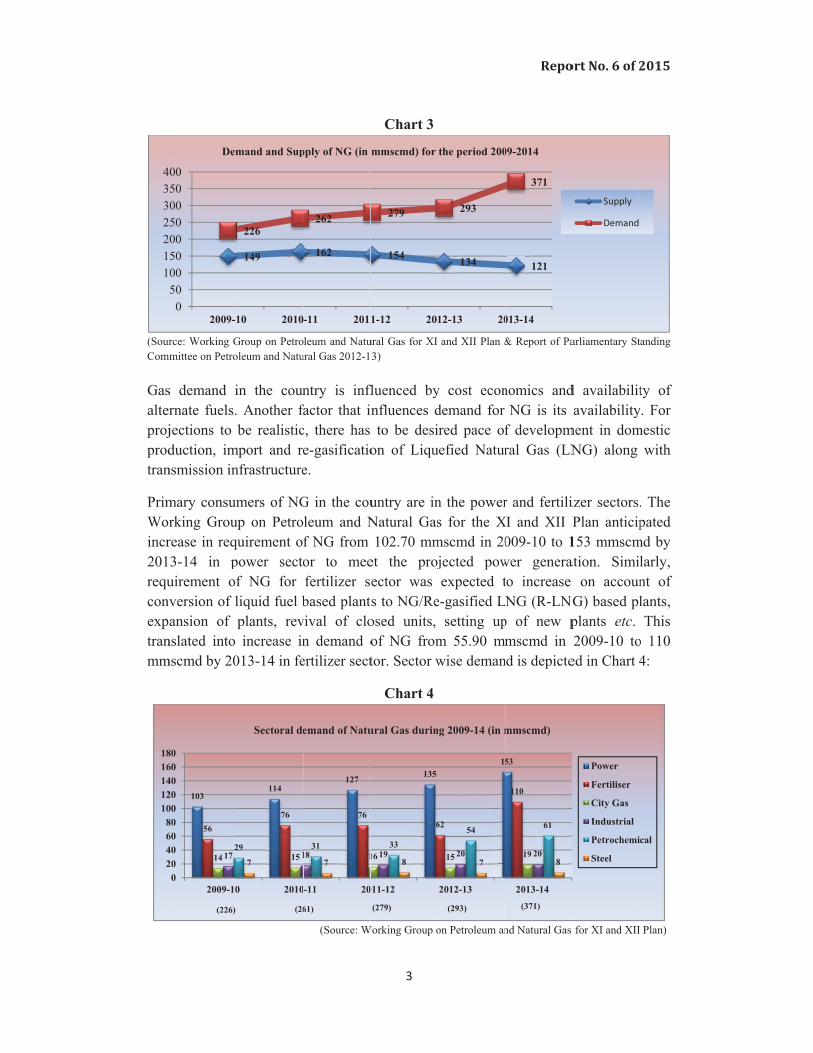
Natural Gas (NG), one of the cleanest, safest and most useful of fossil fuels is being increasingly used in various sectors like fertilizer, power, city gas, steel and other heavy industries. Primary consumers of NG in the country are in the power and fertiliser sectors (62 per cent) which are critical to economic development of the country. The Working group on Petroleum and Natural Gas for the XI and XII Plan anticipated increase in requirement of NG in the fertilizer sector to meet expected increase on account of conversion of liquid fuel based plants to NG/re-gasified LNG (R-LNG) based plants, expansion of plants, revival of closed units, setting up of new plants etc. Similarly, increase in requirement of NG was expected to meet the projected power generation.
Demand for NG in the country was far in excess of its supply from domestic as well as imported sources taken together and gap between demand and supply was 77 Million Metric Standard Cubic Metre per day (mmscmd) in 2009-10. Consequent upon reduction in production from domestic fields from 2011-12, this gap between demand and supply widened further to 250 mmscmd in 2013-14. As domestic demand was far in excess of indigenous production and there were very few new domestic sources available to cater to additional demand, options available to meet the demand were import of NG through transnational pipelines and import of Liquefied Natural Gas (LNG). Government of India (GoI) initiated steps for import of gas through Trans-National pipelines (1989) and for import of LNG (1995) anticipating shortfall in domestic production.
With a view to having a long term policy on Hydrocarbons, a Group of Ministers (GoM) was set up in 1999 for working out a specific framework for developing “India Hydrocarbon Vision- 2025”. The report submitted by GoM (2000), inter alia, set objectives for NG sector which included steps to ensure adequate availability of a mix of domestic gas, gas imported through pipelines and Re-gasified Liquefied Natural Gas (R-LNG). It suggested various initiatives for import of gas from neighbouring and other countries, expedite setting up of a regulatory framework and encourage domestic companies to participate in LNG chain.
Further, to provide adequate infrastructure for supply of NG, GoI conceptualised (2000) a National Gas Grid to facilitate supply of NG to remote areas of the country. Subsequently, considering the need to provide a policy framework for the future growth of pipeline infrastructure to facilitate evolvement of a nationwide gas grid, GoI notified a Pipeline Policy in 2006. In order to provide regulatory and legal framework for downstream activities, GoI enacted (March 2006) the Petroleum and Natural Gas Regulatory Board (PNGRB) Act and established PNGRB (October, 2007).
Executive Summary

Report No. 6 of 2015
vi
Coming to the sale of products that use NG, the selling price of Urea is controlled by GoI which bears subsidy on the difference between the sale price and the cost of production. Similarly, the price of power is regulated by Electricity Regulatory Commissions. Against this background, a Performance Audit on "Supply and Infrastructure Development for Natural Gas" was conducted with a view to ascertaining:
Whether GoI has played its wider role in providing adequate pipeline and R-LNG infrastructure to cope with emerging demand in the country;
The impact of non-availability of NG/R-LNG on Fertilizer/Power Sector and pipeline infrastructure providers; and
Whether NG allocation and utilization policies of GoI were effective to meet the requirement of NG across the country.
Significant audit findings which emerged from the Performance Audit are narrated below: I. Infrastructure Development:
A. Pipeline infrastructure: a. GoI set up PNGRB in October 2007 as a regulator but notified Section 16 of
PNGRB Act (the Act), empowering PNGRB to issue authorisations for new pipelines, only in July 2010. This delay of 33 months acted as a hindrance in development of cross-country pipelines and associated infrastructure, as in the intervening period neither GoI nor PNGRB was able to authorize any project despite demand. This is evident from the fact that even as GSPL/GAIL expressed interest between November 2008 and September 2009 for laying four pipelines, PNGRB was not in a position to issue authorisation on account of non-notification of Section 16 of the Act till July 2010. These projects were subsequently authorised by PNGRB between July 2011 and April 2012, after notification of Section 16 of the Act.
(Para 3.3.5)
b. Till the time PNGRB became fully operational with adequate legal mandate, GoI issued authorisations in 2007 for nine pipeline projects. In respect of five out of these nine pipeline projects, respective entities did not commence execution even after lapse of more than six years since authorization. Audit analysis revealed that authorisations were given without setting a definite start and target date for completion. There was considerable delay in taking administrative decisions (five projects by GAIL) to go ahead with the project as there was delay in determining availability of gas source. In respect of

Report No. 6 of 2015
vii
remaining four projects, Reliance Gas Transmission Infrastructure Limited (RGTIL) did not speed up execution of project, citing non development of City Gas Distribution projects and non availability of NG. Thus pipeline infrastructure which is a prerequisite for development of gas market was not taken up for development.
(Para 3.3.4) c. Out of total 23 corridors identified (2000-2011 under National Gas Grid) for
completion till 2013-14, seven pipelines were completed, six were at different stages of construction and 10 pipelines were yet to be taken up (October 2014).
(Para 3.3.6) B. R-LNG Terminals
GoI created (1997) Petronet LNG Limited, a public limited company, with a mandate to set up LNG terminals for import and regasification of LNG. Twelve other entities also obtained clearance (1997-2000) from Foreign Investment Promotion Board (FIPB) for setting up LNG terminals across the country. A regulatory framework as envisaged in the "India Hydrocarbon Vision 2025" was lacking to authorise entities to set up facilities. Though PNGRB was set up in 2007, GoI took more than five years in taking an executive decision (October 2012) for fixing eligibility conditions of entities to apply for registration to establish and operate LNG terminals. In the absence of regulatory framework and a mechanism to review the progress of LNG projects, progress in this regard was very slow and MoPNG was not able to monitor the LNG projects, for which clearance was given.
(Para 3.2.1 and 3.2.2)
We recommend that:
1. MoPNG should develop a mechanism, with clearly defined responsibility centres, in coordination with implementing agencies and authorities, to ensure and assess timely completion of NG pipeline and R-LNG projects across the country and cut down delays so that the desired growth in the NG sector is achieved.

Report No. 6 of 2015
viii
II. Impact of Non-availability of NG/R-LNG on fertilizer sector
Sale price of Urea products is controlled by GoI which bears subsidy. NG is considered the most suitable feedstock for producing urea. Urea production in the country remained by and large stagnant during XI Plan. To enhance domestic production capacity, GoI formulated various schemes envisaging new plants, expansion of existing units and revival of closed units through which production capacity of urea was to be enhanced by approximately 122 Lakh Metric Tonne Per Annum (LMTPA) in different stages from 2010-11 to 2012-13 through NG based urea plants.
(Para 4.1.1)
Non availability of NG, however, remained one of the main constraints in increasing indigenous production capacity of urea. Out of envisaged enhancement of production capacity of 122.25 LMTPA of urea during XI Plan, achievement was negligible, at only 3.30 LMTPA. Though it was evident that subsidy on import of urea was higher than subsidy on domestic production, action taken by GoI to facilitate import NG/LNG and produce urea through NG was not adequate. This was mainly due to shortfall in materialisation of plans for LNG terminals, re-gasification facilities, construction of pipelines and facilitating long term agreements to make available NG/RLNG. Such a situation led to non-enhancement of urea production capacity and consequently led to import of urea to meet the gap between demand and availability. Thus, the objective of enhancement of production capacity of urea production through use of NG as feedstock could not be achieved. During the period 2011-12 and 2012-13, the actual domestic production was only 445.58 LMT against the requirement of 604.36 LMT. The shortfall of 158.78 LMT was imported. Accordingly, due to non-expansion of urea production capacity as envisaged, GoI lost an opportunity of saving subsidy by ` 4202.12 crore for the same period even after taking into account Capital Related Charge taken on basis of estimated investment in expansion, revamp and revival projects.
(Para 4.1.1)
GoI in its policy for stage III of new pricing scheme for urea manufacturing units (2007) targeted conversion of all existing (nine units) naphtha and FO/LSHS based units to NG/RLNG based within a period of three years (by 2009-10) with a view to reducing the cost of production and subsidy burden. Uninterrupted supply of NG at affordable price to the plant is a prerequisite for such conversion. Owing

Report No. 6 of 2015
ix
to absence of adequate pipeline connectivity and non-availability of gas, there was delay in conversion of all units planned. Out of the nine units planned for conversion, five units converted to gas during 2012-13 and one unit was converted in 2013-14. Resultantly, urea units continued production by using costlier feedstock. This resulted in loss of opportunity to reduce subsidy burden by ` 7673.82 crore on the exchequer during 2010-11 to 2012-13, by the units which were not converted, even after taking into account Capital Related Charge taken on the basis of estimated investment required for planned conversions.
(Para 4.1.2)
III. Impact of non availability of NG/R-LNG on Power Sector
As per National Electricity Policy, use of NG as fuel for power generation depends on its availability at reasonable price. It was envisaged that new power generation capacity based on indigenous NG at reasonable price could emerge. The existing power plants using liquid fuel were to shift to use of NG or R-LNG at the earliest to reduce cost of generation. During XI Plan, the actual capacity addition of gas based plants was 5936 MW including projects carried over from X Plan. Against the total requirement of 90.70 mmscmd NG for operating these plants at 90 per cent PLF, actual availability was 40 mmscmd only. Steps taken to meet shortage of NG viz. import of NG/R-LNG at affordable rate were inadequate and led to a situation where gas based power plants suffered generation loss of 66,129 Million Units during 2008-09 to 2012-13. Financial impact on account of above loss of generation could not be worked out by Audit as cost of production as well as supply price of electricity varies from state to state.
(Para 4.2)
Where there is provision for use of alternate fuel in gas based plants, generation loss on account of non-availability of NG was compensated by using Naphtha and HSD. As cost of these liquid fuels is comparatively higher, cost of power is proportionately increased. During 2008-09 to 2012-13, gas based plants had used 31.35 Lakh Kilo Litres Naphtha and 5.01 Lakh Kilo Litres of HSD to make up non-availability of NG/R-LNG. Based on the computation of cost of power by ‘Expert Committee on Fuels for Power Generation’, increase in cost of power due to using Naphtha instead of R-LNG at long term contract rate would work out to an estimated ` 2375.33 crore during 2010-11 to 2012-13 which was ultimately passed on to consumers.
(Para 4.2)

Report No. 6 of 2015
x
(Para 4.2)
IV. Supply of Natural Gas
A. Absence of mechanism for monitoring end use of NG Power and Fertilizer sectors receive about 69 per cent of domestic gas at Administered Price Mechanism (APM) price through allocation.
a. MoPNG directed (June 2006) that as far as power sector consumers were concerned, APM price would be applicable only for those quantities of gas which were used for generation of electricity for supply to the grid for distribution to consumers through public utilities/licensed distribution companies and market rate was to be charged for NG used for other than above purpose.
(Para 5.3.2)
b. MoPNG directed (July 2006) that products other than fertilizers were not covered under supply of APM and the quantity of APM gas utilized for manufacturing products other than fertilizers should be charged at market price. However, there was no mechanism available to ensure compliance to above instructions either with MoPNG/DoF or GAIL, as a result of which there was under recovery in gas pool account to the extent of ` 630.60 crore in the cases of mis-utilisation of NG revealed in limited test check by Audit.
(Para 5.3.1 to 5.3.3)
c. Cases of underutilization of available NG were noticed during test check in Audit which not only resulted in loss of production but also led to import of
We recommend that:
2. MoPNG in coordination with DoF and MoP may consider setting up of Inter Ministerial Committee that could suggest:
i. A time bound action plan for synchronising implementation of NG pipeline projects and revival of fertilizer units so that benefit of NG as feedstock may be derived optimally besides reducing import of urea.
ii. Measures to create required infrastructure to provide NG/R-LNG to Power Sector at affordable price so that capacity created in the sector is adequately utilised.

Report No. 6 of 2015
xi
more urea. This led to payment of extra subsidy (` 637.07 crore) as the subsidy paid on imported urea was more than the subsidy paid on indigenously produced urea.
(Para 5.4)
B. Marketing Margin on supply of NG Marketing Margin on supply of domestic NG for GAIL was approved by GoI in Rupee terms, whereas the Contractor for KG D6 block was charging marketing margin in US dollar terms. DoF was not reimbursing marketing margin as demanded by the Contractor to the fertilizer units and subsidy claims on account of marketing margin on KGD6 gas were pending since 2009-10. If DoF decides to reimburse marketing margin as demanded by the Contractor and requested by fertilizer units, additional subsidy burden would be ` 201.40 crore from May 2009 to March 2014, being the difference between marketing margin demanded by the Contractor and marketing margin allowed to GAIL.
(Para 5.5)
We recommend that:
3. MoPNG may work out modalities by involving all the implementing agencies for implementing a control system/mechanism to detect and prevent diversion/mis-utilization of NG supplied at regulated price. The modalities so worked out may also include decision on rate at which recovery would be made for utilisation of such NG for other than specified purposes as there would be no difference between APM and non-APM price with effect from November 2014.
4. GAIL may critically review NG supply contract management system and put in place specific measures, such as incorporation of a clause in Gas Sales and Transmission Agreement enabling GAIL to verify end use of NG and reviewing Article 17 that permits buyer to use the NG for purposes other than those contemplated with mutual agreement between buyer and seller etc., that would empower it adequately to track ultimate utilisation of NG supplies at regulated price and prevent its diversion towards unauthorised purposes.
5. MoPNG should ensure that same methodology, i.e. charging marketing margin in Indian Rupee, is adopted for supply of NG from domestic source for use in sectors where GoI bears subsidy burden.


Natucleahydincrheav(Ch
1.1
As pend sharindiand wor
1 R
re2 C
th
ural Gas (Nanest, safesdrocarbon greasingly bevy industrie
hart 1) in 20
per ‘BP Staof Decemb
re of India icated that lthat for Ind
rld was 24 p
Represents those ecovered in the fu
Computed based ohe result is the len
55%
1%
Pe
Backg
NG r
NG) is a vitast and mostgases, primeing used ines etc. It’s s13 which is
atistical Reber 2013 wa
was 1.4 Tlength of timdia would bper cent in t
quantities of NG
uture from knownon the assumptionngth of time that
%
%5%
ercentage share
ground
reserves i
Chapter
al component useful of
marily methn various seshare in thes expected to
view of Woas 185.7 trillTCM, less tme for thesebe 40 years.the year 201
G that geologicaln reservoirs undern that if reserve rremaining reserv
2%e of various fue
n the cou
N1
1
nt of the wof fossil fuehane. It is ectors e.g. Fe energy bao increase t
Chart 1
(Source: B
orld –June lion cubic mthan one pee reserves t Share of N
13 as agains
l and engineeringr existing economremaining at the ves would last if p
29%
8%
el consumption
untry
Natural G
orld's supplels. NG is
gaining imFertilizer, Posket of the to 20 per ce
BP Statistical Re
2014’, provmeter (TCMer cent. Reto last for thNG in the prst eight per
g information indmic and operatingend of any year iproduction were t
n in India durin
Gas – An O
Repo
y of energya combust
mportance dower, City Gcountry want by 2024-
eview of World
ved reserveM) in the wo
serves to phe world worimary energcent in Indi
dicates with reasg conditions. is divided by the to continue at tha
ng 2013
Oil
Natural
Coal
Nuclea
Hydro E
Renewa
Overview
ort No. 6 of 2
y. It is one otible mixturday-by-dayGas, Steel, as eight per-25.
d - June 2014)
es1 of NG aorld out of wproduction rould be 55 yrgy supply iia.
sonable certainty
e production in that rate.
l Gas
ar Energy
Electricity
wable
2015
of the re of
y and other
r cent
at the which ratio2 years in the
can be
hat year,

Rep
1.2
ProdNat(ONLicedomCha
GasJV prodwouwhi 1.3
Dem37177 msour
3 In4 M
port No. 6 o
duction of Nional Oil C
NGC) and Oensing Poli
mestic gas part 2:
s productionfields (KG
duction fromuld be in thich is not co
mand of NG mmscmd dmmscmd inrces decline
ndian Petroleum a
Million Metric Sta
01020304050607080
Natio
D
f 2015
NG in the cCompanies Oil India Licy (NELP) production
(Source
n peaked in G D6 basinm KG D6 he range ofommensurat
G was 225.5during 2013
n 2009-10 toed over the y
and Natural Gas andard Cubic Me
60
50
2009-10
Domestic
(110)
onal dem
Domestic
country is m(NOCs) v
imited (OILblocks likeduring the
e: Natural Gas P
2010-11 mn). Thereafbasin. As
f 129 mmste with proje
52 mmscmd3-14. Gap b
o 250 mmscyears as ind
Statistics 2012-13ter per day
68 71
2010-11
NG productio
(139)
and for N
producti
2
mainly fromviz. Oil anL), Panna-Me KG D6 an
period 200
Chart 2
Production Data
mainly due tfter, there per project
scmd4 in 20ected dema
d during 200between de
cmd in 2013dicated in C
3
68
59
2011-12
on in India dur
(127)
NG
ion of NG
m the nominnd Natural Mukta-Taptind from few09-10 to 20
a from Petroleu
to increase has been
tions3, the i014-15 andand as discu
09-10 whichemand and s3-14. SupplyChart 3:
70
39
2012-13
ring 2009-14 (in
(109)
G
nated fields Gas Corpo
i and New Ew small fie013-14 was
um Planning and
in productioconsiderab
indigenous 139 mmsc
ssed below.
h progressivsupply alsoy from dom
69
26
2013-14
n mmscmd)
(95)
operated boration LimExploration
elds. The ovs as depicte
d Analysis Cell
on from prible reductio
gas availabcmd in 201.
vely increaso increased
mestic and im
ONGC+OIL
Pvt/JVCs
y the mited n and verall ed in
l)
ivate/ on in bility 15-16
sed to from
mport
L
(SourComm
Gasalterprojprodtran
PrimWorincr201requconvexptranmm
1122334
2468
1012141618
rce: Working Gmittee on Petro
s demand irnate fuels.jections to duction, im
nsmission in
mary consumrking Grourease in req3-14 in puirement ofversion of lansion of
nslated into mscmd by 20
05000500050005000
2009-1
103
56
14 172
0204060800020406080
2009-10
(226)
Dem
Group on Petrooleum and Natu
in the coun. Another fabe realistic
mport and renfrastructure
mers of NGup on Petroquirement ofpower sectof NG for liquid fuel bplants, revincrease in
013-14 in fe
149
226
10 2010
114
76
15 129
7
0 2010
(26
mand and Sup
Sectoral de
leum and Natuural Gas 2012-1
ntry is inflfactor that inc, there has e-gasificatioe.
G in the couleum and Nf NG from or to meefertilizer sebased plant
vival of clon demand oertilizer sect
(Source: W
162
262
-11 2011
127
76
11831
7
-11 20
61)
pply of NG (in
emand of Natu
3
Chart 3
ural Gas for XI 3)
fluenced bynfluences dto be desi
on of Liqu
untry are inNatural Gas102.70 mm
et the projector was s to NG/Reosed units, of NG fromtor. Sector w
Chart 4
Working Group o
154
279
1-12 201
135
6
16 1933
8
011-12
(279)
mmscmd) for
ural Gas durin
and XII Plan &
y cost econdemand for red pace of
uefied Natur
n the powers for the X
mscmd in 20jected powexpected t
e-gasified Lsetting up
m 55.90 mmwise deman
on Petroleum an
134
293
12-13 20
15
62
15 20
54
7
2012-13
(293)
the period 200
ng 2009-14 (in m
Repo
& Report of Pa
nomics andNG is its
f developmral Gas (LN
r and fertiliXI and XII P
009-10 to 1wer generatto increase NG (R-LNG
p of new pmscmd in
nd is depicte
nd Natural Gas
121
371
013-14
53
110
19 20
61
8
2013-14(371)
09-2014
mmscmd)
ort No. 6 of 2
arliamentary St
d availabilitavailability
ment in domNG) along
izer sectors.Plan anticip
153 mmscmation. Simi
on accounG) based plplants etc. 2009-10 to
ed in Chart 4
for XI and XII
Supply
Demand
Power
Fertiliser
City Gas
Industrial
Petrochemi
Steel
2015
anding
ty of y. For mestic
with
. The pated
md by larly, nt of lants, This
o 110 4:
Plan)
cal

Rep
Demimpand did
Mindue the supp
ThetermfeedrelaprodCha
1.4
Thefertiprod
NG hightheris pr
Detin C
port No. 6 o
mand of NGport in the fo
lack of devnot improv
nistry of Peto high pridemand ofply gap of N
e reply needm contracts dstock/fuel ated to availduction in apter 3 and 4
e prime conilizer units duction of p
is the mohest hydrogreafter urea referred in p
ails of consChart 5 (in te
Con
f 2015
G is met priorm of LNGvelopment o
ve in proport
etroleum anice of LNGf NG was fNG could no
ds to be vieis economused in th
lability of invarious sec4.
nstituent ofand as fu
petrochemic
st preferredgen to carbo
is manufacpower secto
sumption oferms of per
12
8
5
2
Sectorwise c
nsumptio
imarily throG. As there of import ation to incre
d Natural GG, few custofor indigenoot be met by
ewed againmical as comhe absence nfrastructurctors by us
f NG is meuel in powecals and liqu
d feedstockn ratio. Hydtured with t
or for its hig
f NG/R-LNGrcentage):
11consumption o
on of NG
4
ough indigewas reduct
and re-gasifiease in dem
Gas (MoPNomers wereous gas andy R-LNG, a
nst the factsmpared to Nof NG and
re and thereing R-LNG
ethane, wher plants. Nuefied petro
k for producdrogen is usthe reactiongh thermal e
G by variou
Chart 5
36
26
of NG during
nous produion in produ
fication infrmand.
NG) stated (e willing to d not for R-as demand w
s that (i) LNNaphtha whd (ii) Demae was opporG. This has
hich is usedNG is alsooleum gas (L
ction of fersed for the pn of ammonefficiency a
us sectors d
(Source: MoPN
2013-14 (in p
uction and suction fromastructure f
(July 2014)purchase R
-LNG. The was highly p
NG procurehich is the and for R-Lrtunity for s
been discu
d as feedstoused as f
LPG).
rtilizers becproduction oia with carbnd lower em
during 2013
NG Annual Rep
ercentage)
Fe
Po
Cit
Re
Pe
Ste
Ot
supplementem domestic ffor LNG, su
) that at preR-LNG. Mo entire demprice sensit
ed through major alte
LNG is closaving in coussed furth
ock and fufeedstock in
cause it haof ammoniabon dioxidemissions.
-14 are dep
port 2013-14)
ertiliser
ower
ity Gas
efineries
etrochemical
eel
thers
ed by fields upply
esent, ost of mand-ive.
long ernate osely ost of her in
uel in n the
as the a and
e. NG
picted

It mLNGthei
Shoprodin p
1.5 ‘Indof Ienv'Vis
To abe i
may be seen G availableir respective
(Source: Work
ortfall in sduction due
paragraphs 4
dia HydrocaIndia (GoI) isaged a de
sion' inter-a To enco To ensu
import achieve thenitiated:
Timely policy i
Pursuinneighbo
Expedit Import
compan Provide
transpo
0
50
100
150
200
Ind
that powere in the coue demands d
king Group on Pe
supply of e to use of c4.1 and 4.2.
arbon Visioto recomm
emand of abalia includedourage use oure availabiof LNG.
e above obje
and contininterventionng diplomaouring and oting setting LNG to su
nies to partie a level rtation tarif
153
Powe
Dem
dia Hydro
r and fertilizntry. Averaduring 2013
troleum and Natu
NG/R-LNGcostlier feed
on 2025’ (Vmend a longbout 391 md: of NG. lity by a mi
ectives, the
nuous reviewns. atic and pother countrup of a regu
upplement dcipate in LNplaying fie
ffs.
31
er
mand and Ava
ocarbon V
5
zer sectors cage availabi3-14 is indic
Chart 6
ural Gas XI and X
G adverseldstock in fe
Vision) formg term polic
mmscmd NG
ix of domes
following m
w of gas de
political inries with emulatory fram
domestic gaNG chain. eld to all
110
Fertil
ailability of NG
Vision 202
consumed aility, howevcated in Cha
XII Year Plan & M
ly affected ertilizer and
mulated (Macy framewo
G by 2020-2
stic gas, imp
medium and
emand and
nitiatives fmphasis on tmework. as availabili
gas player
43
iser
G (in mmscm
25
Repo
about 62 pever, to theseart 6:
MoPNG Annual R
productiond power sec
arch 2000) ork for hydr25. Objectiv
ports throug
d long term
supply opti
for import transnationa
ty and enco
rs and ens
D
A
d in 2013-14)
ort No. 6 of 2
er cent of Ne sectors ag
Report 2013-14)
on and cosctor as discu
by Governrocarbon seves envisag
gh pipelines
m actions we
ions to faci
of gas al gas pipeli
ourage dom
sure reason
Demand
Availability
2015
NG/R-gainst
st of ussed
nment ector, ed in
s and
ere to
ilitate
from ines.
mestic
nable

Report No. 6 of 2015
6
Action taken by GoI in line with the above particularly in assessment of demand, allocation of scarce resource, setting up NG/R-LNG facilities and regulatory framework etc. has been reviewed and commented in the Report.
1.6
NG is a scarce resource and GoI plays an important role in its allocation and utilization, transmission through pipelines, development of R-LNG infrastructure etc. Regulatory frame work in vogue is narrated in the succeeding paragraphs:
1.6.1 Allocation of NG
Considering NG as a premium source of fuel and feedstock, MoPNG formulated a 'Natural Gas use policy' in 1990. To rationalise the allocation without any discrimination on the basis of sector/region, GoI constituted Gas Linkage Committee5 (GLC) in 1991, which was wound up (2005) as there was no additional APM gas available for allocation to new consumers. Thereafter, GoI constituted (2007) an Empowered Group of Ministers (EGoM) to decide issues pertaining to commercial utilization of gas produced under NELP blocks. Subsequently, MoPNG formulated (October 2010) a policy on pricing and commercial utilisation of non-APM gas produced by NOCs which maintained sector wise priority. 1.6.2 Infrastructure
GoI enacted (March 2006) 'The Petroleum and Natural Gas Regulatory Board Act, 2006' (the Act) to provide regulatory and legal frame work for downstream activities. Main objective of the Act was establishment of Petroleum and Natural Gas Regulatory Board (PNGRB) to regulate downstream activities to protect the interests of consumers and entities engaged in specified activities relating to petroleum, petroleum products and NG. GoI in exercise of powers conferred by sub section 3 (1) of the Act established PNGRB with effect from 1 October 2007. Functions of PNGRB are enumerated in Annexure 1. GoI also notified (2012) the Petroleum and Natural Gas Regulatory Board (Eligibility conditions for Registration of Liquefied Natural Gas Terminals) Rules, 2012. In 2013, PNGRB framed draft regulations which were under public consultation process (September 2014).
5 Committee of Secretaries headed by Secretary, MoPNG
Regulatory framework


Report No. 6 of 2015
7
2.1
Gap between demand and availability of NG including R-LNG is widening in the country due to shortfall in domestic production and insufficient import and re-gasification infrastructure.
Domestic demand of gas is far in excess of indigenous production and there are very few new domestic sources available to cater to additional demand. Options available to meet the demand were import of NG through trans-national pipelines and import of LNG.
Pipeline network is a pre-requisite for developing gas supply network. Though a formal pipeline policy was notified (2006) and a regulator (PNGRB) was established in 2007, the present pipeline infrastructure is insufficient to reach the demand centres in the country. There were instances of non-development of new pipelines and underutilization of existing pipelines due to non-availability of NG.
Similarly, instances of underutilization of capacity of plants in fertilizer and power sectors on account of non-availability of NG leading to loss of production and increase in cost of production due to use of alternate costlier feedstock/fuels have also been noticed. In fertilizer sector, GoI meets the deficit of urea production through import. This leads to excess payment of subsidy as the cost of imported urea is higher than that of indigenously produced urea.
In the backdrop of these concerns, Performance Audit on 'Supply and Infrastructure Development for Natural Gas' was taken up to ascertain:
Whether GoI has played its wider role in providing adequate pipeline and R-LNG infrastructure to cope with emerging demand in the country;
The impact of non-availability of NG/R-LNG on fertilizer/power sector and pipeline infrastructure providers; and
Whether NG allocation and utilization policies of the GoI were effective to meet the requirement of NG across the country.
Audit objectives
Chapter Audit Framework 2

Report No. 6 of 2015
8
2.2
Performance Audit covered the period 2009-10 to 2013-14. During the Performance Audit, records of MoPNG relating to assessment of demand, allocation of NG, pipeline authorisations, steps taken to create import and re-gasification infrastructure for LNG, records of Ministry of Power (MoP) and Department of Fertilizers (DoF) relating to demand projections and utilisation of available NG were test checked. Records relating to payment of subsidy on domestic production/import of urea, details of plant utilisation in DoF and MoP respectively were also test checked. Audit also test checked record of GAIL (India) Limited (GAIL) in respect of major pipeline projects, utilization of pipeline capacity, supply of APM gas, procurement of R-LNG etc. Entry conference with representatives of MoPNG, MoP, DoF, GAIL and PNGRB was held on 11 January 2013. This audit did not cover examination of the records of PNGRB because of their contention that “decisions of the Board taken in the discharge of its functions under Petroleum and Natural Gas Regulatory Act, 2006, being matters appealable to the Appellate Tribunal, shall not be subject to Audit” as per explanation given below sub-Section (2) of Section 40 of the Act.
2.3 Performance Audit was carried out with reference to:
Policies, procedures, guidelines of MoPNG regarding o allocation and utilization of NG; o creation of pipeline and R-LNG infrastructure; and o marketing margin for supply of NG
Annual plans of MoPNG, MoP and DoF; Expansion/revival plans of units under power and fertilizer sectors; Agreements for pipeline infrastructure projects of GAIL; and Contracts for supply of NG/R-LNG by GAIL
Audit criteria
Scope of audit

Report No. 6 of 2015
9
2.4
The Draft Audit Report (DAR) was issued to MoPNG, MoP, DoF and GAIL on 6 June 2014 with the request to send their response within four weeks. Audit received the response from MoPNG and GAIL in July 2014 and August 2014 respectively. MoP and DoF furnished their response in October 2014. The responses of audited entities have been duly considered and relevant portions have also been incorporated in the report.
As per the Comptroller and Auditor General of India standard practice, an Exit Conference was held on 10 September 2014 to provide an opportunity to the audited entities to discuss the audit findings and present their views. The views expressed during the Exit Conference have been duly considered while finalising the report. Draft Final Report (DFR) after incorporating views expressed during Exit Conference was issued to audited entities on 5 December 2014 soliciting response thereto within two weeks. Replies to DFR were received from MoPNG (23 December 2014), GAIL (30 December 2014), DoF (14 January 2015) and MoP (9 February 2015). These replies have also been considered while finalising the Report.
Response to Draft Audit Report


Report No. 6 of 2015
11
‘India Hydrocarbon Vision-2025’ (2000) identified issues such as energy security, use of alternative fuels and inter-changeability of technology as vital to ensure that the mix of energy sources used in the economy is optimal and sustainable and that adequate quantities of economically priced clean and green fuels are made available to the Indian consumers.
The ‘Vision’ therefore set objectives for NG sector which included steps to ensure adequate availability of a mix of domestic as well as gas imported through pipelines and R-LNG. To achieve this, it was suggested that diplomatic and political initiatives be pursued for import of gas from neighbouring and other countries with emphasis on transnational gas pipelines, expedite setting up of a regulatory framework and import of LNG to supplement domestic gas availability and encourage domestic companies to participate in LNG chain.
3.1
Transnational pipelines are difficult and complex ventures since they involve different countries with different economic and political interests. GoI had entered into various stages of negotiations for import of NG with Myanmar6, Iran7 and Turkmenistan8. Status of these transnational pipeline projects is discussed below.
Myanmar-Bangladesh-India (MBI) The concept of 900 Km, Tri-national MBI pipeline was initiated in 1997. This pipeline sought gas supplies from Myanmar and Bangladesh. GoI had reached (2005) an agreement with Bangladesh and Myanmar for constructing the pipeline. As Bangladesh withdrew from the project in 2005, GoI opted for re-routing the pipeline from Myanmar via Mizoram, Tripura and Assam to reach Kolkata. Meanwhile (2008), Myanmar Government concluded a gas deal with China. Since no gas was tied up for Myanmar-India pipeline, the project had been kept in abeyance.
6 Myanmar exports 8.5 Billion Cubic Meter (BCM) gas through transnational pipelines to Thailand. 7 Iran exports 8.4 BCM gas through transnational pipelines to Turkey and former Soviet Union countries. 8 Turkmenistan exports 41.1 BCM gas through transnational pipelines to Russia, other former Soviet Union countries, Iran and
China.
Transnational pipelines
Chapter Infrastructure Development 3

Report No. 6 of 2015
12
Iran-Pakistan-India (IPI)
The concept of IPI pipeline originated in early 1989 and Iran-Pakistan working group was formed in 2003 to move the project forward. India joined the group in 2005. In 2007, India and Pakistan provisionally agreed to pay Iran US$ 4.93 per mmbtu9 of NG. The pipeline was expected to carry 150 mmscmd NG to be shared equally between India and Pakistan. In 2009 India and Iran agreed to hold next joint working group meeting for discussion on IPI project which had not taken place, so far.
MoPNG stated (January 2014) that due to certain unresolved contractual issues and in the light of UN sanctions, future of the IPI project remained uncertain.
Turkmenistan-Afghanistan-Pakistan-India (TAPI)
The idea of TAPI project was mooted by the Asian Development Bank originally as Turkmenistan-Afghanistan-Pakistan pipeline. An agreement for laying transnational gas pipeline was signed in December 2002 by Turkmenistan, Afghanistan and Pakistan. India joined the project in 2008. Construction of 1680 Km pipeline was planned to start in 2012. India was expected to get 38 mmscmd NG through this line. GAIL and Pakistan’s Inter-state Gas System signed (May 2012) GSPA10 with Turkmenistan State Gas Company which envisaged gas supply in 2018.
TAPI project has been in discussion for long presenting a significant potential for the energy security of the country. Issues relating to security and gas certification, however, remained unresolved.
MoPNG/GAIL stated (January/August 2014) that broad agreement had been reached on transit fee among India, Pakistan and Afghanistan and the issue of indexation and modalities of transit fee payment were under discussion. Formation of pipeline consortium with participation of four nominated gas companies from TAPI countries is currently under way, outcome of which is crucial for the project to move forward.
Audit noticed that success of these projects depended on factors that involved political, technological and security concerns. There was uncertainty in these projects since beginning. Import of LNG, therefore, emerged as a comparatively better option to meet the deficit of NG in the country.
9 Million Metric British Thermal Unit 10 Gas Sales Purchase Agreement

3.2
NG and termand trandow
3.2
At tLNGVenimpof `50 p2.5 Kocregi
condensedis typically
minals. LNGtransport
nsmission twnstream se
.1
the instanceG terminalsnture Compport of LNG`1200 croreper cent. Ob
Million chi/Kayamkistered (Apr
R-L
In
d at minus 1y transporteG terminal re-gasified
through pipector is depi
e of MoPNGs at Ennore any (JVC)
G. GoI approe limiting eqbjective of
Metric Tkulam, Haziril 1998) in
LNG infra
nitiatives f
60.5° C at ed by speciaincludes in
d LNG to pelines as cted in Cha
G (Decemband Mangawith Indian
oved (July 1quity particJVC was toTonnes Pira/Dahej, Ethe name o
astructur
for creatin
13
normal prealized tankenfrastructure
outside boNG. A ty
art 7: Chart 7
(S
ber 1995), Galore and pron Oil Corpo1997) formacipation of Po set up LNer Annum
Ennore and f Petronet L
re
ng R-LNG
ssure to liqer with insue to receiveoundaries oypical LNG
Source: website
GAIL initiatoposed (Au
oration Limiation of JVCPublic Sect
NG terminalsm (mmtpaany other s
LNG Limite
G infrastr
Repo
uid form is ulated walls e and store of the facilG chain in
of Petronet LN
ted project rugust 1996) ited (IOCL)C with an autor Undertaks with an ina) each suitable locaed (PLL).
ructure
ort No. 6 of 2
known as s and receiv
LNG, re-glity for onn upstream
NG Limited)
related worto set up a
) and ONGCuthorized ca
akings (PSUnitial capaciat Mangaations. JVC
2015
LNG ved at gasify nward
and
rk for Joint C for apital
Us) to ity of alore,
C was

Report No. 6 of 2015
14
Import of LNG was under Open General License (OGL)11. Multinational companies were permitted to establish LNG terminals and organize LNG business in India with 100 per cent foreign direct investment (FDI). Besides, pricing of LNG was not regulated and was purely dependent on market forces. Under these circumstances, 13 private entities obtained clearance (1997 to 2000) from Foreign Investment Promotion Board (FIPB) for 15 LNG terminals (Annexure 2) across the country with an initial capacity of 40.2 mmtpa12.
3.2.2
Stages of development of R-LNG infrastructure are depicted below:
11 Open General License is issued by the GoI in pursuance of the Imports (control) order, 1955. It is the most liberalized type of
license for imports for freely traded items for which no specific permission is required. 12 Million Metric Tonne Per Annum. One mmtpa LNG is equal to 3.6 mmscmd NG.
Development of R-LNG infrastructure
2007: GoI set up a Regulator, PNGRB
2012 onwards
2012-13: PNGRB received applications for registration of four LNG terminals
1997 – MoPNG approved formation of PLL
1997-2000: FIPB cleared 15 LNG terminal projects to 13 entities
Up to 2001-02: None of the LNG terminals materialized
2004-05: Two LNG terminals at Dahej and Hazira were set up by PLL and Hazira LNG respectively
2012: MoPNG empowered PNGRB to notify regulations for registration of LNG terminals
2013-14: LNG terminals at Dabhol (GAIL/NTPC) and Kochi (PLL) were set up
Prior to 2000 (Before
'India Hydrocarbon Vision 2025')
After 2000 i.e. after
'India Hydrocarbon Vision 2025'
2000-12: No fresh clearance for LNG terminals
Report No. 6 of 2015
15
Year wise position of development of R-LNG infrastructure is given in Annexure 3. It could be seen that out of the 15 LNG terminals for which FIPB clearance was given till 2000, four13 terminals with 22 mmtpa capacity had commenced operation so far (October 2014). Reasons for delay/non creation of R-LNG infrastructure as analysed in Audit are discussed below: (i) Delay in/non taking up of LNG projects by PLL irrespective of mandate
GoI created (1997) PLL with a mandate to set up LNG terminals at Mangalore, Kochi/Kayamkulam, Hazira/Dahej, Ennore with initial capacity of 2.5 mmtpa each. PLL decided to establish LNG terminals in the first phase at Dahej and Kochi with capacities of five mmtpa and 2.5 mmtpa respectively. Land required for Dahej and Kochi was already kept reserved (November 1997) for PLL to commence activities. Inspite of autonomy given to PLL, it did not commence LNG related activity in Kochi till 200814 . The project at Dahej was completed in 2004 and capacity enhanced from five to 10 mmtpa in 2009. However, terminals at Mangalore and Ennore were not developed by PLL despite mandate given to it. (ii) Restriction on Promoters of PLL to take part in other LNG projects
MoPNG directed (June 1997 and January 1999) promoters of PLL (ONGC, IOCL, BPCL and GAIL) that LNG projects in India would be pursued by PLL and promoters would not compete with each other through separate business arrangements for LNG projects promoted/offered by other companies. Subsequently, MoPNG directed (November 1999) promoters not to take up any project/activity which would have adverse effect on the projects of PLL at Dahej and Kochi. GAIL’s proposed LNG terminal at Trombay15 and IOCL’s proposal for LNG terminals were not taken up further due to restriction placed by MoPNG on PSUs in participating in LNG activities on individual basis. Though MoPNG decided (November 1999) to evolve a separate policy regarding participation of PSUs in different LNG ventures at different locations, no such policy was formulated (October 2014). MoPNG stated (January 2014) that the substantial investment was made in the Dahej re-gasification plant of PLL and pipelines. To make the project commercially viable, it was considered important that the market for R-LNG was protected from competition at least from the promoters of PLL.
13 Dahej, Hazira, Dabhol and Kochi 14 LNG terminal at Kochi was completed in September 2013. 15 In collaboration with TOTAL (France) and Tata Electric Company (TEC)
Report No. 6 of 2015
16
As import of LNG was under OGL, putting such restriction on PSUs was in contradiction with the objectives set in ‘India Hydrocarbon Vision 2025’ wherein it was envisaged that domestic companies were to be encouraged to participate in the LNG chain. However, after 13 years GAIL16 and IOCL are going ahead (2012-13) with their R-LNG projects in offshore Andhra Pradesh (Floating storage and Re-gasification unit) and Ennore respectively. GAIL also signed (October 2013) a Memorandum of Understanding with Paradip Port Trust for setting up LNG terminal in Paradip Port.
(iii) Lack of monitoring in progress of LNG projects
There was no mechanism to review the progress of LNG terminal projects in MoPNG due to which it was not able to monitor the LNG terminal projects to which clearance was given by FIPB during 1997-2000.
MoPNG stated (January 2014) that: (i) Development of LNG chain was a complex endeavour. Therefore, it was not anticipated that all LNG terminals which were conceived would reach implementation stage and (ii) due to low affordability of gas consumers in India and non-availability of a country wide gas grid of pipelines, there was an apprehension that the capacity utilisation of even the existing terminals might go down. Hence the companies in their commercial prudence had not executed the concerned projects.
The stand taken by MoPNG needs to be viewed against the following:
(i) 'India Hydrocarbon Vision 2025' set a long term objective to ensure availability of NG through a mix of domestic gas and LNG to meet the increasing demand. MoPNG, however, did not define a policy on LNG import/infrastructure, set a target for completion of LNG projects and insist on performance guarantee from prospective LNG infrastructure providers etc. to accomplish this objective and (ii) MoPNG had not set up a legal framework to ensure coordinated development of infrastructure envisaged in the 'Vision' as discussed in para below. 3.2.3
GoI took various initiatives for development of R-LNG infrastructure as discussed in paragraph 3.2.1 but a regulatory regime as envisaged (2000) in “India Hydrocarbon Vision 2025” was lacking to cover the aspects of authorisation of entities to set up facilities, size and location of facilities, tariff/price of services etc. Instead of coming
16 Andhra Pradesh Gas Distribution Corporation Limited (APGDC), a company jointly promoted by GAIL Gas Limited (wholly
owned subsidiary of GAIL) and Andhra Pradesh Gas Infrastructure Corporation Private Limited
Development of R-LNG infrastructure after India Hydrocarbon Vision 2025
Report No. 6 of 2015
17
up with a regulatory framework to expedite import of LNG immediately after 2000, GoI came up with PNGRB Act only in 2007.
One of the functions of PNGRB envisaged in the Act (Section 11) was to register entities to establish and operate LNG terminals. Section 60 (sub section 1) inter alia empowered GoI to make rules prescribing eligibility conditions which an entity shall fulfil for registration. MoPNG, however, did not notify the rules under which LNG infrastructure was to be established, till October 2012.
Thus, it could be seen that (i) there was a delay of seven years in setting up the regulator and thereafter there was a further delay of five years in taking an executive decision in fixing eligibility conditions for entities to apply for registration; (ii) the regulator appointed for the purpose was not able to notify the regulations and create a legal framework for development of infrastructure so far (October 2014). Though, PNGRB developed draft regulations in 2013, same was under public consultation process (October 2014). PNGRB had received applications (January 2014) from four17 entities for registration of LNG terminals for creation/ expansion of LNG facilities.
While a total capacity of 145 mmscmd for import/re-gasification was expected by 2004, a capacity of 79.2 mmscmd only was materialised (including subsequent capacity enhancement) over a period of 17 years (1997 to October 2014). Considering the fact that an LNG terminal would take about three to four years to complete, the delay had a significant adverse impact on creation of required infrastructure.
MoPNG stated (January 2014) that development of LNG chain is a complex endeavour involving substantial investment. Notification of eligibility criteria and issue of regulations for registration thereupon by PNGRB had, therefore, no connection with the pace of development of LNG terminals. It was further stated (July 2014) that until the actual gas consumer was ready to receive and pipeline connectivity was established, there was risk of entire investment going infructuous. The R-LNG capacity created at Kochi was remaining underutilised for want of pipeline connectivity.
Reply of MoPNG needs to be viewed against the fact that a regulatory system is essential for an orderly and efficient development of infrastructure. “India Hydrocarbon Vision 2025” in 2000 suggested creation of such a regime. The delay as mentioned above, however, acted as a constraint on PNGRB to come up with the required regulation and facilitate the required infrastructure.
Though R-LNG was more expensive than domestic gas, it owned a defined space in the domestic market owing to the substantial gap between demand and supply. A sizeable demand was in existence for R-LNG from consumers currently using expensive liquid fuels. This could be observed from the fact that while formulating
17 PLL, Swan energy, GSPC LNG Limited and H-Energy

Report No. 6 of 2015
18
the expansion/revamp/revival projects of fertilizer sector for XI Plan, DoF had considered cost of NG above prevailing APM rates. Also, LNG procured through long term contract was economical as compared to Naphtha which was the major alternate feedstock/fuel used in the absence of NG. Table 1 gives a comparison between cost of production by using R-LNG and Naphtha in both the sectors:
Table 1 Year Cost of
LNG18 per MT (`)
Cost of Naphtha19 per MT (`)
Power Sector Fertilizer Sector Cost of power generation20
per kWh (`) Cost of Urea21 per MT (`)
With R-LNG
With Naphtha
Increase in %
With R-LNG
With Naphtha
Increase in %
2010-11 19488.35 37282.00 6.89 9.56 39 15083 25081 66
2011-12 22079.22 48800.00 7.80 12.51 60 18982 32816 73
2012-13 31659.80 53792.00 11.19 13.79 23 25188 39241 56
Availability of import and re-gasification infrastructure is one of the critical features that facilitate sourcing of LNG on long term basis. Lack of sufficient re-gasification capacity, however, remained a constraint in making available sufficient quantity of LNG through long term contract to meet additional requirement for substituting costlier feedstock/fuel as indicated in Table 2:
Table-2 (Quantity in mmscmd)
Year LNG import through
long termcontract
(1)
LNG import (spot)
(2)
Require-ment of Gas for
proposed schemes under
Fertilizer sector
(3)
Require-ment of Gas to
avoid use of costlier feedstock
in Fertilizer sector22
(4)
Require-ment of Gas to
avoid use of costlier
fuel in Power sector23
(5)
Total require-ment of R-LNG
(6) (1 to 5)
Actual re-
gasification
capacity
(7)
Minimum additional
requirement for re-
gasification capacity
(8) (6-7)
2010-11 27.00 8.05 12.37 6.33 1.75 55.50 48.96 6.54
2011-12 27.00 12.62 12.37 6.81 1.02 59.82 48.96 10.86
2012-13 27.00 13.07 20.37 2.88 1.58 64.90 61.20 3.7
18 Basic price of LNG as per the long term contract between PLL and Ras Gas at 9500 kCal 19 Basic price of Naphtha (Annual average of Refinery Transfer Price– IOCL) at 10500 kCal 20 As per the Report of ‘Expert Committee on Fuels for Power Generation’; cost of power generation using LNG was `2.29/
kWh and that of Naphtha was ` 4.46/kWh in 2004-05. Generation cost is estimated for the subsequent years by apportioning the proportionate increase in fuel cost – Annexure 14.
21 for 2010-11; Annexure 11 (b) – Column 7 for R-LNG, Column (5-4) for naphtha for 2011-12; Annexure 11 (c)- Column 9 for R-LNG, Column (5-4) for naphtha for 2012-13: Annexure 11 (d)- Column 7 for R-LNG, Column (5-4) for naphtha 22 Calculation based on Annexure 11 b, c, d 23 Calculation based on actual quantity of naphtha used

Report No. 6 of 2015
19
Thus available re-gasification capacity was not sufficient to meet the total requirement of R-LNG during the period and in the absence of sufficient re-gasification capacity, fertilizer and power sectors could not substitute costlier feedstock/fuel (Naphtha) with R-LNG through long term contracts.
MoPNG’s reply that there was insufficient demand needs to be viewed against the fact that demand for R-LNG is closely related to availability of infrastructure (both R-LNG and pipeline connectivity) and there was opportunity for saving in cost of production in various sectors. Delay in creation of R-LNG infrastructure has strong bearing on non-availability of R-LNG at competitive price. This was also evident from the fact that till 2014, LNG import was being made under only one long term contract (entered into between PLL and Ras-Gas in July 1999 for import of 7.5 mmtpa i.e. 27 mmscmd LNG for 2004 to 2028). Subsequently, four long term contracts had been entered into (August 2009 to April 2013) under which supply was expected from early 2015 in anticipation of completion of new LNG terminals which highlights a gap of more than ten years in entering into a long term contract.
MoPNG also stated (July 2014) that policy framework of GoI provides an investment friendly environment such as infrastructure project status to LNG terminals, eligibility for 100 per cent FDI through the FIPB route, import under OGL etc. to LNG investors for establishing LNG terminals based on its own techno-commercial feasibility.
The fact, however, remains that inadequate development of LNG terminals led to a situation where the consuming sectors were denied the option of importing LNG at an affordable price through long term contracts, as spot gas is costlier than R-LNG procured through long term contract as could be seen from Table 3:
Table-3
Year Long-term LNG price ranging (US $/mmbtu)
Spot-LNG price ranging (US $/mmbtu)
From To From To 2010-11 5.29 6.81 8.20 10.54 2011-12 6.97 9.07 11.80 15.00 2012-13 9.29 11.81 17.82 20.99
The impact of non-materialisation of various expansion plans of urea plants, under-utilisation of power plants, delay in gas pipeline projects, underutilisation of existing pipeline capacity etc., due to non- availability of affordable NG, is discussed in Chapter 4.

Report No. 6 of 2015
20
3.3
Transmission pipelines are a pre-requisite for supply of NG across the country. As availability of a robust transportation infrastructure is crucial for development of NG market, there is a need to create sufficient infrastructure ensuring coordinated development across the entire value chain.
NG in India is primarily sourced from Mumbai & Ravva offshore fields, Krishna-Godavari, Cambay & Cauvery basins and from R-LNG facilities in the western coast24. Major producing fields are located in offshore Maharashtra, Gujarat, Andhra Pradesh, Tamil Nadu and North Eastern states while import/re-gasification facilities are positioned in Gujarat and Maharashtra. In order to have a reasonable distribution of this natural resource to all parts of the country on a fairly equitable basis, an extensive and elaborate pipeline network was required.
Phases of development of pipeline infrastructure in the country are depicted in the diagram below:
24 Dahej, Hazira, Dabhol and Kochi (commissioned in September 2013)
Pipelines
Phased development of gas pipeline infrastructure in India
Period Infrastructure Developer
Before 1985
2000 to
2007
1985 To
2000
2007 Onwards
ONGC, OIL, AGCL and Customers
ONGC, OIL, AGCL and Customers GAIL (HVJ-GREP, Regional Network) GSPC (in Gujarat)
Requirement of authorization by PNGRB PNGRB granted Authorization to GSPL,
GAIL, Reliance Gas Pipeline Limited
ONGC, OIL, AGCL, GAIL and Customers RGTIL (EWPL) IOCL (Dadri-Panipat) GSPL (in Gujarat)
Report No. 6 of 2015
21
Present position of gas pipeline infrastructure operational in India is given in Annexure 4. 3.3.1
Total length of NG pipeline in the country is around 15,340 Km (March 2014)25, out of which 13871 Km (90 per cent) was under public sector. Additional 11700 Km was under various stages of construction. Pipeline infrastructure existed only in 17 states26. Lack of gas pipeline infrastructure to transport gas across the country has restricted development of gas based industries close to source of gas. Limited pipeline connectivity has also led to a skewed pattern of NG consumption in the country27. There are several areas in the country, especially remote and under developed, which are deprived of NG due to absence of pipeline infrastructure.
Connectivity of eastern and southern states to LNG terminals positioned in western coast is also limited28. East-West pipeline of Reliance Gas Transmission Infrastructure Limited (RGTIL)29 is the only link between western and eastern coast of the country. This pipeline, however, is not designed for bi-directional flow of gas which acts as a restraint for supply of R-LNG to customers in eastern part of the country. A map depicting present and future (targeted) pipelines in the country is given in Annexure 5.
3.3.2
The prospect of supply of NG was increasing owing to intensified exploration activities under NELP rounds and proposed development of LNG terminals. In view of this, GoI conceptualized (2000) a National Gas Grid (NGG) to facilitate supply of NG to the remote areas of the country.
To meet the growing demand from power and fertilizer sectors for their expansion plans, city gas entities and other consumers, GAIL accorded (September 2000) approval to undertake works on seven trunk pipelines30 under NGG. Thereafter, GAIL identified 15 pipeline projects31 (including seven trunk pipelines mentioned above) and carried out preliminary studies by 2003.
25 Major entities that control these pipelines are GAIL - 71 per cent, Gujarat State Petroleum Corporation Limited - 12per cent,
Reliance Gas Transportation Infrastructure Limited – 10 per cent and Assam Gas Company Limited seven per cent. 26 Gujarat, Maharashtra, Delhi, MP, UP, Rajasthan, Punjab, Haryana, Assam, Tripura, AP, Telangana, TN, Karnataka, Goa,
Uttrakhand and Kerala 27 More than 70 per cent in western and northern regions 28 GAIL has commissioned a pipeline linking LNG terminal at Dabhol to Bangalore in February 2013. 29 Commissioned in 2009. 30 (1) Hazira-Uran-Mangalore/Bangalore (2) Kochi-Kasargod-Mangalore (3) Mangalore-Hassan-Bangalore (4) Banagalore-
Chennai (5) Uran-Hyderabad-Kakinada (6) West Bengal-Bihar-UP and (7) West Bengal-Orissa-AP-TN 31 (1) Dahej-Vijaipur (2) Dahej-Uran (3) Dadri-Panipat-Nangal (4) Vijaipur-Kota-Mathania (5) Kakinada-Uran (6) Kakinada-
Chennai (7) Kakinada-Kolkata (8) Kolkata-Jagdishpur (9) Dabhol-Banglore-Chennai-Tuticorin (10) Kochi-kayamkulam-
Regional imbalance in pipeline infrastructure
Non development of National Gas Grid

Report No. 6 of 2015
22
During 2013-14, MoPNG identified the requirement of 15,000 Km of pipelines (16 pipelines in all including 15 identified by GAIL mentioned above) to complete NGG. Authorisation for seven pipelines32 (9,684 Km) had already been granted. In respect of remaining nine pipelines, PNGRB had initiated bidding process for two sections33and three sections were identified by MoPNG for implementation through Public Private Partnership (PPP) mode with viability gap funding while the remaining four pipelines34 were under progress. MoPNG has further decided (September 2014) to review the progress of NGG every month. A separate proposal for taking up certain sections of gas pipelines which were strategic but might not be economically viable at this stage, with budgetary support from GoI was also being examined.
Examination in audit revealed that owing to various deficiencies in authorisation and monitoring of pipeline projects, there was no appreciable growth in this sector as discussed in the succeeding paragraphs.
3.3.3 As gas pipeline networks require large economies of scale, Integrated Energy Policy of Planning Commission (2006) suggested that the development needs of this sector were required to be co-ordinated and their functioning regulated. Working group on Petroleum and Natural Gas for XI Plan also identified (November 2006) the thrust areas like increasing the coverage of pipelines across the country and building a sound gas transportation infrastructure to support growth of gas market.
Considering the need to provide a policy framework for the future growth of pipeline infrastructure to facilitate evolution of NGG and growth of city or local gas distribution networks, GoI notified (December 2006) a ‘Policy for Development of Natural Gas Pipeline and City or Local Natural Gas Distribution Network’. The policy envisaged progressive development of a transmission and distribution pipeline network in a competitive environment involving both public and private sectors.
Manglore (11) Banglore-Coimbatore-Kayamkulam (12) Myanmar-Mizoram-Assam-Bihar (13) Hyderabad-Vijaipur (14) Vijaipur-Jaghdishpur (15) Dahej-Jamnagar-Porbandar
32 Jagdishpur-Phulpur-Haldia, Shahdol-Phulpur, Kakinada-Vizag-Srikakulam, Malavaram-Bhopal-Bhilwara via Vijaypur, Mehsana-Bhatinda, Bhatinda-Jammu-Srinagar and Surat-Paradip
33 Ennore-Nellore, Ennore-Thirulvalur-Bengaluru-Puducherry-Nagapattinam-Madurai-Tuticorin 34 Kochi-Koottanad-Banglore-Manglore, Spur line to Dadri-Bawana-Nangal, Chainsa-Jhajjhar-Hissar, Dabhol-Banglore
Pipeline policy

Report No. 6 of 2015
23
3.3.4
To create gas transportation infrastructure across the country for the benefit of regions which were starved of gas, MoPNG permitted (February-March 2007) GAIL and RGTIL to invite Expression of Interest (EoI) from interested parties for nine35 pipelines across the country for creating capacity on common carrier basis. MoPNG subsequently authorized (July 2007) GAIL and RGTIL to construct five36 and four37 trunk lines respectively. Authorizations were granted on the basis of guidelines for laying petroleum product pipelines (2002) and supplementary guidelines (2004). No bidding was carried out for these pipelines.
Details of these pipelines viz date of authorization, anticipated anchor consumers and status as on June 2014 are given in Annexure 6. It would be seen that in respect of five (all four projects of RGTIL/Relog38 and one39 of GAIL) out of nine projects, respective entities failed to commence execution even after a lapse of more than six years since authorisation.
On account of inordinate delay in execution of four pipeline projects, MoPNG cancelled (October 2012) the authorisation issued to RGTIL/Relog on the recommendation of PNGRB and was yet to take action (October 2014) in respect of Jagdishpur- Haldia pipeline which was authorised to GAIL.
Reasons for non-commencement/completion of the projects as analysed in Audit were as follows: (i) Non-fixing of target date for completion of pipeline projects
In respect of all nine projects authorized by GoI, activities such as invitation of EoI (April 2007) by the proposer, evaluation of offers and grant of authorisation (July 2007) were completed in the intervening period of enactment (March 2006) of the Act and establishment (October 2007) of PNGRB.
Terms of authorization, stipulated that these projects were to be commissioned within 36 months from the date of start of the project. The date of start of the project was mentioned as the date of publication in official gazette of the
35 (1) Dadri-Bawana-Nangal (2) Chainsa-Gurgaon-Jhajjar-Hissar (3) Jagdishpur-Haldia (4) Dabhol-Banglore (5) Kochi-
Koottanad-Banglore-Manglore (6) Kakinada-Howrah (7) Chennai-Tuticorin (8) Chennai-Banglore –Manglore (9) Kakinada-Chennai
36 (1) Dadri-Bawana-Nangal (2) Chainsa-Gurgaon-Jhajjar-Hissar (3) Jagdishpur-Haldia (4) Dabhol-Banglore (5) Kochi-Kanjirkod-Banglore-Manglore
37 (1) Kakinada-Howrah (2) Chennai-Tuticorin (3) Chennai-Banglore –Manglore (4) Kakinada-Chennai 38 Relogistics Infrastructure Limited, a subsidiary of RGTIL 39 Jagdishpur-Haldia
Authorization of pipelines by MoPNG

Report No. 6 of 2015
24
notification40 under sub-section 1 of Section 3 of the Petroleum and Minerals Pipeline Act, 1962 (PMP Act). A definite time frame, however, for publication of above notification was not specified in the authorisation order whereas ‘Supplementary Guidelines for Laying Petroleum Product Pipelines’, on the basis of which authorisations were granted to the pipelines, had prescribed a time frame of 36 months from the date of sanction/approval for completion of project.
(ii) Pipelines authorized to GAIL
In all the five projects there was delay ranging between three and 24 months
in according administrative approval from date of authorization. Administrative approval was given for implementing the project in 42 months from the date of Board approval. GAIL had completed two (Dadri-Bawana-Nangal in March 2012 and Dabhol-Bangalore in February 2013). Physical progress achieved in the remaining two projects was about 17 per cent (Phase-2 Sultanpur-Jhajjar-Hissar) and 83 per cent (Phase-2 Kochi-Bangalore-Mangalore) (June 2014). One pipeline project (Haldia-Jagdishpur) was not taken up. It is interesting to note that GAIL had conducted feasibility study on these projects way back in 2003 under NGG.
GAIL stated (August/December 2014) that the pipeline projects were envisaged considering NG from various projected gas sources like KGD6 field through Relog’s Kakinada-Haldia pipeline, ONGC’s Mahanadi gas fields, Dabhol and Kochi RLNG terminals. There was delay in availability of sources due to slow progress on Kakinada- Haldia pipeline, delay in development of gas blocks in Mahanadi and delay in completion of R-LNG terminals at Dabhol and Kochi.
In respect of Haldia-Jagdishpur pipeline41, project under NGG, no work has commenced so far. MoPNG had earlier (July 2005) issued 3 (1) notifications42 (notification under this section is the first step in land acquisition process for laying of pipeline which declares the intention of GoI/State Government/Corporation to acquire right of use for any land and is valid for one year) under PMP Act. As there was delay of more than one year in taking further action, 3 (1) notification issued under PMP Act in July 2005 had lapsed.
40 Under 3 (1) notification of PMP Act, Central Government in the public interest declare its intention to acquire the right of
user for laying of pipeline for the transport of petroleum or any mineral by that Government or by any State Government or a corporation through notification in the Official Gazette,
41 conceptualized as bi-directional with source of gas identified as R-LNG from PLL terminal at Dahej through Dahej-Vijaipur pipeline or NG from KG and Mahanadi basins through RGTIL’s proposed Kakinada-Haldia/Howrah Pipeline
42 in respect of 467 km out of 896 km main line

Report No. 6 of 2015
25
One of the major objectives of construction of this pipeline was to meet the prospective demand of 11 mmscmd NG from five fertilizer plants43 on their revival. In addition to this, five power plants44with the requirement of 19.4 mmscmd, four industrial units45 with 4.5 mmscmd and seven city gas networks46 were the other prospective consumers along the pipeline route. GAIL also entered into agreements with 26 customers for supply of NG47 and incurred an expenditure of ` 13.50 crore (June 2014) on the project towards Project Management Consultancy and other administrative charges. The project, however, was yet to commence even after a lapse of six years from the date of authorization. MoPNG stated (January/July 2014) that GAIL was directed (October 2013) to furnish their plan for capacity booking and construction of pipeline but the latter was yet to submit a proposal for land acquisition notification to MoPNG (December 2014).
GAIL stated (December 2014) that the project was not taken up essentially due to lack of clarity on source of gas because of non-implementation of Kakinada-Howrah/Haldia pipeline by RGTIL/Relog. GAIL further stated (August/December 2014) that (i) execution of pipeline would depend on finalisation of agreements by fertilizer plants along the pipeline and considered for revival, which was yet to be taken up and (ii) revival of two fertilizer plants and direct authorization of at least five CGD projects48 on the route would ensure commercial viability of the pipeline. MoPNG stated (January 2014) that GAIL had apprehension that if the pipeline was constructed, it might have remained under-utilized as there was uncertainty in availability of NG. Moreover, revival of gas based fertilizer plants would require 42 to 48 months, whereas the pipeline could be executed within a span of 40 months. Thus, GAIL could immediately commence construction of pipeline once a final decision was taken on the revival of fertilizer units.
The fact, however, remains that as the project was conceptualized as bi-directional (gas flow from Haldia to Jagdishpur as well as from Jagdishpur to Haldia), there was an opportunity to link the line with the existing HVJ pipeline, which supplies NG to Jagdishpur from Hazira/Dahej terminals. On cancellation of authorization (October 2012) to Relog’s Kakinada-Haldia
43 (1) FCIL, Gorakhpur (2) FCIL, Sindri (3) HFC, Barauni (4) HFC, Durgapur and (5) DIL, Kanpur 44 CESC Haldia, CESC-Kashipur, DPL-Durgapur, WBPDC-Bundel, WBPDC-Sagardighi 45 SAIL-Durgapur, SAIL-Bokaro, IOCL-Barauni&Haldia 46 Allahabad, Varanasi, Gorakhpur, Patna, Ranchi, Jamshedpur & Kolkata 47 10.57 mmscmd in 2006-07 to 28.39 mmscmd in 2012-13 48 Varanasi, Gorakhpur, Patna, Ranchi & Jamshedpur
Report No. 6 of 2015
26
pipeline by GoI, GAIL has now considered (December 2014) R-LNG available from Dahej/Dabhol terminal as new source. Further, reply of MoPNG needs to be viewed against the fact that (i) creation of pipeline infrastructure cannot be delayed linking it with availability/demand as the pipeline infrastructure was a prerequisite for development of gas market and further, (ii) Standing Committee on Petroleum and Natural Gas (2011-12) in its Report (July 2012) had also expressed the view that laying of pipeline infrastructure or any part thereof should not be linked to availability of gas as the same could be sourced from international market too. Thus, there was lack of coordination (i) in MoPNG to streamline various pipeline and R-LNG projects to create necessary infrastructure as mentioned in paragraph 3.3.6 and (ii) between MoPNG/GAIL and DoF in synchronizing revival of fertilizer plants and pipeline projects as discussed in paragraph 4.1.1 and 4.1.2.
The second phase of Kochi-Koottanad-Bangalore-Mangalore Pipeline, which was scheduled for completion in March 2013 was affected by objections from various fora viz. farmers, environmentalists etc. in Kerala and Tamil Nadu (TN). In Kerala, a ministerial level meeting suggested (May 2014) diversion of route, which was later (October 2014) declared not feasible. MoPNG decided (August 2014) to take up the matter of laying pipeline in TN and Kerala and also consult Ministry of Road Transport and Highways (GoI) for laying pipelines on the road median which again was not agreed on technical reasons. Under the circumstances, it was decided (October 2014) in a meeting with the Government of Kerala to conduct a review after successful implementation of CGD projects in Kochi, which was likely to be commissioned by December 2014. Pipeline laying in TN was sub judice and completion date of second phase, therefore, could not be ascertained (December 2014).
(iii) Pipelines authorized to RGTIL/Relog
MoPNG authorized RGTIL for construction of four pipelines in March-July 2007. Subsequently, RGTIL had sought concurrence from MoPNG to implement the pipeline through Relog, its subsidiary in line with conditions of authorization order. MoPNG gave concurrence in January 2009 which delayed the entire process by 18 months.

Report No. 6 of 2015
27
In all four projects, notification under PMP Act was issued during June to August 2009. Relog, however, did not commence construction activities even after a lapse of 36 months citing non development of CGD projects along the pipeline route and non-availability of NG.
MoPNG directed (April 2009) RGTIL/Relog to advance completion date to meet requirement of existing/new market especially for Kakinada-Howrah/Haldia pipeline. The completion of Kakinada-Howrah/Haldia pipeline was critical as far as GAIL’s Haldia-Jagdishpur line was concerned. Moreover, several fertilizer and industrial projects in eastern states of India were critically dependent on these lines. RGTIL/Relog did not comply with the directives and had not commenced the project.
As per the terms and conditions of authorization order, RGTIL furnished (2007) Bank Guarantees (BG) amounting to ` 80 crore to the GoI for commissioning the pipeline projects as per the approved time schedule and in accordance with other specified conditions. The BGs expired in 2010. On expiry of 36 months from date of first notification under PMP Act, GoI cancelled the authorization order (October 2012) citing inordinate delay. However, as the BGs had already expired, the guaranteed amount of ` 80 crore could not be forfeited.
3.3.5
Section 16 of PNGRB Act, provides powers to PNGRB for issuing authorizations to lay, build, operate or expand any pipeline as a common carrier or contract carrier etc. GoI notified Section 16 empowering PNGRB to authorise entities with effect from 15 July 2010, after a delay of 33 months since formation of PNGRB. Meanwhile, PNGRB notified ‘Petroleum and Natural Gas Regulatory Board (Authorising Entities to lay, build, operate or expand Natural Gas Pipeline) Regulations 2008 on 6 May 2008. During the period October 2007 to March 2013, PNGRB received EOIs from six entities for nine trunk lines in compliance to clause 4 (1) of Regulations 2008. However, as section 16 of the PNGRB Act was notified on 15 July 2010 as mentioned above, PNGRB gave its first authorisation in July 2011 whereas maximum time
Authorization of pipelines by PNGRB

Report No. 6 of 2015
28
prescribed in 'Regulations 2008' for issue of authorization from date of EoI was 165 days. PNGRB granted authorization to six49 pipelines so far (October 2014).
In respect of four pipelines (Mallavaram-Bhopal-Bhilwara-Vijaipur, Mehsana-Bhatinda, Bhatinda-Jammu-Srinagar and Surat-Paradeep) though entities (GSPL and GAIL) expressed interest between November 2008 and September 2009, PNGRB was not in a position to issue authorization on account of restriction till 15 July 2010. Authorizations were issued between July 2011 and April 2012. Thus, delay of 33 months in notification of Section 16 from the date of formation of PNGRB delayed development of cross-country NG pipelines and associated infrastructure as in the intervening period neither GoI nor PNGRB was able to authorize any project inspite of demand for pipeline as discussed above.
3.3.6
GoI issued authorizations in 2007 for nine pipelines without setting definite start and target date for completion of project which resulted in entities not completing/commencing the projects in time. In all, out of the 23 corridors identified (Annexure 7) during 2000-2011 for completion till 2013-14, seven pipelines were completed, six were at different stages of construction50 and 10 pipelines (7,908 km) were yet to be taken up (October 2014).
There was no effective coordination of LNG projects and pipeline projects in MoPNG which resulted in non-synchronization of LNG projects executed by PLL at Kochi and the pipeline linking project by GAIL. The customers directly affected on account of delay are FACT, Kochi and MFCL, Mangalore (two urea producing units under conversion to NG), Vypeen CCGT51 and Kannur CCGT. MoPNG stated that (January 2014) Kochi LNG terminal was running at about five per cent capacity since its commissioning in September 2013 and hence it was not correct to state that delay in execution of Kochi LNG terminal has affected the customers.
The reply ignores the possibility that the low utilisation was, in turn, due to absence of pipelines linking major demand centres.
49 Mallavaram – Bhilwara (GSPL), Mehsana - Bhatinda (GSPL), Bhatinda - Srinagar (GSPL), Surat - Paradeep (GSPL),
Shahdol - Phulpur (RGPL) and Kakinada-Srikakulam pipeline (APGDCL) 50 Six pipelines under construction includes Bhatinda-Srinagar and Mallawaram-Bhilwara sections authorized by PNGRB in
2011 and 2012. 51 Combined Cycle Gas Turbine
Lack of effective monitoring of pipeline projects

Report No. 6 of 2015
29
The first cross country pipeline in India was established in 1987. Thereafter, GoI could achieve a total spread of about 15,340 Km of pipelines, so far. This works out to 4.67 km/ 1000 square km of the country which is far below the gas pipeline coverage (km/square km) of other major gas consuming countries {USA (53.57/1000 square km), France (47/1000 square km)}. Thus, failure in implementing various pipeline projects which were conceived long back has resulted in non-achievement of infrastructure development envisaged in X and XI Plans.
Recommendation:
1. MoPNG should develop a mechanism, with clearly defined responsibility centres, in coordination with implementing agencies and authorities, to ensure and assess timely completion of NG pipeline and R-LNG projects across the country and cut down delays so that the desired growth in the NG sector is achieved.


Report No. 6 of 2015
31
Sale price of urea is controlled by GoI which bears subsidy on the difference between sale price and cost of production. Similarly, price of power is regulated by electricity regulatory authorities. Accordingly, any increase in cost of production in these sectors has a direct impact on exchequer/consumers. NG is considered as most suitable feedstock for producing urea and preferred fuel for power generation. Providing NG to these sectors, therefore, assumes significance. Accordingly, in addition to prioritising allocation of domestic gas to these sectors, GoI initiated various steps viz. to intensify domestic exploration and production activities, import NG through trans-national pipelines and in the form of LNG etc. These initiatives turned out to be inadequate to meet the demand of NG/R-LNG and these sectors either reduced production or used costlier alternate feedstock/fuels for production. Companies which were engaged in transmission of NG/R-LNG also suffered on account of non-availability of NG/R-LNG.
4.1
Fertilizers have played a vital role in raising agricultural productivity. There has been significant improvement in domestic consumption of fertilizer, especially urea, over the years. Production capacity of urea in the country was almost sufficient to meet domestic demand up to 2004-05. Thereafter, a gap between indigenous production and demand was noticed due to lack of significant increase in production capacity commensurate with the steep growth in domestic consumption. Owing to shortfall in production, it was inevitable for GoI to import urea. Details of available production capacity, envisaged capacity enhancement, demand, production and import of urea are given in Annexure 8.
To enhance domestic production capacity, GoI formulated new pricing scheme for fertilizers (2004) and new investment policies (2008 and 2012) to attract additional investments in urea sector52. These schemes envisaged increase of urea production capacity through expansion of existing units, revamp of existing gas based urea plants, setting up new plants and savings on cost of production by converting existing Naphtha/FO/LSHS53 based urea plants to NG/R-LNG based. These schemes were expected to be completed within a period of two to three years from implementation.
52 GoI subsequently issued New Investment Policy 2012 in January 2013 which was amended in October 2014. The New
Investment policy, 2012 is under implementation. 53 Fuel Oil/ Low Sulphur Heavy Stock
Fertilizer sector
Chapter Impact of non-availability of NG/R-LNG 4

Report No. 6 of 2015
32
Non-availability of NG has been a major constraint in implementing these projects. Therefore the envisaged increase in indigenous production capacity of urea could not be achieved so far (December 2014). Though it was evident that subsidy on import of urea was always higher than subsidy on domestic production, action taken by GoI for import of LNG and produce urea was insufficient. This was mainly due to shortfall in materialisation of plans for setting up LNG terminals, re-gasification facilities, construction of pipelines and facilitating long-term agreements with international suppliers to make available the required quantity of NG/R-LNG to priority sectors as discussed in Chapter 3. Such a situation necessitated import of urea which meant additional outgo of subsidy during the last two years upto 2012-13 as discussed in paragraph 4.1.1. The impact on subsidy burden owing to delay in conversion of existing naphtha/FO/LSHS based urea plants to NG/R-LNG based is discussed in paragraph 4.1.2.
4.1.1
Subsidy on fertilizers is one of the important features of Fertilizer Policy of GoI with an objective to provide adequate fertilizers to farmers at affordable prices so as to induce consumption of fertilizers at optimum level. GoI reimburses difference between statutorily notified selling price54 of urea and domestic production cost/imported price of urea as subsidy to manufacturers/importers. The cost of domestic production of urea even using the imported R-LNG was much less than the cost of imported urea as is clear from Annexure 9 (a).
(i) Expansion of existing units and setting up of Greenfield55 project.
There was a plan for expansion of urea projects by KRIBHCO, IGFL, RCF and IFFCO to enhance capacity by 45.05 lmtpa56 during XI Plan. Further, after notification of new investment policy in 2008, fertilizer companies viz. KRIBHCO, IGFL, RCF, CFCL, TCL57, NFCL58, IFFCO, KSFL59 had shown interest in expansion projects (85.48 lmtpa including 45.05 lmtpa envisaged in XI Plan) while Matix Fertilizers and Chemicals had shown interest in setting up a greenfield project (13 lmtpa) during XII Plan. In the absence of commitment from MoPNG on firm allocation of NG on long term basis, the investments proposed by the above companies did not fructify. Therefore, the expected capacity addition through expansion did not materialize.
54 ` 5310 per MT urea w.e.f 2010 and ` 5360 w.e.f. 01.11.2012. 55 New ammonia-urea unit at a project site where no previous similar manufacturing facilities existed. (The identified Greenfield
Project is Matix, Burdwan) 56 Lakh metric tonne per annum 57 Tata chemicals Limited, Babrala. 58 Nagarjuna Fertilizers Corporation Limited, Kakinada. 59 Kribhco-Shyam Co-operative Limited, Shahjahanpur
Payment of subsidy on imported urea

Report No. 6 of 2015
33
(ii) Revamping/modernisation of existing fertilizer plants
There was a target for enhancement of production capacity by 27.20 lmtpa through revamp of 17 existing urea manufacturing units during XI Plan. The actual achievement was only 3.30 lmtpa upto 2012-13 i.e. from 197.00 lmtpa in 2006-07 to 200.30 lmtpa in 2013-14.
(iii) Revival of closed units of Central PSUs
GoI considered feasibility of reviving closed fertilizer units60 with a view to meeting growing demand of urea. Closed five units of Fertilizers Corporation of India Limited (FCIL) and three units of Hindustan Fertilizers Corporation Limited (HFCL) had well developed infrastructure and were strategically located in the vicinity of proposed NGG. It was envisaged in Report of Working Group for XI Plan that revival of these closed urea units in Eastern India would add an additional urea capacity of 50 lmtpa during XI Plan.
Audit examination revealed that: None of the units identified for revival was revived (October 2014). There was requirement of 17.6 mmscmd NG from MoPNG for proposed
eight units of FCIL and HFCL to be revived which was to be met from Jagdishpur-Haldia pipeline (GAIL)/Mallavaram-Bilwara pipeline (GSPL)/ Kakinada-Basudebpur-Howrah pipeline (RGTIL-Relog). GoI authorized (July 2007) Jagdishpur-Haldia pipeline of GAIL to connect Barauni, Durgapur, Sindri and Haldia. Execution of this pipeline was, however, yet to commence (October 2014).
Though the proposal for Mallavaram-Bilwara pipeline for providing connectivity to Ramagundam unit of FCIL was initiated in 2008, execution of pipeline work was yet to commence (October 2014).
Authorisation for Kakinada-Basudebpur- Howrah pipeline was cancelled in October 2012, due to delay in implementation of the project by Relog.
Thus, none of the closed units identified for revival had been revived so far. The expected capacity addition of approximately 50 lmtpa through revival of closed urea units of HFCL and FCIL, therefore, remained unfulfilled.
Domestic production capacity of urea plants remained stagnant since 2004-05 upto 2010-11. Agricultural sector remained dependent on import of urea to the extent of 477.09 lmt during the period from 2004-05 to 2012-13 (upto March 2013) due to
60 Units which were closed by Government in 2002 on account of technical obsolescence and financial losses: Five units of
FCIL, three units of HFCL and one unit each of Rashtriya Chemicals and Fertilizers Limited (RCF), Fertilizers And Chemicals Travancore Limited (FACT) and Neyveli Lignite Corporation (NLC).
Report No. 6 of 2015
34
shortfall in domestic production. Subsidy outgo on import of urea during the period 2004-05 to 2012-13, was ` 84,359 crore.
Non-availability of NG/R-LNG has been the major constraint in further addition to indigenous capacity for production of urea. GoI could not provide assured supply of NG on a long term basis while pipeline connectivity remained insufficient which was crucial to attract fresh investment and modernization of plants in fertilizer sector. This delayed the implementation of capacity enhancement schemes. Thus the objective of enhancement of production capacity, self-sufficiency in urea production and savings on subsidy burden also could not be achieved.
Audit noticed that during 2011-12 and 2012-13, the actual domestic production of urea was 445.58 lmt against the requirement of 604.36 lmt. On account of non-implementation/materialisation of urea production enhancement projects, the entire shortfall was met through import leading to additional subsidy outgo.
MoPNG stated (July 2014) that most of demand for NG is for domestic gas and not for R-LNG.
Reply needs to be viewed against the fact that though R-LNG was expensive compared to domestic NG, it was still economical when compared to Naphtha which was the major alternate fuel used in absence of NG as is clear from figures given in Table 1. Further, demand for R-LNG is closely related to availability of infrastructure. Insufficiency of infrastructure (both pipelines and R-LNG) has already been discussed in detail in Chapter 3. Audit feels that availability of functional regulatory as well as monitoring mechanism for parallel creation of R-LNG and pipeline infrastructure would have enabled effective development of market for R-LNG as well.
Completion of revival/revamp projects was expected to take two-three years from implementation. Projects identified for implementation during XI Plan could not be commenced (October 2014) due to non-availability of pipeline and R-LNG infrastructure. Therefore, GoI lost an opportunity of saving of subsidy of ` 3559.96 crore61 and ` 642.1662 crore on urea during 2011-12 and 2012-13 respectively. This impact has been worked out considering use of long term R-LNG (not domestic NG) and also after considering the Capital Related Charge63 (CRC) on the basis of estimated investment in expansion, revamp and revival projects. (Annexure 9 a, b and c).
61 Based on subsidy savings of ` 4,738.22 per MT calculated as: {Subsidy on imported urea less (average normative cost of urea per MT using R-LNG at the rate of ` 1933 per G Cal
considering energy norms of each fertilizer unit plus average estimated capital related charge per MT)} 62 Based on Subsidy savings of ` 808.03 per MT calculated as: {Subsidy on imported urea less (average normative cost of urea per MT using R-LNG at the rate of ` 2847.62 per G Cal
considering energy norms of each fertilizer unit plus average estimated capital related charge per MT)} 63 Capital Related Charge is derived after considering (1) interest rate of 12% pa on the debt (2/3 of capital cost) (2) return on
equity 18 (1/3 capital cost) and (3) depreciation 15% (95% of capital cost)
Report No. 6 of 2015
35
4.1.2
GoI in its policy for stage-III of new pricing scheme for urea manufacturing units (March 2007) targeted conversion of all64 functional naphtha and FO/LSHS based units to NG/R-LNG based within a period of three years (i.e. by 2009-10). None of the nine fertilizer units planned for conversion were converted to NG till 2011-12, five units got converted in 2012-13 and one unit was converted in 2013-14 (October 2014) (Annexure 10). Three units were in the process of conversion. (October 2014).
Accordingly, till October 2014 there were 30 urea producing units in the country of which 27 were gas based and remaining were based on other feedstock. Other feedstocks viz. naphtha, fuel oil (FO) and low sulphur heavy stock (LSHS) are costlier than NG/R-LNG. Moreover, the naphtha/FO/LSHS based units are less energy efficient and have a higher production cost.
GoI reimburses the difference between the cost of production and the statutorily notified sale price of urea as subsidy. Hence any increase in cost of production on account of use of costlier feedstock results in extra subsidy burden on the exchequer. Conversion of these nine units to NG prior to 2010 as targeted, would have resulted in savings in cost of production of urea of ` 2330.43 crore, ` 3827.98 crore and `1515.41 crore, for the years 2010-11, 2011-12 and 2012-13 respectively (Annexure-11 a, b, c & d) even after considering the CRC65 on the basis of estimated investment in conversion projects.
DoF stated (January 2014) that uninterrupted supply of NG to the plant was a pre-requisite for conversion of Naphtha-FO/LSHS based urea plants to NG based urea plants. This was possible only when there was pipeline connectivity to the plant and assured gas allocation. Gas allocation was in the hands of MoPNG and establishment of gas pipeline was done by companies under the administrative control of MoPNG. In addition, R-LNG terminals had not yet been built to supply R-LNG to three units. Conversion, therefore, got delayed and this was beyond the control of DoF. MoPNG accepted (July 2014) that one of the constraints was non-connectivity of pipeline. 64 MCFL (Magalore), DIL (Kanpur), ZACL (Goa), NFL (Bhatinda, Panipat and Nangal), SPIC (Tuticorin), GNVFC (Bharuch)
and MFL (Manali, Tamil nadu) : DIL, Kanpur was not functional upto May 2013. 65 Capital Related Cost is derived after considering (1) interest rate of 12% pa on the debt being 2/3 of capital cost) (2) return on
equity 18% being 1/3 capital cost and (3) depreciation 15% being 95% of capital cost
Increase in cost of production due to use of costlier feedstock

Report No. 6 of 2015
36
4.2
Electricity is an essential requirement on which socio-economic development of the country depends. National Electricity Policy (NEP), formulated (2005) by GoI therefore, aimed at accelerated development of this sector. NEP estimated requirement of need based capacity addition of more than one lakh MW during X and XI plans to provide over 1000 Kwh per capita electricity by 2011-12. Against this estimate, the country could achieve capacity expansion of 94,831 MW and 883.66 Kwh per capita electricity till the end of XI Plan66. During 2002-03 to 2012-13, the energy demand and peak hour demand registered 83 per cent and 66 per cent increase respectively. The actual generation, however, fell short of demand mainly due to limited availability of fuels. This led to energy deficit and peaking deficit at an identical nine per cent at the end of 2012-1367. Though there was 113 per cent increase in generation capacity, the deficit could not be wiped out on account of inadequate fuels (all types of fuels including coal, NG etc.).
As per NEP, use of NG as fuel for power generation depends on its availability at reasonable price. NEP envisaged that new power generation capacity based on indigenous NG at reasonable price would emerge as a major source of power. NGG covering various parts of the country could facilitate development of such capacity. Imported LNG based power plants are also a potential source of electricity generation and the pace of their development would depend on their commercial viability. The existing power plants using liquid fuel were to shift to use of NG or R-LNG at the earliest, to reduce cost of generation.
NG based power plants have low gestation period, low capital cost and lesser strain on resources like land and water. Moreover, NG based projects are ideally suited for meeting peaking requirements.
Based on preparedness of projects, Working Group on Power for XI Plan envisaged capacity addition of about 68,869 MW including 2,114 MW from NG/R-LNG fired plants. As availability of NG supply to the existing gas based power stations was inadequate and the plants had been operating at around 58 per cent to 60 per cent Plant Load Factor (PLF), the Working Group inter alia recommended GoI to ensure that assets like gas based power plants which had been set up with substantial investments were not stranded/idle or inadequately utilized on account of constraints of NG/infrastructure availability and should get priority over new units.
66 Installed capacity increased from 1.05 lakh MW at the end of IX Plan to 2.23 lakh MW on 31.03.2013, an increase of 1.18
lakh MW. The per capita electricity at the end of 2012-13 was 917.2 units (Source: Growth of Electricity sector in India- Table 1- CEA).
67 Energy demand increased from 545674 GWh in 2002-03 to 998114 GWh in 2012-13 and Peak demand increased from 81492 GWh to 135453 GWh during the same period (Source: Growth of Electricity sector in India- Table 9 - CEA)
Power sector

Report No. 6 of 2015
37
During XI Plan, the actual capacity addition of gas based plants was 5,936.58 MW including projects carried over from X Plan. Year wise capacity addition of gas based stations for the last 10 years ending March 2013 is given in Annexure 12. At present, (2012-13) gas based plants account for nine per cent of all India installed capacity68. As there was moderate capacity addition to gas based stations, demand of NG increased from 48.26 mmscmd in 2002-03 to 135 mmscmd in 2012-13 to run these plants at 90 per cent PLF.
A report submitted to GoI in 2004 by the ‘Expert Committee on Fuels for Power Generation’ under the aegis of Central Electricity Authority (CEA) assessed the competitiveness of NG for power generation. The Committee analysed various fuel options for varying distances between the location of fuel source and the load centre for base load (80 per cent PLF) and peaking plants (30 per cent PLF). The study included LNG as an optional fuel and concluded that for base load operating plants (at 80 per cent PLF and 800 Km between the source and load centre) LNG ranked (Rs 2.29/ kWh) above the liquid fuels like Naphtha (` 4.46/kWh) and Diesel (` 5.96/kWh) in terms of cost of generation.
MoP opined that (October 2014) in view of substantial increase in LNG price in international market, the findings of the study might not be true in the present context as LNG based power generation was very costly and non-despatchable. MoP also stated (January 2015) that price of imported RLNG rose to a level which rendered power generation based on imported RLNG completely uneconomical.
Reply of MoP and audit observation need to be viewed in the context that there were gas based plants in the country which were suffering generation loss on account of non-availability of NG/R-LNG and plants having arrangement for alternate fuel had to use costlier fuels as mentioned in subsequent paragraphs.
Further, audit analysis given in Table 1, reveals that generation cost of power based on long term R-LNG would have been economical as compared to generation cost on Naphtha. This analysis was based on comparison of year wise long term R-LNG price availed by GAIL with corresponding prices of Naphtha. This underlines the deficiency in planning at various levels due to which, on the one hand, gas based power plants were established and on the other hand, co-ordinated approach for infrastructure development for supply of NG/R-LNG such as NGG, R-LNG infrastructure to facilitate procurement of NG on long term contract basis, was lacking.
Inadequate steps taken to meet shortage of NG/R-LNG led to a situation where gas based power plants suffered losses as observed below:
As on 31 March 2013, there are 55 major gas based power plants with a total installed generation capacity of 18,362.27 MW. As against total requirement of
68 Coal is the main fuel (fifty per cent) in India’s energy sector followed by hydro (eighteen per cent)
Report No. 6 of 2015
38
90.70 mmscmd NG for operating these plants at 90 per cent PLF, actual availability was 40 mmscmd only. Availability of NG/R-LNG to these plants was short of demand during the ten years period ending 2013 resulting in underutilization of installed capacity. CEA had worked out loss of generation of power to the extent of 66,129.10 Million Units (MUs) for the period 2008-09 to 2012-13 due to short supply of NG69 as reported by power units. (Annexure 13). Financial impact on account of above loss of generation could not be worked out by Audit as cost of production as well as supply price of electricity varies from state to state.
Where there is a provision for use of alternate fuel in gas based plants, generation loss on account of non-availability of NG was compensated by using Naphtha and HSD. As cost of these liquid fuels is comparatively higher, cost of power is proportionately increased. It could be seen from Annexure 13 that during the period 2008-09 to 2012-13, gas based plants had used 31.35 Lakh Kilo litres Naphtha and 5.01 Lakh Kilo litres HSD to make up non-availability of NG/R-LNG. Based on the computation of cost of power by ‘Expert Committee on Fuels for Power Generation’, increase in cost of power due to using Naphtha instead of R-LNG70 would work out to an estimated ` 482.34 crore, ` 1023.08 crore and ` 869.91 crore during 2010-11, 2011-12 and 2012-13 respectively (Annexure 14) which was ultimately passed on to consumers.
Combined Cycle Power Plant of NTPC at Kayamkulam (set up in 1998-99) was planned with Naphtha as primary fuel and later to be operated on NG available from the proposed LNG terminal at Kochi. LNG terminal which was originally planned for commissioning in 2001-02, was commissioned in September 2013. Pipeline connectivity linking LNG terminal and power plant though envisaged in the gas grid project (2000) was yet to be undertaken (October 2014). As LNG project/pipeline was indefinitely delayed, Kayamkulam plant is yet to be converted to NG (October 2014), and was using costlier fuel (Naphtha) for generation of electricity. During the period 2008-09 to 2010-11, a quantity of 14.83 lakh Kilo litres Naphtha and HSD was used to produce 6342.87 MUs in the absence of NG/R-LNG.
Thus, non-availability of NG/R-LNG at affordable rate and inadequate pipeline infrastructure resulted in higher generation cost of power. Moreover non-availability of NG had forced CEA to issue (March 2013) an advisory to all the developers of power plants not to plan any gas based power plants till 2015-16.
69 This generation loss is computed after considering the power generated by using costlier fuels like Naphtha and HSD 70 Rate of R-LNG at long term contract rate is taken for computation

Report No. 6 of 2015
39
4.3
Underutilization of pipeline capacity
At present, the country possesses 15,340 km length of NG pipeline infrastructure with a capacity to transmit 395 mmscmd NG (Annexure 15). NG domestic production available for sale fell substantially from 126.14 mmscmd (2010-11) to 79.4 mmscmd (2013-14) leading to widening gap between demand and supply. Resultantly, R-LNG gained importance as a viable option for meeting the demand. LNG is imported either under long term agreement or through spot71 purchase from major LNG suppliers. Currently (2013-14), total LNG imports to the country is 10.76 mmtpa (38.74 mmscmd), out of which 7.5 mmtpa (27 mmscmd) LNG is being procured under long term contract72. At present, the total re-gasification capacity is 22 mmtpa (79.2 mmscmd).
It was noticed that up to 2004-05, the country had two LNG terminals with re-gasification capacity of 7.5 mmtpa which increased to 22 mmtpa only during 2013-14. Delay in creation of R-LNG infrastructure (as discussed in Chapter 3) led to non-availability of LNG at affordable price through long term arrangement and obstructed development of LNG trade in the country. In the absence of long term arrangements, spot cargoes were imported at costlier price based on demand. This again was hampered due to slot availability constraints at LNG terminals.
Non availability of LNG at affordable price along with substantial reduction in domestic production of NG led to underutilization of existing pipeline capacity as discussed below:
Total transmission capacity in the country was increased from 309 mmscmd in 2011-12 to 395 mmscmd in 2013-14. The average capacity utilization, however, reduced from 64 per cent in 2011-12, 60 per cent in 2012-13 to 47 per cent in 2013-14 (Annexure 15).
Total length of pipelines owned by GAIL (2013-14) is 10,841 Km making it the leading pipeline infrastructure provider73 in the country (71 per cent) with transmission capacity of 244 mmscmd. Average utilization of transmission capacity, however, fell from 72 per cent (2011-12) to 68 per cent (2012-13) and 45 per cent in 2013-14.
71 Spot trading is market, where R-LNG is bought and sold on daily basis. 72 Long term contract between Petronet LNG Limited (PLL) and Ras gas, Qatar 73 Gujarat State Petronet Limited (GSPL) 1874 Km (twelve per cent) and Reliance Gas Transportation Infrastructure Limited
(RGTIL) 1469 Km (ten per cent)
Pipeline infrastructure providers

Report No. 6 of 2015
40
Thus, existing capacity of pipeline infrastructure is underutilized for want of NG/R-LNG. Low capacity utilization would have an adverse effect on commercial interest of companies providing transmission infrastructure.
GAIL stated (August 2014) that utilisation of gas pipeline infrastructure takes place over the years. Major factors upon which gas pipeline utilisation depends are availability and affordability of gas, industrialisation, Government policies etc. Specific reasons for underutilisation were low production from KG D6 field; non development of consuming sectors especially CGD, high price of R-LNG etc.
MoPNG stated (January 2014) that in view of lack of customers, gas marketers were cautious in entering into long term gas purchase agreement with exporters. Therefore, slow development of LNG terminal was not the only cause for underutilisation of existing pipelines.
Reply needs to be viewed against the fact that actual utilisation of pipelines is much below even compared to en-route demand as assessed by respective entities before setting up the pipeline. GAIL replied (December 2014) that this was mainly due to non-materialisation of projects planned by various NG consuming sectors.
Recommendation: 2. MoPNG in coordination with DoF and MoP may consider setting up of Inter
Ministerial Committee that could suggest: i. A time bound action plan for synchronising implementation of NG pipeline
projects and revival of fertilizer units so that benefit of NG as feedstock may be derived optimally besides reducing import of urea.
ii. Measures to create required infrastructure to provide NG/R-LNG to Power Sector at affordable price so that capacity created in the sector is adequately utilised.


Report No. 6 of 2015
41
5.1 Considering the demand, availability and imputed economic value of NG in various sectors, Gas Linkage Committee (GLC) allocated (till 2005) NG (APM Gas) from nominated blocks of NOCs to various consumers. Allocations were made based on the requests received from prospective consumers and the recommendations of concerned Ministries, depending on the availability of NG in the concerned region. In view of the importance of fertilizer and power sectors in the national economy, preference in allocations was given to these two sectors. As there was no further APM gas available for allocation to new consumers, GLC was wound up in November 2005.
Thereafter, GoI constituted (2007) an Empowered Group of Ministers (EGoM) to decide issues pertaining to commercial utilization of gas produced under NELP. Meanwhile, GoI allowed (2010) NOCs to sell NG from new fields in their nominated blocks at approved non-APM rate. Accordingly, MoPNG formulated (October 2010) a policy on pricing and commercial utilisation of non-APM gas produced by NOCs which maintained sector wise priority74.
As far as allocation of NG from NELP fields was concerned, EGoM had decided following principles:
i) As a matter of general policy, NG produced/imported should be stripped off its higher fractions75, subject to availability, to ensure maximum value addition before supply to consumers.
ii) Sale of NG by NELP contractors would be based on the following guidelines: a) Contractors would sell NG from NELP in accordance with the
marketing priorities determined by GoI and the sale would be on the basis of the formula determining the price as approved by GoI.
b) Consumers belonging to any of the priority sectors should be in a position to actually consume gas as and when it becomes available. So the marketing priority did not entail any ‘reservation’ of gas. It implies
74 Order of priority :- Gas based fertilizer units, LPG plants, Power plants supplying power to grid, CGD for domestic and
transport, steel, refineries & petrochemicals for feedstock, CGD for industrial and commercial customers, any other customer for captive & merchant power, feedstock or fuel purpose
75 Methane (C1) is the predominant component in Natural Gas. Extraction of other components with higher carbon content viz Ethane (C2), Propane (C3), Butane (C4) etc for being used in production of other products such as polymers, LPG etc is known as stripping of higher fractions.
Gas allocation/ utilization policy
Chapter Supply of Natural Gas 5
Report No. 6 of 2015
42
that in case consumers in a particular sector, which is higher in priority, were not in a position to take gas when it became available, it would go to the sector which was next in order of priority.
c) In case of default by a consumer under a particular priority sector and in the event of alternative consumers not being available in the same sector, the gas would be offered by the contractor to other consumers in the next order of priority.
d) The priority for supply of gas from a particular source would be applicable only amongst those customers who are connected to existing pipeline network connected to the source. So, if there was a marginal or small field that was not connected to a trunk pipelines or grid network, the contractor would be allowed to sell to consumers who were connected or could be connected to the field in a relatively short period (of say three to six months).
EGoM then decided to allot NG in the following order of priority:
Existing gas-based urea plants Existing gas-based LPG plants Existing grid-connected and gas-based power plants CGD network for domestic and transport sectors
A decision was also taken to supply NG to steel, petrochemicals and refineries for feedstock purposes, CGD networks for industrial and commercial customers, other gas based fertilizer plants and to captive power plants.
The sector wise priority for allocation of indigenous gas was formulated to serve the larger public interest. Details of sector wise allocations made so far are given in Annexure 16. It could be seen that the allocation of domestic NG was to the tune of 236.79 mmscmd which was far in excess of available domestic production of 95.00 mmscmd.
5.2
GAIL was incorporated in August 1984 as a Central Public Sector Undertaking under MoPNG. GAIL plays a key role as a NG market developer in India and holds around 60 per cent share in India's gas market. Major supplies of NG include fuel to power plants, feedstock for gas-based fertilizer plants, LPG extraction etc.
Role of GAIL (India) Limited in supply of NG at regulated price
Report No. 6 of 2015
43
GAIL as a GoI nominee holds the right to procure and sell gas from existing fields of ONGC, OIL, Tapti, Panna-Mukta and Ravva. NG from existing fields of nominated blocks of ONGC and OIL is supplied at the price fixed by GoI and as per allocations whereas NG from pre-NELP/NELP fields is sold at the price as per respective Production Sharing Contracts.
GAIL also maintains a gas pool account on behalf of GoI to take care of gain or loss from supply of APM/non-APM gas to consumers of APM/non-APM gas. Therefore, GAIL is required to exercise prudent control over the gas supply transactions to ensure that supply of NG is in line with the gas allocation policy and takes care of financial interests of GoI. 5.3
Power and fertilizer sectors being critical to economic development of the country, receive about 69 per cent of domestic gas at APM price through allocation. GoI decided (June 2005) to supply all available APM gas to power and fertilizer sector consumers against their existing allocation along with other specific end users committed under Court orders/small scale consumers having allocation up to 0.05 mmscmd at the revised price of ` 3200/mscm76. It was also stipulated that consumers other than those specified in the order and getting existing gas supplies through network of GAIL, would be supplied NG at market related price.
Audit noticed instances where available APM gas was not utilised for the specified purpose mentioned in the GoI order. In fertilizer sector this results in loss of production of urea with resultant avoidable extra burden on subsidy/under realisation in Gas Pool account. In other sectors, non-recovery of market rate results in under realisation in the Gas Pool account. These issues are discussed in paragraphs 5.3.1 to 5.3.3. 5.3.1
There are 30 urea units in the country (as on October 2014). Out of these, 27 units use NG (either domestic/R-LNG or both) as feedstock and fuel and remaining three urea units77 use naphtha as feedstock and fuel. Regarding utilization of NG from domestic source in fertilizer sector, MoPNG directed (July 2006) that products other than fertilizers were not covered under supply of APM and the quantity of APM gas utilized for manufacturing products other than fertilizers should be charged at market
76 Metric Standard Cubic Meter 77 Mangalore Chemicals and Fertilizers Limited (MCFL), Madras Fertilizers Limited (MFL) and Southern Petrochemicals
Industries Limited (SPIC)
Absence of mechanism for monitoring end use of NG
Fertilizer sector

Report No. 6 of 2015
44
price. Market price was defined as price depending on the producer price being paid to joint venture and private operators at land fall point subject to a ceiling of ex-Dahej R-LNG price.
MoPNG directed (October 2009) GAIL to charge market rate for the APM gas utilized by fertilizer units for manufacturing products other than fertilizers from 1 January 2009. As regards period before 1 January 2009, it was directed that GAIL should examine financial implication of charging APM rates for chemicals, both on Gas Pool account/GAIL in terms of revenue forgone as well as on GoI subsidy and losses to the concerned companies etc.
GAIL, repeatedly requested Fertilizer Industry Coordination Committee78 (FICC) and DoF to provide details regarding usage of NG for fertilizer and non-fertilizer purpose for which they did not receive reply till July 2014.
Audit noticed instances of use of APM gas for other than specified purpose by three fertilizer units79. Non- implementation of GoI directives for billing of gas utilised in production of products other than fertilizer at market rate and extra burden on subsidy were commented upon in the Reports of the Comptroller and Auditor General of India, Union Government (Commercial)80. It was also pointed out in the Reports that there was lack of effective coordination between MoPNG and DoF in resolving the issue. For the period beginning January 2009, the chances of sub-optimal recovery in Gas Pool account and excess payment of subsidy on fertilizer production in the absence of mechanism to verify usage of NG in GAIL were also reported.
Audit subsequently noticed (2013) that four fertilizer units (CFCL I and II, KSFL, IGFL and TCL) had not utilised entire quantity of APM gas received by them during 2010-11 and 2011-12 for specified purpose. GAIL, however, was yet to recover non APM price amounting to ` 5.34 crore81 (Annexure- 17 a) for the quantity of APM gas not utilised for production of urea. This shows that a mechanism for ascertaining utilisation of NG supplied at regulated price was still not effective in MoPNG/GAIL and DoF.
Regarding utilization of NG supplied at APM rate, DoF stated (February 2012) that quantity of NG used by units for any other purpose apart from production of urea would be ascertained and differential price from either imported ammonia or any other benchmark would be recovered from the units. EGoM directed (February 2012) DoF
78 FICC, an attached office under DoF, is responsible to evolve and review periodically, the group concession rates including
freight rates for units manufacturing nitrogenous fertilizers, maintain accounts, make payments to and to recover amount from fertilizer companies, undertake costing and other technical functions and collect and analyse production data, costs and other information. FICC computes concession rate for urea (as per the norm fixed by the GoI) based on which quantum of subsidy for urea is decided.
79 Deepak Fertilizers and Petrochemicals Corporation Limited, Rashtriya Chemicals & Fertilizers Limited and Gujarat Narmada Valley Fertilizers & Chemicals Limited.
80 Para No. 13.2.1 of Audit Report no. 9 of 2009-10 & Para no. 11.6 of Audit Report no. 8 of 2012-13. 81 Amount recoverable has been estimated as the difference between APM price charged to respective units and non-APM price
approved by GoI along the HVJ pipeline as per the methodology adopted by GAIL.

Report No. 6 of 2015
45
to frame specific guidelines by May 2012 to exercise control over usage of APM gas. DoF, subsequently referred (September 2014) the issue of framing guidelines for effecting the undue gains by Phosphatic and Potassic Fertilizer units to the Inter-Ministerial Committee82.
MoPNG stated (January 2014) that despite follow up with DoF to furnish quarterly utilisation certificates for APM gas, the requisite details had not been furnished by DoF. As GAIL did not have a mechanism to evolve a system on its own to ascertain the quantity of NG utilised by fertilizer units for manufacturing non fertilizer products and for its billing at market rate, MoPNG suggested following modalities (July 2014) to GAIL for necessary action:
For all future gas supplies to fertilizer units, GAIL would insist on quarterly returns certified by FICC, failing which GAIL would charge non APM rates for entire gas.
For past period, GAIL would issue notice to all fertilizer units to submit utilisation certificates indicating usage of supplied gas within a period of three months from 29 November 2013 duly certified by FICC, failing which GAIL would raise invoices for differential amount between non APM and APM gas price for the entire period and quantities of past supplies.
GAIL accordingly informed (August 2014) fertilizer units to furnish the required certificate to which compliance by fertilizer units is awaited. DoF, however, stated (October 2014) that there is a practical difficulty in giving certificate of NG usage by FICC in respect of urea units. FICC relied upon invoices raised by GAIL for quantity of NG supplies and as GAIL had its manpower deployed at supply points, GAIL should develop a system to check the usage of NG.
Regarding non recovery of market price from four fertilizer units (CFCL I and II, KSFL, IGFL and TCL) for the quantity of APM gas not utilised for production of urea, DoF stated (October 2014/January 2015) that, in the production process of urea, ammonia and carbon dioxide (CO2) are produced first and ammonia so produced is converted into urea with available CO2. However, it often happens that entire ammonia produced cannot be converted into urea due to reasons like interruptions in plant, limitation of quantity of available CO2 in the NG etc. Further, due to limited storage facility and safety reasons, the surplus ammonia beyond safe level is sold off by units. The gain to the fertilizer unit by sale of this surplus ammonia is shared between GoI and the fertilizer unit and this revenue was more than market rate recoverable from the unit for NG not utilised for production of urea. Hence production of surplus ammonia by using APM gas was not to be viewed as diversion of APM gas. 82 Constituted under the Nutrient Based Subsidy Policy with representatives from MoPNG, DoF and Ministry of Law.

Report No. 6 of 2015
46
In respect of four units mentioned above, amount recovered towards share of GoI in the gain on sale of surplus ammonia as intimated by DoF was ` 35.85 crore. This should be viewed against the following facts:
In all these cases there was sufficient achievable capacity. Non production of urea, therefore, led to shortfall in meeting the demand which was met by means of import.
Subsidy on imported urea was always higher than the subsidy on domestically produced urea.
One of the reasons put forth by DoF for non conversion of excess ammonia to urea was non availability of sufficient CO2 in the lean gas. This may be viewed against the fact that GAIL removes CO2 from NG in HVJ pipeline as per production process of petrochemicals. Lean gas, which is stripped off higher fractions and CO2, is then sent back to HVJ pipeline for supply to other consumers. KSFL, CFCL, TCL and IGFL draw NG from this pipeline. Therefore, on the one hand, GAIL is removing CO2 from NG and on the other hand, fertilizer units are facing shortage of CO2. DoF/MoPNG may examine possibilities of augmenting availability of CO2 to fertilizer units on the basis of economic feasibility and viability as this would go towards reducing the burden of subsidy on GoI. In the case of only four units mentioned above, non conversion of excess ammonia led to production loss of urea to the extent of 147.79 TMT during the year 2010-11 and 2011-12. Average differential subsidy on urea produced by these units and urea imported was ` 8998 and ` 16199 per MT during 2010-11 and 2011-12 respectively. Therefore, estimated amount of subsidy that could have been saved by converting entire ammonia into urea would be ` 196 crore (Annexure 17 b), which is far more than ` 35.85 crore recovered by GoI towards share of gain on sale of surplus ammonia. Other reasons attributed by DoF are urea plant interruptions and lack of storage facility for ammonia which are required to be tackled separately at plant level.
GAIL recovers non-APM rate for the quantity of APM gas used for other than specified purpose as per the existing orders. It was, however, noticed that after implementation of new gas price policy, price of APM gas and non-APM price have become equal with effect from 1 November 2014. In this scenario, rate at which recovery would be effected for quantity of NG diverted for other than specified purposes needs to be decided.

Report No. 6 of 2015
47
5.3.2
MoPNG directed (June 2006) that as far as power sector consumers were concerned, APM price would be applicable only for those quantities of gas which were used for generation of electricity for supply to the grid for distribution to consumers through public utilities/licensed distribution companies.
Instances of use of APM gas for other than specified purposes were commented in the Reports of Comptroller and Auditor General of India, Union Government (Commercial)83. It was pointed out that GAIL failed to comply with directions of MoPNG and extended undue benefit to seven private power producers84 generating and supplying power to their end users at commercially agreed rate under wheeling arrangement. At the instance of Audit, GAIL started recovering market driven price for the gas consumed by these consumers from November 2011. These consumers, however, invoked arbitration clause against the action taken by GAIL for recovery of ` 246.16 crore for the period prior to November 2011. The matter is under various stages of arbitration and recovery is pending (October 2014).
Audit further noticed that GAIL failed to evolve an effective system to arrest such unauthorized use of APM gas despite deficiencies being pointed out. Two instances, where GAIL failed to detect unauthorized use of APM gas by consumers timely and to take action for recovery of market rate from them as noticed in Audit are discussed below:
Andhra Pradesh Gas Power Corporation Limited (APGPCL) is a public limited company formed (October 1988) to set up a gas based power generating station in Andhra Pradesh (AP). The company was initially promoted by Andhra Pradesh State Electricity Board (APSEB) along with other Central and State PSUs and private sector entities. The Company was later transformed into Public Private Partnership (PPP) model with 26 per cent equity participation of APSEB. As per Memorandum of Understanding (MoU) entered into between shareholders (October 1988 and April 1997), the power generated is distributed among its shareholders (Annexure 18) on cost to cost basis.
APGPCL was getting APM gas as per allocation and in accordance with the agreement between APSEB and GAIL (November 1990). The agreement was revised (January 1997) by increasing the quantity85 and
83 vide Para no. 12.2 of Audit Report No 3 of 2011-12 and para no. 11.5 of Audit Report No 8 of 2012-13 84 Sai Regency Power Corporation Private Limited, Arkay Energy (Remeswaram) Limited, Coromandel Electricity Company
Limited, OPG Energy Pvt. Limited, Saheli Exports Private Limited, Kaveri gas power Limited and MMS steel & Power Limited
85 Quantity of gas to be supplied was increased from 0.4 to 0.5 mmscmd (0.4 on firm and 0.1 on fall back basis)
Power sector
Report No. 6 of 2015
48
extended from time to time. The present Gas Sales and Transmission Agreement (GSTA) is valid upto 31 December 2015 for supply of 1.22 mmscmd gas as per allocation at APM rate of US$ 4.2/mmbtu86.
GAIL entered into gas supply contract for supply of gas to Andhra Fuels Limited (AFL) in May 1996 which was extended from time to time. Present agreement was entered into (December 2010) for supply of 0.1 mmscmd gas on firm and/or fallback basis as per allocation at APM rate of US $ 4.2 per mmbtu.
Both APGPCL and AFL were using APM gas for captive consumption since beginning. APGPCL was sharing power at the price fixed by a committee of Directors, among its shareholders under wheeling arrangement and AFL was reselling NG to another consumer. Utilisation of APM gas, therefore, was not in conformity with the MoPNG directives. It was mandatory for GAIL to charge market rate for the quantity of gas consumed in accordance with pricing order of June 2005.
Audit noticed that market rate was not charged till 2013 owing to deficiencies in the system of gas supply contract management as discussed below:
Article 17 of GSTA stipulated that buyer shall neither sell gas to any other
party nor use it for any other purpose other than those contemplated unless and otherwise approved by GoI and/or mutually agreed to in writing by the buyer and the seller. It may be noted that GAIL is acting as GoI nominee with the right to procure and sell APM Gas as per allocations. Therefore, incorporation of a clause in GSTA, permitting buyer to use the gas for purpose other than those contemplated therein with mutual agreement between buyer and seller, defeated the very principle behind allocation of a scarce natural resource.
The agreement did not include a clause/article permitting GAIL to verify end use of NG and charge non-APM rate in case of misuse.
Government of AP constituted an institutional arrangement viz. Andhra Pradesh Power Coordination Committee (APPCC) in June 2005 to co-ordinate the affairs of distribution licensee companies of AP. GAIL had an option to verify the credentials of APGPCL and AFL with APCC in 2005. However, GAIL obtained information from APPCC only in September 2012.
86 Million Metric British Thermal Unit

Report No. 6 of 2015
49
APPCC confirmed (September 2012) that APGPCL supplied 21 per cent (share of APSEB) of power generated by it to the grid for public purposes under Power Purchase Agreement (PPA) and AFL did not supply power to the grid (AP TRANSCO). Based on this information, GAIL raised (January 2013) debit note of ` 308.91 crore87 on APGPCL towards difference of APM and non-APM price for the quantity of NG consumed to the extent of 79 per cent for the period July 2005 to December 2012. Similarly, debit note of ` 27.18 crore88 towards difference of APM and non-APM price for the quantity of gas supplied to AFL for the period July 2005 to February 2013 was issued in February 2013.
In both cases GAIL supplied APM gas as per allocations and in terms of agreement with consumers. The agreement inter alia specified the applicable rate for gas as APM. The agreement was revised periodically with the same terms and conditions. Consumers in both the cases proceeded for legal remedy. As a decision in this regard was awaited, GAIL had not demanded (October 2014) market rate even for the subsequent period from both consumers.
GAIL stated (October 2013) that it delivered gas to consumers at delivery point where the quantity of gas supplied was measured by a single meter. Beyond delivery point, it was the customer who made arrangement to take the gas for usage at various locations. Since delivery of gas was completed as per contract at the delivery point, GAIL had no authority to ascertain the usage of power produced by the gas supplied to customers. GAIL further stated (August/December 2014) that specific clarification sought from MoPNG in 2006-07 regarding applicability of APM price to various groups of power customers was not received.
MoP stated (January 2015) that verification would be carried out if there was complaint or doubt about utilisation of gas, but that no such case had come to notice of the Ministry, so far, regarding gas supplied by GAIL.
The replies need to be viewed against the facts that:
(i) GAIL, being the GoI nominee for supply of NG, should have verified the utilization of gas supplied at APM rate by incorporating an enabling provision in the agreement to that effect. Moreover, as allocation of APM gas to the units in power sector was made on the recommendation of MoP, a proper mechanism to verify the end use of power produced by them should also have been in place in MoP. (ii) Instances of utilisation of APM gas for other than specified purposes by seven power producers were reported in previous Audit Reports of CAG (para no. 12.2 of Audit Report no. 3 of 2011-12 and para no. 11.5 of Audit Report no. 8 of 2012-13). An amount of ` 246.16 crore was pending recovery by GAIL in these cases. Further, 87 ` 308.91 crore includes ` 39.12 crore towards VAT@ 14.5% 88 ` 27.17 crore includes `. 3.44 crore towards VAT @ 14.5%

Report No. 6 of 2015
50
cases of two more power producers i.e. APGPCL and AFL have also been mentioned in this Report where power was being used for captive consumption instead of being supplied to the grid for distribution to consumers, which was not an authorised use of APM gas. Recovery of ` 308.91 crore and ` 27.18 crore was pending from APGPCL and AFL respectively, on this account.
5.3.3
GAIL was supplying APM gas to small scale consumers as per the allocations and in terms and conditions of GSTA. MoPNG inter alia stipulated (June 2005) that any supply beyond APM allocation would have to be made at non-APM/market related price. Audit noticed that though GSTA provided for recovery of price at any time in future as per directive, GAIL did not enforce the clause within the validity period of existing agreement with consumers in Vadodara region.
MoPNG issued a further directive (February 2010) clarifying that any supply beyond APM allocation would have to be made at non-APM rates in accordance with gas pricing order of June 2005. On the above direction, GAIL started recovering non-APM price prospectively i.e. with effect from April 2010 for supply made beyond allocation. However, GAIL did not initiate action for recovery of arrears for the past period i.e. 1 July 2005 to 31 March 2010 before expiry of existing agreement until May 2012. Raising a claim for past period after the expiry of existing agreement led the consumers to go for legal remedies. This resulted in non-recovery of ` 43.01 crore (Annexure 19).
GAIL stated (November 2013) that MoPNG had addressed the issue of utilization of gas from small/isolated fields through revised guidelines (July/August 2013). The guidelines stipulated that if the average drawal quantity in last six months of a customer drawing gas from small/isolated fields had been more than its allocation (APM and/or non-APM allocation taken together), such excess quantity over and above its allocation should be allocated on ‘fall back’ basis. This additional fall back allocation was to be at non-APM price as notified by GoI from time to time.
GAIL further stated (August/December 2014) that pricing order dated 20 June 2005 had no provision for charging non-APM price for quantities supplied beyond allocation. The reply needs to be viewed against the fact that point no. (iv) of the said pricing order inter alia stipulated that “Consumers other than fertilizer, power and specific end users committed under Court Orders/Small Scale Consumers having allocations up to 0.05 mmscmd and getting existing gas supplies through GAIL network, would be supplied natural gas at market related price”. Moreover, MoPNG
Small scale consumers
Report No. 6 of 2015
51
order dated 9 February 2010 was only an order reiterating the terms of order dated 20 June 2005.
The fact, therefore, remains that GAIL did not recover market rate from 18 small scale consumers in Vadodara region who were using NG in excess of allocation and by not enforcing the pricing order of June 2005 timely led to non-recovery of ` 43.01 crore.
5.4
As per computation of Fertilizer Association of India (FAI) in June 2011, by using one mmscmd KG D6 Gas (based on energy content of 8200 KCL/SCM which makes approximately 1400 MT urea) instead of other alternative feedstock,the saving in production cost of urea would be ` 556 crore per annum. Therefore, it was essential to utilize available NG at APM rate to the maximum extent possible for production of urea. Underutilization of available NG not only results in loss of production but also leads to import of more urea. This leads to payment of extra subsidy as the subsidy paid on imports is more than the subsidy paid on domestic production.
Test check revealed instances where certain units did not fully utilize NG supplied to them at APM rate to optimum level, causing loss of production. All these units had further achievable production capacity. During the same period, none of the gas based fertilizer units received NG in excess of quantity allocated which indicated that the quantity underutilized by the units were not used in any other fertilizer units. Certain units utilised costlier NG instead of using available APM gas which increased the cost of production of urea.
Loss of production/increase in cost of production of urea deprived the opportunity for GoI to reduce subsidy burden by ` 637.07 crore (Annexure 20) as detailed below:
I. GoI allocated 1.72 mmscmd APM gas to Brahmaputra Valley Fertilizer Corporation Limited (BVFCL), a GoI undertaking situated at Namrup in Assam. BVFCL underutilized 0.30 mmscmd in 2008-09 and 0.27 mmscmd in 2011-12 out of the NG available to it during the period. The resultant surplus NG was not used elsewhere to compensate the loss of production of urea, as there was no pipeline infrastructure to transmit the same.
DoF replied (January 2014) that BVFCL plants at Namrup-II and III were 35 and 26 years old respectively and built on technology considered outdated. Considering the actual status of plants FICC had also relaxed norms of operation for these units. DoF also stated (January 2015) that there were many technical reasons viz. frequent equipment breakdowns,
Low off-take of allocated quantity by fertilizer units

Report No. 6 of 2015
52
restriction of gas supply, strikes, blockades etc for low on streams days leading to loss of production of urea.
Constraints of the plant as stated by DoF were considered and subsidy burden of ` 55.72 crore (Annexure 21) was estimated on the production loss based on the quantity of APM gas not utilized as accepted by BVFCL.
II. Actual consumption of NG by Nagarjuna Fertilizers and Chemicals Limited, (NFCL) Kakinada (AP), was less than the actual supply available during 2011-12 and 2012-13. Underutilization of one mmscmd NG results in loss of production of 1.339989 TMT. Production loss on account of underutilization was 0.51 LMT. Resultant extra expenditure on subsidy works out to ` 98.04 crore (Annexure 22).
DoF stated that (January 2014) actual production during the period was in excess of reassessed capacity of the unit. Production beyond the reassessed capacity was under incentivized production which the company might or might not produce. DoF further stated (January 2015) that NFCL receives its NG requirement from ONGC, CAIRN and RIL. There was not much disparity between the landed cost of NG from these sources. Similarly as explained by NFCL, when there was occasional excess NG availability some margin was kept by it while nominating NG from different sources.
Reply needs to be viewed against the fact that the production loss was estimated based on the data on consumption of NG made available by FICC in respect of the unit which indicated that there was under utilisation of NG at APM rate. Moreover, GoI had incentivized urea units to produce more than their assessed capacity to ensure that the available cheaper gas was utilized to the maximum possible extent for production of urea and this would have saved additional outgo of subsidy.
III. A. GoI allocated 2.24 mmscmd APM gas to NFL, a GoI undertaking, situated at Vijaipur (MP) during 2012-13. Actual availability, however, was ranging between 1.39 mmscmd to 2.08 mmscmd during the year, against which, actual consumption was less in all the months during the period and costlier gas90was consumed fully, against the supply. Underutilization of one mmscmd per day results in loss of production of 1.321591 TMT. During nine months from April 2012 to December 2012, NFL
89 Production target 15.65 LMTPA /(required NG 3.2 mmscmd X No. of days in a year 365 days) ie 0.013399 LMTPA ie
1.3399 TMT 90 PMT, RIL, Non-APM and Spot-RLNG 91 Annual production target 20.5 LMTPA /(required gas 4.25 mmscmd X No. of days in a year 365 days) i.e. 0.013215 LMTPA
i.e. 1.3215 TMT

Report No. 6 of 2015
53
underutilized APM gas from 0.01 mmscmd to 0.61 mmscmd from NG available to it. This resulted in loss of production of 0.65 LMT urea and consequent extra burden of subsidy amounting to ` 139.63 crore (Annexure 23) on GoI.
III. B. Actual supply of APM gas to KRIBHCO, a co-operative society at Hazira,
Gujarat was ranging between 1.62 mmscmd and 2.31 mmscmd during 2011-12 and 2012-13 which was less than the required quantity (3.0 mmscmd). However, during the period July 2011 to October 2012, short consumption of APM gas (0.01 mmscmd to 1.16 mmscmd) was noticed. One of the reasons for underutilization of gas was shut down of ammonia stream. Audit, however, noticed that during the period other costlier gas92 was consumed instead of available cheaper gas. As underutilization of one mmscmd per day resulted in loss of production of 1.225493 TMT, this meant loss of production of 1.66 LMT with consequent extra burden on GoI of ` 340.45 crore towards subsidy (Annexure 24).
III. C. Gujarat State Fertilizer Corporation (GSFC) consumed NG from costlier source instead of using the cheaper gas available during six months in 2011-12 and five months in 2012-13. Resultantly, cost of production increased by ` 3.23 crore which was extra subsidy burden on exchequer (Annexure 25 a & b).
DOF replied (October 2014) that:
(a) Units sometimes had to take costlier gases to avoid penalties due to ‘take or pay’ clause;
(b) APM gas was underutilized due to shutdown/revamping of plants etc.; (c) Priority of usage of gas was drawn on day to day basis and calculating
usage of APM and non-APM gas on monthly basis would give misleading conclusions i.e. long term data would show that a unit has used costlier gas inspite of possible availability of cheaper gas whereas in reality on day to day basis the units exhausted the usage of cheaper fuel before going to procurement of costlier gas.
DoF further stated (January 2015) that actual production was above the reassessed capacity (of NFL); hence there was no loss of production due to low off-take. Data available with audit, however, revealed that plants can operate even above the reassessed capacity as per the demand. Therefore, DoF should ensure that units make full utilisation of NG supplied at APM price so that subsidy burden of GoI is kept at minimum.
92 RIL, Non-APM and Spot-RLNG 93 Annual production target 22.14 LMTPA /(required gas 4.95 mmscmd X No. of days in a year 365 days) i.e. 0.01225405
LMTPA ie 1.2254 TMT

Report No. 6 of 2015
54
Above reply of DoF needs to be viewed against the following facts:
(a) APM gas should have been used fully to keep the cost of production of urea low, as cost of production has direct impact on the subsidy being paid by GoI.
(b) Audit noticed instances that during the period where DoF had given shutdown/revamping as reasons for low off-take of APM gas, respective units utilized other costlier gases fully.
(c) No documentary evidence was furnished by DoF in support of their argument that calculation on the basis of monthly data would give misleading conclusions. It may also be noted that FICC had expressed their inability to certify usage of NG even on quarterly basis which shows that a mechanism to ensure the utilization of APM gas is yet to be derived.
5.5
Fertilizer sector receives about 23 per cent of domestic gas at APM price as per the priority set by GoI which includes about 15 mmscmd from KG D6 field operated by the contractor94. GAIL, being the GoI nominee, supplies NG produced by NOCs.
Both GAIL and the contractor levy marketing margin on the NG supplied over and above APM price. Marketing Margin so levied is included in the delivered price of NG which forms a part of the normative cost of production of urea.
Production Sharing Contract for KG D6 block did not provide for marketing margin component. The contractor, however, has been charging marketing margin based on the energy equivalent of gas supplied i.e. 0.135 US$/mmbtu. Ministry of Chemicals & Fertilizers (MoCF) brought (March 2009) this issue to the notice of MoPNG as the fertilizer companies were regularly representing for reimbursement of marketing margin charged by the contractor.
MoPNG stated (March 2009) that GoI had not fixed or approved the quantum of marketing margin till date for sale of NG by any contractor. Thereafter, MoPNG fixed (May 2010) marketing margin only for GAIL at ` 200/mscm.
Marketing margin for GAIL was fixed in Indian Rupee whereas contractor was charging this in terms of US dollar.
Audit observed that:
94 Reliance Industries Limited (90%) and NIKO (10%)
Marketing margin on supply of NG
Report No. 6 of 2015
55
i. Charging of marketing margin for KGD6 gas in US$ instead of Indian Rupee for a commodity produced, marketed and consumed domestically is incongruous with Indian market. The amount charged towards this was equivalent95 to `244.31/mscm in 2010-11 and it increased to `325.51/mscm in 2013-14 owing to US$ exchange rate fluctuations96 (Annexure 26).
ii. Considering the fact that availability of NG is limited and its price is administered by GoI for fertilizer sector where GoI bears substantial financial burden as subsidy, leverage given to contractor to charge marketing margin needs justification. In this regard, MoCF estimated that charging of marketing margin of US$ 0.135/mmbtu on KG D6 gas would lead to additional subsidy outgo of approximately ` 125 crore per annum.
DoF stated (January 2014) that in the absence of any policy of MoPNG in this regard, DoF/FICC has not considered marketing margin paid to the contractor (KG D6 basin) in the determination of cost of production and reimbursement to the urea units so far. Hence, subsidy claims on account of marketing margin on KG D6 gas was kept pending from 2009-10 i.e. since beginning of supplies by contractor.
Point being made by Audit, however, is that additional impact of charging of marketing margin by contractor as given above, on 15 mmscmd KG D6 gas (supplied to fertilizer units on an average) in excess of marketing margin allowed to GAIL, for the period from May 2009 to March 2014 works out to ` 201.40 crore. This additional burden would have to be borne by GoI, in case a decision is taken to reimburse the same (Annexure 26).
GoI entrusted (December 2011) PNGRB to determine quantum of marketing margin on the basis of actual marketing cost. PNGRB, however, was empowered to deal only with notified petroleum products and NG. As GoI has so far not notified NG for the purpose, PNGRB was not in a position to evolve any system and fix marketing margin. No decision, therefore, could be arrived at on charging of marketing margin of KG D6 gas (October 2014).
MoPNG stated (July 2014) that there was a need to regulate marketing margin for supply of domestic gas to urea and LPG producers, as the same had implication on the subsidy outgo. In all other cases, marketing margin should be decided by the buyer and seller mutually and any complaint about restrictive trade practices followed by any entity should be addressed by PNGRB and/or the Competition Commission of India. Accordingly, MoPNG requested (November 2013) PNGRB to determine marketing margin for supply of domestic gas for Urea and LPG producers.
95 Marketing margin per mmbtu = USD 0.135 X Exchange rate per USD X 1000 scm /25.2 96 Exchange rate of USD for the year 2009-10 considered is ` 45 and it increased to ` 60.14 for the year 2013-14.

Report No. 6 of 2015
56
MoPNG informed (December 2014) that PNGRB has decided to engage a consultant to assist in the task and has sought time upto December 2014 keeping in view the fact that that process involves collection/analysis of data from various entities. The fact remains that there was a need to regulate marketing margin especially for NG supplies to sectors where GoI has to bear subsidy burden.
Recommendations: 3. MoPNG may work out modalities by involving all the implementing agencies
for implementing a control system/mechanism to detect and prevent deviation/mis-utilization of NG supplied at regulated price. The modalities so worked out may also include decision on rate at which recovery would be made for utilisation of such NG for other than specified purposes as there would be no difference between APM and non-APM price with effect from November 2014.
4. GAIL may critically review NG supply contract management system and put in place specific measures, such as incorporation of a clause in Gas Sales and Transmission Agreement enabling GAIL to verify end use of NG and reviewing Article 17 that permits buyer to use the NG for purposes other than those contemplated with mutual agreement between buyer and seller etc., that would empower it adequately to track ultimate utilisation of NG supplied at regulated price and prevent its diversion towards unauthorised purposes.
5. MoPNG should ensure that same methodology, i.e. charging marketing margin in Indian Rupee, is adopted for supply of NG from domestic source for use in sectors where GoI bears subsidy burden.


Report No. 6 of 2015
57
6.1
Natural Gas is the most sought after feedstock in fertilizer sector and one of the best fuels in power sector. It also has utility in other sectors. Its availability at affordable price, therefore, has significant influence on the economy. Various agencies involved in allocation of indigenous NG, utilization and supply of NG from all sources have important roles to play.
Performance Audit on 'Supply and Infrastructure Development for Natural Gas' revealed:
Lack of co-ordination within GoI in monitoring development of pipeline and R-LNG infrastructure projects, which resulted in non-availability of NG at affordable price to priority sectors viz. Fertilizer and Power.
Time lapse in taking executive decisions such as notification of Section 16 of PNGRB Act providing powers to PNGRB for issuing authorisations for laying, building, operating and expanding pipelines, notification of Rules prescribing eligibility conditions which an entity shall fulfill for registration for setting up R-LNG terminal led to a situation where the statutory authority created for the purpose remained ineffective for a considerable period of time in facilitating development of cross country pipelines and R-LNG infrastructure.
Non-availability of an assured supply of NG on a long-term basis and inadequate pipeline connectivity remained one of major constraints for non-revival of the closed fertilizer units identified for revival and non-conversion of some of the units. This led to production loss and increase in cost of production of urea with resultant increase in subsidy burden on GoI for imported urea.
Lack of availability of NG at affordable price to power sector resulted in underutilisation of gas based power plants with resultant generation loss and higher generation cost due to use of alternate fuels.
Non-establishment of a control system/mechanism in MoPNG/DoF led to diversion of NG supplied at regulated price for unauthorised purposes.
Chapter Conclusion and Recommendations 6
Conclusion

Report No. 6 of 2015
58
System lapses in the NG supply contract management by GAIL led to non-recovery of market rate for APM gas utilized for other than specified purposes.
Marketing Margin on supply of domestic NG for GAIL was approved by GoI in Rupee terms, whereas the Contractor for KG D6 block was charging marketing margin in US dollar terms. DoF was not yet reimbursing marketing margin as demanded by the contractor to the fertilizer units and subsidy claims on account of marketing margin on KG D6 gas were kept pending from 2009-10. If DoF decides to reimburse marketing margin as charged by the contractor and requested by fertilizer units, additional subsidy burden would be ` 201.40 crore from May 2009 to March 2014, being the difference between marketing margin demanded by the contractor and marketing margin allowed to GAIL.
6.2
We recommend that:
1. MoPNG should develop a mechanism, with clearly defined responsibility centres, in coordination with implementing agencies and authorities, to ensure and assess timely completion of NG pipeline and R-LNG projects across the country and cut down delays so that the desired growth in the NG sector is achieved.
2. MoPNG in coordination with DoF and MoP may consider setting up of Inter Ministerial Committee that could suggest:
(i) A time bound action plan for synchronising implementation of NG pipeline projects and revival of fertilizer units so that benefit of NG as feedstock may be derived optimally besides reducing import of urea.
(ii) Measures to create required infrastructure to provide NG/R-LNG to Power Sector at affordable price so that capacity created in the sector is adequately utilised.
3. MoPNG may work out modalities by involving all the implementing agencies for implementing a control system/mechanism to detect and prevent diversion/mis-utilization of NG supplied at regulated price. The modalities so worked out may also include decision on the rate at which recovery would be made for utilisation of such NG for other than specified purposes as there would be no difference between APM and non-APM price with effect from November 2014.
Recommendations

Report No. 6 of 2015
59
4. GAIL may critically review NG supply contract management system and put in place specific measures, such as incorporation of a clause in Gas Sales and Transmission Agreement enabling GAIL to verify end use of NG and reviewing Article 17 that permits buyer to use the NG for purposes other than those contemplated with mutual agreement between buyer and seller etc., that would empower it adequately to track ultimate utilisation of NG supplied at regulated price and prevent its diversion towards unauthorised purposes.
5. MoPNG should ensure that same methodology, i.e. charging marketing margin in Indian Rupee, is adopted for supply of NG from domestic source for use in sectors where GoI bears subsidy burden.
New Delhi (PRASENJIT MUKHERJEE) Dated: Deputy Comptroller and Auditor General and Chairman, Audit Board
Countersigned
New Delhi (SHASHI KANT SHARMA) Dated: Comptroller and Auditor General of India


Report No. 6 of 2015
61
Annexure-1 (Referred to in Para no. 1.6.2)
Enumeration of PNGRB functions
Section 11 of the PNGRB Act, 2006
The Board shall-
(a) protect the interest of consumers by fostering fair trade and competition amongst the entities (b) register entities to –
(i) market notified petroleum and petroleum products and, subject to the contractual obligations of the central Govt, natural gas
(ii) establish and operate liquefied natural gas terminals (iii) establish storage facilities for petroleum, petroleum products or natural gas exceeding
such capacity as may be specified by regulations (c) authorise entities to –
(i) lay, build, operate or expand a common carrier or contract carrier (ii) lay, build operate or expand city or local natural gas distribution network
(d) declare pipelines as common carrier or contract carrier (e) regulate, by regulations-
(i) access to common carrier or contract carrier so as to ensure fair trade and competition amongst entities and for that purpose specify pipeline access code
(ii) transportation rates for common carrier or contract carrier (iii) access to city or local natural gas distribution network so as to ensure fair trade and
competition amongst entities as per pipeline access code (f) in respect of notified petroleum, petroleum products and Natural Gas-
i) ensure adequate availability, ii) ensure display of information about the maximum retail prices fixed by the entity for
consumers at the retail outlets, iii) monitor prices and take corrective measures to prevent restrictive trade practice by the
entities, iv) secure equitable distribution for petroleum and petroleum products, v) provide, by regulations and enforce retail service obligation for retail outlets and
marketing service obligations for entities vi) monitor transportation rates and take corrective action to prevent restrictive trade practice
by the entities
(g) levy fees and other charges as determined by regulations, (h) maintain a data bank of information on activities relating to petroleum, petroleum products and
natural gas (i) lay down, by regulations, the technical standards and specifications including safety standards in
Activities relating to petroleum, petroleum products and Natural Gas, including the construction and operation of pipeline and Infrastructure projects related to downstream petroleum and Natural Gas sector.
(j) perform such other functions as may be entrusted to it by the Central Government to carry out the provisions of this act.

Repo
rt N
o. 6
of 2
015
62
Ann
exur
e-2
(Ref
erre
d to
in P
ara-
3.2.
1)
Stat
emen
t sho
win
g lis
t of L
NG
term
inal
s tha
t rec
eive
d FI
PB c
lear
ance
dur
ing
1997
-200
0
Sl.
No
Com
pany
Fo
reig
n C
olla
bora
tor
Loc
atio
n C
apac
ity in
mm
tpa
Initi
al
Futu
re
Exp
ansi
on
1 En
ron
Inte
rnat
iona
l En
ron
Inte
rnat
iona
l 1
Dab
hol (
Mah
aras
htra
) 2.
5 5
&10
2
Brit
ish
Gas
B
ritis
h G
as
2 Pi
pava
v (G
ujar
at)
2.5
5 3
Ispa
t G
roup
of
In
dust
ries
Ispa
t Ene
rgy
3 K
akin
ada
(And
hra
Prad
esh)
2.
5 N
ot
Ava
ilabl
e 4
Rel
ianc
e In
dust
ries
GD
R/A
DR
priv
ate
plac
emen
t 4
Jam
naga
r (G
ujar
at)
5 N
.A.
5 H
azira
(Guj
arat
) 5
N.A
. 5
Roy
al
Dut
ch
Shel
l gr
oup
of c
ompa
nies
Sh
ell
6 H
azira
(Guj
arat
) 2.
7 N
.A.
6 Pe
trone
t LN
G
Lim
ited
Gaz
de
Fran
ce
7 D
ahej
(Guj
arat
) 5
N.A
. 8
Koc
hi (K
eral
a)
2.5
N.A
. 7
BH
P Pe
trole
um
BH
P Pe
trole
um
9 N
ot sp
ecifi
ed
Not
sp
ecifi
ed
N.A
.
8 H
ardy
oil/
Nag
arju
na
Hol
ding
s H
ardy
oi
l an
d B
HP
petro
leum
10
K
akin
ada
(And
hra
Prad
esh)
1
5
9 Tr
acte
bel
Trac
tebe
l 11
N
ot sp
ecifi
ed
Not
sp
ecifi
ed
N.A
.
10
Dak
shin
B
hara
t En
ergy
Con
sorti
um
Uno
cal,W
oods
ide,
Si
emen
s, C
MS
Ener
gy
12
Enno
re (T
amil
Nad
u)
2.5
N.A
.
11
GA
IL-T
EC-T
OTA
L TO
TAL
13
Trom
bay
(Mah
aras
htra
) 3
6 12
C
onso
rtium
of
Fe
rtiliz
er C
ompa
nies
N
ot A
vaila
ble
14
Kis
horip
rasa
d 3
6
13
AL
Man
hal
Al M
anha
l, U
AE
15
Gop
alpu
r (O
rissa
) 3
N.A
.
T
otal
15
40
.2
N
ote:
Thi
rteen
ent
ities
for 1
5 te
rmin
als w
ith 4
0.2
mm
tpa/
145
mm
scm
d ap
prox
imat
ely.

Report No. 6 of 2015
63
Annexure-3 (Referred to in Para- 3.2.2)
Statement showing year wise position of LNG terminals Year Status of
development of LNG terminals
Location Envisaged Capacity (mmtpa)
Actual capacity created
(mmtpa) cumulative
1997 MoPNG approved formation of Petronet LNG Limited (PLL) to implement LNG projects
Ennore, Manglore, Kochi, Hazira and Dahej and any other suitable location
-- --
1997-2000
FIPB cleared 15 LNG terminals
across the coastal states
(As per Annexure-2)
(As per Annexure-2) 40.2
2000-04 None of the LNG terminals were materialised Nil 2004-05 LNG terminals commissioned at Dahej (5 mmtpa) by PLL and at
Hazira (2.5 mmtpa) by Shell in Gujarat 7.5 7.5
2005-12 No further development during this period NIL Nil 2012-13 PNGRB received
applications for setting up of 5 LNG terminals
1. Dahej (Gujarat) 5 2. Gangavaram (Andhra Pradesh) 5 3. Pipavav (Gujarat) 3 4. Mundra (Gujarat) 5 5. Jaigarh 8
Total 26 LNG terminal commissioned at Dabhol (Maharashtra) in January
2013 2 9.5
2012-13 Dahej terminal upgraded from 5 mmtpa to 10 mmtpa and Hazira upgraded from 2.5 to 5 mmtpa
7.5 17
2013-14 LNG terminal at Kochi set up 5 22 At present four LNG terminal at (Dahej, Hazira, Dabhol and Kochi are operational in India with 22 mmtpa/79.2 mmscmd)

Report No. 6 of 2015
64
Annexure-4 (Referred to in Para-3.3)
Statement showing status of pipeline infrastructure operational in India Pipeline Entity Length
KmSource of gas Region of supply
Commissioned before 2000 Hazira -Vijaipur- Jagdishpur
(HVJ) GAIL 4435 Mumbai offshore,
Cambay, Hazira LNG Terminal
Gujarat, Madhya Pradesh, Uttar
Pradesh, Rajasthan, Delhi
Vijaipur- Dadri*
GAIL 247 Link to HVJ & DVPL Madhya Pradesh, Rajasthan, Delhi,
Uttar Pradesh Assam (Lakwa) GAIL 8 Assam gas fields Assam
Tripura (Agartala) GAIL 61 Tripura gas fields Tripura Ahmedabad GAIL 144 Link to HVJ & DVPL Gujarat
Rajasthan (Focus Energy) GAIL 154 OIL fields Rajasthan Bharuch-Vadodara GAIL 670 Link to HVJ & DVPL Gujarat
Mumbai GAIL 129 Link to HVJ & DVPL Maharashtra KG Basin GAIL 877 KG basin Andhra Pradesh
Cauvery Basin GAIL 268 Cauvery Basin Tamil Nadu Asssam Gas Company Duliajan-Numaligarh
AGCL 1000 Assam gas fields Assam
Commissioned after 2000 Dahej – Vijaypur* GAIL 865 Dahej LNG Terminal Gujarat, Madhya
Pradesh Dahej – Uran – Panvel
including spur lines GAIL 873 Dahej LNG Terminal Gujarat, Maharashtra
UranTrombay ONGC 24 Bombay offshore Maharashtra East- West Pipeline RGTIL 1469 KG basin Andhra Pradesh,
Maharshtra, Gujarat GSPCL Network GSPC 1874 Cambay Basin Gujarat Dadri -Panipat IOCL 132 Link to Dahej, Hazira
LNG Terminal Delhi, Punjab
Chainsa-Jhajjar-Hissar GAIL 262 Link to HVJ & DVPL Rajasthan, Haryana Dadri-Bawana-Nangal GAIL 803 Link to HVJ & DVPL Delhi, Punjab
Dabhol-Bangalore GAIL 1004 RGPPL LNG Terminal Maharashtra, Goa, Karnataka
Kochi-Koottanad-Banglore-Manglore (Phase-I)
GAIL 41 Kochi LNG Terminal Kerala, Karanataka
Total 15,340 Source : MoPNG Annual Report 2013-14* These are Pipeline sections of DVPL-GREP Up-gradation (DVPL-2 & VDPL-Total length 1112 Km).

Report No. 6 of 2015
65
Annexure 5 (Referred to in Para no 3.3.1)
Map of India depicting present and future (targeted) Natural Gas pipelines in the country
Note: Map of India before formation of Telangana State.

Repo
rt N
o. 6
of 2
015
66
Ann
exur
e-6
(Ref
erre
d to
in P
ara
no. 3
.3.4
) St
atem
ent s
how
ing
deta
ils o
f pip
elin
es a
utho
rise
d by
MoP
NG
Sl
N
o.
Sect
ion
of p
ipel
ine
Ent
ity
Dat
e of
au
thor
isat
ion
Dat
e of
3 (1
) no
tific
atio
n Sc
hedu
led
date
of
com
plet
ion
Sour
ce o
f gas
A
ncho
r co
nsum
ers
St
atus
of p
ipel
ines
as o
n 31
.06.
2014
1 K
akin
ada-
Vija
yava
da-
Nel
lore
-Che
nnai
R
GTI
L/
Rel
og
19.0
3.20
07
17.0
6.20
09
16.0
6.20
12
KG
D6
IFFC
O- N
ello
re,
MFL
- Man
ali (
Tam
il N
adu)
In
dust
rial a
nd C
GD
in C
henn
ai
MoP
NG
can
celle
d au
thor
isat
ion
in O
ctob
er 2
012
2 D
abho
l-Ban
galo
re
GA
IL
02.0
7.20
07
06.0
2.20
10
05.0
2.20
13
R-L
NG
fr
om
Dab
hol
Zuar
i-Goa
D
abho
l to
B
anga
lore
, sp
ur
lines
to
G
oa
and
Ban
galo
re
city
co
mm
issi
oned
in
Fe
brua
ry
2013
(P
hase
-I)
(Pha
se-I
I)
Spur
lines
to
R
atna
giri,
B
ijaip
ur,K
olha
pur,
Dha
rwad
,Dev
enge
re,T
umku
r is
in
prog
ress
. 3
Cha
insa
-Jha
jjar-H
issa
r G
AIL
06
.07.
2007
01
.02.
2008
31
.01.
2011
Li
nk t
o ex
istin
g H
VJ-
D
VPL
pi
pelin
e
Pow
er p
lant
s of R
elia
nce,
Tat
a an
d Ji
ndal
. C
hain
sa-S
ulta
npur
(Ph
ase-
I), g
as C
harg
ed
in M
arch
20
10. S
ulta
npur
-Jha
jjar-
His
sar,
phys
ical
pro
gres
s up
to
17
% (P
hase
-II)
4 D
adri-
Baw
ana-
Nan
gal
GA
IL
11.0
7.20
07
20.0
4.20
09
19.0
4.20
12
Link
to
exis
ting
HV
J-D
VPL
pi
pelin
e
NFL
-Pan
ipat
N
FL-B
hatin
da
NFL
-Nan
gal
Dad
ri-B
awan
a,
com
mis
sion
ed
in
Janu
ary
2010
(P
hase
-I),
Baw
ana-
Nan
gal,
gas
char
ged
in M
arch
20
12.
(Pha
se-I
I),
Spur
lin
es
(Pha
se-I
) co
mpl
eted
in
N
ovem
ber
2012
an
d (P
hase
-II-
D
ehra
dun
and
Ris
hike
sh)
in
prog
ress
. I
stag
e Pe
rmis
sion
fr
om
Fore
st &
NH
AI
is re
ceiv
ed in
Feb
ruar
y 20
14
5 Ja
gdis
hpur
-Hal
dia
GA
IL
06.0
7.20
07
NIL
N
IL
R-L
NG
fr
om
Dah
ej /
Haz
ira o
r N
G
from
K
G
basi
n/ M
ahan
adi
thro
ugh
Kak
inad
a-
How
rah
Ferti
lizer
pl
ants
- D
IL-K
anpu
r, M
ATI
X-B
urdw
an,
FCIL
-Sin
dri,
FCIL
-Tal
cher
, FC
IL-K
orba
, FC
IL-
Gor
akhp
ur, H
FCL-
Bar
auni
, HFC
L-D
urga
pur.
Stee
l pla
nts o
f SA
IL in
Bok
aro,
Dur
gapu
r, R
ourk
ela
Upc
omin
g po
wer
pr
ojec
ts
of
Cal
cutta
El
ectri
c Su
pply
C
orpo
ratio
n an
d W
est
Ben
gal
Pow
er
Dev
elop
men
t Cor
pora
tion.
Not
yet
com
men
ced
6 K
ochi
-Koo
ttana
d-B
anga
lore
-Man
galo
re
GA
IL
13.0
7.20
07
12.0
3.20
10
11.0
3.20
13
R-L
NG
fr
om
Koc
hi
MFC
L-M
anga
lore
FA
CT-
Koc
hi
BSE
S K
eral
a B
PCL-
Koc
hi
Koc
hi
regi
on
(Pha
se-I
, 41
K
m)
com
plet
ed
in
Sept
embe
r 20
12,
supp
ly
of
gas
com
men
ced
in
Aug
ust 2
013
on c
ompl
etio
n of
LN
G te
rmin
al
FAC
T to
M
anga
lore
an
d B
anga
lore
(P
hase
-II)
phys
ical
pro
gres
s 83%
-Wor
k in
Tam
ilnad
u (3
10 K
m)
susp
ende
d du
e to
lega
l dis
pute
s, in
Ker
ala
(50
Km
s).
Slow
pro
gres
s due
to R
oU h
indr
ance
. 7
Kak
inad
a-B
asud
ebpu
r-H
owra
h R
GTI
L/
Rel
og
15.0
7.20
07
23.0
6.20
09
22.0
6.20
12
KG
D6
HFC
L-H
aldi
a M
oPN
G c
ance
lled
auth
oriz
atio
n in
Oct
ober
201
2
8 C
henn
ai-T
utic
orin
R
GTI
L/R
elog
23
.07.
2007
19
.08.
2009
18
.08.
2012
K
G D
6 SP
IC-T
utic
orin
9 C
henn
ai-B
anga
lore
-M
anga
lore
R
GTI
L/R
elog
23
.07.
2007
12
.08.
2009
11
.08.
2012
K
G D
6 C
GD

Report No. 6 of 2015
67
Annexure-7 (Referred to in Para 3.3.6) Statement showing list of pipelines identified for development during 2000-2011
S.No Pipeline Corridor When identified Present status 1 Dahej-Vijaypur 2000 under NGG Completed 2 Dahej-Uran 2000 under NGG Completed 3 Dadri-Panipat-Nangal 2000 under NGG, authorised in 2007 Completed 4 Vijaypur-Kota-Mathania 2000 under NGG Vijaypur-Kota
completed 5 Kakinada-Uran 2000 under NGG East-West pipeline
Completed 6 Kakinada-Chennai 2000 under NGG, authorised in 2007. Not taken up 7 Kakinada-Kolkata 2000 under NGG, authorised as Kakinada-
Howrah in 2007 Not taken up
8 Kolkata-Jagdishpur 2000 under NGG, authorised as Haldia-Jagdishpur in 2007
Not taken up
9 Dabhol-Bangalore-Chennai-Tuticorin
2000 under NGG Dabhol-Bangalore, authorised in 2007
Ongoing
Chennai-Tuticorin authorised in 2007 10 Kochi-Kayamkulam-
Mangalore 2000 under NGG
Kochi-Banglore-Manglore authorised in 2007 Ongoing*
11 Bangalore-Coimbatore-
Kayamkulam 12 Myanmar-Mizoram-
Assam-Bihar 2000 under NGG Not taken up
13 Hyderabad-Vijaypur 2000 under NGG Not taken up 14 Vijaypur-Jagdishpur 2000 under NGG Completed 15 Dahej-Jamnagar-
Porbandar 2000 under NGG Completed
16 Chainsa-Jhajjar-Hissar Authorised in 2007 Ongoing 17 Chennai-Bangalore-
Mangalore Authorised in 2007 Not taken up
18 Vijaywada-Nagpur-Vijaipur
2009 under National Gas Highway, authorised as Mallavaram-Bhilwara in 2011
Ongoing
19 Barauni-Guwahati 2009 under National Gas Highway Not taken up 20 Thane-Nashik-Nagpur 2009 under National Gas Highway Not taken up 21 Raipur-Bhilai 2009 under National Gas Highway Not taken up 22 Kota-Jaisalmar 2009 under National Gas Highway Not taken up 23 Amritsar-Jammu 2009 under National Gas Highway
Bhatinda-Srinagar authorised in 2011 Ongoing
Identified in 2000 : 15 projects Authorised in 2007 (Fresh) : Two projects Identified in 2009 : Six projects Total : 23 projects (seven completed, six on-going and 10 not yet taken up)
* Two pipelines at no. 10 and 11, Kochi-Kayamkulam segment linking PLL terminal and NTPC has not been taken up

Report No. 6 of 2015
68
Annexure-8 (Referred to in para no. 4.1)
Statement showing details of available production capacity, envisaged enhanced capacity, demand, domestic production and import of urea
(in lakh metric tonne) Year
(1)
Production capacity
(2)
Envisaged enhanced capacity
(3)
Projected Demand
(4)
Domestic Production
(5)
Import
(6)
Requirement
(7 = Col. 5+ Col. 6)
2004-05 197.00 N.A. N.A. 202.39 6.41 208.80 2005-06 197.00 N.A. N.A. 200.85 20.57 221.42 2006-07 197.00 N.A. 243.05 202.71 47.19 249.902007-08 197.00 N.A. 253.60 198.58 69.28 267.86 2008-09 197.00 N.A. 262.75 199.21 56.67 255.88 2009-10 197.00 224.20 271.35 211.12 52.09 263.21 2010-11 200.30 269.25 279.45 218.80 66.10 284.90 2011-12 200.30 269.25 287.55 219.84 78.34 298.18 2012-13 200.30 319.25 303.47 225.74 80.44 306.18
477.09
N.A.: Not Available

Report No. 6 of 2015
69
Annexure-9 (a) (Referred to in Para 4.1.1)
Statement showing calculation of Subsidy savings (in `)S.N. Particulars Formula 2011-12 2012-13
1 Average normative rate per MT urea using RLNG
--- 17103.54& 23660.87@
2 Average capital related charge/MT --- 5774.24 5774.24 3 Delivered cost of urea/MT (Sl. No 1+2) 22877.78 29435.11 4 Subsidy payable on urea produced using
RLNG (Sl. No. 3 –MRP^) 17567.78 24075.11
5 Subsidy on imported urea/per MT ------ 22306.00 24883.14 6 Excess subsidy on imported urea than
domestic urea/MT) (Sl. no. 5-4) 4738.22 808.03
7 Quantity of urea imported MT Table Below 7513291* 7947209* 8 Subsidy savings envisaged (` in crore) (Sl. No. 6 X 7) 3559.96 642.16
Total for 2011-12 and 2012-13 (` in crore) 4202.12
& Column 4 of annexure 9 (b) @ column 4 of annexure 9 (c ) ^ MRP `5310/MT and ` 5360/MT for 2011-12 and 2012-13 respectively
Sl no Source Particulars 2011-12 2012-13 1 Annexure 8 Import 7834000 80440002 Annexure 17 b
Loss of Production
(MT)
87075 NIL 3 Annexure 21 48684 NIL4 Annexure 22 32486 185525 Annexure 23 0 645586 Annexure 24 152464 13681
Net {1- (2+3+4+5+6)} *7513291 *7947209

Report No. 6 of 2015
70
Annexure- 9 ( b) (Referred to in Para 4.1.1)
Statement showing Normative cost per MT using R-LNG for year 2011-12
*Means Concession rate as worked out by FICC. This is for all the Gases/feedstock used by unit taken
together. **Worked out by Audit by substituting all gases/feedstock with R-LNG at the highest rate for that particular year (` 1933 R-LNG price for IFFCO Phulpur-II has been considered for all the units for the year 2011-12).
† Source; Escalation/De-escalation statement maintained by FICC
S. No
Unit† Normative cost per MT* (`)
Normative cost per MT using R-LNG ** (`)
1 2 3 4 1 IFFCO Kalol 11327.00 17328 2 TCL 10346.00 15362 3 SFC 12812.00 20380 4 GSFC 11224.00 18830 5 IFFCO- P1 16164.00 20211 6 IFFCO- P2 15928.00 16739 7 KSFL 10059.00 15436 8 RCF Tr 12511.00 23604 9 RCF Thal 9970.00 17383
10 NFL-V2 10315.00 15335 11 NFL-V1 9959.00 14814 12 IGFL 12069.00 14570 13 CFCL-II 13327.00 16149 14 CFCL-I 11476.00 15349 15 KRIBHCO 8456.00 15063
Average rate (per MT urea) of 15 units
11729.53 17103.54

Report No. 6 of 2015
71
Annexure 9 (c) (Referred to in Para 4.1.1) Statement showing Normative cost per MT using R-LNG for year 2012-13
Sl.No. Unit Normative Cost per MT
( ` ) Normative Cost per MT
using R-LNG ( ` )
(1) (2) (3) (4) 1 IFFCO Kalol 11802 23914.07 2 TCL 12079 21004.04 3 SFC 13506 28752.95 4 GSFC 11453 26000.53 5 IFFCO -P1 21196 27920.37 6 IFFCO-P2 21360 22950.65 7 KSFL 11000 21412.34 8 RCF Thal 11435 24275.24 9 NFL-V2 12251 21358.00 10 NFl-V1 11364 21091.10 11 IGFL 15530 20371.40 12 CFCL-II 16850 22084.58 13 CFCL-I 14860 21277.35 14 KRIBHCO 9735 21332.89 15 NFCL-I 9816 22021.18 16 NFCL-II 10077 22090.06 17 IFFCO Aonla-I 10987 20987.45 18 IFFCO Aonla-II 11028 20814.72 19 ZIL 41966 26938.53 20 GNVFC 23132 28567.49 21 NFL Panipat 32065 28029.55 22 NFL Bhatinda 31598 27344.64 Average Rate (per MT of
Urea) of 22 units 16595 23660.87
Note: (1) RCF Trombay unit is not considered for computation as the normative cost of urea per MT using R-LNG is higher.
(2) Worked out by Audit by substituting all gases/feedstock with R-LNG at the highest rate for that particular year (` 2847.62 being R-LNG price for IFFCO Aonla has been considered for all the units for the year 2012-13).

Repo
rt N
o. 6
of 2
015
72
Ann
exur
e-10
(Ref
erre
d to
in P
ara
4.1.
2)
Stat
emen
t sho
win
g de
tails
of c
onve
rsio
n of
ure
a un
its fr
om N
apht
ha/F
O/L
SHS
to N
atur
al G
as a
nd p
ipel
ine
conn
ectiv
ity u
p to
201
3-14
Sl.
No.
N
ame
of th
e U
nit
Cap
acity
(L
MT
PA)
Gas
re
quir
eme
nt a
fter
co
nver
sion
(m
msc
md)
Env
isag
ed
year
of
Con
vers
ion
Act
ual
conv
ersi
on
Pipe
line
Con
nect
ivity
and
en
tity
Plan
ned
date
of
co
mpl
etio
n fo
r pi
pelin
e co
nnec
tivity
Stat
us o
f Pip
elin
e C
onne
ctiv
ity a
s on
31
Mar
ch 2
014
1 M
CFL
M
angl
ore
3.80
0 1.
00
2009
-10
Not
co
mpl
eted
K
ochi
-Ban
glor
e- M
angl
ore
- G
AIL
20
10-1
1 N
ot Y
et C
ompl
eted
2 D
IL K
anpu
r (K
FCL)
7.
220
1.70
20
09-1
0 20
13-1
4 Sp
ur
line
from
H
aldi
a-Ja
gdis
hpur
-GA
IL
2009
-10
Not
yet
com
men
ced
3 ZA
CL
3.99
3 1.
28
2009
-10
2012
-13
Dab
hol-G
ogak
-Ban
glor
e -
GA
IL
2009
-10
Com
plet
ed
&
gas
char
ged
in F
eb-2
013
4 N
FL B
hatin
da
5.11
5 0.
90
2009
-10
2012
-13
Dah
ej-D
adri-
Baw
ana
-Nan
gal
pipe
line
GA
IL
2009
-10
Com
plet
ed
&
gas
char
ged
in M
ar-2
013
5 N
FL P
anip
at
5.11
5 0.
90
2009
-10
2012
-13
Dah
ej-D
adri-
Baw
ana
-Nan
gal
pipe
line-
GA
IL
2009
-10
Com
plet
ed
&
gas
char
ged
in M
ar-2
013
6 N
FL N
anga
l 4.
785
1.00
20
09-1
0 20
12-1
3 D
ahej
-Dad
ri-B
awan
a -N
anga
l pi
pelin
e -G
AIL
20
09-1
0 C
ompl
eted
&
ga
s ch
arge
d in
Mar
ch 2
013
7 SP
IC T
utic
orin
6.
200
1.66
20
09-1
0 N
ot
com
plet
ed
Che
nnai
-Tut
ikor
in-R
elog
istic
In
fras
truct
ures
Li
mite
d (S
ubsi
diar
y of
RG
TIL)
2009
-10
GO
I ca
ncel
led
Aut
horis
atio
n
8 G
NV
FC
Bha
ruch
6.
360
0.95
20
09-1
0 20
12-1
3 Ex
istin
g H
azira
- Vija
ipur
- Jag
dish
pur -
GA
IL
9
MFL
, Man
ali
4.86
8 1.
54
2009
-10
Not
C
ompl
eted
Sp
ur li
ne fr
om K
ochi
-M
angl
ore-
Ban
glor
e-G
AIL
20
09-1
0 N
ot y
et c
ompl
eted

Report No. 6 of 2015
73
Annexure 11(a) (Referred to in Para no 4.1.2)
Statement showing Calculation of subsidy savings by using R-LNG in place of Naptha/LSHS/Fuel Oil (in ` )
Sl no Particulars
Year 2010-11 2011-12 2012-13
1 Average normative rate per MT urea using
R-LNG 18224.57@ 22153.70# 28688.72$ 2 Average capital related charge per MT 2369.86 2369.86 2369.86
3 Delivered cost of urea per MT using R-LNG
(1+2) 20594.43 24523.56 31058.58 4 Average cost of urea using Naphtha 28221.86^ 35987.71& 42741.70*
5 Difference in Cost of production ie Avoidable
subsidy per MT (4 - 3) 7627.43 11464.15 11683.12
6 Quantity of urea produced using Naphtha (in
MT) 3055330! 3339090+ 1297090#* 7 Subsidy avoidable (` In crore) (5 X 6) 2330.43 3827.98 1515.41
Total for 2010-11 to 2012-13 (` in crore) 7673.82
@ column 8 of annexure 11 (b) # column 10 of annexure 11 (c)
$ column 8 of annexure 11 (d )
^ column 5 of annexure 11 (b)
& column 5 of annexure 11 (c)
* column 5 of annexure 11 (d )
! column 6 of annexure 11 (b) + column 8 of annexure 11 (c) #* column 6 of annexure 11 (d)
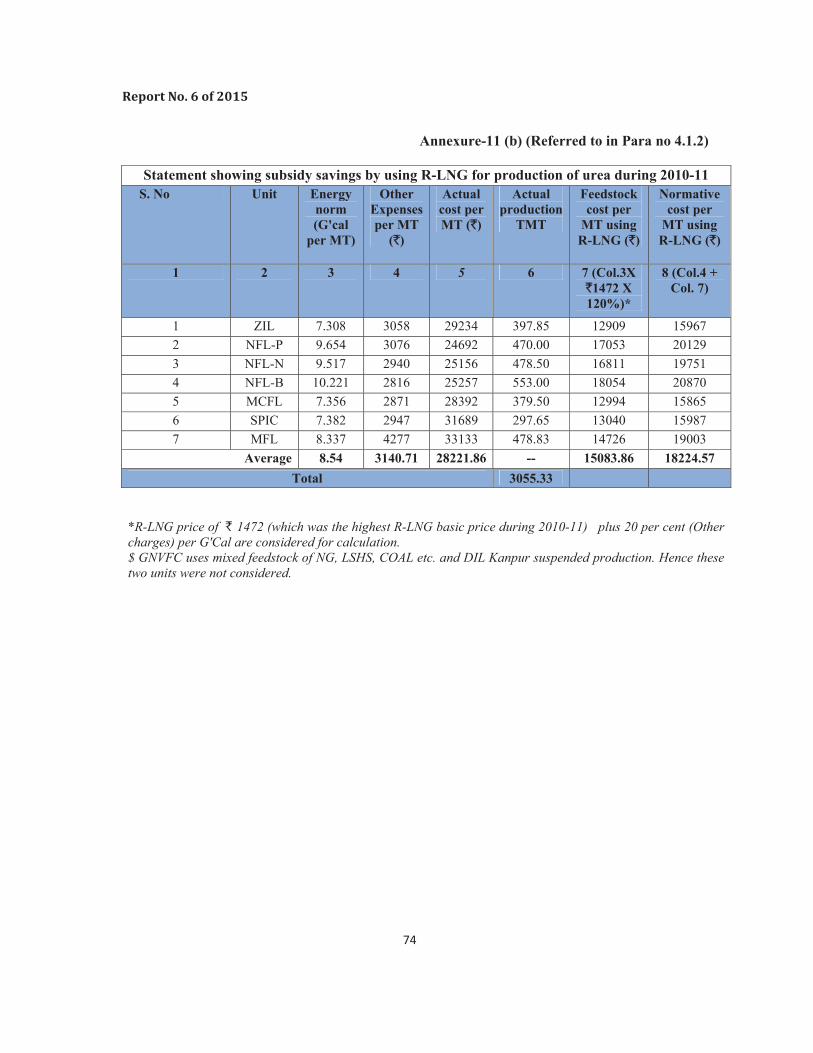
Report No. 6 of 2015
74
Annexure-11 (b) (Referred to in Para no 4.1.2)
Statement showing subsidy savings by using R-LNG for production of urea during 2010-11 S. No Unit Energy
norm (G'cal
per MT)
Other Expenses per MT
(`)
Actual cost per MT (`)
Actual production
TMT
Feedstock cost per
MT using R-LNG (`)
Normative cost per
MT using R-LNG (`)
1 2 3 4 5 6 7 (Col.3X `1472 X 120%)*
8 (Col.4 + Col. 7)
1 ZIL 7.308 3058 29234 397.85 12909 15967 2 NFL-P 9.654 3076 24692 470.00 17053 20129 3 NFL-N 9.517 2940 25156 478.50 16811 19751 4 NFL-B 10.221 2816 25257 553.00 18054 20870 5 MCFL 7.356 2871 28392 379.50 12994 15865 6 SPIC 7.382 2947 31689 297.65 13040 15987 7 MFL 8.337 4277 33133 478.83 14726 19003
Average 8.54 3140.71 28221.86 -- 15083.86 18224.57 Total 3055.33
*R-LNG price of ` 1472 (which was the highest R-LNG basic price during 2010-11) plus 20 per cent (Other charges) per G'Cal are considered for calculation. $ GNVFC uses mixed feedstock of NG, LSHS, COAL etc. and DIL Kanpur suspended production. Hence these two units were not considered.

Repo
rt N
o. 6
of 2
015
75
Ann
exur
e 11
(c) (
Ref
erre
d to
in 4
.1.2
)
Stat
emen
t sho
win
g su
bsid
y sa
ving
s by
usin
g R
-LN
G fo
r pr
oduc
tion
of u
rea
duri
ng 2
011-
12
S. N
o.
Uni
t N
ame
Act
ual
cost
of
feed
stoc
k (`
)
Ene
rgy
norm
s
(G c
al/M
T)
Cos
ts b
y us
ing
R-L
NG
O
ther
ex
pens
es
(`)
Act
ual
cost
Per
M
T (`
)
Cos
t of R
-L
NG
per
G
'Cal
* (`
)
Act
ual
Prod
uctio
n (T
MT
)
Feed
stoc
k co
st
per
MT
by
usin
g R
-LN
G (`
)
Tot
al c
ost p
er
MT
(`)
1 2
3 4
5(3+
4)
6 7
8 9
(6X
7)
10(4
+9)
1ZI
L 34
394.
85
3060
.15
3745
5 7.
308
2222
.95
365.
47
1624
5.32
19
305.
47
2N
FL -P
27
419.
15
3109
.85
3052
9 9.
654
2222
.95
500.
36
2146
0.36
24
570.
21
3N
FL -N
30
385.
55
2962
.45
3334
8 9.
517
2222
.95
503.
58
2115
5.82
24
118.
27
4N
FL -B
31
224.
44
2846
.56
3407
1 10
.221
22
22.9
5 48
3.02
22
720.
77
2556
7.33
5
MC
FL
3436
6.19
29
82.8
1 37
349
7.35
6 22
22.9
5 37
9.5
1635
2.02
19
334.
83
6SP
IC
3473
4.96
29
49.0
4 37
684
7.38
2 22
22.9
5 62
0.41
16
409.
82
1935
8.86
7
MFL
37
190.
05
4287
.95
4147
8 8.
337
2222
.95
486.
75
1853
2.73
22
820.
68
T
otal
22
9715
.20
2219
8.81
25
1914
59
.775
15
560.
65
3339
.09
1328
76.8
0 15
5075
.70
Ave
rage
cos
t of
prod
uctio
n 32
816.
50
3171
.26
3598
7.71
8.
5392
9 22
22.9
5 47
7.01
2857
18
982.
40
2215
3.70
$ G
NVFC
use
s mix
ed fe
edst
ock
of N
G ,
LSH
S, C
OAL
etc
. and
DIL
Kan
pur s
uspe
nded
pro
duct
ion.
Hen
ce th
ese
two
units
wer
e no
t con
sider
ed
*Cos
t per
G'C
al is
cal
cula
ted
base
d on
R-L
NG
pric
e of
` 1
933
plus
15%
oth
er c
harg
es

Report No. 6 of 2015
76
Annexure – 11 (d) (Referred to in 4.1.2)
Statement showing subsidy savings by using R-LNG for production of urea during 2012-13
S. No Unit Energy norm (Gcal per
MT)
Other Expenses per MT (`)
Actual cost per MT (`)
Actual production
TMT
Feedstock cost per MT
using R-LNG (`)
Normative cost per MT using R-LNG (`)
1 2 3 4 5 6 7 (Col.3X ` 2847.62 X
115%)*
8 (Col.4 + Col. 7)
1 MCFL 7.356 3046 41715 379.50 24089.16 27135.16 2 SPIC 7.382 3163 41000 481.82 24174.30 27337.30 3 MFL 8.337 4292 45510 435.77 27301.70 31593.70
Total 128225 1297.09 -- 86066.16 Average 42741.70 -- -- 28688.72
*R-LNG price of ` 2847.62 (which was the highest R-LNG basic price during 2012-13) plus 15 per cent (other charges) per G'Cal are considered for calculation. $ ZIL unit uses mixed feedstock of NG, Naptha and FO. Hence not considered for calculation.

Report No. 6 of 2015
77
Annexure-12 (Referred to in Para 4.2)
Statement showing year wise capacity addition of gas based stations during last ten year ending March 2013
Plan Period
Year Capacity at the end of
the year (Mw)
Year wise
capacity addition (MW)
Gas required
(mmscmd)at 90% PLF
Average gas supplied
(mmscmd)
Shortfall (mmscmd)
X plan (2002-07)
2002-03 9949.00 --- 48.26 25.12 23.14 2003-04 10154.90 205.90 49.25 25.62 23.63 2004-05 10224.90 70.00 49.73 30.70 19.03 2005-06 10919.62 694.72 53.38 35.37 18.01 2006-07 12444.42 1524.80 61.18 35.10 26.08
Total (a) 2495.42 XI Plan Period
(2007-12)
2007-08 13408.92 964.50 65.67 38.14 27.53 2008-09 13599.62 190.70 66.61 37.45 29.16 2009-10 15769.27 2169.65 78.09 55.46 22.63 2010-11 16639.77 870.50 81.42 59.31 22.11 2011-12 18381.00 1741.23 86.07# 56.28 29.79
Total (b) 5936.58 2012-13 20110.00 1729.00 135.00 40.00 50.70
Total (c ) 1729.00 Grand Total
(a+b+c) 10161.00
# Gas requirement is considered for the available capacity of 17721.47 MW only.

Repo
rt N
o. 6
of 2
015
78
Ann
exur
e- 1
3 (R
efer
red
to in
Par
a 4.
2)
Stat
emen
t sho
win
g st
atus
of s
uppl
y of
NG
, liq
uid
fuel
, gen
erat
ion
loss
in p
ower
sect
or
Yea
r N
o of
po
wer
st
atio
ns
Inst
alle
d ca
paci
ty
in M
W
Gen
erat
ion
in M
Us
Gas
re
quir
emen
t at
90%
PL
F (m
msc
md)
Gas
al
lott
ed
(mm
scm
d)
Ave
rage
ga
s su
pplie
d/
cons
umed
(m
msc
md)
Nap
htha
us
ed (K
L)
FO u
sed
(KL
) G
ener
atio
n lo
ss (M
u)
2008
-09
46
1359
9.62
6739
8.65
66.6
1N
/A37
.45
1839
812.
5329
7451
.86
1199
4.98
2009
-10
47
1576
9.27
9251
7.10
78.0
961
.56
55.4
567
1220
.52
1945
50.9
532
37.4
320
10-1
1 50
16
639.
7797
580.
2381
.42
65.8
759
.31
1541
00.7
389
33.1
463
94.6
720
11-1
250
16
926.
2792
022.
7781
.78
67.1
156
.37
1852
88.4
222
5.60
1085
5.84
2012
-13
55
1836
2.27
5991
0.90
90.7
081
.73
40.0
028
5405
.00
519.
6033
646.
18T
otal
3135
827.
2050
1681
.15
6612
9.10
(31.
35 la
kh
KL
) (5
.01
lakh
K
L)
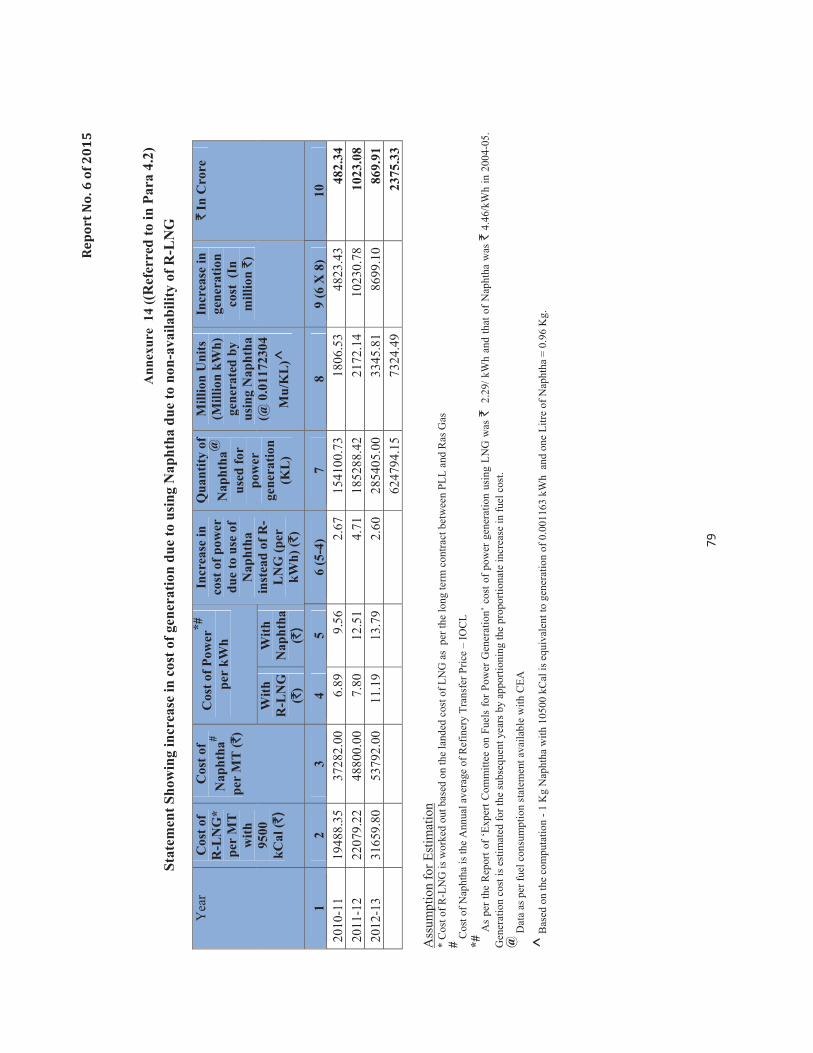
Repo
rt N
o. 6
of 2
015
79
A
nnex
ure
14
((Ref
erre
d to
in P
ara
4.2)
Stat
emen
t Sho
win
g in
crea
se in
cos
t of g
ener
atio
n du
e to
usi
ng N
apht
ha d
ue to
non
-ava
ilabi
lity
of R
-LN
G
Y
ear
Cos
t of
R-L
NG
* pe
r M
T
with
95
00
kCal
(`)
Cos
t of
Nap
htha
# pe
r M
T (`
)
Cos
t of P
ower
*#
per
kWh
Incr
ease
in
cost
of p
ower
du
e to
use
of
Nap
htha
in
stea
d of
R-
LN
G (p
er
kWh)
(`)
Qua
ntity
of
Nap
htha
@
used
for
pow
er
gene
ratio
n (K
L)
Mill
ion
Uni
ts
(Mill
ion
kWh)
ge
nera
ted
by
usin
g N
apht
ha
(@ 0
.011
7230
4 M
u/K
L)^
Incr
ease
in
gene
ratio
n co
st (
In
mill
ion
`)
`In
Cro
re
With
R
-LN
G
(`)
With
N
apht
ha
(`)
1 2
3 4
5 6
(5-4
) 7
8 9
(6 X
8)
10
2010
-11
1948
8.35
37
282.
006.
899.
562.
6715
4100
.73
1806
.53
4823
.43
482.
3420
11-1
2 22
079.
22
4880
0.00
7.80
12.5
14.
7118
5288
.42
2172
.14
1023
0.78
1023
.08
2012
-13
3165
9.80
53
792.
0011
.19
13.7
92.
6028
5405
.00
3345
.81
8699
.10
869.
91
62
4794
.15
7324
.49
23
75.3
3
Ass
umpt
ion
for E
stim
atio
n *
Cos
t of R
-LN
G is
wor
ked
out b
ased
on
the
land
ed c
ost o
f LN
G a
s pe
r the
long
term
con
tract
bet
wee
n PL
L an
d R
as G
as
# Cos
t of N
apht
ha is
the
Ann
ual a
vera
ge o
f Ref
iner
y Tr
ansf
er P
rice
– IO
CL
*# A
s pe
r the
Rep
ort o
f ‘Ex
pert
Com
mitt
ee o
n Fu
els
for P
ower
Gen
erat
ion’
cos
t of p
ower
gen
erat
ion
usin
g LN
G w
as `
2.2
9/ k
Wh
and
that
of N
apht
ha w
as `
4.4
6/kW
h in
200
4-05
. G
ener
atio
n co
st is
est
imat
ed fo
r the
subs
eque
nt y
ears
by
appo
rtion
ing
the
prop
ortio
nate
incr
ease
in fu
el c
ost.
@ D
ata
as p
er fu
el c
onsu
mpt
ion
stat
emen
t ava
ilabl
e w
ith C
EA
^ B
ased
on
the
com
puta
tion
- 1 K
g N
apht
ha w
ith 1
0500
kC
al is
equ
ival
ent t
o ge
nera
tion
of 0
.001
163
kWh
and
one
Litr
e of
Nap
htha
= 0
.96
Kg.

Repo
rt N
o. 6
of 2
015
80
Ann
exur
e-15
(Ref
erre
d to
in P
ara
4.3)
St
atem
ent s
how
ing
capa
city
util
isat
ion
of m
ajor
pip
elin
es
2011
-12
2012
-13
2013
-14
Sl.
No.
N
ET
WO
RK
/RE
GIO
N
Ent
ity
Len
gth
Km
s as
on
31.0
3.20
14
Des
ign
Cap
acity
(m
msc
md)
Ave
rage
Fl
ow o
f gas
(m
msc
md)
Ave
rage
%
capa
city
ut
iliza
tion^
Des
ign
Cap
acity
(m
msc
md)
Ave
rage
Fl
ow o
f gas
(m
msc
md)
Ave
rage
%
capa
city
ut
iliza
tion^
Des
ign
Cap
acity
(m
msc
md)
Ave
rage
Fl
ow o
f ga
s (m
msc
md)
Ave
rage
%
capa
city
ut
iliza
tion^
(3
1.03
.201
4)
1
HV
J GR
EP -D
VPL
&
Spur
(Haz
ira -V
ijaip
ur-
Jagd
ishp
ur)
HV
J+V
ijayp
ur D
adri
Pipe
line
GA
IL
4435
33
30
.4
92
33
47.5
93
57
.3
42.9
80
.98
2 D
VPL
-GR
EP
Upg
rada
tion
(DV
PL-2
&
VD
PL)
GA
IL
1112
34
31
.8
91
34
28
82
54
15.3
3 28
.39
3 C
HH
AIN
SA- J
HA
JJA
R
-HIS
SAR
P/L
G
AIL
26
2 5
0.75
15
5
0.75
15
5
0.68
15
4 D
AH
EJ-U
RA
N-
PAN
VEL
(DU
PL/
DPP
L) i
nclu
ding
Spu
r Li
nes
GA
IL
873
20
19.9
98
20
12
.64
68.5
20
8.
92
44.8
2
5
DA
DR
I BA
WA
NA
N
AN
GA
L P/
L, D
adri-
B
awan
a:10
6Km
, Baw
ana
- N
anga
l:501
KM
, Spu
r Lin
e of
BN
PL :
196
Km
.
GA
IL
803
11
* 35
.5
11
1.43
13
11
2.
40
21.8
1
6 D
AB
HO
L -B
AN
GLO
RE-
PIPE
LIN
E (In
clud
ing
spur
) G
AIL
10
04
Com
mis
sion
ed in
201
3-14
16
0.
06
0 16
0.
97
6.09
7 K
OC
HI-
Koo
ttana
d-B
angl
ore-
Man
galo
re
(Pha
se-1
) G
AIL
41
C
omm
issi
oned
in 2
013-
14
Com
mis
sion
ed in
201
3-14
6
0.31
5.
21
8 A
SSA
M (L
akw
a)
GA
IL
8 2.
5 0.
60
25.2
2.
5 0.
58
23.2
2.
5 0.
55
22.0
9 TR
IPU
RA
(Aga
rtala
) G
AIL
61
2.
3 1.
46
64.8
2.
3 1.
45
64
2.3
1.46
64
.4
10
AH
MED
AB
AD
G
AIL
14
4 3
0.45
15
3
0.41
14
.1
3.0
0.38
13
.0
11
RA
JAST
HA
N (F
ocus
En
ergy
) G
AIL
15
4 2.
35
0.84
36
.0
2.35
0.
75
31.8
2.
35
1.09
46
.5
12
BH
AR
UC
H ,
BA
DO
DA
RA
(U
ND
ERA
) inc
lude
d R
-LN
G+
RIL
GA
IL
670
15.4
11
.2
73
15.4
2.
94
19.1
15
.4
2.25
14
.6
13
MU
MB
AI
GA
IL
129
24
12
50
24
22.9
95
.4
24.0
22
.9
95.4
14
KG
BA
SIN
(inc
lude
d R
-LN
G+
RIL
) G
AIL
87
7 16
14
.7
91.9
16
8.
6 54
16
.0
6.0
37.4

Repo
rt N
o. 6
of 2
015
81
15
CA
UV
ERY
BA
SIN
G
AIL
26
8 9
3.42
35
9
3.2
37
9.0
3.57
41
.22
16
EAST
- WES
T PI
PE
LIN
E (R
GTI
L)
Rel
ianc
e 14
69
80
48.0
60
80
48
60
80
.0
48.0
60
17
GSP
CL
Net
wor
k in
clud
ing
Spur
Lin
es
GSP
CL
1874
50
22
44
50
22
44
50
.0
22.0
44
18
Ass
am G
as C
ompa
ny
(Dul
iaja
n to
N
umal
igar
h)
AG
C
1000
2
1.50
75
6
4.5
75
6.0
4.50
75
19
Dad
ri -P
anip
at
IOC
L 13
2 0
0 0
11
2.63
28
9.
5 3.
11
32.8
20
Ura
n Tr
omba
y O
NG
C
24
0 0
0 6
0 0
6.0
* *
Tot
al
1534
0 30
9.55
19
9.02
64
.29
346.
55
208.
34
60.1
1 39
5 18
7 47
* D
ata
not a
vaila
ble.
^A
vera
ge p
erce
ntag
e ca
paci
ty u
tiliz
atio
n is
wor
ked
out b
y PA
PC.
Sour
ce: P
PAC

Report No. 6 of 2015
82
Annexure 16 (Referred to in Para 5.1)
Statement showing sector-wise allocation of domestically produced Natural Gas
(Quantity in mmscmd)
Sl. No
Sector wise allocation of natural gas Total
1 Fertilizer 55.08 2 Gas Based LPG plants for LPG extraction 6.88 3 Power 108.30 4 CGD (PNG, Transport) 10.19 5 Taj Trapezium Zone consumers 1.10 6 Small consumers having allocation less than 0.05
mmscmd 2.91
7 Steel 9.95 8 Refineries 14.93 9 Petrochemicals 12.73
10 Others (include Court mandated customers other than CGD, internal consumption for pipeline) 14.72
Total 236.79

Repo
rt N
o. 6
of 2
015
83
Ann
exur
e-17
(a) (
Ref
erre
d to
in P
ara
5.3.
1)
Stat
emen
t sho
win
g no
n-re
cove
ry o
f mar
ket p
rice
on
APM
gas
con
sum
ed fo
r ot
her
than
pro
duct
ion
of u
rea
20
10-1
1 Sl
. No.
N
ame
of
Uni
t N
G c
onsu
med
as
per
ann
ual
cons
umpt
ion
repo
rt
(mm
btu)
NG
con
sum
ed
for
urea
as
allo
wed
by
FIC
C
(mm
btu)
NG
(APM
) us
ed fo
r ot
her
purp
oses
(m
mbt
u)
APM
pri
ce
char
ged
(`
./G'c
al)
APM
pr
ice
char
ged
(`/m
mbt
u)
Non
APM
Rat
e (`
/mm
btu)
H
VJ/
DV
PL
pric
e ap
plic
able
Diff
eren
tial
pric
e
(`)
Am
ount
und
er-
reco
vere
d
(`
)
1 2
3 4
5
(Col
. 3-c
ol.
4)
6 7
(Col
.6 X
25
.2/1
00)
8 9
(C
ol. 8
-C
ol. 7
)
10
(Col
. 5 X
Col
. 9)
1 K
SFL
84
7404
9 83
1756
3 15
6486
68
4.20
17
2.42
23
4.25
61
.83
9675
529
2 C
FCL
-I
85
7127
4 82
1571
8 18
8246
70
2.00
17
6.90
23
4.25
57
.35
1079
5908
3 C
FCL
-II
1673
10
4 T
CL
84
9211
1 84
7302
4 19
087
685.
67
172.
79
234.
25
61.4
6 11
7308
7T
otal
21
6445
24
2011
-12
1 K
SFL
78
0724
1 75
2772
2 27
9519
79
1.46
19
9.45
24
9.26
49
.81
1392
2841
2 C
FCL
-I
8192
795
77
8487
3 14
5950
79
0.85
19
9.29
24
9.26
49
.97
7293
122
3 C
FCL
-II
2619
72
4 IG
FL
7903
923
7748
825
1550
98
718.
21
180.
99
249.
26
68.2
7 10
5885
40T
otal
3180
4503
Gra
nd to
tal (
2.16
+ 3
.18)
5.
34 c
rore
Sour
ce:
1. E
scal
atio
n/D
e-Es
cala
tion
Stat
emen
t pre
pare
d by
FIC
C (D
OF)
for c
alcu
latin
g su
bsid
y pa
yabl
e on
ure
a.
2. D
etai
ls o
f Allo
catio
n an
d co
nsum
ptio
n of
feed
stoc
k as
furn
ishe
d by
ferti
lizer
uni
ts to
FIC
C.

Repo
rt N
o. 6
of 2
015
84
Ann
exur
e 17
(b) (
Ref
erre
d in
to P
ara
5.3.
1)
Stat
emen
t sho
win
g lo
ss o
f pro
duct
ion
of u
rea
on a
ccou
nt o
f non
-util
isat
ion
of A
PM g
as fo
r sp
ecifi
ed p
urpo
se w
ith r
esul
tant
subs
idy
outg
o
2010
-11
2011
-12
Part
icul
ars
KSF
L
CFC
L-I
& II
T
CL
K
SFL
C
FCL
I &
II
IGFL
1
Ava
ilabl
e pr
oduc
tion
capa
city
(MT)
10
3050
021
0020
0 11
1670
011
6460
021
4600
011
6220
0 2
Ure
a pr
oduc
tion
durin
g th
e pe
riod
(MT)
90
9810
1845
690
9573
3090
9810
1845
690
9900
00
3 C
apac
ity u
tilis
atio
n in
per
cen
t 88
88
8678
8685
4
NG
con
sum
ed fo
r Ure
a (m
mbt
u)
8317
563
8383
027
8473
024
7527
722
8046
845
7748
825
5 U
rea
(MT)
/NG
(mm
btu)
0.
1093
8420
30.
2201
6987
4 0.
1129
8563
50.
1208
6126
50.
2293
6815
60.
1277
6130
6 6
NG
not
use
d fo
r Ure
a (m
mbt
u)
1564
8518
8246
19
087
2795
1814
5950
1550
97
7 Pr
oduc
tion
loss
of u
rea
(5X
6) in
MT
1711
741
446
2157
3378
333
476
1981
5 8
Cos
t of p
rodu
ctio
n of
ure
a/M
T in
`
9098
1086
1 93
9210
059
1240
112
069
9 M
RP
of u
rea/
MT
in `
53
1053
10
5310
5310
5310
5310
10
Su
bsid
y on
ure
a in
`/M
T (8
-9)
3788
5551
40
8247
4970
9167
59
11
Subs
idy
on im
porte
d ur
ea in
`/M
T 14
000
1400
0 14
000
2230
622
306
2230
6 12
D
iffer
entia
l sub
sidy
in `
/MT
(11-
10)
1021
284
49
9918
1755
715
215
1554
7 13
A
void
able
subs
idy
(` in
cro
re) (
7 X
12)
17
.48
35.0
2 2.
1459
.31
50.9
330
.81
Sour
ce: A
nnex
ure
17 a
, Esc
alat
ion
de-e
scal
atio
n st
atem
ent f
rom
FIC
C, A
nnex
ure
9 (a
)
2010
-11
2011
-12
Tot
al
Loss
of p
rodu
ctio
n in
MT
6072
0 87
074
1477
94
Ave
rage
diff
eren
tial s
ubsi
dy `
89
98
1619
9 --
To
tal d
iffer
entia
l sub
sidy
(` in
cro
re)
5514
1 19
6

Report No. 6 of 2015
85
Annexure-18 (Referred to in Para 5.3.2)
Statement showing list of shareholders of APGPCL and share of power supplied to them
Sl. No
Shareholder Equity Participation- No. of shares in crore (%)
Corresponding Share of
electricity (%)
Share in Electricity
(MW) 1 APTRANSCO
(State Electricity utility)
15758427 (21.62 %)
21.62 58.80
2 Public Sector Undertakings
14568517 (19.99%)
19.99 54.36
3 Private Sector 42569245 (58.39%)
58.39 158.84
Total 72896189 100 272.00

Report No. 6 of 2015
86
Annexure-19 (Referred to in Para 5.3.3)
Statement showing List of small scale consumers and market rate (non-APM) pending recovery from such consumers
Sl. No Customer Amount pending recovery
(` in crore) 1 Gopal Glass Works Ltd. 5.88 2 Bajrang Refractories Private Ltd. 0.13 3 J P Chemicals. 0.86 4 Jalaram Ceramics Ltd. 1.80 5 Nahar Colours and Coating Ltd. 1.09 6 Spire cera frit Private Ltd. 0.92 7 Somany Ceramics Ltd. 8.30 8 Bhavani Chemicals. 1.92 9 Ajita Silchen Private Ltd. 2.63 10 Akik Tiles Private Ltd. 5.45 11 Bisazza India Private Ltd. 2.59 12 Akash Ceramics Private Ltd. 1.93 13 Sterling Ceramics Private Ltd. 5.69 14 Victory Ceratech Private Ltd. 2.15 15 Swastik Sanitarywares Ltd. 0.44 16 Pioneer Industries. 0.07 17 Ashok Ceracon Private Ltd. 0.13 18 Mahek Glazes Private Ltd. 1.03 Total 43.01

Report No. 6 of 2015
87
Annexure 20 (Referred to in Para 5.4)
Statement showing loss of production and excess subsidy payment on imported Urea
Sl. No
Fertilizer unit/ Quantity of NG underutilized in mmscmd/
Loss of production
of urea (LMT)
Excess subsidy paid
Reference
(NG source) Period (` in crore)
1 BVFCL (APM)
Ranging between 0.30 and 0.27
(2008-09 and 2011-12)
1.09 55.72 Annexure 21
2 NFCL (KG D6 and
JV)
0.001 to 0.148 (July 2011 to March 2013)
0.51 98.04 Annexure-22
3 NFL (APM)
0.01 to 0.61 (April to December 2012)
0.65 139.63 Annexure- 23
4 KRIBHCO (APM)
0.01 to 1.16 (July 2011 to October 2012)
1.66 340.45 Annexure- 24
5 GSFC 0.034 (11 Months in 2011-13)
Increase in cost of
production
3.23 Annexure- 25 (a) & 25 (b)
Total ` 637.07

Repo
rt N
o. 6
of 2
015
88
Ann
exur
e 21
(Ref
erre
d to
in P
ara
5.4)
Stat
emen
t sho
win
g ex
cess
subs
idy
paym
ent o
win
g to
pro
duct
ion
loss
of u
rea
due
to sh
ort l
iftin
g of
NG
by
BV
FCL
dur
ing
2008
-09
and
2011
-12
Yea
r of
al
loca
tion
cont
ract
ed
quan
tity
of
gas
Mut
ually
ag
reed
bi
lled
quan
tity
Con
sum
ptio
n pe
r da
y co
nsid
erin
g 30
0 on
-st
ream
day
s pe
r ye
ar (a
s pe
r FI
CC
no
rm)
Les
s co
nsum
ed
Prod
uctio
n lo
ss d
ue to
sh
ort
cons
umpt
ion
as c
onfir
med
by
BV
FCL
Exc
ess o
f su
bsid
y pe
r T
MT
Tot
al E
xces
s su
bsid
y
m
msc
md
mm
scm
m
msc
md
mm
scm
d
MT
(` i
n la
kh)
(` in
lakh
)
1 2
3 4
(3
/300
) 5
(2-4
) 6
7 8
(6 X
7/1
000)
2008
-09
1.72
426.
571.
420.
30
6104
4.00
40.2
824
58.8
520
11-1
2 1.
7243
4.10
1.45
0.27
48
684.
0063
.95
3113
.34
Tot
al
1097
28.0
055
72.1
9
1.0
9 L
MT
` 55
.72
cror
e

Repo
rt N
o. 6
of 2
015
89
Ann
exur
e-22
(Ref
erre
d to
in P
ara
5.4)
St
atem
ent s
how
ing
prod
uctio
n lo
ss d
ue to
low
off
take
of N
G b
y N
agar
juna
Fer
tiliz
ers a
nd C
hem
ical
s Ltd
, I
& II
Uni
ts, K
akin
ada
with
res
ulta
nt e
xtra
pa
ymen
t of s
ubsi
dy d
urin
g 20
11-1
2 (J
uly
11 to
Mar
ch 1
2)
Mon
th
Type
of g
as
Act
ual S
uppl
y
(scm
) A
ctua
l C
onsu
mpt
ion
Shor
t co
nsum
ptio
n in
mon
th
(3-4
) scm
Shor
t co
nsum
ptio
n Pe
r da
y (C
ol. 5
/ (D
ays i
n m
onth
x1
0 la
kh))
M
MSC
MD
Per
day
Prod
uctio
n lo
ss (C
ol.6
X
1.3
399)
T
MT
Prod
uctio
n lo
ss fo
r th
e m
onth
(Col
.7
X D
ays i
n m
onth
) TM
T
Subs
idy
paya
ble
to
NFC
L p
er
TM
T
(`.9
341.
88-
`.53
10) x
1000
(`
)
Subs
idy
paid
on
impo
rts
per
TM
T(`
)
Exc
ess
subs
idy
paid
pe
r T
MT
(`)
(Col
.10-
C
ol.9
)
Tot
al e
xtra
su
bsid
y pa
id(`
) (C
ol.8
X
Col
.11)
1 2
3 4
5 6
7 8
9 10
11
12
Ju
l’11
RIL
50
6855
02
4897
8557
17
0694
5 0.
0551
0.
0738
2.
2871
40
3188
0 22
3060
00
1827
4120
41
7947
40
Aug
’11
RIL
52
1086
34
4773
5575
43
7305
9 0.
1411
0.
1890
5.
8595
40
3188
0 22
3060
00
1827
4120
10
7077
206
Sep’
11
JV(N
on A
PM N
G)
5477
825
5114
431
3633
94
0.01
21
0.01
62
0.48
69
4031
880
2230
6000
18
2741
20
8897
669
RIL
48
4125
44
4633
9557
20
7298
7 0.
0691
0.
0926
2.
7776
40
3188
0 22
3060
00
1827
4120
50
7581
96
Oct
’11
JV(N
on A
PM N
G)
7467
083
7094
162
3729
21
0.01
20
0.01
61
0.49
97
4031
880
2230
6000
18
2741
20
9131
578
RIL
50
0742
55
4883
9982
12
3427
3 0.
0398
0.
0533
1.
6538
40
3188
0 22
3060
00
1827
4120
30
2217
40
Nov
’ 11
JV(N
on A
PM N
G)
4230
631
3634
515
5961
16
0.01
99
0.02
66
0.79
87
4031
880
2230
6000
18
2741
20
1459
5540
R
IL
4842
0155
43
9894
98
4430
657
0.14
77
0.19
79
5.93
66
4031
880
2230
6000
18
2741
20
1084
8614
1 D
ec’ 1
1 JV
(Non
APM
NG
) 55
1637
0 50
0729
4 50
9076
0.
0164
0.
0220
0.
6821
40
3188
0 22
3060
00
1827
4120
12
4647
77
RIL
50
1867
00
4987
7781
30
8919
0.
0100
0.
0134
0.
4139
40
3188
0 22
3060
00
1827
4120
75
6365
8 Ja
n’ 1
2
JV(N
on A
PM N
G)
4452
288
3887
057
5652
31
0.01
82
0.02
44
0.75
74
4031
880
2230
6000
18
2741
20
1384
0818
R
IL
5031
0305
46
2313
67
4078
938
0.13
16
0.17
63
5.46
54
4031
880
2230
6000
18
2741
20
9987
5375
Fe
b’ 1
2 JV
(Non
APM
NG
) 51
2570
6 47
2208
1 40
3625
0.
0144
0.
0193
0.
5408
40
3188
0 22
3060
00
1827
4120
98
8264
4 R
IL
4891
1364
48
1829
00
7284
64
0.02
60
0.03
49
0.97
61
4031
880
2230
6000
18
2741
20
1783
7369
M
ar’ 1
2 JV
(Non
APM
NG
) 41
7674
1 37
2336
4 45
3377
0.
0146
0.
0196
0.
6075
40
3188
0 22
3060
00
1827
4120
11
1015
28
RIL
53
8732
70
5182
6113
20
4715
7 0.
0660
0.
0885
2.
7430
40
3188
0 22
3060
00
1827
4120
50
1259
11
Tot
al (a
) 32
.48
TM
T
59
.36
cror
e
Con
tinue
d…

Repo
rt N
o. 6
of 2
015
90
Stat
emen
t sho
win
g pr
oduc
tion
loss
due
to lo
w o
ff ta
ke o
f NG
by
Nag
arju
na F
ertil
izer
s and
Che
mic
als L
td,
I &
II U
nits
, Kak
inad
a w
ith r
esul
tant
ext
ra
paym
ent o
f sub
sidy
dur
ing
2012
-13
(Apr
il to
Mar
ch)
Mon
th
Type
of g
as
Act
ual
Supp
ly (
scm
) A
ctua
l C
onsu
mpt
ion
Shor
t co
nsum
ptio
n in
mon
th
(3-4
) M
MSC
M
Shor
t co
nsum
ptio
n Pe
r da
y (C
ol. 5
/ D
ays
in m
onth
x10
la
kh) M
MSC
MD
Per
day
Prod
uctio
n lo
ss
(Col
.6 X
1.3
399)
T
MT
Prod
uctio
n lo
ss fo
r th
e m
onth
(Col
.7
X D
ays i
n m
onth
) TM
T
Subs
idy
paya
ble
to N
FCL
per
T
MT
(`
934
1.88
- `
5310
) x10
00 (`
)
Subs
idy
paid
on
impo
rts
per
TM
T(`
)
Exc
ess s
ubsi
dy
paid
per
TM
T (`
) (C
ol.1
0-
Col
.9)
Tot
al e
xtra
su
bsid
y pa
id(`
) (C
ol.8
X
Col
.11)
1 2
3 4
5 6
7 8
9 10
11
12
Apr
JV
(Non
APM
) 31
6481
7 26
4630
6 51
8511
0.
0172
837
0.02
3158
43
0.69
4752
889
4031
880
2488
3140
20
8512
60
1448
6473
R
IL
5207
9435
49
5563
31
2523
104
0.08
4103
467
0.11
2690
235
3.38
0707
05
4031
880
2488
3140
20
8512
60
7049
2002
May
JV
(Non
APM
) 54
7475
2 46
9521
5 77
9537
0.
0251
4635
5 0.
0336
9360
1 1.
0445
0162
6 40
3188
0 24
8831
40
2085
1260
21
7791
75
RIL
53
0621
93
5143
1117
16
3107
6 0.
0526
1535
5 0.
0704
9931
4 2.
1854
7873
2 40
3188
0 24
8831
40
2085
1260
45
5699
85
June
JV
(Non
APM
) 49
7283
3 43
3950
3 63
3330
0.
0211
11
0.02
8286
629
0.84
8598
867
4031
880
2488
3140
20
8512
60
1769
4356
R
IL
4869
6738
48
0203
96
6763
42
0.02
2544
733
0.03
0207
688
0.90
6230
646
4031
880
2488
3140
20
8512
60
1889
6051
Jul
JV(N
on A
PM)
7791
165
6993
260
7979
05
0.02
5738
871
0.03
4487
513
1.06
9112
91
4031
880
2488
3140
20
8512
60
2229
2351
R
IL
5313
0003
51
8955
37
1234
466
0.03
9821
484
0.05
3356
806
1.65
4060
993
4031
880
2488
3140
20
8512
60
3448
9256
Aug
JV
(Non
APM
) 75
8507
8 70
1096
2 57
4116
0.
0185
1987
1 0.
0248
1477
5 0.
7692
5802
8 40
3188
0 24
8831
40
2085
1260
16
0399
99
RIL
49
8686
30
4912
0028
74
8602
0.
0241
4845
2 0.
0323
5651
1.
0030
5182
40
3188
0 24
8831
40
2085
1260
20
9148
94
Sep
JV(N
on A
PM)
6858
738
6389
000
4697
38
0.01
5657
933
0.02
0980
065
0.62
9401
946
4031
880
2488
3140
20
8512
60
1312
3824
R
IL
4805
5359
47
5797
74
4755
85
0.01
5852
833
0.02
1241
211
0.63
7236
342
4031
880
2488
3140
20
8512
60
1328
7181
Oct
JV
(Non
APM
) 74
5042
2 70
5245
4 39
7968
0.
0128
3767
7 0.
0172
0120
4 0.
5332
3732
3 40
3188
0 24
8831
40
2085
1260
11
1186
70
RIL
50
7984
99
5015
2694
64
5805
0.
0208
3241
9 0.
0279
1335
9 0.
8653
1412
40
3188
0 24
8831
40
2085
1260
18
0428
90
Nov
JV
(Non
APM
) 70
0405
0 69
0251
4 10
1536
0.
0033
8453
3 0.
0045
3493
6 0.
1360
4808
6 40
3188
0 24
8831
40
2085
1260
28
3677
4 R
IL
5004
4271
49
7182
06
3260
65
0.01
0868
833
0.01
4563
15
0.43
6894
494
4031
880
2488
3140
20
8512
60
9109
801
Dec
JV
(Non
APM
) 77
0467
5 76
8741
1 17
264
0.00
0556
903
0.00
0746
195
0.02
3132
034
4031
880
2488
3140
20
8512
60
4823
32
RIL
51
5627
54
5101
0243
55
2511
0.
0178
2293
5 0.
0238
8095
1 0.
7403
0948
9 40
3188
0 24
8831
40
2085
1260
15
4363
86
Jan
JV(N
on A
PM)
7847
385
7566
383
2810
02
0.00
9064
581
0.01
2145
632
0.37
6514
58
4031
880
2488
3140
20
8512
60
7850
803
RIL
51
0245
20
5085
9774
16
4746
0.
0053
1438
7 0.
0071
2074
7 0.
2207
4316
5 40
3188
0 24
8831
40
2085
1260
46
0277
3 Fe
b JV
(Non
APM
) 73
1083
2 71
9395
7 11
6875
0.
0037
7016
1 0.
0050
5163
9 0.
1566
0081
3 40
3188
0 24
8831
40
2085
1260
32
6532
4 M
ar
JV(N
on A
PM)
7696
452
7516
573
1798
79
0.00
5802
548
0.00
7774
835
0.24
1019
872
4031
880
2488
3140
20
8512
60
5025
568
Tot
al (b
) 18
.55
TM
T
38.6
8 cr
ore
Gra
nd to
tal
51.0
3 T
MT
98
.04
cror
e #
Prod
uctio
n lo
ss p
er m
msc
md=
1.33
99TM
T pe
r day
(Tar
gete
d pr
oduc
tion
15.6
5 LM
TPA
/ N
G re
quire
d 3.
2 m
msc
md/
365
days
in th
e ye
ar)
Not
e: A
s the
act
uals
of s
ubsi
dy p
aid
and
esca
latio
n st
atem
ents
of F
ICC
for 2
012-
13 w
ere
not a
vaila
ble,
the
norm
ativ
e co
st o
f pro
duct
ion
and
the
subs
idy
paid
on
impo
rt o
f ure
a du
ring
the
year
20
11-1
2 w
ere
cons
ider
ed fo
r cal
cula
tions
.
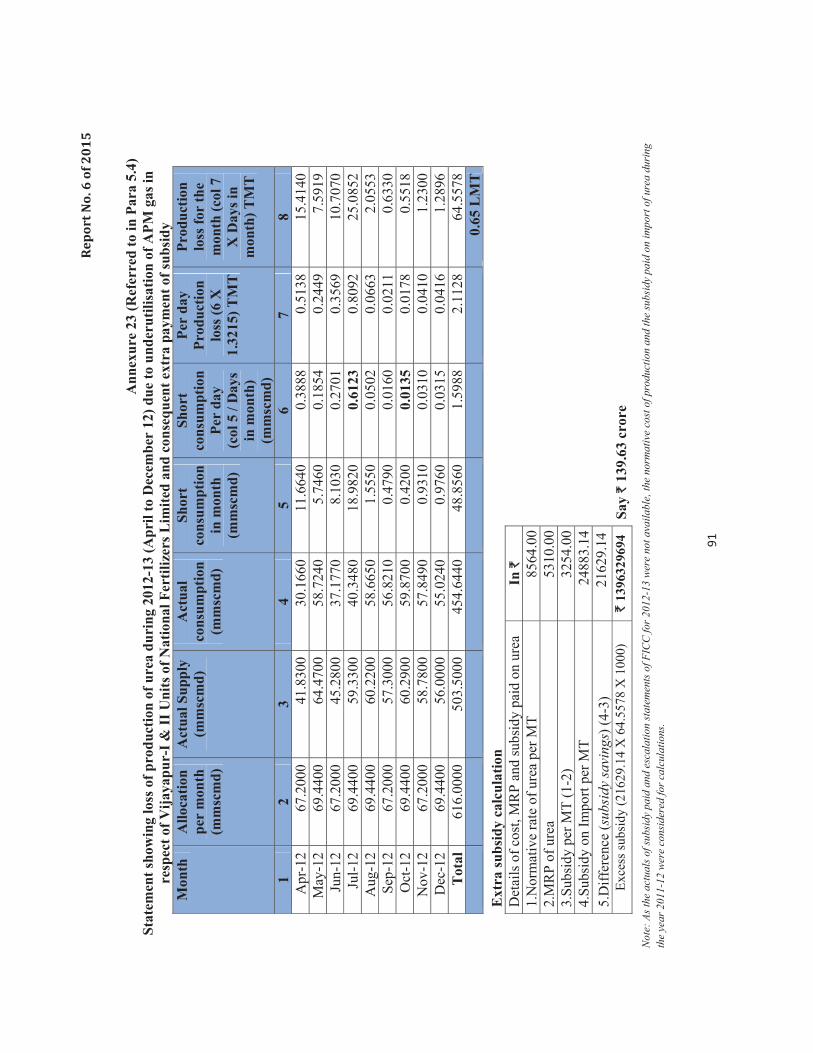
Repo
rt N
o. 6
of 2
015
91
Ann
exur
e 23
(Ref
erre
d to
in P
ara
5.4)
St
atem
ent s
how
ing
loss
of p
rodu
ctio
n of
ure
a du
ring
201
2-13
(Apr
il to
Dec
embe
r 12
) due
to u
nder
utili
satio
n of
APM
gas
in
resp
ect o
f Vija
yapu
r-I &
II U
nits
of N
atio
nal F
ertil
izer
s Lim
ited
and
cons
eque
nt e
xtra
pay
men
t of s
ubsi
dy
Mon
th
Allo
catio
n pe
r m
onth
(m
msc
md)
Act
ual S
uppl
y (m
msc
md)
A
ctua
l co
nsum
ptio
n (m
msc
md)
Shor
t co
nsum
ptio
n in
mon
th
(mm
scm
d)
Shor
t co
nsum
ptio
n Pe
r da
y
(col
5 /
Day
s in
mon
th)
(mm
scm
d)
Per
day
Prod
uctio
n lo
ss (6
X
1.32
15) T
MT
Prod
uctio
n lo
ss fo
r th
e m
onth
(col
7
X D
ays i
n m
onth
) TM
T
1 2
3 4
5 6
7 8
Apr
-12
67.2
000
41.8
300
30.1
660
11.6
640
0.38
880.
5138
15.4
140
May
-12
69.4
400
64.4
700
58.7
240
5.74
60
0.18
540.
2449
7.59
19Ju
n-12
67.2
000
45.2
800
37.1
770
8.10
30
0.27
010.
3569
10.7
070
Jul-1
269
.440
0 59
.330
040
.348
018
.982
0 0.
6123
0.80
9225
.085
2A
ug-1
269
.440
0 60
.220
058
.665
01.
5550
0.
0502
0.06
632.
0553
Sep-
1267
.200
0 57
.300
056
.821
00.
4790
0.
0160
0.02
110.
6330
Oct
-12
69.4
400
60.2
900
59.8
700
0.42
00
0.01
350.
0178
0.55
18N
ov-1
267
.200
0 58
.780
057
.849
00.
9310
0.
0310
0.04
101.
2300
Dec
-12
69.4
400
56.0
000
55.0
240
0.97
60
0.03
150.
0416
1.28
96T
otal
616.
0000
50
3.50
0045
4.64
4048
.856
0 1.
5988
2.11
2864
.557
8
0.
65 L
MT
Ext
ra su
bsid
y ca
lcul
atio
n D
etai
ls o
f cos
t, M
RP
and
subs
idy
paid
on
urea
In
`
1.N
orm
ativ
e ra
te o
f ure
a pe
r MT
8564
.00
2.M
RP
of u
rea
5310
.00
3.Su
bsid
y pe
r MT
(1-2
) 32
54.0
04.
Subs
idy
on Im
port
per M
T
2488
3.14
5.D
iffer
ence
(sub
sidy
savi
ngs)
(4-3
) 21
629.
14Ex
cess
subs
idy
(216
29.1
4 X
64.
5578
X 1
000)
`
1396
3296
94
Say
` 13
9.63
cro
re
Not
e: A
s the
act
uals
of s
ubsi
dy p
aid
and
esca
latio
n st
atem
ents
of F
ICC
for 2
012-
13 w
ere
not a
vaila
ble,
the
norm
ativ
e co
st o
f pro
duct
ion
and
the
subs
idy
paid
on
impo
rt o
f ure
a du
ring
the
year
201
1-12
wer
e co
nsid
ered
for c
alcu
latio
ns.

Repo
rt N
o. 6
of 2
015
92
Ann
exur
e-24
(Ref
erre
d to
in P
ara
5.4)
St
atem
ent s
how
ing
prod
uctio
n lo
ss in
KR
IBH
CO
dur
ing
2011
-12
& 2
012-
13 (J
uly
2011
to O
ctob
er 2
012)
due
to n
on-u
tiliz
atio
n of
A
PM G
as a
nd c
onse
quen
t ext
ra p
aym
ent o
f sub
sidy
M
onth
A
ctua
l av
aila
bilit
y of
A
PM g
as
(Tot
al
mm
scm
d in
m
onth
*)
Act
ual
Con
sum
ptio
n (T
otal
mm
scm
d in
mon
th*)
Shor
t co
nsum
ptio
n in
mon
th
(Tot
al
mm
scm
d in
m
onth
*)
Shor
t co
nsum
ptio
n Pe
r da
y (C
ol.4
/ D
ays i
n m
onth
) m
msc
md
Per
day
Prod
uctio
n lo
ss (C
ol.5
X
1.2
254)
T
MT
Prod
uctio
n lo
ss
for
the
mon
th
(Col
.6 X
Day
s in
mon
th) T
MT
Subs
idy
paya
ble
to
KR
IBH
CO
per
T
MT
(`
733
8- M
RP
` 53
10)x
1000
(`)
Subs
idy
paid
on
impo
rts p
er
TM
T(`
)
Exc
ess
subs
idy
paid
pe
r T
MT
(`)
Tot
al e
xtra
su
bsid
y pa
id(`
)
1 2
3
4 (C
ol. 2
-Col
. 3)
5
6 7
8 9
10 (
Col
. 9
– C
ol. 8
) 11
(Col
. 10
X
Col
. 7)
2011
-12
Jul-1
1 55
.00
54.5
0 0.
500.
0161
30.
0197
6 0.
6125
6 20
2800
022
3060
0020
2780
0012
4214
92
Sep-
11
60.3
053
.10
7.20
0.24
000
0.29
410
8.82
300
2028
000
2230
6000
2027
8000
1789
1279
4
Oct
-11
52.7
036
.20
16.5
00.
5322
60.
6522
3 20
.219
13
2028
000
2230
6000
2027
8000
4100
0351
8
Dec
-11
50.3
025
.00
25.3
00.
8161
31.
0000
8 31
.002
48
2028
000
2230
6000
2027
8000
6286
6828
9
Jan-
12
54.3
645
.44
8.92
0.28
774
0.35
260
10.9
3060
20
2800
022
3060
0020
2780
0022
1650
707
Feb-
12
55.1
021
.57
33.5
31.
1562
11.
4168
2 41
.087
78
2028
000
2230
6000
2027
8000
8331
7800
3
Mar
-12
71.4
438
.97
32.4
71.
0474
21.
2835
1 39
.788
81
2028
000
2230
6000
2027
8000
8068
3748
9
Sub-
tota
l 15
2.46
432
30
9167
2292
20
12-1
3
Apr
-12
62.3
057
.33
4.97
0.16
567
0.20
301
6.09
030
2028
000
2488
3140
2285
5140
1391
9465
9
Aug
-12
54.8
254
.65
0.17
0.00
548
0.00
672
0.20
832
2028
000
2488
3140
2285
5140
4761
183
Oct
-12
54.9
348
.90
6.03
0.19
452
0.23
836
7.38
916
2028
000
2488
3140
2285
5140
1688
8028
6 Su
b-to
tal
13.6
8106
3128
3612
8 G
rand
Tot
al
166.
1453
8
3404
5084
20
Say
` 34
0.45
cro
re
Dur
ing
thes
e 10
mon
ths i
n 20
11-1
2 an
d 20
12-1
3, th
ere
was
low
off-
take
of A
PM g
as.
* To
tal m
msc
md
in m
onth
is th
e su
m o
f mm
scm
d of
eac
h da
y in
that
mon
th.
Not
e: A
s the
act
uals
of s
ubsi
dy p
aid
and
esca
latio
n st
atem
ents
of F
ICC
for 2
012-
13 w
ere
not a
vaila
ble,
the
norm
ativ
e co
st o
f pro
duct
ion
and
the
subs
idy
paid
on
impo
rt o
f ure
a du
ring
the
year
20
11-1
2 w
ere
cons
ider
ed fo
r cal
cula
tions
.

Repo
rt N
o. 6
of 2
015
93
A
nnex
ure-
25 (a
) (R
efer
red
to in
Par
a 5.
4)
Stat
emen
t sho
win
g lo
w o
ff-ta
ke o
f che
aper
gas
by
GSF
C a
nd e
xtra
exp
endi
ture
on
acco
unt o
f util
isat
ion
of c
ostli
er g
as
duri
ng th
e pe
riod
May
201
1 to
Mar
ch 2
013)
Fr
om M
ay 2
011
to M
arch
201
2 M
onth
C
apac
ity
of U
rea
(MT
)
Prod
uctio
n (M
T)
Feed
stoc
k A
vaila
bilit
y Pr
ice
Con
sum
ptio
n U
nder
C
onsu
mpt
ion
SCM
(c
ol.5
-col
.7)
Diff
eren
ce in
ra
te
Ext
ra
cost
on
feed
stoc
k (`
)
(MT
) or
(Scm
) (`
)/ U
nit
(MT
) or
(SC
M)
1 2
3 4
5 6
7 8
9 10
(col
8
X c
ol 9
) M
ay
3481
3 26
510
HP
APM
(SM
3)
1484
0000
8.
27
1454
2032
29
7968
16
.48
– 8.
27
2446
317
PM
T-A
PM(S
M3)
27
4064
6 8.
27
2564
215
1764
31
16.4
8 –
8.27
14
4849
9
PMT-
PSC
18
0855
7 11
.03
1642
483
1660
74
16.4
8 –
11.0
3 90
5103
R-L
NG
(SM
3)
1002
6710
16
.48
2462
025
--
--
--
Jul
3481
3 21
960
LP A
PM (S
M3)
44
4378
3 7.
80
4443
095
688
16.9
1 –
7.80
62
68
PM
T-A
PM
2757
338
8.33
27
4992
1 74
17
16.9
1 –
8.33
63
638
PM
T-PS
C(S
M3)
18
2939
1 10
.87
1657
640
1717
51
16.9
1 –
10.8
7 10
3737
6
R-L
NG
(SM
3)
2302
8577
16
.91
3135
048
--
--
--
Sep
3369
0 44
04
LP A
PM (S
M3)
37
6840
6 7.
98
3521
797
2466
09
10.3
0 –
7.98
57
2133
RIL
(GSP
L)
3169
49
10.3
0 31
6949
--
--
--
O
ct
3481
3 28
250
LP A
PM (S
M3)
38
7820
9 8.
44
3875
906
2303
19
.52
– 8.
44
2551
7
PMT-
APM
26
6007
3 8.
76
2627
628
3244
5 19
.52
– 8.
76
3491
08
PM
T-PS
C(S
M3)
17
4047
5 11
.85
1628
425
1120
50
19.5
2 –
11.8
5 85
9424
R-L
NG
(SM
3)
2081
0838
19
.52
7239
947
--
--
--
Feb
3256
7 32
855
LP A
PM (S
M3)
31
8338
7 8.
66
3179
344
4043
21
.24
– 8.
66
5086
1
ON
GC
Non
-A
PM(S
M3)
42
9600
0 16
.32
4128
268
1677
32
21.2
4 –
16.3
2 82
5241
R
-LN
G(S
M3)
14
3408
16
21.2
4 21
2627
3 --
--
--
M
ar
3481
3 30
471
LP A
PM (S
M3)
48
6070
2 8.
69
4394
031
4666
71
22.1
3 –
8.69
62
7205
8
PMT-
APM
(SM
3)
2518
085
9.11
24
6575
5 52
330
22.1
3 –
9.11
68
1337
PMT-
PSC
16
9729
8 12
.35
1419
848
8277
0 22
.13
– 12
.35
8094
90
1946
80
16.0
0 –
12.3
5 71
0582
ON
GC
Non
-A
PM(S
M3)
42
0800
0 16
.00
1926
783
--
--
--
R
-LN
G(S
M3)
15
8601
88
22.1
3 60
1771
--
--
--
Tot
al (a
) `
93
4956
9

Repo
rt N
o. 6
of 2
015
94
Ann
exur
e 25
(b) (
Ref
erre
d to
in P
ara
5.4)
Fr
om A
pril
2012
to M
arch
201
3 M
onth
C
apac
ity
of U
rea
(MT
)
Prod
uctio
n (M
T)
Feed
stoc
k A
vaila
bilit
y Pr
ice
Con
sum
ptio
n U
nder
C
onsu
mpt
ion
SCM
(c
ol.5
-col
.7)
Diff
eren
ce in
ra
te
Ext
ra
cost
on
feed
stoc
k (`
)
(MT
) or
(Scm
) (`
)/ U
nit
(MT
) or
(SC
M)
1 2
3 4
5 6
7 8
9 10
(col
8
X c
ol 9
) A
pril
3369
0 29
859
LP A
PM (S
M3)
38
0666
7 8.
97
3802
875
3792
23
.57
– 8.
97
5536
3
ON
GC
Non
-APM
46
0700
0 16
.29
3880
174
7268
26
23.5
7 –
16.2
9 52
9129
3
R-L
NG
(SM
3)
1372
5590
23
.57
1325
900
--
--
--
May
34
813
3057
4 LP
APM
(SM
3)
3876
733
9.12
38
7209
4 46
39
25.6
9 –
9.12
76
868
O
NG
C N
on-A
PM
5438
000
16.5
9 48
6422
1 57
3779
25
.69
– 16
.59
5221
389
R
-LN
G(S
M3)
14
6684
79
25.6
9 24
7909
5 --
--
--
Se
pt
3369
0 24
672
HP
APM
(SM
3)
1405
0000
10
.07
1391
4532
13
5468
27
.35
– 10
.07
2340
887
LP
APM
(SM
3)
4085
299
9.54
40
7928
1 60
18
27.3
5 –
9.54
10
7181
PMT-
APM
(SM
3)
2109
242
10.0
7 19
6552
7 14
3715
27
.35
– 10
.07
2483
395
PM
T-PS
C(S
M3)
13
8526
1 12
.96
1290
818
9444
3 27
.35
– 12
.96
1359
035
O
NG
C N
on-A
PM
5553
000
13.5
5 36
4395
5 14
2293
27
.35
– 13
.55
1963
643
R
-LN
G(S
M3)
13
9454
55
27.3
5 52
1937
--
--
--
O
ct
3481
3 30
021
LP A
PM (S
M3)
32
9212
8 9.
44
3289
625
2503
27
.27
– 9.
44
4462
8
ON
GC
Non
-A
PM(S
M3)
62
0000
0 13
.35
6127
237
7276
3 27
.27
– 13
.35
1012
861
R
-LN
G(S
M3)
15
7244
08
27.2
7 13
6506
3 --
--
--
Fe
b 31
444
2648
6 LP
APM
(SM
3)
3257
866
9.28
32
5557
5 22
91
29.5
6 –
9.28
46
461
O
NG
C N
on-A
PM
5411
000
13.3
52
2789
2 18
3108
29
.56
– 9.
28
2977
336
R
-LN
G(S
M3)
13
7268
68
29.5
6 49
3514
8 --
--
--
Tot
al (b
) `
2298
0340
Tot
al (a
+ b
) `
3232
9909
` in
cro
re
3.23
lim
ited
to 5
2193
7 ut
ilise
d at
the
high
est r
ate
of 2
7.35

Repo
rt N
o. 6
of 2
015
95
Ann
exur
e-26
(Ref
erre
d to
in P
ara
5.5)
Stat
emen
t sho
win
g m
arke
ting
mar
gin
paid
to th
e C
ontr
acto
r in
exc
ess o
f mar
ketin
g m
argi
n al
low
ed to
GA
IL
Yea
r N
G in
m
mbt
u/
msc
m
Mar
ketin
g m
argi
n pa
yabl
e to
co
ntra
ctor
/ mm
btu
Ave
rage
K
G D
6 ga
s su
pplie
d (m
scm
)
Mar
ketin
g m
argi
n ch
arge
d /m
scm
USD
ex
chan
ge
rate
in `
Mar
ketin
g m
argi
n ch
arge
d fo
r K
G D
6 ga
s Pe
r m
scm
Subs
idy
impa
ct o
n K
G D
6 ga
s
Mar
ketin
g m
argi
n if
rate
allo
wed
to
GA
IL is
ch
arge
d
(`/m
scm
)
Exc
ess
Mar
ketin
g m
argi
n ov
er
& a
bove
the
rate
ap
plic
able
to
GA
IL
(`
/msc
m)
1 2
3 4
5 6
7
(C
ol. 5
X C
ol. 6
) 8
9
`
200
X (C
ol. 4
) 10
(Col
. 8 -
Col
. 9)
(Col
. 2 X
Col
. 3)
(Col
. 4 X
Col
. 7)
m
mbt
u (1
000
scm
/25.
2*)
USD
(1
5 m
msc
md
X
365
days
)/ 1
000)
USD
`
` `
in la
kh
(` 2
00 X
m
scm
) `in
la
kh
` in
lakh
2009
-10
39.6
825
0.13
5 50
1875
0
5.36
47
.42
254.
17
12,7
56.1
6 10
,037
.50
2,71
8.66
20
10-1
1 39
.682
5 0.
135
5475
000
5.36
45
.58
244.
31
13,3
75.9
7 10
,950
.00
2,42
5.97
20
11-1
2 39
.682
5 0.
135
5475
000
5.36
47
.92
256.
85
14,0
62.5
4 10
,950
.00
3,11
2.54
20
12-1
3 39
.682
5 0.
135
5475
000
5.36
54
.39
291.
53
15,9
61.2
7 10
,950
.00
5,01
1.27
20
13-1
4 39
.682
5 0.
135
5475
000
5.36
60
.73
325.
51
17,8
21.6
7 10
,950
.00
6,87
1.67
T
otal
20,1
40.1
1
Say
` 2
01.4
0 cr
ore
*25.
2 sc
m e
qual
s to
one
mm
btu
less
than
365
day
s


Report No. 6 of 2015
97
Glossary
Bi-Directional Pipeline
Gas pipelines wherein gas can transmit from both ends of the pipeline. Depending on where gas is removed and where the Compressors create pressure differential gas may flow in either direction.
Captive Consumption
Captive Consumption means the consumption of goods/power manufactured/generated by same organization or related undertaking for manufacturing another product.
CGD Network City Gas Distribution Network means an interconnected network of gas pipelines for transporting NG to the service pipes supplying NG to domestic, industrial or commercial premises and CNG stations.
Common Carrier capacity
Under common carrier system, designed capacity of NG pipeline, over and above the entity’s own requirement and capacity allocated on a contract carrier basis, shall be available to third party on non-discriminatory basis.
Contract Carrier capacity
Under contract carrier system, capacity of NG pipeline, over and above the entity’s own requirements, is available to any other entity subject to the latter entering into a firm contract for transportation of a volume of NG for a period of minimum one year, on such other terms and conditions as may be mutually agreed.
Downstream Sector Downstream sector involves the actual processing, selling and distribution of NG and oil based products.
Fallback Basis Fallback basis allocation of NG by Government of India to optimally use the temporary available surplus gas.
Feedstock A feedstock is a material that can be used directly as a fuel, or converted to another form of fuel or energy product.
Floating Storage and Re-gasification Unit
(FSRU)
Floating storage and re-gasification unit is an onboard system providing basic functions like receipt, storage, pressurization and re-gasification of liquefied NG, metering and send out of gas into onshore gas pipeline grid. FSRU are easier to implement, cheaper to build with fewer onshore planning procedure issues, more flexible location with relocation advantage.
Gas field Within the contract area, a NG Reservoir/group of NG Reservoirs within a common geological structure.
Hydrocarbon Gases Hydrocarbons are derived from crude oil/NG like ethane, propane and NG liquids obtained from NG.
Hydrocarbons Organic chemical compounds of hydrogen and carbon atoms. There are a vast number of these compounds and they form the basis of all petroleum products. They may exist as gases, liquids or solids.

Report No. 6 of 2015
98
Isolated Gas Fields Small discoveries where production is small and fields are isolated and peak production is less than 0.1 mmscmd and they are situated more than 10 Km away from the gas grid.
Liquefied Petroleum Gas
Liquefied petroleum gas is a flammable mixture of hydrocarbon gases (composed of propane or butane) used as a fuel in heating appliances, cooking equipment and vehicles.
Liquid Fuel Liquid fuels are combustible or energy-generating molecules derived from fossil fuels.
LNG NG condensed at minus 160.5° C at normal pressure to liquid form is known as LNG and is typically transported by specialized tanker with insulated walls and received at terminals.
LNG Value Chain LNG supply chain consisting of four functions viz. NG exploration and production (E&P), liquefaction, shipping, receiving and distribution. E&P involves extraction of oil, NG from natural reservoirs. Liquefaction converts NG into liquid form through refrigeration processes at liquefaction plants reducing its volume, thus allowing for easy transportation to centers of demand. After liquefaction, LNG is loaded onto specifically designed ships built around insulated cargo tanks to keep the LNG in liquid state throughout the voyage. An LNG receiving terminal comprises LNG storage tanks and re-gasification facilities that convert LNG back to its gaseous state by the application of heat, also known as vapourisation. Thereafter it is send into the pipeline system, for distribution to end-users.
LNG Terminals An LNG receiving terminal comprises LNG storage tanks and re-gasification facilities that convert LNG back to its gaseous state by the application of heat, also known as vapourisation. Thereafter it is sent into the pipeline system, for distribution to end-users.
Low Off-Take Low off-take is contrary to an Off take agreement wherein a buyer enters in to agreement with seller for buying a certain contracted quantity of future production.
LSHS Low Sulphur Heavy Stock (LSHS) is a residual fuel processed from crude oil with advantage of having low sulphur content and high calorific value.
Market Related Price Market price is the economic price for which goods or services are offered in the marketplace and is not influenced/subsidized by government.
Naphtha Naphtha refers to a number of flammable liquid mixtures of hydrocarbons, i.e. a component of NG condensate or a distillation product from petroleum, coal tar, or peat boiling in a certain range and containing certain hydrocarbons. It is a broad term covering

Report No. 6 of 2015
99
among the lightest and most volatile fractions of the liquid hydrocarbons in petroleum.
NELP Blocks Award of oil/NG exploration blocks by GoI under different round of New Exploration and Licensing Policy based on international competitive bidding to any company either foreign, private or public sector company.
Nominated Fields Oil/gas exploration fields offered by GoI to National Oil Companies on nomination basis prior to implementation of New Exploration and licensing policy. The price of gas so produced from nominated fields are regulated and priced at APM price regime.
Non-APM gas NG priced at market rate or non-subsidized rate. Normative cost of
production Normative price working is based on estimation of cost at acceptable level of efficiency parameters having bearing on cost such as capacity, capacity utilization and production level, raw material consumption, energy consumption etc.
Petrochemicals Petrochemicals are hydrocarbons derived from crude oil and NG. Production Sharing
Contract The contract between Government and International/National Exploration and Production (E & P) Company. The E&P Company bears the cost of exploration, drilling and production. The E&P Company is reimbursed for expenditures from the sale of oil/gas. After reimbursement, the oil/gas proceed is split by an agreed formula.
Ras Gas RasGas Company Limited is a liquefied NG (LNG) producing company in Qatar.
Re-gasification Facilities
Re-gasification terminals/facilities are where the liquefied product is returned to the gaseous state after shipment by sea from the area of production and fed into transmission and distribution grids.
Spot LNG Spot Cargo is purchase in a short period of less than one year Stage III of new pricing scheme
New Pricing Scheme (NPS) Stage-III for urea introduced by GoI under New Urea Policy for the period October 2006 to March, 2010. NPS Stage-III seeks to promote the usage of NG, which is the most efficient and comparatively cheaper feedstock, for production of urea.
Statutorily Notified Selling Price
Statutorily notified selling price is generally lesser than the cost of production. The difference between the cost of production and the selling price is paid as subsidy/ concession to manufacturers.
Subsidy Subsidy is an economic benefit or financial aid provided by a government to support a desirable activity, regulated the end consumer price and maintains the income of producers of critical and strategic products. Basic objective of subsidy is to reduce market price of an item below its cost of production.

Report No. 6 of 2015
100
Take or Pay A take-or-pay contract is a rule structuring negotiations between companies and their suppliers. With this kind of contract, the company either takes the product from the supplier or pays the supplier a penalty.
Transmission Infrastructure
NG Transmission Infrastructure connects various gas sources to different gas markets/demand of various Power, Fertilizer, CGD and other industries and include pipeline, compressor station etc.
Upstream Sector The upstream petroleum sector includes all petroleum exploration and extraction activities such as exploration, development and processing of crude oil and NG.
Wheeling Arrangement
Wheeling is the transportation of electric power over transmission lines. Under a wheeling arrangement power is transmitted through Licensee’s distribution system and associated facilities.

Report No. 6 of 2015
101
Abbreviations AFL Andhra Fuels Limited
AGCL Assam Gas Company Limited APGDCL Andhra Pradesh Gas Distribution Corporation Limited APGPCL Andhra Pradesh Gas Power Corporation Limited
APM Administered Price Mechanism APPCC Andhra Pradesh Power Coordination Committee APSEB Andhra Pradesh State Electricity Board BCM Billion Cubic Meter BG Bank Guarantee BoD Board of Directors
BPCL Bharat Petroleum Corporation Limited BVFCL Brahmaputra Valley Fertilizer Corporation Limited CCGT Combined Cycle Gas Turbine CEA Central Electricity Authority
CESC Calcutta Electric Supply Corporation CFCL Chambal Fertilizer and Chemical Limited CGD City Gas Distribution DIL Duncan Industries Limited DoF Department of Fertilizers DPL Durgapur Project Limited
DVPL Dahej-Vijaipur Pipeline Limited EGoM Empowered Group of Ministers
EoI Expression of Interest EWPL East West Pipeline FACT Fertilizer And Chemicals Travancore Limited FAI Fertilizer Association of India FCI Fertilizers Corporation of India FDI Foreign Direct Investment
FICC Fertilizer Industry Coordination Committee FIPB Foreign Investment Promotion Board FO Fuel Oil
GAIL Gas Authority of India Limited GDR/ADR Global Depository Receipt/American Depository Receipts
GLC Gas Linkage Committee GNVFCL Gujarat Narmada Valley Fertilizers & Chemicals Limited
GoI Government of India GoM Group of Ministers GSFC Gujarat State Fertilizer Corporation GSPA Gas Sales Purchase Agreement GSPC Gujarat State Petroleum Corporation GSPL Gujarat State Petronet Limited GSTA Gas Sales and Transmission Agreement

Report No. 6 of 2015
102
HFCL Hindustan Fertilizer Corporation limited HPCL Hindustan Petroleum Corporation Limited HSD High Speed Diesel HVJ Hazira-Vijaipur-Jagdishpur Pipeline
HVJ-GREP Hazira-Vijaipur-Jagdishpur Pipeline-Gas Rehabilitation Expansion Project
IFFCO Indian Farmers Fertiliser Cooperative Limited IGFL Indo Gulf Fertilisers Limited IOC Indian Oil Corporation Limited IPI Proposed Tri-national natural gas pipeline of Iran-Pakistan-India
JVCs Joint Venture Companies KCL/SCM Kilo Calories per Standard Cubic Meter KG Basin Krishna Godavari Basin
KG D6 Krishna Godavari D6 gas block KRIBHCO Krishak Bharati Cooperative Limited
KSFL KRIBHCO Shyam Co-operative Fertilizers Limited Kwh Kilo Watt Hour LMT Lakh Metric Tonne
LMTPA Lakh Metric Tonne Per Annum LNG Liquefied Natural Gas LPG Liquefied Petroleum Gas LSHS Low Sulphur Heavy Stock
MBI pipeline Proposed Tri-National Natural Gas Pipeline of Myanmar-Bangladesh-India
MCFL Mangalore Chemicals and Fertilizers Limited MFL Madras Fertilizers Limited
MMBTU Million Metric British Thermal Unit MMSCMD Million Metric Standard Cubic Meter per day MMTPA Million Metric Tonne Per Annum
MoCF Ministry of Chemicals & Fertilizers MoP Ministry of Power
MoPNG Ministry of Petroleum and Natural Gas MoU Memorandum of Understanding
MSCM Million Standard Cubic Meter MW Mega Watt NLC Neyveli Lignite Corporation Limited
NELP New Exploration and Licensing Policy NEP National Electricity Policy
NFCL Nagarjuna Fertilizers and Chemicals Limited NFL National Fertilizers Limited NG Natural Gas
NGG National Gas Grid NOCs National Oil Companies

Report No. 6 of 2015
103
NTPC National Thermal Power Corporation OGL Open General License OIL Oil India Limited
ONGC Oil and Natural Gas Corporation Limited PLF Plant Load Factor PLL Petronet LNG Limited
PMP Act Petroleum and Minerals Pipeline Act, 1962 PMT Panna-Mukta-Tapti gas field
PNGRB Petroleum and Natural Gas Regulatory Board PPA Power Purchase Agreement PPP Public Private Partnership PSC Production Sharing Contract PSU Public Sector Undertaking RCF Rashtriya Chemical and Fertilizers Limited Relog Relogistics Infrastructure Limited, a subsidiary of RGTIL RGPL Reliance Gas Pipeline Limited
RGPPL Ratnagiri Gas and Power Private Limited RGTIL Reliance Gas Transmission Infrastructure Limited
RIL Reliance Industries Limited R-LNG Re-gasified Liquefied Natural Gas
RoU Right of Usage RoW Right of Way SAIL Steel Authority of India Limited SCM Standard Cubic Meter SPIC Southern Petrochemicals Industries Limited TAPI Transnational gas pipeline envisaged passing through four countries
Turkmenistan-Afghanistan-Pakistan-India TCL Tata Chemicals Limited TCM Trillion Cubic Meter TMT Thousand Metric Tonne USD US Dollar
WBPDC West Bengal Power Development Corporation Limited