
Performance and safety of rooftop wind turbines: Use of...
10
Performance and safety of rooftop wind turbines: Use of CFD to gain insight into inflow conditions Amir Bashirzadeh Tabrizi a, * , Jonathan Whale a , Thomas Lyons b , Tania Urmee a a Physics and Energy Studies, School of Engineering and InformationTechnology, Murdoch University, 90 South Street, Murdoch, Perth, WA 6150, Australia b Environmental Science, School of Veterinary and Life Sciences, Murdoch University, Perth, WA 6150, Australia article info Article history: Received 10 October 2013 Accepted 14 November 2013 Available online 8 December 2013 Keywords: Small wind turbines Built environment CFD Wind atlas software abstract The installation of small and medium-size wind turbines on the rooftops of high buildings has been often suggested by architects and project developers as a potential solution for achieving sustainable energy in building design. In such locations, however, because of the presence of buildings and other adjacent obstructions, wind is normally turbulent, unstable and weak, in terms of direction and speed. The use of wind turbines in the built environment poses challenges to overcome, including energy yield reduction due to lower mean wind speeds in urban areas, and environmental impacts because of their close vicinity to people and property. There is a need to understand the inflow wind conditions for a small wind turbine in the built- environment. A resource assessment of the potential wind turbine site in the built environment can determine the wind characteristics including zones of wind acceleration, recirculation, blocking and channelling. This knowledge is crucial for input into the design process of a small wind turbine to accurately predict blade fatigue loads and ensure that it operates safely, and performs optimally in the environment. Computational Fluid Dynamics (CFD) is a useful method to model wind flows in order to perform a resource assessment for the application of small wind turbines in a manner that requires less time and investment than a measurement campaign. This paper presents the results of research using a CFD code to model wind flows over the roof of a building and assesses the possibility of combining a CFD package with wind atlas software to form a wind energy resource assessment tool for the application of small wind turbines on the roof of a building. Experimentation with the model shows that the results are particularly sensitive to building height and shape, roof shape, wind direction, and turbine installation height and location. The results will be used to help develop a recommended practice of wind resource assessment in the built environment, in an international collaborative effort via the International Energy Agency Task 27. Ó 2013 Elsevier Ltd. All rights reserved. 1. Introduction A growing public awareness of the rising level of greenhouse gas emissions, the need to tackle fuel security and achieve reductions in emissions, has resulted in significant efforts to adopt renewable energy technologies in suburban environments [1e3]. These efforts aim to reduce the energetic demand of urban centres, and small- size renewable energy systems represent an interesting solution for sustainable (and reduced) energy in new building design [4]. The integration of wind turbines into the built environment poses challenges due to the low energy yield resulting from low mean wind speeds in urban areas as well as environmental impacts [5]. There have been some very public failures of small wind turbines in the built environment, notably in situations where the turbines have been mounted on top of the buildings [6e8]. Despite these problems, local governments and businesses continue to install SWTs on their rooftops as a dynamic, visible sign of support for renewable energy. It is thus vital to make the installations safe and to optimise performance to avoid them becoming bad advertise- ments for wind energy and renewable energy in general. To accomplish this, it is important to know the inflow wind conditions for SWTs in urban areas. Due to the existence of obstacles with different shapes, high roughness lengths of the terrain and obstacles’ interference to wind flow, wind conditions in urban locations are very complex and the * Corresponding author. Tel.: þ61 893606713. E-mail addresses: [email protected], [email protected] (A.B. Tabrizi). Contents lists available at ScienceDirect Renewable Energy journal homepage: www.elsevier.com/locate/renene 0960-1481/$ e see front matter Ó 2013 Elsevier Ltd. All rights reserved. http://dx.doi.org/10.1016/j.renene.2013.11.033 Renewable Energy 67 (2014) 242e251
Transcript of Performance and safety of rooftop wind turbines: Use of...
lable at ScienceDirect
Renewable Energy 67 (2014) 242e251
Contents lists avai
Renewable Energy
journal homepage: www.elsevier .com/locate/renene
Performance and safety of rooftop wind turbines: Use of CFD to gaininsight into inflow conditions
Amir Bashirzadeh Tabrizi a,*, Jonathan Whale a, Thomas Lyons b, Tania Urmee a
a Physics and Energy Studies, School of Engineering and Information Technology, Murdoch University, 90 South Street, Murdoch, Perth, WA 6150, Australiab Environmental Science, School of Veterinary and Life Sciences, Murdoch University, Perth, WA 6150, Australia
a r t i c l e i n f o
Article history:Received 10 October 2013Accepted 14 November 2013Available online 8 December 2013
Keywords:Small wind turbinesBuilt environmentCFDWind atlas software
* Corresponding author. Tel.: þ61 893606713.E-mail addresses: [email protected], bas
(A.B. Tabrizi).
0960-1481/$ e see front matter � 2013 Elsevier Ltd.http://dx.doi.org/10.1016/j.renene.2013.11.033
a b s t r a c t
The installation of small and medium-size wind turbines on the rooftops of high buildings has been oftensuggested by architects and project developers as a potential solution for achieving sustainable energy inbuilding design. In such locations, however, because of the presence of buildings and other adjacentobstructions, wind is normally turbulent, unstable and weak, in terms of direction and speed. The use ofwind turbines in the built environment poses challenges to overcome, including energy yield reductiondue to lower mean wind speeds in urban areas, and environmental impacts because of their close vicinityto people and property.
There is a need to understand the inflow wind conditions for a small wind turbine in the built-environment. A resource assessment of the potential wind turbine site in the built environment candetermine the wind characteristics including zones of wind acceleration, recirculation, blocking andchannelling. This knowledge is crucial for input into the design process of a small wind turbine toaccurately predict blade fatigue loads and ensure that it operates safely, and performs optimally in theenvironment.
Computational Fluid Dynamics (CFD) is a useful method to model wind flows in order to perform aresource assessment for the application of small wind turbines in a manner that requires less time andinvestment than a measurement campaign. This paper presents the results of research using a CFD codeto model wind flows over the roof of a building and assesses the possibility of combining a CFD packagewith wind atlas software to form a wind energy resource assessment tool for the application of smallwind turbines on the roof of a building. Experimentation with the model shows that the results areparticularly sensitive to building height and shape, roof shape, wind direction, and turbine installationheight and location. The results will be used to help develop a recommended practice of wind resourceassessment in the built environment, in an international collaborative effort via the International EnergyAgency Task 27.
� 2013 Elsevier Ltd. All rights reserved.
1. Introduction
A growing public awareness of the rising level of greenhouse gasemissions, the need to tackle fuel security and achieve reductions inemissions, has resulted in significant efforts to adopt renewableenergy technologies in suburban environments [1e3]. These effortsaim to reduce the energetic demand of urban centres, and small-size renewable energy systems represent an interesting solutionfor sustainable (and reduced) energy in new building design [4].The integration of wind turbines into the built environment poses
All rights reserved.
challenges due to the low energy yield resulting from low meanwind speeds in urban areas as well as environmental impacts [5].There have been some very public failures of small wind turbines inthe built environment, notably in situations where the turbineshave been mounted on top of the buildings [6e8]. Despite theseproblems, local governments and businesses continue to installSWTs on their rooftops as a dynamic, visible sign of support forrenewable energy. It is thus vital to make the installations safe andto optimise performance to avoid them becoming bad advertise-ments for wind energy and renewable energy in general. Toaccomplish this, it is important to know the inflowwind conditionsfor SWTs in urban areas.
Due to the existence of obstacles with different shapes, highroughness lengths of the terrain and obstacles’ interference towindflow, wind conditions in urban locations are very complex and the
A.B. Tabrizi et al. / Renewable Energy 67 (2014) 242e251 243
adaptability of wind turbines to this environment is not yet testedboth in terms of real power production and of structural compati-bility with the buildings. As a result, the wind profile in urban lo-cations is quite different from the classical log-law based profileused in open terrain [9]. At the open terrain sites of large windturbines, performing comprehensive wind resource assessmentsyields knowledge about the characteristics of the lower part of theatmosphere as well as parameters like annual and seasonal averagewind speed and turbulence characteristics. Turbulence is animportant parameter to factor into wind turbine design as it causescyclic loading on the blades and can lead to blade fatigue. Incomparison, small-scale wind turbines are often located in morecomplex environments where the turbulence levels are higher andwind speeds are lower [10]. In understanding the inflow to a smallwind turbine in the built-environment a resource assessment of thepotential wind site can be used to determine the wind character-istics, including turbulence levels that the small wind turbine willhave to experience. Recent research by the International EnergyAgency (IEA) Wind RD&D Task 27, a vehicle for SWT research, hasindicated that the turbulence design thresholds in the current in-ternational standard for SWTs, IEC61400-2 (ed. 3) are too low forSWTs in urban wind sites, and a better characterisation of turbu-lence is required for these kind of highly turbulent sites [11].
Wind resource assessments for utility-scale wind projectstypically involve lengthy and costly measurement campaigns. Forsmall wind turbines application particularly rooftop applications,conventional site assessment methods are not always useful due tothe small-scale of the projects. Firstly, compared to utility-scale orcommunity-scale wind projects, small-scale urban rooftop projectsdo not typically have access to large amounts of fiscal resources forthe resource assessment phase of a project and thus investment inmeasurement equipment usually is limited. In addition, for urbanenvironments, the traditional methods for wind energy siteassessment are technically limited; the complex geometry canresult to the situation where the resource varies substantiallywithin a small area, thus a meteorological mast installed at a singlelocation may not be a sufficiently good indicator of the overallresource within a complex environment. Further, remote sensingtechnologies such as LiDAR are typically designed to work at 40 mor above and many small-scale urban rooftop projects are designedfor deployment at lower heights. Computational Fluid Dynamics(CFD) techniques can be a reliable alternative for less expensive andfaster resource assessments of rooftop small wind turbine appli-cations, and additionally provide physical insight to the governingflow mechanisms. Already, for modelling wind flows over complexrural terrains, modern CFD tools have proved essential [12].
Ledo et al. present a numerical study of wind flow above the roofin three suburban landscapes specified by houses with threedifferent roof shapes; pitched, pyramidal and flat. They used a CFDtechnique to simulate the wind flow in such environments and tofind the optimum turbine mounting locations. Their results showthat the wind flow characteristics are strongly dependent on theshape of the roofs, with turbines mounted on flat roofs likely togenerate higher and more reliable power for the same turbine hubelevation than the other roof profiles [2]. Heath,Walshe andWatsonused CFD to model the flow characteristics within an urban areaover an array of pitched-roof houses. They studied mean windspeeds at potential turbine mounting points and identified opti-mum mounting points for different prevailing wind directions. Inaddition they proposed a methodology for estimating the energyyield of a building-mounted turbine from simple information suchas wind atlas wind speed data and building density. The results ofthe research show that the energy yield is very low when the tur-bine is installed below rooftop height [13]. Kalmikov and his team atMassachusetts Institute of Technology (MIT) used CFD simulations
to assess the wind energy potential on the MIT campus in Cam-bridge, MA. They incorporated wind measurements and observa-tions from some local reference sites into the CFD model in order toestimate the local long-term climatology. Comparisons of mea-surements and simulated results provided validation of themodelling for mean wind speed, wind power density and windvariability, parameterised by a Weibull distribution. Their workresulted in a better understanding of the micro-climate of the windresource on the MIT campus and addressed the optimal siting of asmall turbine on campus [12]. Finally, it must be noted that CFD hasbeen used by several researchers to evaluate the performance of H-Darrieus small wind turbines on rooftops [9,14,15].
The ANSYS CFX 14 CFD software package [16] is used in thisresearch to model wind flows over a building and is validated usingsecondary data from the CEDVAL wind tunnel datasets fromHamburg University. The CFD model of Bunning Group Ltd’swarehouse at Port Kennedy in Western Australia was developedusing the wind atlas software WAsP [17] to predict the wind ve-locities at the domain inlet. The research is novel as the CFD sim-ulations are carried out on a building (the Bunnings warehouse)where there is an existing measurement system in place, allowingdirect comparison between measurements and the model output.The research is also timely as it forms part of the current IEA Task 27program of work that is developing a Recommended Practice formicro-siting SWTs in the built environment [18]. The long-termresearch plan is to use this Recommended Practice in order toupdate the design classifications in the current IEC61400-2 stan-dard to include a class for SWTs intended for use in highly turbulentsites such as in the built environment.
2. Aim and objectives
The aim of this study is to gain an insight into the wind condi-tions for a SWT in the highly turbulent setting of the rooftop of alarge building in order to provide guidance in micro-siting windturbines. The specific objectives to achieve this aim are:
(1) Assess the combination of the CFD package CFX with thewind atlas software WAsP as a wind energy resourceassessment tool for the application of small rooftop windturbines in built environment.
(2) To use the combination of CFX and WAsP to investigate theeffects of complex urban topography on the local microme-teorological features of the wind flow via identification ofzones of wind acceleration, recirculation and blockage. Anunderstanding of the location and extent of these zones onthe rooftop is important in the installation of a small windturbine to maximise energy production and protect themachine from excessive loading due to gusts
In terms of scope, this paper does not cover the investigation ofavailable wind power or turbulence kinetic energy of the windflows on the rooftop.
3. Methodology
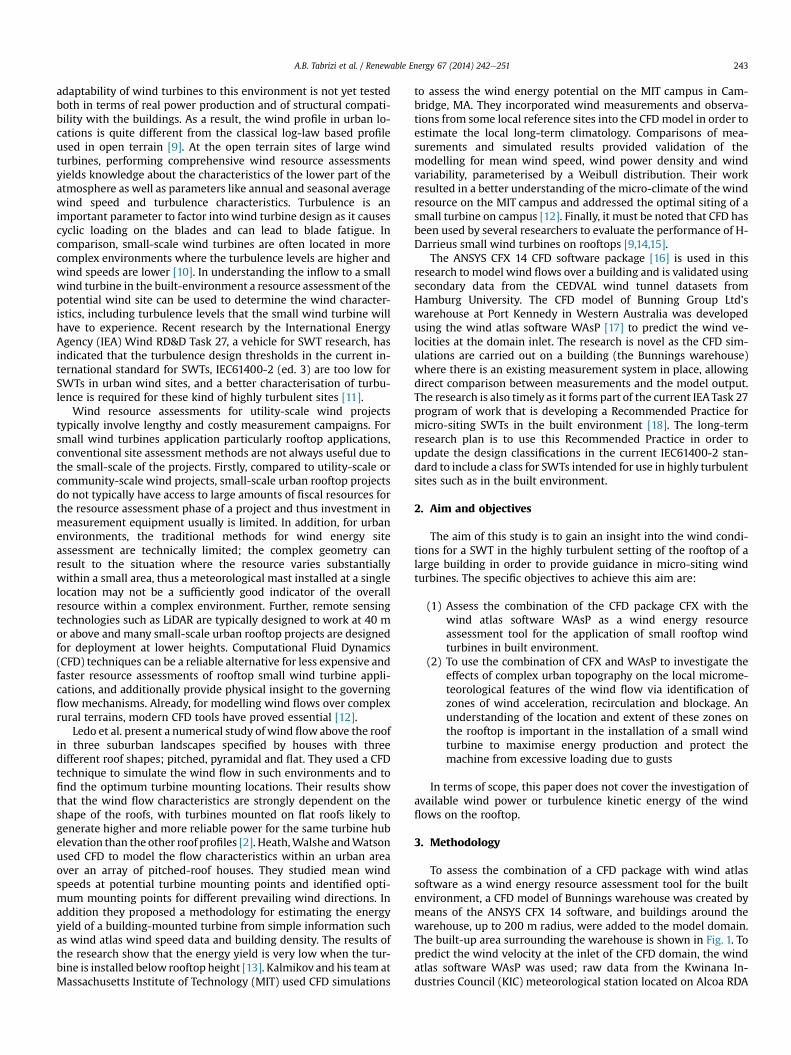
To assess the combination of a CFD package with wind atlassoftware as a wind energy resource assessment tool for the builtenvironment, a CFD model of Bunnings warehouse was created bymeans of the ANSYS CFX 14 software, and buildings around thewarehouse, up to 200 m radius, were added to the model domain.The built-up area surrounding the warehouse is shown in Fig. 1. Topredict the wind velocity at the inlet of the CFD domain, the windatlas software WAsP was used; raw data from the Kwinana In-dustries Council (KIC) meteorological station located on Alcoa RDA
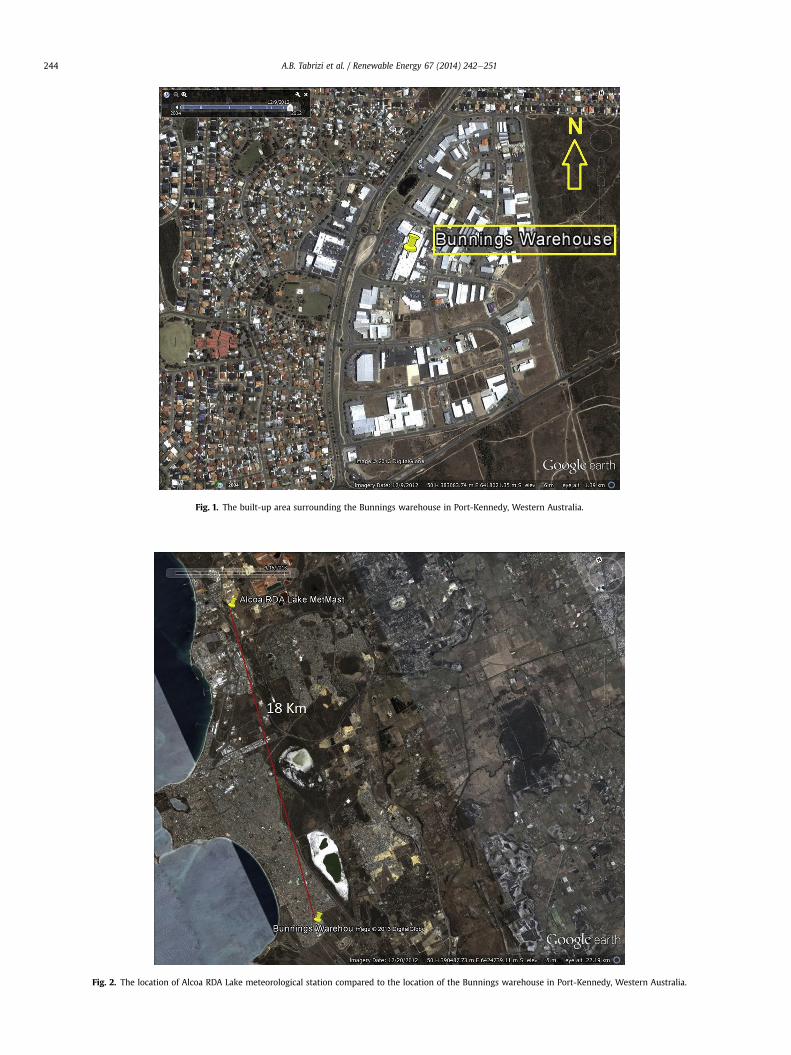
Fig. 1. The built-up area surrounding the Bunnings warehouse in Port-Kennedy, Western Australia.
Fig. 2. The location of Alcoa RDA Lake meteorological station compared to the location of the Bunnings warehouse in Port-Kennedy, Western Australia.
A.B. Tabrizi et al. / Renewable Energy 67 (2014) 242e251244

Fig. 3. Position of the ultrasonic anemometer on the roof of the Bunnings warehousein Port-Kennedy, Western Australia.
A.B. Tabrizi et al. / Renewable Energy 67 (2014) 242e251 245
Lake A, recorded between 12/08/2011 and 24/01/2012 were used aswind observations in WAsP. Fig. 2 shows the location of the mete-orological station compared to the location of the Bunnings ware-house. WAsP was used to generate a regional wind atlas for eightwind direction sectors N, NE, E, SE, S, SWandWat 200 m above theground. At 200m above the ground thewind characteristic for eachsector is not affected by surface structures, and was used to predictthe site-independent vertical wind profile for the region. This pro-file was then used as the inlet velocity profile at the outer boundaryof the CFD model domain and the model was run for each sector tofind themeanwind velocities on the roof of thewarehouse. To allowfor comparison the CFD results were extracted for the same periodas the KIC measurements and ultrasonic measurements of windflow on the roof of the Bunnings warehouse (12/08/2011 to 24/01/2012). ANSYS CFX assumes neutral atmospheric stability and thusthe CFD results have been comparedwith neutrally stablemeasuredwind data as well as with the whole set of measured data for theperiod to check the accuracy of using the combination of CFD andwind atlas software for rooftopwind resource assessment. To isolatethe neutrally stable data, the wind measurements above the Bun-nings rooftop were filtered by application of Golder’s curve of thePasquill stability classes as functions of MonineObukhov length,and roughness length [19]. The EuropeanWind Atlas was consultedand the aerodynamic roughness of area around the Bunningswarehouse was estimated to be 50 cm [20].
3.1. Site and measurement campaign
The warehouse is a rectangular building, with its long-axis ori-ented NNE-SSW, a façade wall around the edge of the roof with atop that is 8.4 m a.g.l, and a very low pitched roof (almost flat). Thebuilding is approximately 5 km from the coast (Indian Ocean) withthe prevailing winds from the south-west. The warehouse is situ-ated in a commercial estate but has no larger buildings or trees inthe vicinity. Within a 1 km radius of the site there are mainly res-idential buildings to the north, commercial and industrial buildingsto the east and a few buildings, low shrubs and low sand dunes tothe south and west. The south-west front and the north-west sideare comparatively open, though street furniture1 and a car parkexist on these sides [21].
A wind monitoring system was installed in September 2009 aspart of a wind resource assessment for the installation of five smallwind turbines that were later installed in March 2010. The GillWindMaster Pro 3D ultrasonic anemometer was installed on aboom on a 5.3 m tall mast attached to the front-façade of thewarehouse. The boom had a sliding collar in order to position theultrasonic anemometer at different heights above the roof. Themast could be tilted down in order to make adjustments or toreplace sensors. The data consists of 10 Hz data over a six-monthperiod (between 12/08/2011 and 24/01/2012). Fig. 3 indicates theposition of the ultrasonic anemometer on the roof.
3.2. Computational fluid dynamic model
3.2.1. NaviereStokes equations and turbulence modelsANSYS CFX 14 developed by ANSYS, Inc., USA was used to
perform the CFD simulations. Different methods such as DirectNumerical Simulation (DNS) [22], Large Eddy Simulation (LES)[23,24], or the Reynolds-averaged NaviereStokes (RANS) approachwith various turbulence models [25,26] have been applied in CFDsimulations. The required flow detail and the available computing
1 Objects and pieces of equipment installed on streets and roads for variouspurposes.
resources are two critical criteria for choosing the best method.Usually, it suffices to use the well-established RANS equationswhen only quasi-steady data is of interest, and that approach hasbeen taken in the present study [2].
For modelling wind flow over complex terrain, the Reynolds-averaged NaviereStokes approach (RANS) combined with a k-epsilon k� ε scheme as turbulence model, is the most commonapproach in wind engineering. The method provides a faircompromise between computational costs and accuracy. Reynoldsdecomposition is employed to the variables of the governingequations, whereby each variable is divided into a time-averagedpart and a fluctuating part, u ¼ uþ �u, resulting in the twofollowing equations:
r
vuivt
þujvuivxj
!¼ �vP
vxiþrgiþ
v
vxj
"m
vuivxj
þvujvxi
!#� v
vxjr�ui�uj (1)
vukvxk
¼ 0 (2)
The terms �ui�uj as the Reynolds stresses and physically representthe additional stresses due to the fluctuating components of theflow. These Reynolds stresses have been modelled according to a‘Boussinesq’ approximation, shown in Eq. (3), an analogy of New-ton’s friction law:
sij ¼ �r�ui�uj ¼ mt
�vuivxi
þ vujvxi
�þ 23rkdij (3)
where mt is the turbulent viscosity and k ¼ 1=2�ui�uj is the turbulentkinetic energy (TKE). The ‘standard’ k�epsilon ðk� εÞ model, basedon a two-equation turbulent energy scheme provides reasonableresults in approximately neutral atmospheric conditions, and pro-vides an acceptable estimate of the turbulence intensity throughthe turbulent kinetic energy term [27].In this study, there wasimproved convergence of the CFX results using the Shear StressTransport (SST) scheme. The SST scheme is a hybrid of two-equation models that combines the advantages of both k�epsilonðk� εÞ and k-omega ðk� uÞ models. The SST k� u equations are:

A.B. Tabrizi et al. / Renewable Energy 67 (2014) 242e251246
vrkþ v �rUjk
� ¼ v�mþ mt
�vk þ Pk � b0rkuþ Pkb (4)
vt vxj vxj
"sk3 vxj
#
vru
vtþ vru
vxj
�rUjk
� ¼ v
vxj
"�mþ mt
su3
�vu
vxj
#þ ð1� F1Þ2r
1usu2
vkvxj
vu
vxj
� a3u
kPk � b3ru
2 þ Pub
(5)
where F1 is a blending function, Pk is turbulence production due toviscous forces [kg/ms3], Pkb and Pwb are buoyancy production terms[kg/ms3], a is wind direction [�], b is a sheltering effect factor,su2and su3 are constants in the SST k�u is turbulence model and u isthe turbulent energy dissipation rate [1/s]. The SST k�u modelincorporates transport effects in the formulation of the eddy-viscosity terms and thus pays more attention to the transport ofturbulence kinetic energy, and predicts the starting and the size ofthe separation of flow under adverse pressure gradients moreaccurately than the standard ðk� εÞ model. This leads toimprovement of prediction of the flow separation, which isimportant in the present study [2].
3.2.2. Inlet wind profileThe velocity profile at the inlet boundary of the simulation
domain must be accurately modelled to provide valid results ofwind simulation in the built environment. The roughness of theground affects the profile of wind velocity, u, and therefore isnecessary to be part of velocity profile simulation. The followingequation is used to model the wind profile at the inlet of CFDdomain:
u ¼ u*kln�yþ z0z0
�(6)
where z0 is the ground roughness of the area, u* is the friction ve-locity, and k is von Karman’s constant and is equal to 0.4. Since allthe buildings within a radius of 200 m around the target buildinghave already been simulated in the CFD model, the groundroughness is set to 2 cm for all wind sector simulations. For eachsimulated sector, the mean wind speed at 200 m above the ground(the output of the WAsP simulations) was used to find the frictionvelocity for the CFD simulation. Table 1 shows the results of theWAsP simulations in terms of mean wind speed for each sector.
3.2.3. Computational meshAn unstructured tetrahedral mesh was used with five inflation
layers of 25 mm total thickness on the ground, roofs and walls of allbuildings. A cross-section of the mesh for the North wind sector isshown in Fig. 4. The final mesh statistics in the modelling of wind
Table 1WAsP output: sector-wise mean wind speeds at 200 m.
Wind sector Mean wind speed(m/s)
North 6.36North East 5.33East 8.01South East 7.57South 8.53South West 8.36West 6.19North West 6.18
flow from eight wind sectors are shown in Table 2. The domain ofthe CFX models for all simulated wind sectors was set up as arectangular domain surrounding the urban grid.
3.2.4. Boundary domain and boundary conditionsFor all wind sectors, the simulated buildings were placed in a
rectangular domain of height equal to 200 m and the lateralboundaries of the computational domain were placed at a distanceof 5Hmax away from the closest part of the built area at each side,where Hmax is the height of the highest simulated building in theregion of interest. A distance of 8Hmax between the inflow bound-ary and the built area was applied as the longitudinal extension ofthe domain in front of the simulated region, and 15Hmax behind thebuilt area was employed to allow for flow re-development.
The turbulence level at the inlet boundary was adjusted to 5% assuggested by CFX guidelines [16]. The downstream boundary wasspecified as an outlet with zero relative pressure and zero turbu-lence intensity gradients. Symmetric boundary conditions wereemployed for the side faces and top of the domain in all windsectors. Solid boundaries including the ground of the domain androofs and walls of the buildings have been set as no-slip walls withthe CFX wall-function approach used to model flow near thesesurfaces [28]. An automatic near-wall treatment method wasdeployed by CFX to treat the wall effects. The near-wall treatmentmethod accounts for the rapid variation of flow variables that occurwithin the boundary layer region as well as viscous effects at thewall. This treatment provided a smooth shift from low-Reynoldsnumber formulation to wall function formulation.
4. Test case: flow around a rectangular obstacle
A test case was performed to model the flow around a rectan-gular structure to assess the accuracy of CFX in simulating flowaround obstacles. The simulation results were then compared withthe well-known CEDVAL wind tunnel datasets from HamburgUniversity [29]. All data sets within the CEDVAL database have highquality and complete documentation of boundary conditions andapplication of quality assurance checks during measurements Therectangular structure from the CEDVAL wind tunnel tests has di-mensions of 125 mm height, 100 mm width and 150 mm length.The Reynolds number of themodel test is 37,250 and the roughnesslength of the model is 0.007 m. The friction velocity and the offsetheight of model boundary layer is 0.377 m/s and 0 m respectively.
Fig. 4. Cross-section of the mesh for the North wind sector modelling of the Bunningswarehouse in Port-Kennedy, Western Australia.
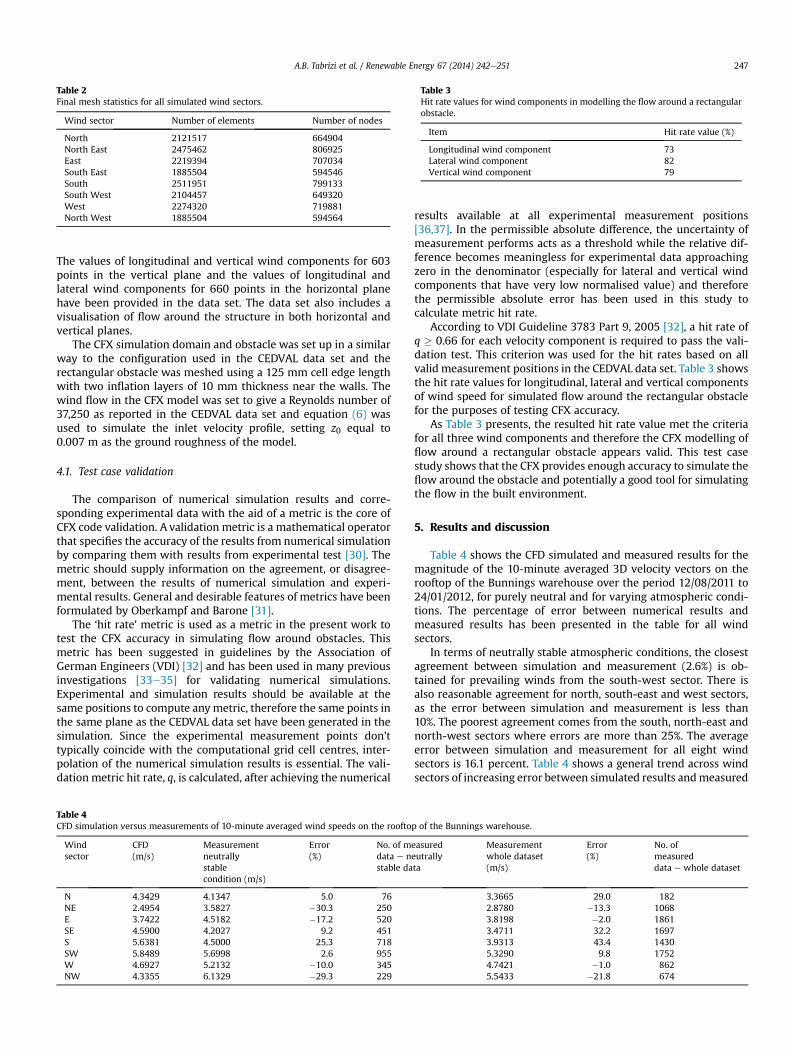
Table 2Final mesh statistics for all simulated wind sectors.
Wind sector Number of elements Number of nodes
North 2121517 664904North East 2475462 806925East 2219394 707034South East 1885504 594546South 2511951 799133South West 2104457 649320West 2274320 719881North West 1885504 594564
Table 3Hit rate values for wind components in modelling the flow around a rectangularobstacle.
Item Hit rate value (%)
Longitudinal wind component 73Lateral wind component 82Vertical wind component 79
A.B. Tabrizi et al. / Renewable Energy 67 (2014) 242e251 247
The values of longitudinal and vertical wind components for 603points in the vertical plane and the values of longitudinal andlateral wind components for 660 points in the horizontal planehave been provided in the data set. The data set also includes avisualisation of flow around the structure in both horizontal andvertical planes.
The CFX simulation domain and obstacle was set up in a similarway to the configuration used in the CEDVAL data set and therectangular obstacle was meshed using a 125 mm cell edge lengthwith two inflation layers of 10 mm thickness near the walls. Thewind flow in the CFX model was set to give a Reynolds number of37,250 as reported in the CEDVAL data set and equation (6) wasused to simulate the inlet velocity profile, setting z0 equal to0.007 m as the ground roughness of the model.
4.1. Test case validation
The comparison of numerical simulation results and corre-sponding experimental data with the aid of a metric is the core ofCFX code validation. A validation metric is a mathematical operatorthat specifies the accuracy of the results from numerical simulationby comparing them with results from experimental test [30]. Themetric should supply information on the agreement, or disagree-ment, between the results of numerical simulation and experi-mental results. General and desirable features of metrics have beenformulated by Oberkampf and Barone [31].
The ‘hit rate’ metric is used as a metric in the present work totest the CFX accuracy in simulating flow around obstacles. Thismetric has been suggested in guidelines by the Association ofGerman Engineers (VDI) [32] and has been used in many previousinvestigations [33e35] for validating numerical simulations.Experimental and simulation results should be available at thesame positions to compute anymetric, therefore the same points inthe same plane as the CEDVAL data set have been generated in thesimulation. Since the experimental measurement points don’ttypically coincide with the computational grid cell centres, inter-polation of the numerical simulation results is essential. The vali-dation metric hit rate, q, is calculated, after achieving the numerical
Table 4CFD simulation versus measurements of 10-minute averaged wind speeds on the roofto
Windsector
CFD(m/s)
Measurementneutrallystablecondition (m/s)
Error(%)
No. of mdata e nstable da
N 4.3429 4.1347 5.0 76NE 2.4954 3.5827 �30.3 250E 3.7422 4.5182 �17.2 520SE 4.5900 4.2027 9.2 451S 5.6381 4.5000 25.3 718SW 5.8489 5.6998 2.6 955W 4.6927 5.2132 �10.0 345NW 4.3355 6.1329 �29.3 229
results available at all experimental measurement positions[36,37]. In the permissible absolute difference, the uncertainty ofmeasurement performs acts as a threshold while the relative dif-ference becomes meaningless for experimental data approachingzero in the denominator (especially for lateral and vertical windcomponents that have very low normalised value) and thereforethe permissible absolute error has been used in this study tocalculate metric hit rate.
According to VDI Guideline 3783 Part 9, 2005 [32], a hit rate ofq � 0.66 for each velocity component is required to pass the vali-dation test. This criterion was used for the hit rates based on allvalid measurement positions in the CEDVAL data set. Table 3 showsthe hit rate values for longitudinal, lateral and vertical componentsof wind speed for simulated flow around the rectangular obstaclefor the purposes of testing CFX accuracy.
As Table 3 presents, the resulted hit rate value met the criteriafor all three wind components and therefore the CFX modelling offlow around a rectangular obstacle appears valid. This test casestudy shows that the CFX provides enough accuracy to simulate theflow around the obstacle and potentially a good tool for simulatingthe flow in the built environment.
5. Results and discussion
Table 4 shows the CFD simulated and measured results for themagnitude of the 10-minute averaged 3D velocity vectors on therooftop of the Bunnings warehouse over the period 12/08/2011 to24/01/2012, for purely neutral and for varying atmospheric condi-tions. The percentage of error between numerical results andmeasured results has been presented in the table for all windsectors.
In terms of neutrally stable atmospheric conditions, the closestagreement between simulation and measurement (2.6%) is ob-tained for prevailing winds from the south-west sector. There isalso reasonable agreement for north, south-east and west sectors,as the error between simulation and measurement is less than10%. The poorest agreement comes from the south, north-east andnorth-west sectors where errors are more than 25%. The averageerror between simulation and measurement for all eight windsectors is 16.1 percent. Table 4 shows a general trend across windsectors of increasing error between simulated results andmeasured
p of the Bunnings warehouse.
easuredeutrallyta
Measurementwhole dataset(m/s)
Error(%)
No. ofmeasureddata e whole dataset
3.3665 29.0 1822.8780 �13.3 10683.8198 �2.0 18613.4711 32.2 16973.9313 43.4 14305.3290 9.8 17524.7421 �1.0 8625.5433 �21.8 674

Fig. 5. a. Wind speed contours on the edge of the roof of the Bunnings warehouse forthe south-west wind sector simulation. b. Wind speed contours on the middle of theroof of the Bunnings warehouse for the south-west wind sector simulation.
A.B. Tabrizi et al. / Renewable Energy 67 (2014) 242e251248
data as the number of measured data points in a wind sector re-duces to e.g. less than 1000. The large error in the north-east sector,despite the relatively high number of measured data in this sector,may be due to the fact that the five small wind turbines installed onthe edge of the Bunnings warehouse roof were simulated as simplyfive masts in CFX, and in reality have more effect on the wind innorth-east sector. The discrepancy in results for north-west sectoris likely to be due to a combination of lack of measured data fromthat sector together with the effect of some high light towersaround the building that clearly cause some disturbance in thenorth-west sector not catered for in the CFD model. Finally, thesmall distance between the façade and the measurement mast forcases when the wind comes from the south may be the cause of thepoor agreement for the south sector simulation as there is notenough distance between the façade and themast in the CFDmodelto simulate flow re-development after the wind flow passes thefaçade before encountering the measurement mast.
In terms of comparison of the simulations with the whole set ofmeasured data (across all atmospheric stability classes) the mini-mum error is 1.0 percent for the west wind sector and the nu-merical results for the north-east, south-west and east sectors arereasonable with errors less than approximately 15%. For the north,south, north-west and south-east sectors, however, the simulationresults are poor with errors around 21% or greater. The averageerror for all wind sectors is 19.1 percent. As the values in Table 4show, the combination of WAsP and CFX predicts neutrally stableflows over the building reasonablywell, however the results are notgood enough to predict the flow across the whole range of atmo-spheric conditions; Table 5 provides meteorological conditionsdefining Pasquill turbulence types [38]. Table 5 clearly shows thatfor most cases at wind speeds greater than 4 m/s the atmosphericcondition is neutral. Since the wind speeds in the operating rangeof many small wind turbines would be above 4 m/s and thusdominated by neutrally stable atmospheric conditions, the findingsof this paper suggest that the assumption of neutral stability in theCFX software does not place a significant limitation in the appli-cation of the software, and the CFX/WAsP approach is a promisingtool to predict wind speeds above the rooftops of buildings in thebuilt environment. Some caution, however, needs to be usedespecially in the case of wind turbines with cut-in wind speedsbelow 4 m/s and in the case of strong-moderate daytime insolationlevels.
Figs. 5e7 show some examples of output from CFX for the caseof winds from the south-west sector, which is the prevailing winddirection at the site of the Bunnings warehouse. Fig. 5a and b showcontour plots of the magnitude of wind velocity on the long west-facing roof edge, where the turbines and ultrasonic anemometerare installed, and on themiddle of the roof in the longitudinal senseof the Bunnings warehouse building, respectively. Contour plots ofthe wind velocity vertical component for the long west-facing roof
Table 5Meteorological conditions defining Pasquill turbulence types [38].
Surfacewind-speed(m/s)
Daytime insolation Nighttime conditions
Strong Moderate Slight Thin overcastor �4/8 lowcloud
Cloudiness�3/8
<2 A AeB B e e
2e3 AeB B C E F3e4 B BeC C D E4e6 C C-D D D D>6 C D D D D
Notes: A, extremely unstable; B, moderately unstable; C, slightly unstable; D, neutral(applicable to heavy overcast day or night); E, slightly stable; F, moderately stable;(for AeB take average of values for A and B, etc.).
edge and on the middle of the roof in the longitudinal sense of thebuilding have been presented in Fig. 6a and b, respectively, andFig. 7a and b show vector plots of wind velocity on the long west-facing edge and on the middle of the roof in the longitudinal senseof the building. Comparison of Fig. 5a and b show that themagnitude of the wind velocity is slightly greater on the edge thanin the middle of the roof. More marked is the difference in verticalwind components at the edge of the building and the middle; thevertical components are much greater on the edge of the roof(Figs. 6a and 7a) and this is clearly visible in the contour plots ofvertical wind components (Fig. 6a and b) as well as the vector plotsof wind velocity (Fig. 7a and b). These figures have an importantconsequence for small horizontal-axis wind turbines (HAWTs) interms of efficiency since they are not designed to harness the ver-tical component of flow. Further, the vertical component of thewind velocity can have a significant effect on a HAWT in terms offatigue loads. Therefore, the ideal location for installation of a smallwind turbine, particularly a HAWT, should be in the middle of theroof of the Bunnings warehouse where the machine is likely toexperience lower fatigue loads due to vertical flow and will thushave a greater life time. Balduzzi et al. found that roofs with aninclination angle of 8� were optimal in inducing a speed-up of flow
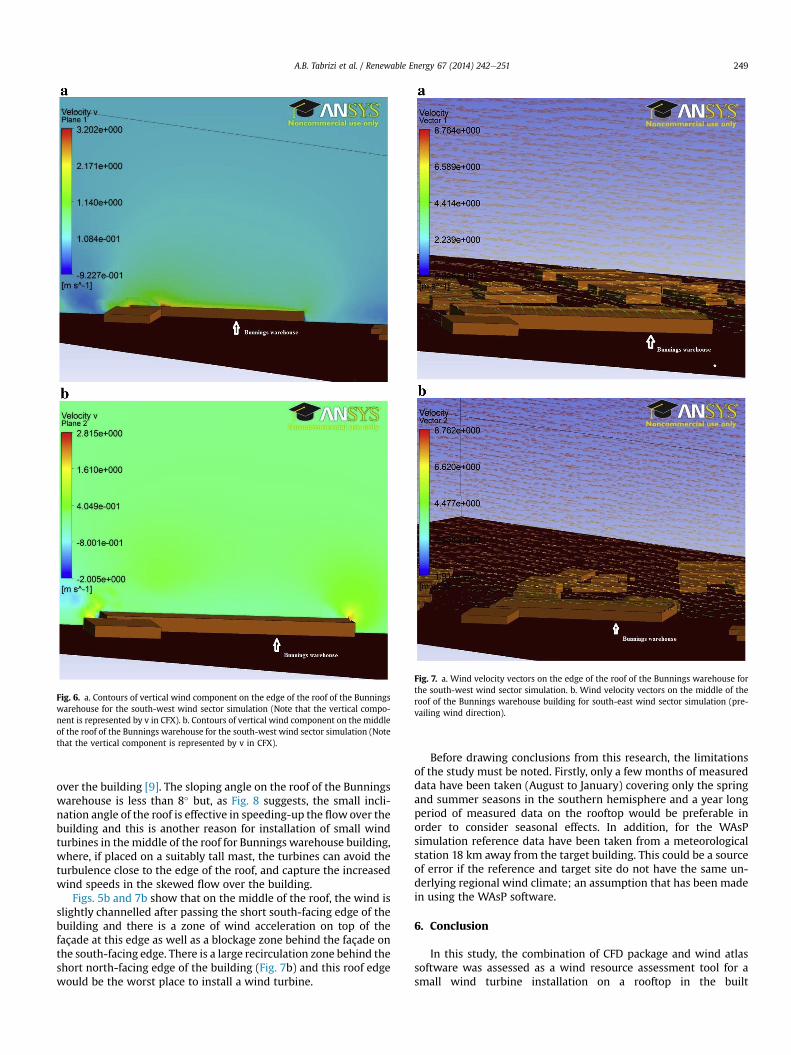
Fig. 6. a. Contours of vertical wind component on the edge of the roof of the Bunningswarehouse for the south-west wind sector simulation (Note that the vertical compo-nent is represented by v in CFX). b. Contours of vertical wind component on the middleof the roof of the Bunnings warehouse for the south-west wind sector simulation (Notethat the vertical component is represented by v in CFX).
Fig. 7. a. Wind velocity vectors on the edge of the roof of the Bunnings warehouse forthe south-west wind sector simulation. b. Wind velocity vectors on the middle of theroof of the Bunnings warehouse building for south-east wind sector simulation (pre-vailing wind direction).
A.B. Tabrizi et al. / Renewable Energy 67 (2014) 242e251 249
over the building [9]. The sloping angle on the roof of the Bunningswarehouse is less than 8� but, as Fig. 8 suggests, the small incli-nation angle of the roof is effective in speeding-up the flow over thebuilding and this is another reason for installation of small windturbines in themiddle of the roof for Bunnings warehouse building,where, if placed on a suitably tall mast, the turbines can avoid theturbulence close to the edge of the roof, and capture the increasedwind speeds in the skewed flow over the building.
Figs. 5b and 7b show that on the middle of the roof, the wind isslightly channelled after passing the short south-facing edge of thebuilding and there is a zone of wind acceleration on top of thefaçade at this edge as well as a blockage zone behind the façade onthe south-facing edge. There is a large recirculation zone behind theshort north-facing edge of the building (Fig. 7b) and this roof edgewould be the worst place to install a wind turbine.
Before drawing conclusions from this research, the limitationsof the study must be noted. Firstly, only a few months of measureddata have been taken (August to January) covering only the springand summer seasons in the southern hemisphere and a year longperiod of measured data on the rooftop would be preferable inorder to consider seasonal effects. In addition, for the WAsPsimulation reference data have been taken from a meteorologicalstation 18 km away from the target building. This could be a sourceof error if the reference and target site do not have the same un-derlying regional wind climate; an assumption that has been madein using the WAsP software.
6. Conclusion
In this study, the combination of CFD package and wind atlassoftware was assessed as a wind resource assessment tool for asmall wind turbine installation on a rooftop in the built
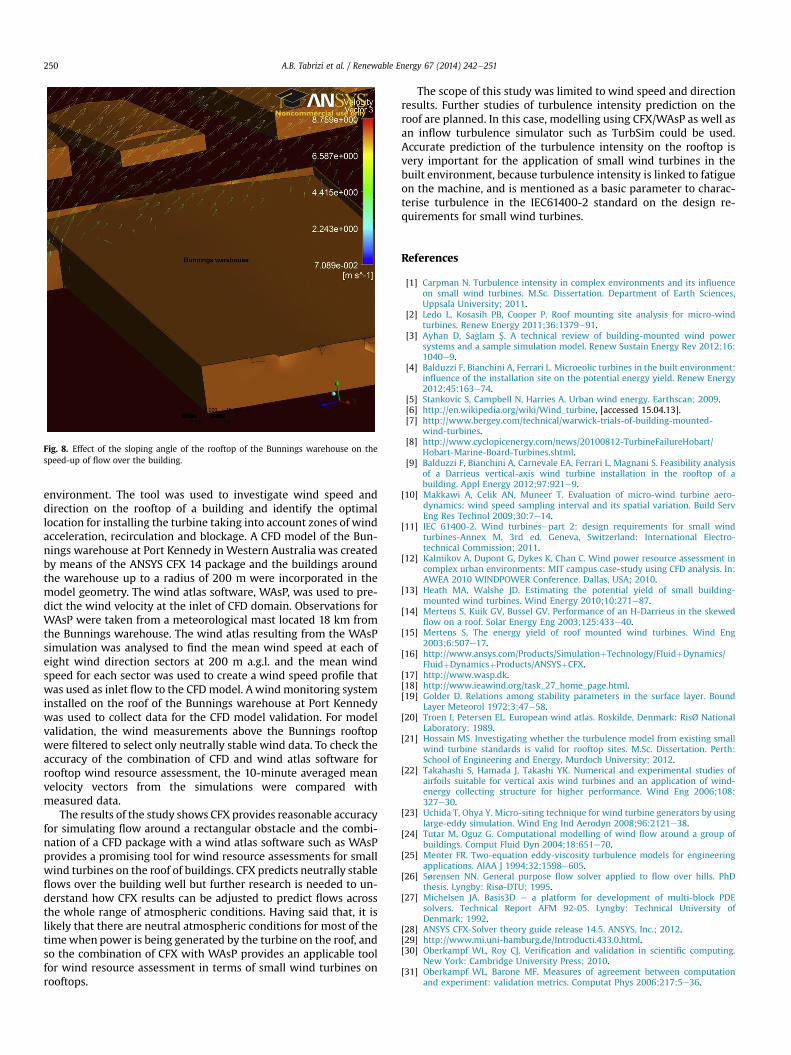
Fig. 8. Effect of the sloping angle of the rooftop of the Bunnings warehouse on thespeed-up of flow over the building.
A.B. Tabrizi et al. / Renewable Energy 67 (2014) 242e251250
environment. The tool was used to investigate wind speed anddirection on the rooftop of a building and identify the optimallocation for installing the turbine taking into account zones of windacceleration, recirculation and blockage. A CFD model of the Bun-nings warehouse at Port Kennedy in Western Australia was createdby means of the ANSYS CFX 14 package and the buildings aroundthe warehouse up to a radius of 200 m were incorporated in themodel geometry. The wind atlas software, WAsP, was used to pre-dict the wind velocity at the inlet of CFD domain. Observations forWAsP were taken from a meteorological mast located 18 km fromthe Bunnings warehouse. The wind atlas resulting from the WAsPsimulation was analysed to find the mean wind speed at each ofeight wind direction sectors at 200 m a.g.l. and the mean windspeed for each sector was used to create a wind speed profile thatwas used as inlet flow to the CFD model. Awind monitoring systeminstalled on the roof of the Bunnings warehouse at Port Kennedywas used to collect data for the CFD model validation. For modelvalidation, the wind measurements above the Bunnings rooftopwere filtered to select only neutrally stable wind data. To check theaccuracy of the combination of CFD and wind atlas software forrooftop wind resource assessment, the 10-minute averaged meanvelocity vectors from the simulations were compared withmeasured data.
The results of the study shows CFX provides reasonable accuracyfor simulating flow around a rectangular obstacle and the combi-nation of a CFD package with a wind atlas software such as WAsPprovides a promising tool for wind resource assessments for smallwind turbines on the roof of buildings. CFX predicts neutrally stableflows over the building well but further research is needed to un-derstand how CFX results can be adjusted to predict flows acrossthe whole range of atmospheric conditions. Having said that, it islikely that there are neutral atmospheric conditions for most of thetimewhen power is being generated by the turbine on the roof, andso the combination of CFX with WAsP provides an applicable toolfor wind resource assessment in terms of small wind turbines onrooftops.
The scope of this study was limited to wind speed and directionresults. Further studies of turbulence intensity prediction on theroof are planned. In this case, modelling using CFX/WAsP as well asan inflow turbulence simulator such as TurbSim could be used.Accurate prediction of the turbulence intensity on the rooftop isvery important for the application of small wind turbines in thebuilt environment, because turbulence intensity is linked to fatigueon the machine, and is mentioned as a basic parameter to charac-terise turbulence in the IEC61400-2 standard on the design re-quirements for small wind turbines.
References
[1] Carpman N. Turbulence intensity in complex environments and its influenceon small wind turbines. M.Sc. Dissertation. Department of Earth Sciences,Uppsala University; 2011.
[2] Ledo L, Kosasih PB, Cooper P. Roof mounting site analysis for micro-windturbines. Renew Energy 2011;36:1379e91.
[3] Ayhan D, Sa�glam S. A technical review of building-mounted wind powersystems and a sample simulation model. Renew Sustain Energy Rev 2012;16:1040e9.
[4] Balduzzi F, Bianchini A, Ferrari L. Microeolic turbines in the built environment:influence of the installation site on the potential energy yield. Renew Energy2012;45:163e74.
[5] Stankovic S, Campbell N, Harries A. Urban wind energy. Earthscan; 2009.[6] http://en.wikipedia.org/wiki/Wind_turbine, [accessed 15.04.13].[7] http://www.bergey.com/technical/warwick-trials-of-building-mounted-
wind-turbines.[8] http://www.cyclopicenergy.com/news/20100812-TurbineFailureHobart/
Hobart-Marine-Board-Turbines.shtml.[9] Balduzzi F, Bianchini A, Carnevale EA, Ferrari L, Magnani S. Feasibility analysis
of a Darrieus vertical-axis wind turbine installation in the rooftop of abuilding. Appl Energy 2012;97:921e9.
[10] Makkawi A, Celik AN, Muneer T. Evaluation of micro-wind turbine aero-dynamics: wind speed sampling interval and its spatial variation. Build ServEng Res Technol 2009;30:7e14.
[11] IEC 61400-2. Wind turbinesepart 2: design requirements for small windturbines-Annex M. 3rd ed. Geneva, Switzerland: International Electro-technical Commission; 2011.
[12] Kalmikov A, Dupont G, Dykes K, Chan C. Wind power resource assessment incomplex urban environments: MIT campus case-study using CFD analysis. In:AWEA 2010 WINDPOWER Conference. Dallas, USA; 2010.
[13] Heath MA, Walshe JD. Estimating the potential yield of small building-mounted wind turbines. Wind Energy 2010;10:271e87.
[14] Mertens S, Kuik GV, Bussel GV. Performance of an H-Darrieus in the skewedflow on a roof. Solar Energy Eng 2003;125:433e40.
[15] Mertens S. The energy yield of roof mounted wind turbines. Wind Eng2003;6:507e17.
[16] http://www.ansys.com/Products/SimulationþTechnology/FluidþDynamics/FluidþDynamicsþProducts/ANSYSþCFX.
[17] http://www.wasp.dk.[18] http://www.ieawind.org/task_27_home_page.html.[19] Golder D. Relations among stability parameters in the surface layer. Bound
Layer Meteorol 1972;3:47e58.[20] Troen I, Petersen EL. European wind atlas. Roskilde, Denmark: RisØ National
Laboratory; 1989.[21] Hossain MS. Investigating whether the turbulence model from existing small
wind turbine standards is valid for rooftop sites. M.Sc. Dissertation. Perth:School of Engineering and Energy, Murdoch University; 2012.
[22] Takahashi S, Hamada J, Takashi YK. Numerical and experimental studies ofairfoils suitable for vertical axis wind turbines and an application of wind-energy collecting structure for higher performance. Wind Eng 2006;108:327e30.
[23] Uchida T, Ohya Y. Micro-siting technique for wind turbine generators by usinglarge-eddy simulation. Wind Eng Ind Aerodyn 2008;96:2121e38.
[24] Tutar M, Oguz G. Computational modelling of wind flow around a group ofbuildings. Comput Fluid Dyn 2004;18:651e70.
[25] Menter FR. Two-equation eddy-viscosity turbulence models for engineeringapplications. AIAA J 1994;32:1598e605.
[26] Sørensen NN. General purpose flow solver applied to flow over hills. PhDthesis. Lyngby: Risø-DTU; 1995.
[27] Michelsen JA. Basis3D e a platform for development of multi-block PDEsolvers. Technical Report AFM 92-05. Lyngby: Technical University ofDenmark; 1992.
[28] ANSYS CFX-Solver theory guide release 14.5. ANSYS, Inc.; 2012.[29] http://www.mi.uni-hamburg.de/Introducti.433.0.html.[30] Oberkampf WL, Roy CJ. Verification and validation in scientific computing.
New York: Cambridge University Press; 2010.[31] Oberkampf WL, Barone MF. Measures of agreement between computation
and experiment: validation metrics. Computat Phys 2006;217:5e36.
http://www.ansys.com/Products/Simulation+Technology/Fluid+Dynamics/Fluid+Dynamics+Products/ANSYS+CFX
http://www.ansys.com/Products/Simulation+Technology/Fluid+Dynamics/Fluid+Dynamics+Products/ANSYS+CFX
http://www.ansys.com/Products/Simulation+Technology/Fluid+Dynamics/Fluid+Dynamics+Products/ANSYS+CFX
http://www.ansys.com/Products/Simulation+Technology/Fluid+Dynamics/Fluid+Dynamics+Products/ANSYS+CFX
http://www.ansys.com/Products/Simulation+Technology/Fluid+Dynamics/Fluid+Dynamics+Products/ANSYS+CFX
http://www.ansys.com/Products/Simulation+Technology/Fluid+Dynamics/Fluid+Dynamics+Products/ANSYS+CFX

A.B. Tabrizi et al. / Renewable Energy 67 (2014) 242e251 251
[32] VDI. Environmental meteorology-prognostic micro scale wind field models eevaluation for flow around Buildings and Obstacles, VDI Guideline 3783 epart 9. Berlin: Beuth Verlag; 2005.
[33] Schluunzen KH, Hinneburg D, Knoth O, Lambrecht M, Leitl B, Lopez S, et al.Flow and transport in the obstacle layer-first results of the micro-scale modelMITRAS. Atmos Chem 2003;44:113e30.
[34] Franke J. Application of Richardson extrapolation to the prediction of the flowfield around building models. In: Proceedings of the 4th International Sym-posium on Computational Wind Engineering (CWE2006), Yokohama, Japan2006.
[35] Eichhorn J, Kniffka A. The numerical flowmodel MISKAM: state of developmentand evaluation of the basic version. Meteorologische Zeitschrift 2010;19:81e90.
[36] VDI. Environmental meteorology-physical modelling of flow and dispersionprocesses in the atmospheric boundary layer e application of wind tunnels,VDI guideline 3783 e part 12. Berlin: Beuth Verlag; 2000.
[37] Franke J, Strum M, Kalmbach C. Validation of Open FOAM 1.6.x with theGerman VDI guideline for obstacle resolving micro-scale models. Wind EngInd Aerodyn 2012;104e106:350e9.
[38] Lyons TJ, Scott WD. Principles of air pollution meteorology. London: BelhavenPress; 1990.