Performance and Impact of Canadian Research in Astronomy ......in astronomy r of papers p.g.,...
48
Performance and Impact of Canadian Research in Astronomy & Astrophysics A Bibliometric Analysis [1998–2009]
Transcript of Performance and Impact of Canadian Research in Astronomy ......in astronomy r of papers p.g.,...
Performance and Impact of Canadian Research in Astronomy & Astrophysics A Bibliometric Analysis [1998–2009]

Performance and Impact of Canadian Research in Astronomy & Astrophysics A Bibliometric Analysis [1998–2009] Date: November 30, 2010 Authors: Guillaume Roberge, M.Sc.
David Campbell, M.Sc.
Grégoire Coté, B.Sc.
Submitted to: Corporate Policy and Strategy NRC Strategy and Development Branch National Research Council Canada (NRC) By:
Science-Metrix Inc. 1335 Mont-Royal E. Montréal Québec Canada H2J 1Y6 1.514.495.6505 1.800.299.8061 [email protected] www.science-metrix.com
Cover image: istockphoto.com

PerformResearc
Novemb© Scien
Exec
BackgSciencbibliomand arimportlarger indicatnumbe[ARC],report
1) Whterspejou
2) Whast
3) Is rcom
4) Wicol
Below
QuestiOveralworld and ARbased years t(ARC) per capcountrone raleadersARC) arelatesspecialspecialsucces
mance and Impach in Astronom
ber 2010 ce-Metrix Inc.
cutive Sum
round e–Metrix wametric analysround the wtant source oindependen
tors that areer of papers, , average of rprovides evid
hat is Canadarms of quantecialization iurnal impact
hat is Canadatrophysics?
research in asmparable (in
ith whom arellaborators a
is a brief des
ion 1 ll, Canada haleaders in theRIF. Canada’on a multicr
to finish 6th iand quality
pita and its ries relative tonk for the 20s in the fieldand for the q
s to its SI. Calization in tlization whils factors in
act of Canadianmy & Astrophys
mmary
as mandatedsis of the astr
world over a of informatiot study on ae primarily bnumber of p
relative impacdence to supp
a’s ranking aity (e.g., numndex) and scfactors)?
a’s positionin
stronomy & n terms of size
e Canadian among the wo
cription of th
as a good stane field as mea’s performanriteria analysin 2007–200(ARIF), as wSI. When repo the size of 007–2009 pe
d, mainly for quality of itsanada could he field. Ho
le maintaininthis field. Fi
n ics
d by the Naronomy & asperiod of 12
on that will hastronomy &based on co
papers per capct factors [ARport the NRC
mong leadinmber of paper
ientific impa
ng within the
astrophysics e) and/or rela
stronomy resorld leaders in
he overall fin
nding in astroasured by the
nce has improsis of the abo9, thanks to ell as its incrplacing the ntheir scientifriod (it movethe impact o
s research (1s
improve its owever, it shng a high sciinally, there
tional Reseatrophysics (A
2 years (1998help to addre& astrophysiounts of sciepita, specializRIF], internaC in answerin
ng countries irs and numbeact/quality (e
e internation
a strength foated disciplin
searchers worn the field?
ndings pertain
onomy & aste number of poved since 19ove indicator
its sustainedreased perfornumber of pfic workforcees from 6th toof its researct place for ARstanding in ould be notientific impais fierce glob
arch CouncilA&A) research8–2009). Thiess performanics research entific paperzation index
ational and nng the follow
in astronomyer of papers p.g., indicator
nal collaborat
or Canada whnes?
rking the mo
ning to each
trophysics respapers, numb998. While C
rs, it gained ad performan
rmance in terpapers per cae in the multio 5th place). Ch on the scieRIF). Canadaastronomy &
ted that it isact and/or qubal competit
l Canada (Nh that was cois bibliometrnce questionsin Canada.
rs and citati[SI], average ational collab
wing question
y & astrophysper capita), sprs based on ci
tion network
hen compare
ost internatio
of these ques
search, rankiber of papers
Canada rankea few positio
nce in terms rms of the sizapita by the icriteria rank
Canada standentific comma’s main perf& astrophysis often chaluality, whichtion with res
A Bibliometric
NRC) to proonducted in Cric study wils in the contUsing biblioons to papeof relative ci
boration ratens:
sics research pecialization itation count
in astronom
ed to a set of
onally, and ar
stions.
ng 5th amongs per capita, Sed 9th in 199
ons over the of scientific ze of its prodscientific ou
king, Canadads out amongmunity (2nd pl
formance drics by increalenging to i
h are Canada’spect to all o
Analysis
i
oduce a Canada ll be an ext of a ometric ers (i.e., itations es), this
in (e.g.,
ts and
my &
re these
g the 15 SI, ARC 8–2000 past 12 impact
duction utput of a gained g world lace for awback
asing its ncrease ’s main
of these

PerformResearc
Novemb© Scien
indicatstandin
QuestiCanadastropCanadqualitycollabofield ocountrcollabocountr
QuestiAstronsampleby thebased & astrcombiCanadnot spenviroastronamongnumbe
QuestiCanadthat arNASA HarvarCanadla Rechthe Unof the internacollaboperform
mance and Impach in Astronom
ber 2010 ce-Metrix Inc.
tors, such thng in the fiel
ion 2 da not only p
hysics, it is da has co-auty of Canadaorators are thf astronomy ries in the worators is a gries in the int
ion 3 nomy & astroe of compara scientometron natural lirophysics stnation of st
da’s impact is pecialized in nmental sciomy & astro
g all of the ser of papers,
ion 4 da collaboratere collaborati
(2nd in termrd-Smithsoni
da’s main collherche Scien
niversity of Wtop 20 orga
ational organorators have m good qual
act of Canadianmy & Astrophys
hat Canada sd.
produces higalso well intthored 78.2%a’s partners he US, the UK& astrophys
world with tgood indicatoternational co
ophysics reseaable (in termsric positionalinkages to thands out asrong specialstrongest is general physences, ocean
ophysics, but subfields used8th for specia
es mainly wiing the most
ms of the absoian Center flaborating in
ntifique (CNRWashington a
anizations wnizations bas
ARC and Aity research.
n ics
should not p
gh impact antegrated with% of its pape
is crucial K, Germany, sics based on the exceptioor of Canadaollaboration
arch stands os of size) andl analysis of
he astronomys the area iization and in general phsics. On the nography &
it has a smad in this com
alization and
th Americanwith Canada
olute numbefor Astrophy
nternational oRS) in Francnd Durham
with which Csed on scient
ARIF above t
play a single
nd high quahin the interers with at le
to the couFrance and Athe multicri
n of Switze’s standing innetwork.
out as an aread/or related d
Figure 6. Wy & astrophysin which Chigh scienti
hysics. Yet, unother hand,
limnology aller scientificmparison, ast3rd for scienti
n organizatioa being locater of co-authysics (4th) andorganization,e. Relative toUniversity aranada collabtific productthe world lev
e card in try
ality researchrnational scieeast one inte
untry’s overaAustralia, all iteria analysisrland (2nd) an the field. C
a of strength disciplines (20
When lookingsics field (i.e.
Canada’s perfific impact. Tnlike in astroCanada is mand earth
c impact in ttronomy & aific impact.
ns, with 14 oted in the UShored papersd Johns Hop, in absolute o the percenre Canada’s mborates the mtion. Finally,vel, which in
ying to main
h in the fieldentific comm
ernational paall performaof which are s. The fact thare among C
Canada also h
for Canada w0 subfields in
g at the fields., related discformance isThe only rel
onomy & astrmore speciali
& planetarythese discipliastrophysics
out of the to. Among the
s with Canadpkins Univerterms, is the
ntage of papemain internatmost, 13 are
all but one ndicates that
A Bibliometric
ntain or impr
d of astronommunity. Sincartner. As suance. Canada in the top 10
hat all of the Canada’s tophas linkages w
when comparn total) as pres that were sciplines), astr strongest,lated area inrophysics, Caized in the fiy sciences tines as well. ranks 13th fo
op 20 organise organizati
da), CALTECrsity (5th). H
e Centre Natiers in collabotional partne
among the of Canada’s
t Canada’s p
Analysis
ii
rove its
my and e 1998,
uch, the a’s top 0 in the top six
p seven with 70
red to a esented selected ronomy with a
n which anada is fields of han in Finally, or total
izations ions are
CH (3rd), owever, onal de
oration, ers. Out
top 20 20 top
partners

PerformResearc
Novemb© Scien
Cont
ExecutContenFiguresTables1 I2 A
22
2
3 S4 B
44
5 CAppendAppendAppend
mance and Impach in Astronom
ber 2010 ce-Metrix Inc.
ents
ive Summarynts .............s ..............
s ...............Introduction .Astronomy & 2.1 Global 2.2 Benchm
2.2.1 2.2.2 2.2.3 2.2.4 2.2.5 2.2.6 2.2.7 2.2.8
2.3 Scienti
ScientometricBenchmarkin4.1 Top co4.2 Canad
Conclusion ..dix A – Suppldix B – Methodix C – List of
act of Canadianmy & Astrophys
y ...............................................................................astrophysicstrends in ast
marking of leNumber oNumber oScientific oSpecializaAverage oAverage oMulticriterScientome
fic collaborat
c positioning g of leading o
ollaborators ofian organizat
................ementary Tab
ods ............f astronomy &
n ics
................
................
................
................
................s research in ronomy & astading countrif papers .......f papers per output of couation index ....of relative citaof relative impia analysis ....etric positionation of leading
of Canada inorganizationsf Canada ......tions ..............
................bles and Figu................& astrophysic
................
................
................
................
................the world andtrophysics reies in astrono.....................capita ...........ntries relative.....................
ations (ARC) ..pact factors (A.....................
al analysis .....g countries ...
n 21 scientifics in astronom..........................................
................ures ...........................cs journals ...
................
................
................
................
................d in Canada ..search .........
omy & astroph..........................................e to scientific ..........................................ARIF) ...........................................................................
c subfields ...my & astrophy
.....................
.....................
................
................
................
................
................
................
................
................
................
.....................................hysics .....................................................workforce ..................................................................................................................................
................ysics ....................................................
................
................
................
................
A Bibliometric
................
................
................
................
................
.......................................................................................................................................................................................................................................................
................
..........................................................
................
................
................
................
Analysis
iii
......... i
....... iii
....... iv
....... iv
........ 1
........ 2 .......... 2 .......... 3 .......... 4 .......... 5 .......... 6 .......... 7 .......... 8 .......... 9 ........ 10 ........ 12 ........ 14
...... 19
...... 22 ........ 22 ........ 24
...... 27
...... 30
...... 34
...... 41

PerformResearc
Novemb© Scien
Figu
Figure
Figure
Figure
Figure Figure
Figure
Figure
Figure
Table
Table I
Table I
Table I
Table IV
Table V
Table V
Table VTable VTable IX
Table X
Table X
Table X
Table X
mance and Impach in Astronom
ber 2010 ce-Metrix Inc.
res
1 Trendsastrono
2 Sciento1998–2
3 Trendsastroph
4 Collabo5 Internat
1998–26 Sciento
subfield7 Nationa
astroph8 Collabo
astroph
es
Rankinastroph
I Rankinand ast
II Rankinobservemembe
V Rankinastroph
V Rankinastrono
VI Rankinastrono
VII MulticriVIII NumbeX Scientif
1998–2X Papers
CanadaXI Scientif
1998–2XII Nationa
astrophXIII Papers
organiz
act of Canadianmy & Astrophys
in the numbeomy & astrophometric positio2009 ............. in the nationahysics, 1998–oration networtional collabor2009 .............ometric positiods for Canadaal collaboratiohysics researcoration networhysics researc
g of leading chysics, 1998–g of leading ctrophysics, 19g of leading ced number of erships, 2009 g of leading chysics, 1998–g of leading comy & astrophg of leading comy & astrophiteria ranking oer of papers, Sfic performanc2009 .............s, ARC, ARIF aa, 1998–2009fic performanc2009 .............al and internathysics, 1998–s, ARC, ARIF azations in astro
n ics
er of Canadianhysics, 1998–onal analysis o.....................al and internat2009 .............rk of countriesration network.....................onal analysis oa, 1998–2009on network of tch, 1998–2009rk of the 30 lech, 1998–2009
countries acco2009 .............
countries acco998–2009 ......countries in as
papers to the.....................
countries acco2009 .............
countries accohysics, 1998–countries accohysics, 1998–of 15 leading SI, ARC and Ace of foreign o.....................and internation9 ....................ce of the world.....................tional collabor2009 .............and internationonomy & astro
n papers and 2009 .............of the top 15 c.....................tional collabor.....................s in astronomyk of Canada in.....................
of astronomy .....................the 20 leading9 ...................
eading organiz9 ...................
ording to their .....................
ording to their .....................tronomy & aseir expected n.....................
ording to their .....................
ording to their 2009 .............
ording to their 2009 .............countries in a
ARIF of Canadorganizations w.....................nal collaborati.....................d’s top 15 co.....................ration rates of.....................nal collaboratiophysics, 199
in Canada's s.....................countries in as.....................ration rates of.....................y & astrophysn astronomy &.....................& astrophysic.....................g Canadian or.....................zations in the w.....................
number of pa.....................number of pa.....................
strophysics acnumber of pap.....................specialization.....................average of re.....................average of re.....................
astronomy & ada in 21 scientwith which Ca.....................ions for 20 lea.....................
ountries in astr.....................f 15 leading co.....................ion rate for 20
98–2009 ........
share of world.....................stronomy & as.....................f Canada in as.....................
sics research, & astrophysics.....................
cs compared t.....................rganizations in.....................world in astro.....................
apers in astron.....................
apers per cap.....................
ccording to thepers based on.....................
n index (SI) in a.....................
elative citations.....................
elative impact .....................
astrophysics, 1tific subfields, anada collabo.....................ading organiza.....................ronomy & astr.....................ountries in ast.....................
0 leading inter.....................
A Bibliometric
d papers in .....................strophysics, .....................stronomy & .....................1998–2009 .
s research, .....................to 20 NSF .....................n astronomy &.....................
onomy & .....................
nomy & .....................ita in astronom.....................e ratio of theirn their IAU .....................astronomy & .....................s (ARC) in .....................factors (ARIF).....................1998–2009 ...1998–2009 .
orates the mos.....................ations in .....................rophysics, .....................tronomy & .....................rnational .....................
Analysis
iv
.......... 2
........ 13
........ 15
........ 17
........ 18
........ 20 & ........ 26
........ 33
.......... 4 my .......... 5 r
.......... 6
.......... 7
.......... 9 ) in ........ 10 ........ 11 ........ 19 st, ........ 23
........ 25
........ 30
........ 31
........ 32

PerformResearc
Novemb© Scien
1 In
The NundersNRC mresearc
Using papersresearchelp thit will h
1)
2)
Subseqastronand/orpapersNRC t
3)
Finallypapersfollowinternaworld astronthe mo
4)
mance and Impach in Astronom
ber 2010 ce-Metrix Inc.
ntroductio
National Resstanding of tmandated Sch in Canada
bibliometric s, Science-Mech against thhe NRC to ashelp to answ
What is Canterms of qu(e.g., speciacounts andWhat is Can& astrophy
quently, Scieomy & astror related discs, the Specialio answer the
Is research set of comp
y, Canadian as in astronoming indicatoational collableading instomy & astro
ost (ranked o
With whomthese collab
act of Canadianmy & Astrophys
on
search Counthe impact ofcience-Metrix
a over a 12-ye
indicators thetrix has fir
hat of the wossess the con
wer the follow
nada’s rankinuantity (e.g., nalization inded journal impnada’s positi
ysics?
ence-Metrix physics was c
ciplines (Sectization Index
e following qu
in astronomyparable (in te
and world leamy & astropors were prodboration ratetitutions werphysics. Furt
on number of
m are Canadiaborators amo
n ics
ncil Canada f astronomy x to producar period (19
hat are primarst positioneorld and leadtribution ma
wing question
ng among leanumber of paex) and scientpact factors)?
oning within
performed compared totion 3). This x (SI) and theuestion:
y & astrophyrms of size) a
ading instituthysics researduced: numbe, ARC and Are produced thermore, a lf co-authored
an astronomong the world
(NRC) is & astrophys
ce a bibliom998–2009).
arily based oned the Canadding countrieade by Canad
ns:
ading countrapers and nutific impact/q
n the internat
a positional its standingpositional a
e Average of R
ysics researchand/or relate
tions were idrch (Section ber of paperARIF. The coto study the
list of world d papers) was
y researchersd leaders in th
seeking datasics on Canad
metric profile
n counts of sdian outputes in the fielda to world s
ries in astronoumber of papequality (e.g.,
tional collabo
l analysis ing in a sample analysis is baRelative Cita
h a strength foed disciplines
dentified base4). In order
rs, number oollaboration ne structure oinstitutions
s produced to
s working thehe field?
a that will dian science. e of astrono
scientific papt in astronold (Section 2science in the
omy & astropers per capitaindicators ba
oration netw
n which Canof comparab
ased on the nations (ARC),
for Canada whs?
ed on their nr to rank theof internationetworks of of institutionwith which C
o answer the
e most intern
A Bibliometric
lead to a In this cont
omy & astro
pers and citatomy & astro2). This analye field; in par
physics reseaa), specializatased on citati
work in astron
nada’s standble (in terms number of sc, and it will h
hen compare
umber of puese institutioonal collaborboth Canadinal partnersCanada collafollowing qu
nationally, an
Analysis
1
greater ext, the physics
tions to physics
ysis will rticular,
arch in tion ion
nomy
ding in of size)
cientific help the
ed to a
ublished ons, the rations, ian and hips in
aborates uestion:
nd are

PerformResearc
Novemb© Scien
2 A
This sproducto sup
W(S
Was
2.1 G
The asjournadisciplSciencastronscientiapprov129,87
Figure
Source:
mance and Impach in Astronom
ber 2010 ce-Metrix Inc.
Astronom
ection will fction in astroport the NRC
What is CanadSection 2.2)?
What is Canadstrophysics re
Global tren
stronomy & al-based apprline. The NRe-Metrix subomy & astro
ific journals ved by the N72 astronomy
e 1 Trenworl
: Calcu
0%
2%
4%
6%
8%
10%
12%
199
Shar
e of
Wor
ld P
aper
s
act of Canadianmy & Astrophys
my & astro
first provide onomy & astC in answerin
da’s ranking a
da’s positioniesearch (Sect
nds in astr
astrophysicsroach was u
RC initially pbsequently eophysics catthat were dRC (see Meth
y & astrophys
nds in the nd papers inlated by Scienc
98 1999 2000
Canada's n
% of World
n ics
ophysics
a general ovtrophysics resng the follow
among leadin
ing within thion 2.3)?
ronomy & a
s dataset useused to retri
rovided a lisexpanded thitegory of theeemed relevahods in Appesics papers pu
number of n astronomce–Metrix using
0 2001 2002
number of paper
d Papers
research
verview of trsearch (Sectio
wing question
ng countries
he internation
astrophysi
ed in this stueve scientific
st of 75 speciis initial set e National Sant to the cuendix A for mublished betw
Canadian my & astrop
WoS
2003 2004
Year
rs
h in the w
rends in the on 2.1). Subs
ns:
in astronomy
nal collabora
cs researc
udy covers 1c papers in ialist journal
t of journalsScience Founurrent studymore details)ween 1998 an
papers andphysics, 19
2005 2006
orld and
Canadian asequently, da
y & astrophy
ation network
ch
2 years of scthe astrono
ls in astronos by adding ndation (NSy. The final ). The resultind 2009.
d in Canad998–2009
2007 2008 2
A Bibliometric
in Canad
and world scata will be pre
ysics research
k in astronom
cientific reseomy & astroomy & astrop
journals froSF) classificaset of journ
ing dataset co
da's share
0
200
400
600
800
1,000
1,200
2009
Pape
rs
Analysis
2
a
cientific esented
h
my &
earch. A physics physics. om the
ation of als was ontains
of
PerformResearc
Novemb© Scien
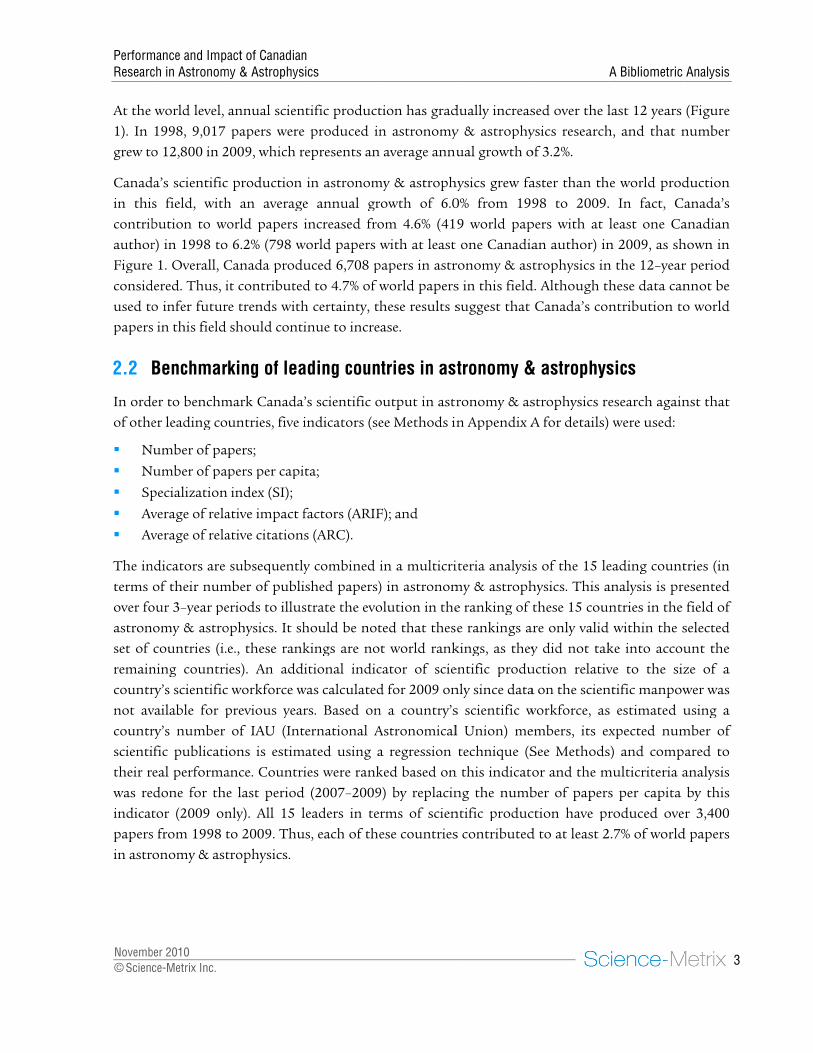
At the 1). In grew to
Canadin thicontribauthorFigureconsidused topapers
2.2
In ordof othe
N
N
Sp
Av
Av
The interms over foastronset of remaincountrnot avcountrscientitheir rwas reindicatpapersin astr
mance and Impach in Astronom
ber 2010 ce-Metrix Inc.
world level, 1998, 9,017 o 12,800 in 2
da’s scientific s field, withbution to wor) in 1998 to e 1. Overall, Cdered. Thus, io infer futurs in this field
Benchmar
er to benchmer leading co
Number of pap
Number of pap
pecialization
verage of rela
verage of rela
ndicators are of their num
our 3–year peomy & astrocountries (i.e
ning countriry’s scientificvailable for pry’s number ific publicatieal performa
edone for thetor (2009 ons from 1998 tonomy & ast
act of Canadianmy & Astrophys
annual scienpapers were
2009, which r
production h an averageorld papers i6.2% (798 w
Canada produit contributede trends withshould conti
king of lea
mark Canada’untries, five i
pers;
pers per capi
index (SI);
ative impact f
ative citations
subsequentlymber of publieriods to illusophysics. It she., these rankies). An addi
workforce wprevious year
of IAU (Intons is estim
ance. Countrie last periodnly). All 15 lto 2009. Thutrophysics.
n ics
ntific producte produced inrepresents an
in astronome annual grincreased fro
world papers wuced 6,708 pd to 4.7% of wh certainty, thinue to incre
ading coun
’s scientific oindicators (se
ta;
factors (ARIF
s (ARC).
y combined iished papers)strate the evohould be notkings are noitional indic
was calculatedrs. Based onternational A
mated using aies were rank
d (2007–2009leaders in te
us, each of the
tion has gradn astronomyaverage annu
my & astrophowth of 6.0
om 4.6% (41with at least
papers in astrworld papershese results sase.
tries in as
output in astree Methods in
F); and
in a multicri) in astronomolution in theted that thest world rank
cator of scied for 2009 onn a country’sAstronomicala regression ked based on9) by replacinrms of scienese countries
dually increasy & astrophyual growth o
hysics grew fa0% from 1999 world papone Canadia
ronomy & asts in this fieldsuggest that
tronomy &
ronomy & asn Appendix A
iteria analysismy & astrophe ranking of e rankings a
kings, as theyentific produnly since datas scientific wl Union) metechnique (S
n this indicatong the numbntific producs contributed
sed over the lysics researchof 3.2%.
aster than th98 to 2009.
pers with at an author) introphysics in
d. Although tCanada’s co
& astrophys
strophysics reA for details)
s of the 15 lehysics. This athese 15 cou
are only validy did not tak
uction relativa on the scienworkforce, asembers, its exSee Methodsor and the mber of papersction have prd to at least 2
A Bibliometric
last 12 years h, and that n
he world prod. In fact, Cleast one Can 2009, as shn the 12–yearhese data canntribution to
sics
esearch again were used:
eading countanalysis is prentries in the
d within the ske into accouve to the siz
ntific manpows estimated uxpected num
s) and compmulticriteria a
s per capita roduced ove
2.7% of world
Analysis
3
(Figure number
duction anada’s
anadian hown in r period nnot be o world
nst that
tries (in esented field of
selected unt the ze of a wer was using a
mber of ared to analysis by this r 3,400
d papers

PerformResearc
Novemb© Scien
2.2.1
Table astropcontribastropperiodpaperscome includOveralkeepinproducperiodyearly in 199
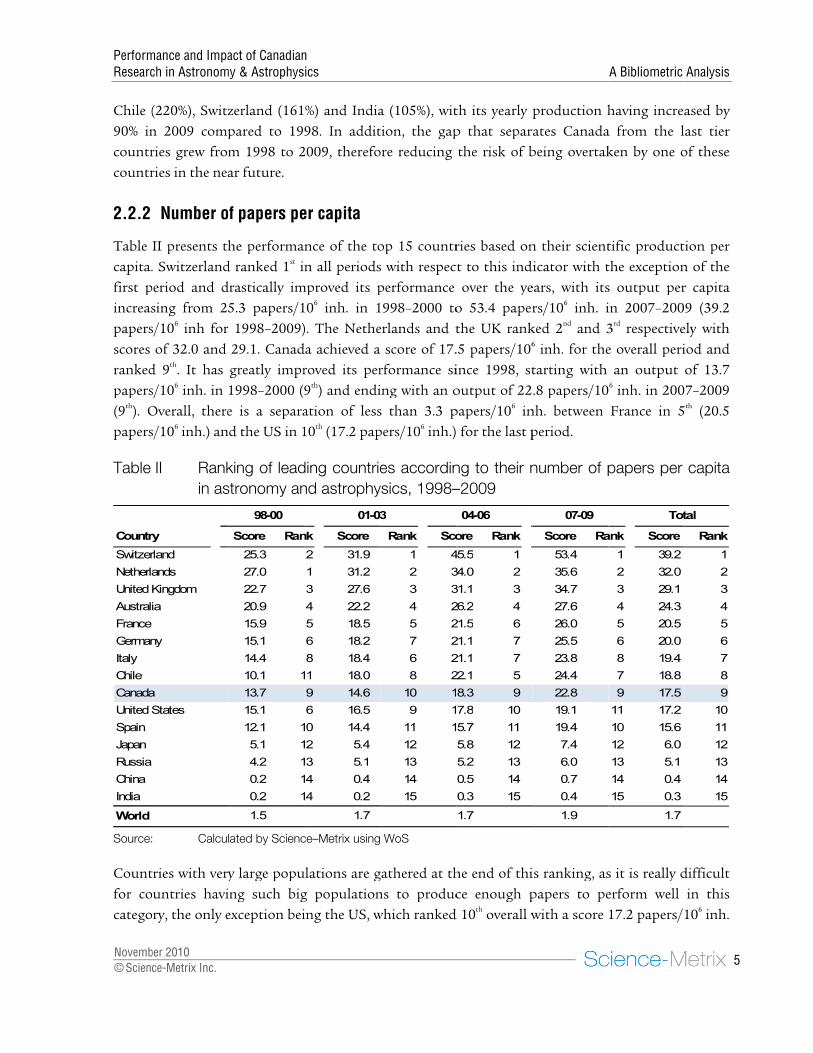
Table
Source:
Canadrepresefrom Cperform
Country
United S
United K
German
France
Italy
Japan
Russia
Spain
China
Canada
Netherla
Australi
Chile
Switzer
India
World
mance and Impach in Astronom
ber 2010 ce-Metrix Inc.
Number o
I presents thhysics over tbuted to abhysics (61,03
ds considereds over the samnext, with C
des the Nethll, the rankin
ng their respection tremen
d and improvproduction, 8 to 998 pap
I Rankastro
: Calcu
da fell behinenting 141% China in 200mance in ast
ry
States
Kingdom
ny
a
ands
ia
rland
act of Canadianmy & Astrophys
f papers
he trends in tthe 1998–20out 47% of 38 out of 12d. The UK anme period. FrCanada comperlands (11th
ng of countrective positiondously durinved its rankiChina went fers in 2009 (d
king of leaonomy & as
lated by Scienc
nd China in of that of C
03, but lost ittronomy & as
Score Ran
12,852
4,038
3,727
2,943
2,495
1,929
1,848
1,468
945 1
1,268 1
1,305
1,180 1
454 1
549 1
657 1
27,474
98-00
n ics
the scientific 009 period. T
world pape29,872 papernd Germany rance (4th), Itapleting the th), Australia ries was quit
ons. One notang the 1998–2ng, rising tofrom 12th to 6data not show
ading counstrophysics,
ce–Metrix using
term of yeaChina in 1998t again the fostrophysics r
nk Score
1 14,484
2 4,967
3 4,489
4 3,475
5 3,199
6 2,077
7 2,242
8 1,805
2 1,456
0 1,388
9 1,537
1 1,301
5 838
4 705
3 739
31,148
01-03
production The US leadrs published
rs). In fact, tfollow far b
aly (5th), Japantop 10 with (12th), Chilete stable oveable exceptio2009 period.
o 8th place in 6th place, haviwn).
ntries acco1998–2009
WoS
arly product8 to only 80%ollowing yearesearch is th
Rank Sco
1 16,0
2 5,6
3 5,2
4 4,1
5 3,6
7 2,2
6 2,2
8 2,0
10 1,8
11 1,7
9 1,7
12 1,5
13 1,0
15 1,0
14 8
33,8
3
of the 15 leads in terms od over the 1the US ranksbehind with, n (6th), Russia
6,708 paper(13th), Switz
er the 12–yeon to this tre China starte the most reing increased
ording to t9
tion in 2001% in 2009. C
ar. An indicathe fact that it
ore Rank
035 1
681 2
227 3
110 4
686 5
235 6
219 7
065 8
808 9
782 10
708 11
592 12
061 13
021 14
843 15
841
04-06
ading countrof scientific 12-year perios 1st in each respectively,
a (7th), Spain rs. The last zerland (14th
ear period, wend is China, ed in 12th placecent 3-year d its producti
their numb
1, going froCanada did tation of the stt ranks 5th be
Score Ra
17,667
6,467
6,310
5,064
4,143
2,835
2,522
2,663
2,654
2,270
1,814
1,738
1,205
1,214
1,205
37,409
07-09
A Bibliometric
ries in astronproduction,
od in astronof the four
21,153 and (8th) and Chitier of this
h) and Indiawith most co
which increace in the 199period. In te
ion from 298
ber of pap
om a yearly ake back a ptrength of Cehind China
nk Score
1 61,038
2 21,153
3 19,753
4 15,592
5 13,523
6 9,076
9 8,831
7 8,001
8 6,863
10 6,708
11 6,364
12 5,811
14 3,558
13 3,489
14 3,444
129,872
Tot
Analysis
4
nomy & having
nomy & r 3–year
19,753 ina (9th) top 15
a (15th). ountries ased its 8–2000
erms of 8 papers
pers in
output position anada’s (235%),
Rank
1
2
3
4
5
6
7
8
9
10
11
12
13
14
15
tal
PerformResearc
Novemb© Scien
Chile (90% incountrcountr
2.2.2
Table capita.first pincreaspapersscores rankedpapers(9th). Opapers
Table
Source:
Countfor cocatego
Countr
Switzer
Netherla
United
Australi
France
German
Italy
Chile
Canada
United S
Spain
Japan
Russia
China
India
World
mance and Impach in Astronom
ber 2010 ce-Metrix Inc.
(220%), Switzn 2009 compries grew frories in the nea
Number o
II presents th. Switzerland
period and dsing from 25s/106 inh for
of 32.0 and d 9th. It has s/106 inh. in Overall, theres/106 inh.) an
II Rankin as
: Calcu
tries with veryuntries haviry, the only e
ry
rland
ands
Kingdom
ia
ny
a
States
act of Canadianmy & Astrophys
zerland (161pared to 19m 1998 to 2ar future.
f papers pe
he performad ranked 1st idrastically im
5.3 papers/1r 1998–2009)
29.1. Canadgreatly impr1998–2000 (e is a separa
nd the US in 1
king of leadstronomy an
lated by Scienc
y large popuing such bigexception bei
Score Ran
25.3
27.0
22.7
20.9
15.9
15.1
14.4
10.1 1
13.7
15.1
12.1 1
5.1 1
4.2 1
0.2 1
0.2 1
1.5
98-00
n ics
%) and India98. In addit
2009, therefo
er capita
nce of the ton all periods
mproved its p106 inh. in 1). The Nethe
da achieved aroved its per9th) and endiation of less10th (17.2 pap
ding countriend astrophy
ce–Metrix using
ulations are gg populationing the US, w
nk Score
2 31.9
1 31.2
3 27.6
4 22.2
5 18.5
6 18.2
8 18.4
11 18.0
9 14.6
6 16.5
10 14.4
12 5.4
13 5.1
14 0.4
14 0.2
1.7
01-03
a (105%), wittion, the gapore reducing
op 15 countrs with respecperformance 1998–2000 toerlands and ta score of 17.rformance siing with an os than 3.3 ppers/106 inh.)
es accordinysics, 1998–
WoS
gathered at thns to producwhich ranked
Rank Sco
1 4
2 3
3 3
4 2
5 2
7 2
6 2
8 2
10 1
9 1
11 1
12
13
14
15
03
th its yearly p that separthe risk of b
ries based onct to this ind
over the yeo 53.4 paperthe UK rank.5 papers/106
ince 1998, stoutput of 22papers/106 in
for the last p
ng to their n–2009
he end of thice enough p
d 10th overall w
ore Rank
45.5 1
34.0 2
31.1 3
26.2 4
21.5 6
21.1 7
21.1 7
22.1 5
8.3 9
7.8 10
5.7 11
5.8 12
5.2 13
0.5 14
0.3 15
1.7
04-06
production hrates Canadabeing overtak
n their scientdicator with tears, with itsrs/106 inh. i
ked 2nd and 36 inh. for thetarting with .8 papers/10
nh. between period.
number of p
is ranking, aspapers to pewith a score
Score Ra
53.4
35.6
34.7
27.6
26.0
25.5
23.8
24.4
22.8
19.1
19.4
7.4
6.0
0.7
0.4
1.9
07-09
A Bibliometric
having increaa from the lken by one o
tific productthe exceptions output perin 2007–2003rd respectivee overall peri
an output 6 inh. in 200France in 5
papers per
s it is really derform well 17.2 papers/
ank Score
1 39.2
2 32.0
3 29.1
4 24.3
5 20.5
6 20.0
8 19.4
7 18.8
9 17.5
11 17.2
10 15.6
12 6.0
13 5.1
14 0.4
15 0.3
1.7
Tot
Analysis
5
ased by ast tier
of these
tion per n of the r capita 9 (39.2
ely with iod and of 13.7 7–2009
5th (20.5
capita
difficult in this
106 inh.
Rank
1
2
3
4
5
6
7
8
9
10
11
12
13
14
15
tal

PerformResearc
Novemb© Scien
Count(14th) atriplin
2.2.3
Table relative2009. commGerma1.4. Ovabove than ex
Table
Note:
Source:
Countr
Switze
Chile
United
Germa
Nether
Canada
Spain
Austra
Russia
Italy
France
India
China
United
Japan
mance and Impach in Astronom
ber 2010 ce-Metrix Inc.
tries taking tand India (15
ng its number
Scientific
III presents e to the size Switzerland unity. Chile
any in 4th withverall, seven 1.0, Australiaxpected.
III Rankratio base
This infor prebetweindicaregresanalysThe p
: Calcu
ry
rland
Kingdom
ny
lands
a
lia
a
e
States
act of Canadianmy & Astrophys
he last positi5th), with Chir of papers pe
output of c
the performof their scienranked 1st wranked 2nd wh a ratio of 1countries ama performed
king of leadof their obs
ed on their IA
ndicator could oevious years. Theen the numbertors (i.e., numb
ssion models. Tsis using reduceredicted (or explated by Scienc
IAU memb
5
5
2
2
3
2
3
5
6
2
4
2,5
5
n ics
ions for the ina greatly imer capita.
ountries re
mance of the ntific workfowith 3.2 timewith a ratio of
. The Nethermong the top
as expected
ding countrserved numAU membe
only be calculathe expected nur of papers and ber of papers anTherefore, the aed major axis (Rpected) values wce–Metrix using
bers Observe
76
87
523
529
205
245
304
259
367
568
696
220
459
576
597
1998–2009 pmproving its
lative to sc
top 15 cource as estima
es as many pf 2.6. The UKrlands and Cp 15 performwith a score
ies in astromber of paperships, 200
ted for 2009 sinumber of papers
the number of nd IAU memberpproach used c
RMA) to estimatwere obtained WoS
d no. of pape
4
4
2,2
2,2
64
7
9
6
8
1,4
1,7
4
9
6,1
9
period were Jperformance
cientific wo
untries basedated using thpapers as expK was 3rd withCanada are onmed better th
of 1.0 and s
onomy & aspers to their09
nce the numbers is obtained usIAU members.
rs) are log transconsisted in pete the constantusing this mode
ers Expected
51
25
99
33
44
98
88
31
50
38
94
12
98
63
90
Japan (12th), e from 1998
rkforce
d on their scheir number opected from h a ratio of 1n a par in 5th
han expected even countri
strophysics expected n
rs of IAU membsing the power Power law rela
sformed, can beerforming a log-ts (a and k) of thel (p-value < 0.
d no. of paper
140
165
1,459
1,479
468
58
755
62
949
1,612
2,063
510
1,245
10,103
1,713
A Bibliometric
Russia (13th)to 2009, mo
cientific prodof IAU membthe size of .6, slightly ahplace with a in 2009 with
ies performed
according number of p
bers were not alaw relationship
ationships, whee analysed usin-log linear regrehe regression m0001; R2 = 0.8
rs Ratio
0 3.2
5 2.6
9 1.6
9 1.5
8 1.4
1 1.4
5 1.3
1 1.0
9 0.9
2 0.9
3 0.9
0 0.8
5 0.8
3 0.6
3 0.6
Analysis
6
, China ore than
duction bers for its IAU head of ratio of h ratios d worse
to the papers
available p
en both ng linear ession model. 88).
Rk
1
2
3
4
5
5
7
8
9
9
9
12
12
14
14

PerformResearc
Novemb© Scien
2.2.4
The spresearc1, a cou
Table interesresearcin termastronobservSI of special2.74 bovertakNether
Table
Source:
Count
Chile
Italy
Russia
France
Nether
United
Spain
Germa
Austra
Switze
United
Canad
India
Japan
China
World
mance and Impach in Astronom
ber 2010 ce-Metrix Inc.
Specializa
pecialization ch area relativuntry is spec
IV provides sting to notech as they ocm of SI withomy & astro
vatories in Ch2.43 for thelized in astroetween the fking it in thrlands in 5th w
IV Rankastro
: Calcu
try S
a
e
rlands
d Kingdom
any
alia
erland
d States
da
d
act of Canadianmy & Astrophys
ation index
index (SI) is ve to the inteialized in the
the SI for that Europecupied sevenh an overall
ophysics. Thihile. Italy wase 1998–2009 onomy & astfirst and last he last periodwith 1.95, an
king of leadonomy & as
lated by Scienc
Score Rank
7.03 1
2.25 2
1.89 4
1.66 6
1.91 3
1.57 7
1.87 5
1.54 8
1.53 9
1.09 11
1.36 10
1.03 13
1.09 11
0.76 14
0.75 15
1.00
98-00
n ics
an indicator ensity of resee particular fi
the top 15 ean countriesn out the top
score of 8.6s is in great s the second
period. It wtrophysics reperiods, wit
d. After a sid the UK and
ding countrstrophysics,
ce–Metrix using
Score Ra
9.25
2.39
2.28
1.81
1.97
1.79
1.86
1.68
1.46
1.27
1.39
1.00
0.99
0.73
0.73
1.00
01-03
of the intensearch within ield relative t
countries ins are leading eight positio69, meaningpart attributmost special
was followedesearch (SI=2th Russia tyinzeable gap, Fd Spain tied i
ries accord1998–2009
WoS
nk Score
1 9.75
2 2.49
3 2.49
6 2.10
4 1.99
7 1.99
5 1.84
8 1.91
9 1.60
11 1.64
10 1.48
12 1.13
13 0.93
14 0.80
14 0.58
1.00
04-0
sity of researthe same are
to the world;
n astronomyg in terms of ons. Howeve
g that the cotable to the lized country
d closely by 2.35). In factng Italy for France came in with.1.89.
ding to thei9
Rank Sco
1 8.
2 2.
2 2.
4 2.
5 1.
5 2.
8 1.
7 2.
10 1.
9 1.
11 1.
12 1.
13 0.
14 1.
15 0.
1.
06 0
rch of a counea in the worlif the SI is be
y & astrophySI in astrono
er, Chile was ountry is hepresence of y amongst thRussia, whic
t, Russia’s SIsecond place in 4th with
r specializa
ore Rank
38 1
54 3
74 2
44 4
94 8
16 6
96 7
22 5
47 11
77 9
60 10
30 12
98 14
10 13
60 15
00
07-09
A Bibliometric
ntry within a ld. If the SI ielow 1, it is n
ysics researchomy & astrothe leading c
eavily specialmajor intern
he 15 leaders,ch was also I went from e in 2004–20a score of 2.
ation index
Score Ran
8.69
2.43
2.35
2.02
1.95
1.89
1.89
1.86
1.51
1.47 1
1.47 1
1.13 1
0.99 1
0.85 1
0.63 1
1.00
Total
Analysis
7
specific is above
not.
h. It is physics country lized in national , with a heavily 1.89 to
006 and .02, the
(SI) in
nk
1
2
3
4
5
6
6
8
9
10
10
12
13
14
15

PerformResearc
Novemb© Scien
Canadbut toCanad1.30 (1since m
There leadersits SI othe othFinallydecreaproduc
2.2.5
The ARthe scisubfielsubfielastropworld astrop
Canadsecondfirst twrangedrelative2007–2
The U1.29, acountr(13th, A
mance and Impach in Astronom
ber 2010 ce-Metrix Inc.
da was also spo a lesser extda greatly imp12th) in the lasmost of them
were only ths: India (SI=0over the 12-yeher hand, Iny, even if Chased from 0.ction is incre
Average o
RC is an indiientific literald of science lds. For thishysics researlevel. Table
hysics resear
da ranks highd only to Swiwo periods, dd from 4th (19ely stable ov2009 and a p
US ranks 3rd inand is followries scored loARC=0.69), In
act of Canadianmy & Astrophys
pecialized in ent than theproved its SIst period. Ho
m have also in
ree countries0.99, 13th), Japear period an
ndia’s SI decrhina greatly i
75 (15th) to easing more r
of relative c
icator of scieature relative
to take intos report, a srch are cited m
V presents ch over the 1
h with respecttzerland, whi
during which998–2000) to
ver that timeeak performa
n this categowed by Chile ower than thendia (14th, AR
n ics
astronomy &e top countrI over the peowever, Canacreased their
s that were nopan (SI=0.85
nd was speciareased over tincreased its
0.60 (15th). rapidly than i
citations (AR
ntific impactto the world
o account difscore above more often, othe trends 998–2009 pe
t to scientificich has an AR
h it respectiveo 1st (2001–2, with a stillance of 1.57 i
ory with an o(5th with a sce world avera
RC=0.58) and
& astrophysiries mentioneeriod, going fda is still lag
r SI over the 1
ot specialized5, 14th) and Calized in the mthe 12-year p
production This is du
its productio
RC)
t, as it indicad’s average. Tfferences in t
1 indicates on average, tin the ARC
eriod.
c impact. WitRC score of 1ely ranked 5th
003) over thl-noticeable iin 2001–2003
overall ARC core of 1.27) age for the 12
d Russia (15th,
ics research,ed above. It from 1.03 (1
gging behind 12-year perio
d in astronomChina (SI=0.6most recent tperiod, going
between 19ue to the facon in astrono
ates how ofteThis indicatothe citation p
that a couthan astronom of the top
th a score of 1.47 in the fieh and 6th. Cane 12-year perincrease from3.
of 1.31. Germ and the UK2–year period, ARC=0.57).
with an overis also inter
13th) in the 19leading coun
od.
my & astroph3, 15th). Japan
three-year perg from 1.09 98–2000 andct that Chin
omy & astrop
en a country’sor of citednepractices of suntry’s papermy & astrop
15 countrie
f 1.41 for the eld and ranksnada’s rankinriod. Canada
m 1.29 in 19
many ranks K (6th with a sd: Spain (12th
A Bibliometric
rall SI of 1.13resting to no998–2000 pentries in term
hysics amongn actually inriod (SI of 1.(11th) to 0.98d 2007–2009na’s total schysics resear
s papers are cess is normalscholars in drs in astronhysics paperes in astron
12-year perios first for all ng for this ina’s performan998–2000 to
4th, with an Ascore of 1.25h, ARC=0.96)
Analysis
8
3 (12th), ote that eriod to
ms of SI,
g the 15 ncreased
10). On 8 (14th). 9, its SI cientific ch.
cited in lized by ifferent omy & s at the
nomy &
od, it is but the
ndicator nce was 1.41 in
ARC of 5). Four , China

PerformResearc
Novemb© Scien
Table
Source:
It is inand amsomewtaking
2.2.6
The ARwhich editorsabove ARIF f
Canadastropevery 3Austrastable with S
Count
Switze
Canad
United
Germa
Chile
United
Austra
Nether
France
Italy
Japan
Spain
China
India
Russia
World
mance and Impach in Astronom
ber 2010 ce-Metrix Inc.
V Rank(ARC
: Calcu
teresting to nmong these, what stable. Ig back 2nd plac
Average o
RIF indicatesits papers a
s can be and1 means a c
for the top 15
da leads for thhysics, with t
3-year periodalia and the Uacross the di
Switzerland, J
try S
erland
da
d States
any
d Kingdom
alia
rlands
e
a
d
act of Canadianmy & Astrophys
king of leadC) in astrono
lated by Scienc
note that somGermany con fact, Germce in the last
of relative im
s the quality are published, therefore, t
country’s sco5 countries in
he quality of the highest As. With an ov
US, with respifferent perioJapan and Au
Score Rank
1.25 5
1.29 4
1.33 3
1.18 7
1.65 1
1.21 6
1.42 2
1.15 8
1.08 10
1.10 9
0.89 11
0.89 11
0.57 13
0.49 15
0.54 14
1.00
98-00
n ics
ding countromy & astro
ce–Metrix using
me countries ould overtake
many manageperiod.
mpact facto
of a countryd: the greaterhe greater thre is higher
n astronomy
the journalsARIF amongsverall ARIF o
pective scoresods, ranging fustralia for t
Score Ra
1.26
1.57
1.35
1.24
1.36
1.23
1.29
1.28
1.11
1.08
1.11
0.89
0.60
0.54
0.52
1.00
01-03
ies accordiophysics, 19
WoS
have increase Canada in d to overtake
ors (ARIF)
y’s research br the impact
he quality of than the wo& astrophysi
in which it pst the 15 lead
of 1.11, Canas of 1.09 (2nd)from 1.09 to he last perio
nk Score
6 1.62
1 1.36
3 1.27
7 1.37
2 1.09
8 1.27
4 1.08
5 1.24
9 1.18
11 1.11
9 1.08
12 1.03
13 0.78
14 0.67
15 0.61
1.00
04-0
ng to their 998–2009
ed greatly ththe coming e Canada for
based on the t factor of a the publishe
orld average.ics research o
publishes its ding countrie
ada achieves a) and 1.08 (31.14. Howev
od and Japan
Rank Sco
1 1.
3 1.
4 1.
2 1.
9 1.
4 1.
10 1.
6 1.
7 1.
8 1.
10 1.
12 1.
13 0.
14 0.
15 0.
1.
06 0
average of
heir ARC overyears if Can
r the 2004–2
impact factojournal, the
ed papers. InTable VI pre
over the 1998
research papes for the 12-a score slight3rd). Canada’s ver, Canada hn and Switzer
ore Rank
70 1
41 2
27 6
38 3
15 11
32 4
22 8
26 7
30 5
17 9
17 9
07 12
81 13
58 15
65 14
00
07-09
A Bibliometric
f relative cit
r the 12–year nada’s ARC r006 period, C
or of the joure more selectn both cases, esents the tre8–2009 period
pers in astron-year period tly higher tha
score was rehad to share 1rland rankin
Score Ran
1.47
1.41
1.31
1.29
1.27
1.25
1.24
1.24
1.15
1.11 1
1.05 1
0.96 1
0.69 1
0.58 1
0.57 1
1.00
Total
Analysis
9
tations
period, remains Canada
rnals in tive the a score
ends in d.
nomy & and for an both elatively 1st place gs have
nk
1
2
3
4
5
6
7
7
9
10
11
12
13
14
15

PerformResearc
Novemb© Scien
movedunchan
Overalfor thethe woperformscore o
Table
Source:
2.2.7
This sastronindicatcountrproducare thperform
Count
Canad
Austra
United
Switze
Chile
Japan
United
Nether
France
Italy
Germa
Spain
China
India
Russia
World
mance and Impach in Astronom
ber 2010 ce-Metrix Inc.
d upwards singed.
ll, four counte 1998–2009 orld average iming worse tof 0.89. Russi
VI Rankfacto
: Calcu
Multicrite
section preseomy & astrotors presenteries is obtainction, papers
hen ranked amances of th
try S
da
alia
d States
erland
d Kingdom
rlands
e
any
a
d
act of Canadianmy & Astrophys
nce 1998 an
tries amongsperiod—nam
in terms of Athan the woria ranks last,
king of leadors (ARIF) in
lated by Scienc
ria analysis
ents a multiophysics. Tabed previouslyned by coms per capita, Saccording to
he countries b
Score Rank
1.12 1
1.09 3
1.08 4
1.00 9
1.11 2
1.01 7
1.05 5
1.01 7
1.03 6
1.00 10
0.99 11
0.97 12
0.84 14
0.91 13
0.73 15
1.00
98-00
n ics
nd could pos
t the 15 leadmely Spain, CARC. Spain isrld, with an Awith an ARIF
ding countrn astronomy
ce–Metrix using
s
icriteria analble XI (see Ay for the 12-yputing theirSI, ARC and o this averagbased on the
Score Ra
1.14
1.08
1.08
1.03
1.08
1.04
1.06
1.03
1.01
1.01
0.99
0.97
0.89
0.85
0.74
1.00
01-03
ssibly pull ah
ding countrieChina, India as near the woARIF of 0.92F of 0.74.
ries accordy & astrophy
WoS
lysis of the ppendix A) s
year period onr average ranARIF), each ige score. Th
e volume (abs
nk Score
1 1.11
2 1.08
2 1.10
7 1.08
2 1.05
6 1.04
5 1.03
7 1.07
9 1.02
9 1.00
11 1.00
12 0.98
13 0.92
14 0.89
15 0.71
1.00
04-0
head of Cana
s have an ARand Russia. Torld level wit (13th), and I
ding to theirysics, 1998
performancsynthesizes tnly. In the mnk across alindicator hav
his analysis solute and re
Rank Sco
1 1.
3 1.
2 1.
3 1.
6 1.
7 1.
8 1.
5 1.
9 1.
10 1.
10 1.
12 1.
13 0.
14 0.
15 0.
1.
06 0
ada in the fu
RIF lower thaThese countrth a score of ndia follows
r average o–2009
ces of the tothe findings
multicriteria all five indicaving the samgives a glob
elative to a co
ore Rank
09 1
09 1
07 5
09 1
04 6
09 1
02 8
01 10
03 7
01 10
02 8
00 12
98 13
89 14
77 15
00
07-09
A Bibliometric
future if tren
an the world ries were also0.98 (12th). C in 14th place
of relative i
op 15 countfor each of t
analysis, the sators (i.e., sc
me weight. Cobal portrait ountry’s pop
Score Ran
1.11
1.09
1.08
1.06
1.06
1.05
1.04
1.03
1.02
1.00 1
1.00 1
0.98 1
0.92 1
0.89 1
0.74 1
1.00
Total
Analysis
10
nds stay
average o below China is e with a
impact
tries in the five score of cientific ountries
of the ulation
nk
1
2
3
4
5
6
7
8
9
10
11
12
13
14
15

PerformResearc
Novemb© Scien
size), sparam
Table Vfor theperform2nd for ranks 5China Althouexceptperiodhand eachievi2009 pincreassepara
Table
Note:
Source:
Canadoverallplace Nether
Rank
1
2
3
4
5
6
7
8
9
10
11
12
13
14
15
mance and Impach in Astronom
ber 2010 ce-Metrix Inc.
specializationmeters.
VII presents e 12-year permance is on the overall p
5th for the 19and India. T
ugh most couions. Switzer
d. Germany aexperienced ing a respectperiod. Chinsed its overa
ates it from so
VII Mult1998
It shourankin
: Calcu
da consistentll for the 12–for the 199rlands, Italy
98-00
United Kingdom
United States
Netherlands
Australia
Chile
France
Italy
Germany
Canada
Switzerland
Spain
Japan
Russia
India
China
act of Canadianmy & Astrophys
n, quality and
the trends inriod and ties a downward
period on a p998–2009 perThese latter cuntries did nrland started
also improvedan importanable 2nd place
na, despite iall ranking fome of the ot
icriteria ran8–2009
uld be noted thngs are not worllated by Scienc
ly ranks amo–year period. 98–2000 peri
and Austral
m United
United
Chile
Nether
Austra
France
Italy (6
Canad
Germa
Switze
Spain
Japan
Russia
China
India
n ics
d quantity o
n the multicrfor 1st place trend and thar with Chile
riod, ahead ofcountries occnot experiencd in 10th for d its performnt drop, goine overall, wents general im
from 15th to ther leading c
nking of 15
at these rankinld rankings as tce–Metrix using
ng the top nCanada gre
iod and reaia. Given tha
01-03
d Kingdom (1)
d States (1)
rlands
alia
e (6)
6)
da
any
erland
(11)
(11)
a
of their scient
iteria rankinwith the UK
he country one and Switzerf Italy (6th). Acupy the last ce major flucthe 1998-200
mance, going ng from 4th
nt from 5th fomprovement14th. Howev
countries.
5 leading c
gs are only validthey did not tak WoS
ine in astronatly improve
aching the 6at Canada ra
04-06
United Kingdo
United States
Switzerland (2
Netherlands (
Germany (4)
France
Italy
Chile
Canada
Australia
Japan
Spain
Russia
China
India
tific product
ng of the top K in the 2001nly ranks 5th rland, but 1st
At the end of five position
ctuations in 00 period anfrom 8th to 2to 9th over t
or the 1998–2t regarding aver, China ha
ountries in
d within the selke into account
nomy & astroed its rankin6th position anks high fo
om Unite
s (2) Switz
2) Germ
4) Franc
Unite
Cana
Italy
Austr
Nethe
Chile
Japan
Spain
Russ
China
India
tion, all of w
15 countries1–2003 perioin the last pein all the oth
f the list are Jans for all the
their rankinnd reached 22nd place. Authe 12-year p2000 period tall indicatoras begun to
astronomy
lected set of cothe remaining
ophysics reseang over the y
in 2007–20or its scientif
07-09
ed Kingdom
zerland (2)
many (2)
ce (2)
ed States
ada
ralia
erlands
n
n
sia
a
A Bibliometric
which are imp
s. The US ranod. However, eriod. The UKher periods. Capan, Spain, periods cons
ng, there wer2nd place for tustralia on thperiod. Chileto 10th for thers but the S
close the ga
y & astroph
ountries (i.e., thecountries).
arch, with a 5years, startin009, overtakific impact (2
Tota
United State
United Kingd
Switzerland
Chile (2)
Canada
Italy
Germany
France
Australia
Netherlands
Japan
Spain
Russia
China
India
Analysis
11
portant
nks first the US
K ranks Canada Russia,
sidered. re some the last
he other e, while e 2007–SI, only ap that
hysics,
ese
5th place g in 9th ing the 2nd) and
al
es
dom (2)
(2)

PerformResearc
Novemb© Scien
qualityamongCanadand itsits SI ito thisrank 3This mshare producto incr
To nuamulticoutput2009 pmanpoconditFrance
2.2.8
A posithe topand SIa two–than thThe leacountrimportpositioscientianothegraph
mance and Impach in Astronom
ber 2010 ce-Metrix Inc.
y (1st) with agst a select g
da back in thes score on pais lower than s indicator. In3th overall andmeans that C
of astronomction in all firease specializ
ance the anacriteria analyt of countriesperiod using ower for 200tions, Canadae (4th), a gain
Scientome
itional analysp 15 countrieI indicators, v–dimensionalhe world aveaders are in tries that are tant to takeons of differific productioer country wis proportion
act of Canadianmy & Astrophys
n appreciablgroup of leade multicriteripers per capithat of the o
n fact, if the d the top twanada could
my & astrophields) relativezation while
lysis of the psis was perfos relative to tdata on the
09 (the only a ranks 5th beof one rank o
etric positio
sis, as presenes in astronovalues centerl space. For terage, while athe top right
lagging are account of
rent countrieon, in which
with a similarnal to the scie
n ics
le volume of ders in astronia ranking arita. While Caother top con
SI was remowo positions w
improve its hysics researce to the worldmaintaining
performancesormed by repthe size of the scientific ouyear for whiehind Germaover Canada’
onal analys
nted in Figurmy & astrop
red on zero athe two indica value belowquadrant (hiin the lowethe number
es. A countryh case its over positioningentific outpu
f papers in thnomy & astrre its SI, and nada is specintenders, sucoved from thwould be occstanding in ch within itd. However, itg a high scien
s of countriesplacing the neir scientific utput of couch data on Iany and the s ranking usi
sis
re 2, presentshysics researre obtained, cators, a valu
w zero meansigh level of sp
er left quadrr of papers y in the toperall produc
g but greaterut.
he field, it carophysics resto a lesser ex
ialized in astrch that it ocche multicritercupied by thastronomy &
ts total scient should be n
ntific impact a
s in astronomnumber of pa
workforce. Tuntries relatiIAU memberUK (Tied ining papers pe
s another warch. Using log
allowing forue above zeros that the scopecialization
rant (not spepublished w
p right quadtion might n
r production.
an be concluearch. The oxtent, its totaronomy & ascupies the 12ria analysis, C
he US (1st) an& astrophysintific producnoted that it and/or scient
my & astrophapers per capThis was doneive to the sizrships is avai
n 1st place), Swer capita.
ay to look at g-transformer the positiono means thatore is lower thn and high levecialized and
when interprerant might hnot be as in. The size of
A Bibliometric
uded that Caonly factors hal number ofstrophysics re
th place with Canada wou
nd Switzerlancs by increasction (i.e., scis often challtific quality.
hysics, an addpita by the sce only for the
ze of their scilable). Undewitzerland (3
the performed forms of thning of countt the score ishan the worlvel of impactd low impaceting the reshave a low l
nfluential as f the bubbles
Analysis
12
anada is holding f papers esearch, respect
uld then nd (2nd). sing the cientific lenging
ditional cientific e 2007–cientific er these 3rd) and
mance of he ARC tries on s higher ld level. t), while t). It is spective level of that of
s in the

PerformResearc
Novemb© Scien
Figure
Source:
At firsthat arHowevoutputin the to inclare so Nether
Sci
entif
ic I
mpa
ct
mance and Impach in Astronom
ber 2010 ce-Metrix Inc.
e 2 Scieastro
: Calcu
t glimpse, it re not. Switzever, this resut among coupositional an
lude Canada,similar with rlands, Franc
Ch
-0.8
-0.6
-0.4
-0.2
0
0.2
0.4
0.6
0.8
-0.6
act of Canadianmy & Astrophys
entometric ophysics, 1lated by Scienc
is possible toerland comes
ult has to beuntries in thenalysis and g, Germany, threspect to th
ce, Australia,
hina
Jap
-0.4 -0.2
n ics
positional 1998–2009ce–Metrix using
o quickly ides out really se put into pe top right qugiving slightlyhe UK and thhese three inItaly and Ch
Cana
India
pan
0
S
World Level
analysis of9 WoS
entify those ctrong on thierspective, si
uadrant. Whey more weighhe US (in no dicators that
hile are also p
Aust
ada
Netherlands
Switze
US
0.2 0
Specialization I
l
f the top 15
countries thais radar, rankince Switzerlen combininht to the ARC
specific ordet their bubblerforming ve
ralia
France
Ger
s
Ru
Spain
erland
.4 0.6
Index
5 countries
at are performking highest land has the
ng the three iC than the SIer). The UK ales almost peery well. Over
C
e
rmany
Italy
ussia
UK
0.8
A Bibliometric
s in astrono
ming well anin scientific ie smallest scndicators preI, the leadersand Germanyerfectly overlarall, all of the
Chile
1 1.2
Analysis
13
omy &
d those impact. cientific esented appear y scores ap. The e top 10
World Level
PerformResearc
Novemb© Scien
countranalysi
Of theastropworld, astron
2.3 S
This seastropTable countrresearccollaboSwitzefrom 8Italy (1the 12–
On a betweerespectwith awere qto thistheir nsince 1in Figuinterna
mance and Impach in Astronom
ber 2010 ce-Metrix Inc.
ries from this.
e remaininghysics resear
it has the omy & astrop
Scientific c
ection providhysics researXII (see Ann
ries. The intech are geneorates the moerland (86.1%81% to 72%: G10th). All of th–year period.
national scalen at least ttively 51.8%
a national couite stable ov
s rule are Japanational colla1998, oscillature 3 for anational collab
act of Canadianmy & Astrophys
e multicriter
g countries, rch. While it lowest scienphysics.
collaborat
des an overvierch over thenex A) presenernational corally much ost internatio
%) and a grouGermany (4th)hese countrie. The same is
le, the US ratwo Americaand 51.7% o
ollaboration rver the years,an, Spain, Geaboration ratting between overall rate boration rate
n ics
ria ranking
Russia has has a high
ntific impact
ion of lead
ew on the lev 12–year per
nts the natioollaboration
higher thanonally, with aup of seven c), Spain (5th),
es have gradutrue for Japa
anks 1st, withan organizati
f their paperrate of 47.7% with small inermany, Russtes. Canada’s
18.9% (2001of 23.7% (1
es of Canada.
appear in th
one of the intensity of
t among the
ding countr
vel of scientifiriod and of
onal and interates of lead
n their respa rate of 95.0countries wit Australia (6t
ually increasean (11th), the U
h 52.1% of iions. Japan ars involving n%. Overall, thncreases for tsia, the US an yearly natio
1) and 27.4%3th place). Fi
he upper rig
least enviabresearch act
e top 15 pro
ries
fic collaboratibilateral col
ernational coding countriepective natio0%. It is followth internatioth), France (7t
d their internUS (12th) and
its papers beand Italy fonational collhe national cthe majority nd India, all nal collabora(2009) over
igure 3 prese
ght quadran
ble positiontivity in this oducers of s
ion of countllaborations ollaboration es in astrono
onal collabowed by the N
onal collaborth), Canada (8national collad China (14th)
eing the resuollow in 2nd laboration, acollaborationof leading coof which sig
ation rate hathe 12–year
ents trends i
A Bibliometric
nt of the pos
ns in astronoarea relative
scientific out
ries in astronbetween courates of the
omy & astroration rates
Netherlands (ration rates r8th), the UK (9aboration rat).
ult of a partnand 3rd plac
and China ran rates of coountries. Excgnificantly inas been ratheperiod as prein the nation
Analysis
14
sitional
omy & e to the tput in
nomy & untries. top 15 physics . Chile (87.9%), ranging 9th) and tes over
nership ce, with anks 4th, ountries eptions
ncreased r stable esented nal and

PerformResearc
Novemb© Scien
Figure
Source:
Of theinterna31.3%1
are thinternaOn theRussiadeterm
1 Data accomp
1
2
3
4
5
6
7
8
9
10
Collaboration rate
mance and Impach in Astronom
ber 2010 ce-Metrix Inc.
e 3 Trenastro
: Calcu
e 6,708 Canadational partn1 of Canada’se UK (11.9%ational collabe opposite sid
a (1.9%). Givmined by its A
a on Canada’spanying datab
0%
10%
20%
30%
40%
50%
60%
70%
80%
90%
00%
1998 199
act of Canadianmy & Astrophys
nds in the nonomy & alated by Scienc
dian papers pner. Canada’s bilateral col%), Germanyborators in ade, Canada h
ven the high ARC and ARI
s internationaook.
99 2000
National collab
n ics
national anastrophysicce–Metrix using
published fro’s main intellaborations.
y (8.0%), Franastronomy & has fewer coll
impact andF scores, Can
al collaborator
2001 2002
boration rate
d internatiocs, 1998–2
WoS
om 1998 to 2rnational coOther collab
nce (7.5%) aastrophysics
laborations wd quality of nada should c
rs are not pr
2003 20
Year
Inter
onal collab009
009, 5,249 (7ollaborator isborators, in dand Australias research arewith India (0the researchcontinue to c
resented in th
004 2005
rnational collab
boration rat
78.2%) were cs the US, whdescending oa (4.4%). The among the .8%) and Swi
h performed collaborate w
his report but
2006 2007
oration rate
A Bibliometric
tes of Cana
co–authored which accoun
order of impohus, Canada’
leaders in thitzerland (1.6
by Switzerlwith this coun
t are available
7 2008 2
Analysis
15
ada in
with an nted for ortance, ’s main
his field. 6%) and and, as ntry.
e in the
2009

PerformResearc
Novemb© Scien
Figurefigure astronthe netintegrahaving
Figureare disthe US
mance and Impach in Astronom
ber 2010 ce-Metrix Inc.
e 4 depicts theshows that thomy & astroptwork, since tated within tg links with 7
e 5 presents asplayed (i.e., aS, which is fol
act of Canadianmy & Astrophys
e collaboratiohe US is the mphysics reseathey are belohe internatio
70 countries i
n internationan egocentricllowed mostl
n ics
on network omain hub wi
arch, having lw the thresh
onal collaborin the networ
nal collaborac network). Thly by Europea
of countries ithin the intelinks with 11old of a thouation networrk.
ation networkhis network can countries.
in astronomyrnational sci1 countries (
usand collabork, being an i
k on which onclearly shows.
y & astrophysientific comm(some links aorations). Caimportant pa
nly Canada’ss that Canad
A Bibliometric
sics research.munity in are not displaanada is also wartner of the U
s collaborativa’s main part
Analysis
16
. This
ayed in well US and
ve links tner is

PeRe
No© S
FigNo
So
rformance and Impesearch in Astronom
ovember 2010 Science-Metrix Inc.
gure 4 Collote: The s
of thethous
ource: Calcu
pact of Canadian my & Astrophysics
laboration netsize of country nodee links is proportionasand papers betweeulated by Science–M
twork of countes is proportional to al to the number of en 1998 and 2009.Metrix using Wos
tries in astronthe total number ofcollaborations betw
nomy & astropf papers authored in
ween country pairs. L
physics researn international collabLinks are only displa
rch, 1998–200boration by the couayed when country
A Biblio
09 ntry over the periodpairs co–authored
ometric Analysis
17
d, and the width at least a

PeRe
No© S
FigNo
So
rformance and Impesearch in Astronom
ovember 2010 Science-Metrix Inc.
gure 5 Inteote: The s
of thepaper
ource: Calcu
pact of Canadian my & Astrophysics
rnational collasize of country nodee links is proportionars between 1998 anulated by Science–M
aboration netwes is proportional to al to the number of nd 2009. Metrix using Wos.
work of Canadthe total number ofcollaborations betw
da in astronomf papers authored in
ween country pairs. L
my & astrophyn international collabLinks are only displa
18
ysics researchboration by the couayed when country
A Biblio
h, 1998–2009ntry over the periodpairs co–authored
ometric Analysis
d, and the width at least two 90

PerformResearc
Novemb© Scien
3
Canadcompawhethedifferewhich
Table
Note: Source:
First owith oastrononly thgeneraastropastropcase of
mance and Impach in Astronom
ber 2010 ce-Metrix Inc.
Scientom
da’s standingarable (in terer astronomy
ent indicatoris based on t
VIII Num1998
The sc: Calcu
of all, these rnly one fieldomy & astrohe fields of g
al physics is hysics field. hysics field, f astronomy &
act of Canadianmy & Astrophys
metric pos
in astronomrms of size) y & astrophys for the 21
the number o
mber of pap8–2009
cale is not the slated by Scienc
esults show d, materials sc
physics fieldgeneral & inparticularly Papers fromthough not & astrophysi
n ics
sitioning o
my & astrophand/or relate
ysics research subfields in
of papers, the
pers, SI, AR
same across coce–Metrix using
that Canadacience, havin
d ranks 3rd in nternal medic
interesting m the general
by a wide mcs, Canada is
of Canada
hysics was ced disciplineis an area of
n Canada, ane SI and the A
RC and AR
ountries. WoS
a in general png a smaller s
terms of ARcine and genhere, since il physics fiel
margin (ARC s not specializ
a in 21 sc
ompared to es as definedf strength fornd Figure 6 pARC.
IF of Canad
produces papscientific imp
RC for the whneral physics.it is somewhld are more of 1.47 versuzed in genera
cientific s
its standingd by the NSFr Canada. Tabpresents the
da in 21 sc
pers with higpact than thehole period (1. The Canadhat linked tocited than in
us 1.41). Howal physics.
A Bibliometric
subfields
g in a samplF to help detble VIII presepositional a
cientific sub
gh scientific ie world avera1998–2009),
dian performo the astronn the astronwever, unlike
Analysis
19
e of 20 termine ents the analysis,
bfields,
impact, age. The trailing ance in
nomy & nomy & e in the

PerformResearc
Novemb© Scien
Figure
Source:
When astropCanadscientilimnolbut smits ARCsame cslightlyFinallythose special
-0
-0
0
0
0
0
0
0
0Sc
ien
tifi
c Im
pac
t
mance and Impach in Astronom
ber 2010 ce-Metrix Inc.
e 6 Sciecom
: Calcu
looking at hysics field (
da’s performaific impact (Flogy and eart
maller scientifC in the astrocan be said foy above worly, Canada’s prelated to a
lized and low
Organi
Solid State P
0.2
0.1
0
0.1
0.2
0.3
0.4
0.5
0.6
0.7
-0.8
act of Canadianmy & Astrophys
entometric mpared to 2
lated by Scienc
the fields thi.e., related dance is stronFigure 6). Inth & planetafic impact. Inonomy & astor the Fluidsld average, yepoorest perfoastronomy &
w scientific im
Fluids & Plas
General P
Mat
ic Chemistry
Physica
Physics
-0.6
n ics
positional 20 NSF subce–Metrix using
hat were seldisciplines), angest, with
n comparisonary sciences hn the case of trophysics fie & Plasmas f
et it is far froormance is in& astrophysimpact).
smas
General
hysics
I
terials Science
Optic
al Chemistry
-0.4
analysis ofbfields for C WoS
lected based astronomy &
a combinatin, the fields have higher Sf solid state peld, but Canafield, in whicom Canada’s n materials scs to be loc
C
l Mathematics
mmunology
cs
Pharmacolo
-0.2Specialization
Wo
f astronomCanada, 1
d on naturalastrophysics
ion of a strof environmSI than the a
physics, the Aada is not spech Canada is
ARC in the science, whiccated in the
Agricult &Sci
AstronomAstrophy
Bo
ancer
Computers
Genrl & IntMed
Meogy
0Index
orld Level
my & astrop998–2009
l linkages tos stands out arong speciali
mental scienceastronomy &
ARC of Canaecialized in tnot specializastronomy &
ch is the onle lower left
& Food i
my & ysics
otanyEa
En
ternal
eteorol & Atmos S
Oceanograph
0.2
A Bibliometric
physics
o the astronas the area inization and es, oceanogra
& astrophysicada is pretty cthe former arzed and has a& astrophysicly discipline quadrant (i
arth & Plantry Sci
nvironmental Sci
Geolog
Sci
hy & Limno
0.4
Analysis
20
omy & n which
a high aphy & cs field, close to rea. The an ARC cs field. among .e., not
gy
0.6
World
Level

PerformResearc
Novemb© Scien
It is acompaas theastropIn termwithinCanadthe caCanadeven w
mance and Impach in Astronom
ber 2010 ce-Metrix Inc.
also interestinarable size toir bubble sizhysics ranks ms of SI, ast
n 20% of theda’s output in
se for many da is strong iwhen compare
act of Canadianmy & Astrophys
ng to take a the astronoze is compar3rd in terms o
tronomy & ae size of the n astronomy
of the 20 oin astronomyed to other d
n ics
a quick lookmy & astroprable to thatof ARC in thiastrophysics
astronomy & astrophys
other subfieldy & astrophy
disciplines of
k at the othphysics field. t of the astris category, branks 2nd wh& astrophys
sics has beends (Table VIIysics researchcomparable
her fields thaThese fields
ronomy & asbehind the sahen taking isics field size
n increasing sII). Overall,
h when compsize to the as
at were selecare easily idestrophysics f
ame two fieldinto accounte, behind gesteadily sinceit can safelypared to relastronomy & a
A Bibliometric
cted based oentified in Fifield. Astron
ds mentionedt the fields teology. In ade 1998, whichy be concludated disciplinastrophysics
Analysis
21
on their igure 6,
nomy & d earlier. that are ddition, h is not ed that nes and field.

PerformResearc
Novemb© Scien
4 a
This seastronare womost (
4.1 T
This sresearcorganiauthor
As mencollabopredomorganiFourtescientiwith Corganipapersis 2nd, wHarvarhave hthese 2in the 20 org
mance and Impach in Astronom
ber 2010 ce-Metrix Inc.
Benchmaastrophys
ection presenomy & astro
orking the moranked on nu
Top collab
section provich in regard tizations withred papers, ar
ntioned earliorations areminant partizations thateen out of Caific productioCanadian orization. Hows, is the Centrwith 664 co-ard-Smithsoni
high scientific20 organizatiworld based anizations in
act of Canadianmy & Astrophys
arking of lsics
nts Canada’s physics reseaost internatioumber of co-
borators of
ides informato their prod
h which Canre presented
ier, Canada he with the tners of Cat collaborate anada’s 20 toon, the Univrganizations,
wever, Canadare National dauthored papian Center foc impact, witions are amoon scientific
n the world ca
n ics
leading o
top collaborarch. In orderonally, a list oauthored pap
Canada
ation on Cauction, scienada collaborin Table IX.
has a high inUS. Conse
anadian orgathe most w
op partners versity of Wa with 15%
a’s main collde la Rechercpers, followeor Astrophysh ARC and A
ong the top 2c production an also be co
organizati
ators (Sectior to identify wof world instpers) was pro
nada’s top cntific impact rates the mo
nternational quently, USanizations. T
with Canada are American
ashington anof their paaborator, ba
che Scientifiqd by the Cali
sics and JohnARIF scores b20 organizati
(See Table Xnsulted in An
ions in as
on 4.1) and towith whom Ctitutions withoduced (Secti
collaboratorsand internat
ost internatio
collaborationS organizatiTable IX liin the field
n organizationd Durham Uapers being ased on the aque (CNRS) (ifornia Instit
ns Hopkins Uboth above thions in astro
XIII in Annexnnex A (Figu
stronomy
op organizatiCanadian asth which Canaion 4.1).
s in astronotional collaboonally, based
n rate, and aions should ists the top
d of astronoons. In perceUniversity coco-authored
absolute num(682 co-authtute of TechnUniversity. Alhe world levenomy and as
x A: a networkure 8)).
A Bibliometric
&
ions (Sectiontronomy reseada collabora
omy & astroorations. Thed on number
a large part onormally
p 20 internmy & astrop
entage of theollaborate th
d with a Camber of co-au
ored papers)nology (CALTll five organiel. Overall, 14strophysics rk between th
Analysis
22
n 4.2) in earchers ates the
physics e top 20 r of co-
of these be the
national physics. eir total he most anadian uthored . NASA TECH), izations 4 out of research hese top

PeRe
No© S
Ta
NoSo
R
rformance and Impesearch in Astronom
ovember 2010 Science-Metrix Inc.
able IX Scie
ote: Rankource: Calcu
Rank Orga
1 Unive
2 Durha
3 Unive
4 Unive
5 Princ
6 Johns
7 Unive
8 Unive
9 Natio
10 US D
11 NASA
12 Unive
13 Unive
14 CALT
15 Unive
16 ESO-
17 Harva
18 CNRS
19 Obse
20 NASA
21 Istitut
pact of Canadian my & Astrophysics
entific performa
s are based on the ulated by Science–M
anization
ersity of Washington
am University
ersity of Chicago
ersity of California, Santa
ceton University
s Hopkins University
ersity of Oxford
ersity of California, Los A
onal Science Foundation
Department of Energy
A, Space Telescope Scie
ersity of Arizona
ersity of California, Berke
TECH-California Institute
ersity of Cambridge
-European Southern Obs
ard-Smithsonian Cfa
S-Centre National de la R
ervatoire de Paris
A
to Nazionale di Astrofisic
ance of foreign
percentage of papeMetrix using WoS
a Cruz
Angeles
ence Institute
eley
of Technology
servatory
Recherche Scientifique
ca
organizations w
ers with a Canadian
TotalCo-authowith Can
1,338
1,358
1,777
1,938
2,006
3,197
2,052
2,077
2,557
3,520
3,276
3,987
4,063
7,631
4,232
3,781
6,185
10,360
4,424
10,782
8,478
with which Can
contribution.
ored nada
% of papeCanadian con
202
200
200
212
216
343
215
213
251
302
280
336
335
608
312
269
422
682
275
664
311
Pa
nada collabora
rs with atribution
Co-authforeign o
15%
15%
11%
11%
11%
11%
10%
10%
10%
9%
9%
8%
8%
8%
7%
7%
7%
7%
6%
6%
4%
apers
ates the most, 1
ored with a rganization
Incollab
844
1,152
1,039
1,190
1,170
2,096
1,630
1,225
1,747
2,062
2,325
2,295
2,476
4,610
3,172
3,572
4,016
8,112
3,681
6,104
6,560
A Biblio
1998–2009
nternational boration rate
63.1%
84.8%
58.5%
61.4%
58.3%
65.6%
79.4%
59.0%
68.3%
58.6%
71.0%
57.6%
60.9%
60.4%
75.0%
94.5%
64.9%
78.3%
83.2%
56.6%
77.4%
Scienti
ometric Analysis
23
ARC ARIF
2.18 1.17
2.40 1.09
2.37 1.14
2.06 1.13
2.65 1.17
1.99 1.13
1.71 1.15
1.85 1.13
1.32 1.16
1.66 1.08
1.88 1.20
1.87 1.17
1.92 1.08
1.79 1.16
1.68 1.08
1.47 1.00
1.60 1.10
1.20 1.03
1.09 0.95
1.44 1.08
1.17 1.00
fic impact/quality

PerformResearc
Novemb© Scien
Some still amDurhaUniverinstitu
Princeby Dur2.37. OObservInstituand than ARIwith a
4.2 C
This seresearcpresen
The UpapersUniverthe CaBritish
The leexpectInstituInstituscore oimprovToron(both aterms
2 The Astrophindivid
mance and Impach in Astronom
ber 2010 ce-Metrix Inc.
organizationmong Canad
am Universityrsity, the Unutions publish
ton Universitrham Univer
Overall, all of vatoire de Paute is 1st withhe University IF above or oscore of 0.95
Canadian o
ection providch in regard
nts the top 20
University of s for the 199rsity of Victoanadian Instih Columbia (5
eading organed scientific
ute for Theorute for Theorof 1.91 and tved by the Cato. Out of that the Univerof ARIF for
University ofhysics. Howev
dual organizati
act of Canadianmy & Astrophys
ns are not amda’s top 20 y, the Univer
niversity of Ohed more tha
ty is Canada’sity, with a sc
f Canada’s topris ranking la
h a score of 1of Arizona t
on world leve5.
organizatio
des informatto their prod
0 Canadian or
Toronto2 is 98–2009 periria produceditute for The5th, 564 paper
nization for timpact mo
retical Physicsretical Astropthe Universitanadian Instihe top five orrsity of Toronr the whole p
f Toronto scover, since this ion to provide
n ics
mong the topcollaborator
rsity of ChicaOxford and tan 2,000 pap
’s top collabocore of 2.40. p 20 collaborast with a sco1.20, followedied in 2nd, wiel with the ex
ons
ion on Canaduction, scierganizations
the leading iod. It is foll
d 616 papers deoretical Astrrs).
the ARC indore than twos ranks 2nd, wphysics (1.97ty of Torontoitute for Therganizations, nto). Naturalperiod, with
ore includes institute is a a better descr
p 20 in the wrs. This is thago, the Univthe Universiters and have
orator with thThe Universi
rators have anore of 1.09. Ind by the Unith a score of xception of t
adian leadingentific impac.
Canadian olowed by theduring the sarophysics (C
dicator is theo times abovwith an ARC o7). The Univo rounds ouoretical Astrotwo are loca
l Resources Ca score of 1
papers produmajor player
ription of the m
world based ohe case for
versity of Calty of CalifornARC and AR
he highest ARity of Chicagn ARC well an terms of ARiversity of Wf 1.17. All of the Observat
g organizatiot and intern
organization e NRC, whicame period aITA) (4th, 59
e University ve the worldof 2.19, follo
versity of Vict the top 5 wophysics whi
ated in BritishCanada ranke1.52. York U
uced by the Cin the field in
main Canadian
on scientific the Universifornia at Sania at Los A
RIF scores abo
RC with a scogo rounds outabove the worRIF, the Spac
Washington, PCanada’s top
toire de Paris
ns in astronoational colla
in terms of ch published
and ranks 3rd 8 papers) an
of British Cd average (2.wed in 3rd pla
ctoria comes with 1.69, a sich is locatedh Columbia
ed 1st among University an
Canadian Insn Canada, it w
an players in th
production ity of Washnta Cruz, Pri
Angeles. All oove the world
ore of 2.65, fot the top threrld average, wce Telescope Princeton Unp collaboratos, again ranki
omy & astroaborations. T
f papers, withd 1,119 papein Canada, a
nd the Unive
Columbia. It .45). The Peace by the Cain 4th place,
score that is d at the Unive
and two in OCanadian lead the Unive
stitute of Thewas also rankehe field.
24
but are hington, inceton
of these d level.
ollowed ee, with
with the Science
niversity ors have ing last
physics Table X
h 1,371 ers. The head of
ersity of
has an rimeter
anadian with a greatly
ersity of Ontario aders in rsity of
eoretical ed as an

PerformResearc
Novemb© Scien
Britishof Tor
Table
Note: Source:
When organicollaboan intepublishpapers
Figure& astrois strothat CHowevtie andare therole wiNRC a
Rank
1
2
3
4
5
6
7
8
9
10
11
12
13 Y
14
15
16
17
18
19
20
mance and Impach in Astronom
ber 2010 ce-Metrix Inc.
h Columbia ronto ranked
X Papeorga
Ranks: Calcu
looking at tization. The oration rate oernational pahed with an
s (79%).
e 7 presents thophysics resengly tied to
CITA is part ver, the Unived the same cae main compithin the netw
as a collabora
Organization
University of Toront
National Research
University of Victor
Canadian Institute
University of British
Université de Mont
University of Calga
University of Weste
McMaster Universi
McGill University
University of Water
University of Albert
York University
Queens University
St Mary's Universit
Observatoire du Mo
Université Laval
Perimeter Institute
University of Saska
Natural Resources
act of Canadianmy & Astrophys
ranked 2nd, tie5th, tying Mc
ers, ARC, anizations in
s are based on lated by Scienc
the internatileader amo
of 88%. Howartnership, thinternationa
he collaboratearch. The mthe Canadiaof the Univeersité de Monan be said of ponents of thwork of worl
ator with oth
to
Council Canada
ria
for Theoretical Ast
h Columbia
réal
ry
ern Ontario
ty
rloo
ta
ty
ont Megantic
for Theoretical Phy
atchewan
Canada
n ics
ed with a scocMaster Univ
ARIF an Canada, 1
the total numbece–Metrix using
onal collaboong this toever, in termhe University
al collaborato
tion networkain hub in th
an Institute fersity of Torntréal and thNRC and th
he Canadian ld-leading iner Canadian
Tot
1,3
1,1
6
rophysics 5
5
5
4
3
3
34
3
3
2
2
2
2
14
ysics 1
1
re of 1.21, foversity and Qu
nd internat998–2009
er of published WoS
oration rates,op 20 is St
ms of the absoy of Torontoor for a rate o
k among the the Canadian for Theoreticronto). Therehe Observatoie University network, whstitutions. Itorganization
talCo-author
foreign org
71
19
16
98
64
06
02
71
52
41
14
03
20
08
05
04
42
30
18
91
ollowed by thueen’s Unive
tional colla
papers in astro
, the scores dMary’s Un
olute numbero is the leaderof 81%. The N
top 20 Canadnetwork is t
cal Astrophyse are no cleaire du Mont of Toronto. A
hereas governt is interestinns.
red with a ganization co
1,107
887
519
482
474
429
306
278
275
288
213
206
184
164
181
159
103
88
97
69
Papers
e NRC (4th, 1rsity with a s
aborations
onomy & astrop
differ greatlyniversity withr of papers cor, with 1,107
NRC is 2nd, wi
dian organizathe Universitysics (this is nar clusters wMégantic arAlso, it appe
nment institung to note the
International ollaboration rate
81%
79%
84%
81%
84%
85%
76%
75%
78%
84%
68%
68%
84%
79%
88%
78%
73%
68%
82%
76%
1.20). The Unscore of 1.12.
for 20 le
physics.
y depending h an interno-authored th
7 of its paperith 887 co-au
ations in astry of Toronto
not surprisinwithin this nre linked by aears that univutions play a e smaller role
ARC
1.69
1.33
1.91
1.97
2.45
0.88
0.74
0.89
1.60
1.17
1.20
1.33
1.59
1.32
0.87
0.98
1.16
2.19
0.79
1.46
Scientific impa
25
niversity
eading
on the national hrough
rs being uthored
ronomy o, which ng given
etwork. a strong versities
greater e of the
ARIF
1.12
1.20
1.11
1.08
1.21
1.04
1.06
1.03
1.12
1.03
1.08
1.04
1.21
1.12
0.99
1.10
1.08
1.03
1.03
1.52
act/quality

PeRe
No© S
Fig
No
So
rformance and Impesearch in Astronom
ovember 2010 Science-Metrix Inc.
gure 7 Natrese
ote: The scollab
ource: Calcu
pact of Canadian my & Astrophysics
ional collaboraearch, 1998–2size of nodes is propborations between iulated by Science–M
ation network2009 portional to the totanstitution pairs.
Metrix using WoS
k of the 20 lea
l number of papers
ding Canadia
by the institution ov
n organization
ver the period, and t
26
ns in astronom
the width of the link
A Biblio
my & astrophy
ks is proportional to
ometric Analysis
ysics
the number of

PerformResearc
Novemb© Scien
5
The Non thebibliomperiodon cou
th
th
th
th
th
th
th
In partquestio
1) Wteinim
2) Was
3) Isco
4) Wth
Questi
Canadperiodthat ofbibliommulticthe USbibliomresearcthe AR12–yeaCanad
mance and Impach in Astronom
ber 2010 ce-Metrix Inc.
Conclusi
RC sought de astronomymetric analys
d (1998–2009unts of scient
he number of
he number of
he specializat
he average of
he average of
he internation
he national co
ticular, the dons:
What is Canaderms of quantndex) and sciempact factors
What is Canadstrophysics? research in a
omparable (inWith whom arhese collabora
on 1
da contributed analyzed in f the top 15 pmetric indiccriteria rankinS, the UK, Swmetric indicach quality, esRC indicator.ar period exada’s ARC rem
act of Canadianmy & Astrophys
ion
data that wouy & astrophsis of astrono
9). This analytific papers an
f papers;
f papers per c
ion index (SI
relative citat
relative impa
nal collabora
ollaboration
data produced
da’s ranking atity (e.g., numentific impacs)? da’s positioni
astronomy &n terms of sizre Canadian aators among
d to approxithis report. C
producers of ators (i.e., nng uniting al
witzerland anators pertainistimated usin It should be
amined—amoains stable, a
n ics
uld lead to a ghysics disciplomy & astropysis relied onnd citations t
capita
I);
ions (ARC);
act factors (A
ation rate; and
rate.
d by Science-
among leadinmber of papect/quality (e.g
ing within th
& astrophysicsze) and/or relastronomy rethe world lea
mately 4.7% Canada’s perscientific pap
number of pll five indicat
nd Chile. It ising to scienting the ARIF e noted that song these, Gas is suggested
greater undeline. To fulfphysics resea a set of biblto papers. Th
ARIF);
d
-Metrix will s
ng countries rs, papers perg., indicators
he internation
s a strength flated discipliesearchers woaders in the f
of world astrrformance inpers in the aspapers, papetors, Canada s noteworthy fic quality anindicator, ansome countr
Germany, coud in this stud
erstanding offill this neearch in Canaliometric indhese indicato
support the N
in astronomr capita), spebased on cit
nal collabora
for Canada wines? orking the mfield?
ronomy & asn astronomy &stronomy & aers per capi
a ranked 5th fothat Canada
nd impact. Fond 2nd in scieries have greauld overtake dy. If the SI, t
f the impact od, Science-M
ada and the wdicators that rs are:
NRC in answ
my & astrophyecialization (etation counts
ation network
when compare
most internati
strophysics p& astrophysiastrophysics ita, SI, ARCor the 1998–a performed or instance, Centific impacatly increased
Canada in tthe indicator
A Bibliometric
of Canadian Metrix conduworld over a
are primarily
wering the fol
ysics researche.g., specializas and journal
k in astronom
ed to a set of
onally, and a
papers in the ics was compdiscipline us
C and ARIF–2009 period
best with resCanada ranket, as measure
d their ARC othe coming yr for which C
Analysis
27
science ucted a 12-year y based
llowing
h in ation
my &
f
are
12-year pared to
ing five ). In a behind
spect to ed 1st in ed with over the years if anada’s
PerformResearc
Novemb© Scien
performbehindin astryears. Cleaderstakingper caanalysiastronall fielspecialreplacitheir smulticfor oth
Questi
Amongare co-Canadcollabowhich the sizcommintegrahaving23.7%
Questi
CanadcompawhetheCanadinformwere sdisciplstrongrelatedastropspecialscience
mance and Impach in Astronom
ber 2010 ce-Metrix Inc.
mance is thed the US andronomy & asCanada ranks, it has had t
g population pita, and this, Canada coomy & astrods) relative tlization whiling the numbscientific worcriteria rankinher periods).
on 2
g the world l-authored wit
da’s main coorations. Othare in the to
ze of its scieunity in astated within tg links with (13th) for the
on 3
da’s standingarable (in terer astronomy
da in each omation providselected baselines), astron
gest, with a cd area in whihysics, Canalized in the fies than in as
act of Canadianmy & Astrophys
e weakest, wd Switzerlandstrophysics rked 10th for ththe fifth highinto accountis ranking would improvephysics resea
to the world.le maintaininber of papersrkforce, as eng moving fr
leading counth at least onollaborator her importanop 15 producentific produronomy & ahe internatio70 countries12–year peri
in astronomrms of size) y & astrophyf these areas
ded by the nued on natu
nomy & astrcombinationch Canada’s
ada is not spfields of envirtronomy & a
n ics
was removed d. Although C
elative to thhe volume ofhest increase t, Canada ran
was quite stae its standingarch within it However, it ng a high scs per capita bstimated usirom 6th to 5th
ntries, Canadane internation
was the Unt collaboratcers of scientuction, the Uastrophysics,onal collabors in the netwiod.
my & astrophand/or relateysics researchs was assessumber of papral linkages ophysics sta
n of a strongimpact is str
pecialized inronmental scastrophysics,
from the mCanada rankee world and f its scientificin scientific
nked 9th for table over theg in astronomts total scient
should be ncientific impby the scientiing IAU memh place for th
a ranked 8th inal partner (aS, which a
tors were thetific papers inUS is the m
having linkation networwork. Canad
hysics was ced disciplineh is an area oed through
pers, the SI ato the ast
nds out as tg specializatirongest is in
n general phyiences, oceanbut it has a
ulticriteria aed 12th with r
its SI has bc productionproduction o
the 1998–200e 12-year permy & astrophtific product
noted that it pact and/or sific output ofmberships, C
he 2007–2009
in terms of tan internatio
accounts fore UK, German the A&A d
main hub witks with 111rk, being an i
da also had a
ompared to es as definedof strength fa positional
and the ARC. ronomy & the area in wion and a hgeneral phys
ysics. On thnography & lsmaller scien
analysis, Canrespect to the
been increasinn (6,708 papeover the peri09 in terms oriod. Based ohysics by inction (i.e., scien
is often chascientific quf countries re
Canada gaine9 period (dat
the proportioonal collaborar 31.3% of any, France adiscipline. As thin the inte
countries. Cimportant paa national co
its standingd by the NSFfor Canada. Tl analysis, w When lookiastrophysicswhich Canadigh scientificsics. Yet, unl
he other hanlimnology anntific impact
A Bibliometric
nada would re SI, it is specng over the pers) and, amood examined
of number ofon the multireasing the sntific produc
allenging to iuality. Finallyelative to theed one placea were not av
on of its papeation rate of Canada’s b
and Australiawas expecte
ernational scCanada is alartner of the ollaboration
g in a samplF to help detThe perform
which combinng at the fiel
s field (i.e., da’s performc impact. Thlike in astron
nd, Canada ind earth & plt in these disc
Analysis
28
rank 3rd cialized past 12 ong the
d. When f papers icriteria share of ction in increase y, when e size of e in the vailable
ers that f 78.2%). bilateral a, all of d given
cientific lso well US and rate of
e of 20 termine ance of nes the lds that related
mance is he only nomy & is more anetary ciplines

PerformResearc
Novemb© Scien
as wellsize topapersranks internaastronother d
Questi
CanadRecherSmithsof thesscientiastropcollabopapersmost amany have Aquality
mance and Impach in Astronom
ber 2010 ce-Metrix Inc.
l. Finally, am astronomy &
s, 8th for spec3rd in terms al medicine omy & astrodisciplines of
on 4
da’s main intrche Scientifisonian Centese organizatioific impact. Thysics and aoration netws). In additioare among thAmerican un
ARC and ARy research.
act of Canadianmy & Astrophys
mong all of th& astrophysicialization anof ARC for and general
ophysics resef comparable
ernational coique (CNRS)er for Astropons have per
They are alsoare (especiallyworks of then, fourteen o
he top 20 organiversities. Fi
RIF above the
n ics
he subfields ucs research),
nd 3th for sciethe whole pphysics. Tharch when c
e size to astro
ollaborator f. NASA, the Chysics and Joformed well
o among the y NASA ande 20 leadingout of the toanizations, aginally, all of e world level
used in this astronomy &entific impac
period (1998–hus, it can sa
ompared to onomy & astr
for the 1998-California Inohns Hopkinin astronomtop 10 instit
d the CNRS) internatio
op 20 organizgain based onCanada’s 20
l, which indi
comparison & astrophysicct. Also, the –2009), trailiafely be conc
related discirophysics.
-2009 periodnstitute of Tens follow as C
my & astrophytutions prod
important pnal organizazations withn scientific ptop collabor
icates that C
(including tcs ranks 13th astronomy &
ing only the cluded that Ciplines, even
d was the Ceechnology (CACanada’s maiysics research
ducing the mplayers withiations (in te
h which Canaproduction, arators, with
Canada’s part
A Bibliometric
hose of comfor total num
& astrophysifields of gen
Canada is strwhen comp
entre NationaALTECH), Hin collaborat
h and have haost in astronin the internerms of numada collaboraand among thonly one exctners perform
Analysis
29
parable mber of ics field neral & rong in ared to
al de la Harvard-tors. All ad high
nomy & national mber of ates the hese are ception, m good

PerformResearc
Novemb© Scien
Appe
Table
Note: Source:
mance and Impach in Astronom
ber 2010 ce-Metrix Inc.
endix A –
XI Scieastro
The sc: Calcu
act of Canadianmy & Astrophys
Supplem
ntific perfoophysics, 19
cale is not the slated by Scienc
n ics
mentary Ta
rmance of 998–2009
same across coce–Metrix using
ables and
the world
ountries. WoS
d Figures
d’s top 15
s
countries
A Bibliometric
in astrono
Analysis
30
omy &

PeRe
No© S
Ta
So
Co
Ch
Ne
Sw
Ge
Sp
Au
Fra
Ca
Un
Ita
Ja
Un
Ru
Ch
Ind
rformance and Impesearch in Astronom
ovember 2010 Science-Metrix Inc.
able XII Nati
ource: Calcu
ountry N
hile 13
etherlands 28
witzerland 17
ermany 19
pain 27
ustralia 24
ance 31
anada 23
nited Kingdom 23
aly 49
pan 47
nited States 47
ussia 17
hina 49
dia 21
pact of Canadian my & astrophysics
onal and intern
ulated by Science–M
Natl. Rank Int.
3.9% 15 90.3%
8.2% 6 86.1%
7.9% 13 80.0%
9.9% 12 77.8%
7.4% 7 73.4%
4.4% 8 77.5%
.9% 5 72.4%
3.1% 9 72.8%
3.1% 9 70.2%
9.1% 2 68.6%
7.8% 3 48.4%
7.5% 4 51.4%
7.7% 14 57.1%
9.5% 1 41.8%
.0% 11 44.1%
98-00
national collabo
Metrix using WoS
Rank Natl. Ra
1 13.0%
2 28.4%
3 13.6%
4 21.6%
6 30.2%
5 26.7%
8 34.3%
7 22.0%
9 24.5%
10 48.2%
13 49.2%
12 51.0%
11 24.1%
15 48.4%
14 27.5%
oration rates of
ank Int. Rank
15 94.6% 1
7 87.5% 2
14 81.1% 3
13 78.1% 5
6 80.2% 4
9 78.1% 5
5 75.4% 8
12 77.0% 7
10 74.0% 9
4 70.5% 10
2 57.6% 11
1 54.3% 13
11 55.8% 12
3 44.6% 14
8 43.4% 15
01-03
15 leading cou
Natl. Rank
13.3% 15 95
26.2% 10 87
16.0% 14 88
24.1% 12 83
31.4% 7 83
27.6% 9 77
37.4% 5 80
23.0% 13 78
26.2% 10 75
53.0% 1 72
52.1% 3 59
52.3% 2 57
27.9% 8 56
44.8% 4 52
32.0% 6 49
04-06
untries in astro
Int. Rank Natl
5.3% 1 19.5%
7.4% 3 27.8%
8.5% 2 16.8%
3.0% 5 27.4%
3.1% 4 33.9%
7.6% 8 25.0%
0.5% 6 42.7%
8.2% 7 25.5%
5.6% 9 28.5%
2.6% 10 54.9%
9.9% 11 56.2%
7.2% 12 56.1%
6.7% 13 27.5%
2.3% 14 48.6%
9.1% 15 35.7%
onomy & astrop
l. Rank Int. Ra
% 14 96.7%
% 9 90.1%
% 15 89.8%
% 11 84.1%
% 7 83.8%
% 13 84.6%
% 5 82.9%
% 12 82.1%
% 8 79.7%
% 3 77.8%
% 1 65.6%
% 2 61.6%
% 10 54.6%
% 4 55.9%
% 6 48.9%
07-09
A Biblio
physics, 1998–
ank Natl. Rank
1 15.4% 15
2 27.6% 8
3 16.1% 14
5 23.8% 12
6 31.2% 6
4 26.0% 9
7 37.4% 5
8 23.7% 13
9 25.9% 10
10 51.7% 3
11 51.8% 2
12 52.1% 1
14 24.7% 11
13 47.7% 4
15 30.2% 7
T
ometric Analysis
31
2009
k Int. Rank
95.0% 1
87.9% 2
86.1% 3
81.2% 4
80.9% 5
79.8% 6
78.6% 7
78.2% 8
75.4% 9
72.9% 10
58.7% 11
56.6% 12
55.9% 13
50.6% 14
46.9% 15
Total

PerformResearc
Novemb© Scien
Table
Note: Source:
Rank
1
2
3
4
5
6
7
8
9
10
11
12
13
14
15
16
17
18
19
20
mance and Impach in Astronom
ber 2010 ce-Metrix Inc.
XIII Papeinter
Ranks: Calcu
Organization
NASA
CNRS-Centre Nat
Istituto Nazionale
CALTECH-Califor
Harvard-Smithson
Russian Academ
Observatoire de P
Chinese Academ
University of Cam
University of Calif
University of Arizo
ESO-European S
US Department o
Los Alamos Nat
Lawrence Liverm
Fermilab
Lawrence Berke
SLAC
Argonne Nationa
Oak Ridge Natio
NASA, Space Te
Johns Hopkins Un
CSIC
Max Planck Instit
National Science
European Norther
National Astronom
act of Canadianmy & Astrophys
ers, ARC, national org
s are based on lated by Scienc
tional de la Reche
e di Astrofisica
rnia Institute of Tec
nian Cfa
y of Sciences
Paris
y of Sciences
mbridge
fornia, Berkeley
ona
Southern Observato
of Energy
tional Laboratory
more National Lab
eley National Labo
al Laboratory
onal Laboratory
lescope Science
niversity
tute for Extraterres
Foundation
rn Observatory
mical Observatory
n ics
ARIF and ganizations
the total numbece–Metrix using
erche Scientifique
chnology
ory
oratory
oratory
Institute
strial Physics
of Japan
internationin astronom
er of published WoS
nal collabomy & astrop
papers in astro
Papers ARC
Score Score
10,782 1.44
10,360 1.20
8,478 1.17
7,631 1.79
6,185 1.60
5,406 0.61
4,424 1.09
4,238 0.62
4,232 1.68
4,063 1.92
3,987 1.87
3,781 1.47
3,520 1.66
1,391 1.49
928 1.31
462 3.88
423 3.09
240 1.63
89 1.00
67 1.32
3,276 1.88
3,197 1.99
2,672 1.12
2,600 1.50
2,557 1.32
2,556 1.01
2,550 1.11
oration ratehysics, 199
onomy & astrop
ARIF
e Score
4 1.08
0 1.03
7 1.00
9 1.16
0 1.10
1 0.74
9 0.95
2 0.89
8 1.08
2 1.08
7 1.17
7 1.00
6 1.08
9 1.00
1 1.15
8 1.21
9 1.13
3 1.01
0 1.11
2 1.18
8 1.20
9 1.13
2 1.01
0 1.00
2 1.16
1 0.99
1 1.05
Inte
A Bibliometric
e for 20 le98–2009
physics.
Papers
6,104
8,112
6,560
4,610
4,016
3,178
3,681
1,995
3,172
2,476
2,295
3,572
2,062
743
517
329
295
158
69
36
2,325
2,096
2,238
2,244
1,747
2,136
1,660
ernational collab
Analysis
32
eading
Rate
57%
78%
77%
60%
65%
59%
83%
47%
75%
61%
58%
94%
59%
53%
56%
71%
70%
66%
78%
54%
71%
66%
84%
86%
68%
84%
65%
borations

PerformResearc
Novemb© Scien
Figure
Note:
Source
mance and Impach in Astronom
ber 2010 ce-Metrix Inc.
e 8 CollaastroThe sithe wiCalcu
act of Canadianmy & Astrophys
aboration nonomy & aze of nodes is pdth of the links lated by Scienc
n ics
network of astrophysicproportional to is proportional
ce–Metrix using
the 30 leacs research
the total numbto the number WoS
ading organh, 1998–20ber of papers byr of collaboratio
nizations in009 y the institution ons between ins
A Bibliometric
n the world
over the periodstitution pairs.
Analysis
33
in
d, and

PerformResearc
Novemb© Scien
Appe
Constit
ThomsExpandIndex astropdocumscientiinstituand in
To perwithindatabaprovidsuggescategoFoundjournaNaturemateri
Additiperformselecteastroppaperstaxonomore tthe astechnosignifi
In ordreviewthe pa
3 Includ
4 Pleasapprov
mance and Impach in Astronom
ber 2010 ce-Metrix Inc.
endix B –
tution of data
son Reuter'sded [SCI Exp[A&HCI]) inhysics. The W
ment it coversific impact bautional affiliastitutions) to
rform this stn all papers iase that wereded an initialsted that addry of two c
dation [NSF]als to the inite and Sciencials in a great
onal datasetmance in as
ed 20 NSF physics discip
s published bomy of scientthan one subtronomy &
ology subfielcant overlap
der to produs—as both arapers being
des research an
se note that tved by the NRC
act of Canadianmy & astrophysi
Methods
asets
Web of Scieanded], the S
ndexing somWoS was chos, allowing fased on citat
ations, which o be analyzed
tudy, the scindexed in th
e published inl list of 75 aditional jourclassification classificatio
tial list (for thce were not it range of dis
ts had to bstronomy & pre-defined line (i.e., rela
by Canada intific journalsfield. As suchastrophysics ld was excluwith the astr
uce bibliomere published measured re
nd developme
the final selecC.
n ics
s
ence (WoS), wSocial Sciences
me 8,700 jourosen over othfor internal ctions and imp
allows the cod.
entific paperhe WoS. Then a set of sp
appropriate jrnals be inco
ns of scientions). Followihe full list ofincluded in tciplines.
be producedastrophysic
subfields. Thated disciplinn astronomy is its mutua
h, any journadataset wou
uded from tronomy & ast
tric data, onin refereed a
epresent orig
nt on instrum
ction of disci
which includs Citation Indrnals, was uher databasescoverage monpact factor. Iollaboration
rs related to e approach uecialist journournals. In corporated usfic journals ng approval
f journals, seethis report s
d for the cos relative tohese fields h
nes) or were oy & astrophyal exclusivity—al that would uld be remothe potentialtrophysics di
nly two docuacademic jouginal contrib
mentation in su
plines for com
des three datdex [SSCI] anused to prods because it initoring of tIt also includrates betwee
astronomy used consistenals in astronconsultation sing the astr
(i.e., the W by the NRCe Appendix Cince they are
omparative ao other relevhad natural
of comparablysics. The pri—an individuoverlap betw
oved from thl list of comiscipline.4
ument typesurnals. The pbutions to s
upport of astro
mparison wit
tabases (the Snd the Arts &duce statisticincludes citedthe database des data on aen various ent
& astrophysed of retrievinnomy & astr with the clironomy & a
WoS and theC, this proceC). High impe generalist j
analysis of vant discipli
linkages tole size in termimary benefi
ual paper willween a selectehe NSF subfmparable dis
s were be retpeer review pscientific kn
onomy researc
th Astronomy
A Bibliometric
Science Citatio& Humanities cs on astrond references and the ana
all authors antities (e.g., co
sics3 were ideng papers frrophysics. Thient, Science
astrophysics je National ess only addact journals journals pub
Canada’s scnes. Science
o the astronms of the numit of using thl not be classed NSF subfifield. The aersciplines, as
tained—articlprocess ensurnowledge and
ch.
y & Astrophys
Analysis
34
on Index Citation
nomy & of each
alysis of nd their ountries
entified om the
he NRC -Metrix journal Science
ded two such as
blishing
cientific -Metrix omy & mber of he NSF sified in eld and rospace it had
les and res that d meet
sics was
PerformResearc
Novemb© Scien
requirepapers.
Bibliom
Statist
Numbe(e.g., co
Papersstatistievery cin 200calcula
Specialorganiintensias follo
where,
XS =
XT =
NS =
NT =
An indan ind
Averaggiven ewere pthe nupublishjournadivided
mance and Impach in Astronom
ber 2010 ce-Metrix Inc.
ed standards
metric indicat
tics were prod
er of papers: ountries, bas
s per capita: Tics producedcountry and 06 and had aated as follow
lization indexizational entity of the refows:
Papers from
Papers from
Papers fromastrophysic
Papers from
dex value aboex value belo
ge of relative entity (e.g., a
published. Thumber of citahed in the p
al in 2007 is d by the num
act of Canadianmy & astrophysi
s of quality.
tors
duced based o
Number of sed on author
The number od by the US Care estimateda populationws: 3,345/298
x (SI): This iity (e.g., a co
ference entity
m entity X in
m entity X in
m the referecs);
m the referen
ove 1 means tow 1 means th
impact factorcountry, a sp
homson Reutations it recerevious two yequal to the
mber of artic
n ics
In this stud
on the follow
scientific papr addresses),
of papers at tCensus Bured at mid-year
n of 298 mill8 = 11.2 pape
is an indicatountry) in a y (e.g., the wo
S
a given resea
a reference s
ence entity N
ce entity N in
that a given he reverse.
rs (ARIF): Thpecific set of ters calculateeived in the years. Thus, number of c
cles published
dy, articles an
wing indicato
pers written bsectors or org
the country leau. These str. For examplion inhabitars per million
tor of the intgiven resear
orld) in the sa
T
S
T
S
NN
XX
SI
arch area (e.g.
et of papers (
N in a given
n a reference
entity is spec
his is an indipapers, a res
es an annual previous twoeach journalcitations to ad in 2006 (15
nd reviews w
ors:
by authors aganizations.
level is weightatistics are aple, if the US ants at that n inhabitants
tensity of resrch area (e.game research
., Canada in a
(e.g., Canada
research ar
set of papers
cialized relat
icator of the searcher) baseimpact factoo years, relatl’s IF will vararticles publi5) and 2005
will be collect
associated wi
hted per capitavailable on
published 3time, then p
s.
search of a gg., domain, fih area. The SI
astronomy &
a in SCI Expa
ea (e.g., wor
s (e.g., world
tive to the ref
quality of paed on the jouor (IF) for eactive to the nry from year ished in 200(23) (i.e., IF
A Bibliometric
tively referre
th geograph
ta using popan annual b,345 biology
papers per ca
given geografield) relativeI can be form
& astrophysic
anded);
rld in astron
in SCI Expan
ference entity
apers producurnals in which journal ba
number of pato year. The 6 (8) and 20= numerato
Analysis
35
ed to as
ic areas
ulation asis for
y papers apita is
aphic or e to the mulated
cs);
nomy &
nded).
y, while
ced by a ich they ased on apers it IF of a
005 (15) r [23] /

PerformResearc
Novemb© Scien
denomReuter
IStynofrecoth
In thisWOS d
The IFfor theacross matheits subRIFs (i
Averaga givenwas coInc. foof all pcount papersscores publish
Scientifastronfor 20numbeSussexwhere
5 Data(http://regressi
6 Katz, J
mance and Impach in Astronom
ber 2010 ce-Metrix Inc.
minator [38] rs’ IF is flawed
SI classifies docypes of documormal articles, equently in a
ounts in the IFhese document
s study, we thdatabase.
F of papers is e year in wh
fields and smatics), each
bfield to obtai.e., if an insti
ge of relative cn entity (e.g.,ounted. For ar the Nation
papers in this(RC). The A
s belonging tbetter than
hes papers th
ific productioomy & astro09).5 There aer of IAU mx and researcha power law
a on IAU m/www.iau.org/ion model.
J. S. (2000). Sc
act of Canadianmy & astrophysi
= 0.605). Hd in that its n
cuments into ments, while as
notes and revnumber of jo
F’s numeratorts are “for free”
herefore used
calculated bhich they are subfields of h paper’s IF wain the Relativitution has 2
citations (AR a country, a
a paper in a gnal Science Fos subfield wit
ARC of a giveto it. When the world in
hat are not ci
on relative tophysics was appears to b
members of ch associate atrelationship
memberships w/) for all coun
cale independe
n ics
owever, as pnumerator an
types. In calcucitable docum
views. Howeverournals. Whenr but are not i”.
d a symmetr
y ascribing topublished. Sscience (e.g.
was divided bve Impact Fa0 papers, the
RC): This is anan institutiongiven subfieldoundation), tthin the astroen entity (e.gthe ARC is a
n astronomy ted as often a
to scientific estimated us
be a power laountries. Sylt Science-Meexists betwee
were downloantries (not ju
ent indicators
pointed out nd denomina
ulating the noments in the dr, editorials, le
n they are citedincluded in th
ric IF based o
o them the IFSubsequently, there are m
by the averageactor (RIF). Te ARIF is the
n indicator on). The total d (reference sthe citation conomy & astrg., a country,above 1, an & astrophysas the world i
workforce: Tsing a countraw relationshlvan Katz, a
etrix, suggestsen two variab
aded from thust the top 15
and research a
by Moed anator are not s
minator of thdenominator Ietters and seved, these types he denominato
on peer-revie
F of the joury, to accounmore citatione IF of the pa
The ARIF of aaverage of 20
of the scientifnumber of csubfields arecount was throphysics dat, an institutientity (e.g., cics on averagin astronomy
The scientifry’s number hip between
senior reseas using scale-
bles.6
he Internatio5) in order t
assessment. Sc
nd colleaguesymmetric:
he IF, ISI countISI includes aseral other type do contributor. In a sense,
ewed scientifi
rnal in whicht for differenns in biomeapers publisha given entity0 RIFs, one p
fic impact of citations recee those definehen divided btaset to obtaiion) is the avcountry, instge; when it isy & astrophy
fic workforcof IAU memthe number
arch fellow a-independen
onal Astronomto determine
cience and Publi
A Bibliometric
s (1999), Th
ts citations tos a standard oes are cited rathte to the citati, the citations
fic articles us
h they are pubnt citation pdical researc
hed the samey is the averager paper).
papers produeived for eached by CHI R
by the averagein a relative cverage of thetitution, reses below 1, an
ysics on avera
e of a counmbers (only av
r of papers aat the Univet indicators i
mical Union the constants
ic Policy, 27: 23
Analysis
36
homson
all nly her ion s to
sing the
blished, patterns ch than e year in ge of its
uced by h paper
Research e count citation e RC of earcher) n entity age.
ntry in vailable and the rsity of in cases
website s of the
3–36.

PerformResearc
Novemb© Scien
Power log-tracompunumbeorder t
Expp (M
Where
Expp isand
M is th
The loconstathis mpapersbased o
Positioor an represelogical
The hoThese of the
The pofollow
QInhain
Qpr
Qth
Qsc
mance and Impach in Astronom
ber 2010 ce-Metrix Inc.
law relationansformed, cute the indicer of IAU meto estimate th
M) = a *(M^k
e,
s the expecte
he observed n
g-log linear rants (a and k)
model (p-valus. When the ion the size of
onal analysis: institution) entation calllly combines
orizontal axisdata are tranbubbles is pr
osition of a s:
Quadrant 1: Lonstitutions anave a high im
n this field. Quadrant 2: Lo
roduction, buQuadrant 3: Lohe field, altho
Quadrant 4: Locenario, as bo
act of Canadianmy & astrophysi
nships, whenan be analyscator consistembers and thhe constants
k)
ed number o
number of IA
regression an) of the regree < 0.0001; Rindicator is af its scientific
To more easthrough theled a positithree of the p
s of this posinsformed to roportional t
country or i
ocated at thend countries
mpact, meanin
ocated at theut the countrocated at the
ough the entiocated at the
oth the specia
n ics
n both indicsed using linted in perforhe number o(a and k) of t
f papers of a
AU members o
nalysis was peession modelR2 = 0.88). Tabove 1, it mec manpower,
sily interpret e use of seveonal analysipreviously m
itional graphobtain a disto the numbe
nstitution in
e top right of in this quadr
ng that their
e top left of thries or institue bottom righity’s scientifice bottom left alization leve
cators (i.e., nnear regressiorming a log
of papers at athe power law
an entity (e.g
of the entity
erformed usinl. The predict
The indicatoreans that a cwhile an ind
the strengtheral separate is (see exam
mentioned ind
h correspondtribution witer of papers p
n one of fou
f the graph, thrant specializpapers are m
he graph, thiutions are noht of the grapc impact is beof the graphl and impact
number of on models. Tg-log linear ra specific aggw relationshi
g., a country)
(e.g., country
ng reduced mted (or expecr is simply thcountry proddex value belo
s and weaknindicators, S
mple below). dicators (num
ds to the SI, ath zero represproduced by t
ur quadrants
his quadrantze in the give
more frequent
is quadrant int specialized
ph, this quadelow the wor
h, this quadrat are below th
IAU membeTherefore, thregression angregation leveip:
based on th
y) being meas
major axis (RMcted) values whe ratio of ob
duces more paow 1 means t
esses of an enScience-Metr
This graphmber of paper
and the vertisenting the wthe country o
can therefor
t is synonymon domain, antly cited than
ndicates highin the field. rant indicateld average.
ant representhe world aver
A Bibliometric
ers and papee approach unalysis betweel (e.g., count
he regression
sured.
MA) to estimwere obtainedbserved to exapers than ex
the reverse.
ntity (e.g., a crix uses a grhical represenrs, SI and AR
cal axis to thworld level. Tor institution
re be interpr
ous with excend their activn the world av
h-impact scie
es specializati
s the worst crage in the fie
Analysis
37
ers) are used to een the tries) in
model;
mate the d using xpected xpected
country raphical ntation
RC).
he ARC. The size n.
reted as
ellence. vities verage
entific
ion in
ase eld.

PerformResearc
Novemb© Scien
NationThe raleast twnumbe
Internacollaboinstituthe add
Visuali
Two sinstituworld
Gephi,strengtembedreprese
In the a circleinstituinstituinstitu
In the circle wleadingnodes numbeinstitualloweresultifinal n
The msoftwacolor gmodulbuilt fbetweebetwee
mance and Impach in Astronom
ber 2010 ce-Metrix Inc.
nal collaboratate is calculatwo institutioer of papers.
ational collaoration. The
ution) with atdress field by
ization of coll
quare matricutions in theleading instit
, a network gth of the rela
dding" algorientation.
network of le with a size
utions in astutions. The wutions. Some
network of with a size pg institutionrepresent co
er of collaboutions when d us to discang in a bette
network to inc
maps showingare MapInfo gradient defilated by the pfrom the numen two counten countries
act of Canadianmy & astrophysi
tion rate: Thied by dividin
onal addresse
boration raterate is calcu
t least one iny the entity’s
laboration ne
ces were buie 1998–2009 tutions.
graphing sofationships bethm was use
leading Canaproportionaronomy & a
width of the liminor modif
world leadinroportional s (i.e., those d
ollaboration orations betwthey represen
ard the bulk er readabilitycrease readab
g the collaband a customned by the n
proportion omber of papetries if they h
and 90 pap
n ics
is is an indicang the numbees from the e
e: This is anulated by divnstitutional atotal numbe
etworks and m
ilt from the period, one
ftware, was uetween the to
ed to establis
adian institutal to its total astrophysics. inks is propofications wer
ng institutionto its total ndisplayed in tbetween inst
ween the twnt at least 0.of the distrib
y of the netwbility.
oration linkm MapBasicnatural breakf papers co-aers co–authohave co–authpers for the
ator of the reer of papers oentity’s coun
n indicator oviding the nuaddress from r of papers.
maps
number of for the lead
used to proceop institutioh the relative
tions, each nonumber of pLinks betw
ortional to thre made to th
ns, each nodenumber of pathe network)titutions. Tho institution.1% of all cobution which
work graph. S
s between cotool. The cou
k ordering of authored in coored by all phored at least
internationa
elative imporof an entity (entry in the ad
of the relativumber of paa country ot
papers co–auding Canadia
ess data and ons in astrone locations o
ode consists papers in col
ween nodes rhe number ofhe final netwo
e consists of apers in colla in astronom
he width of tns. Links wellaborations
h consists maSome minor
ountries wasuntries in th
f their paper ollaborationairs of count 1000 paperal collaborat
rtance of nate.g., country,ddress field b
ve importanapers of an ether than the
uthored by aan institutio
produce a renomy & astroof the institut
of an institullaboration wrepresent colf collaboratioork to increas
f an institutioaboration wi
my & astrophythe links is pere only disp
in the netwainly of weakmodification
s produced uhe map were
output. The . To draw thetries. Links wrs for the coltion network
A Bibliometric
tional collabo, institution) by the entity
nce of internentity (e.g., ce entity’s cou
all pairs of tns and one
epresentationophysics. A "stions in the g
ution represenwith other Callaboration bons between tse readability
on representth any of theysics. Links bproportionalplayed betwe
work. This thk collaborativns were made
using the mpainted follosizes of nod
e links, a matwere only dillaboration nk of Canada
Analysis
38
oration. with at
y’s total
national country, untry in
the top for the
n of the spring–graphic
nted by anadian between the two y.
ted by a e world
between l to the een two reshold ve links e to the
mapping owing a
des were trix was splayed
network . These

PerformResearc
Novemb© Scien
threshbe disc
Limitat
Internscientimanagorganidatabadomaiwell do
It whun
Anpranan
Dinso19dobosostsedi
7 Larivièsciences a1004.
8 Glänzeand Mana
9 Hicks, United S
10 Moed
11 Van RtechnoloPublishe
mance and Impach in Astronom
ber 2010 ce-Metrix Inc.
olds allowedcarded, result
tions of biblio
ationally, bibific activity. gement, it is nizations, andase with extens. In this re
ocumented w
has a slight bhose researchnderestimatenother factorractices betwnd cite less thnd citation coue to differen
ndicators are o in social sci9998; Hicks, 2ocuments (e.gooks are not. ocial sciences udy, this lim
elected subfieissemination
re, V., Archambauand engineering w
el, W. & Schoepfliagement, 35: 31-44
D., Tomizawa, H.tates. Research Eva
d, H. F., Luwel, M.,
Raan, A. F. J. (200gy research: The urs.
act of Canadianmy & astrophysi
d the bulk of tting in a bett
ometrics
bliometrics iAs bibliomenot uncommd countries aensive cover
espect, it is wweaknesses:
bias for counhers would teed in the contr affecting pueen disciplin
han biomedicounts betweential coveragquite reliableences and hu20049; Moed,g., articles, reTherefore, itand humani
mitation has lields for comp. Errors in co
ult, É., Gingras, Ywith social science
in,U. (1999). A bib4
., Saitoh, Y., & Koaluation, 13(2), 78-
, & Nederhof, A.J.
04). Measuring sciuse of publication
n ics
the distributer readability
is the most etrics is often
mon to find thare favouredage of the s
worth mention
ntries that puend to publistext of internublication co
nary fields. Focal researcheren fields. ge of sources ie for natural umanities fiel, Luwel and Neviews) publist is not surprities are smalittle effect beparison all haounting the n
Y. & Vignola-Gagnes and humanitie
bliometric study o
obayashi, S. (2004-86.
(2002). Toward r
ience. In H. F. Mon and patent statis
ions, which cy of the netw
widely accepn used in thhat comparatd. The key tscientific litening that the
ublish in Englsh more in otnational compunts is the di
or instance, itrs. Hence, on
in Thomson sciences, englds (ArchambNederhof, 20shed in refere
rising to see tller than thosecause astronave journals anumber of pa
né, É. (2006). Thees. Journal of the Am
of reference litera
). Bibliometric tec
esearch performa
oed, W. Glänzel, &stics in studies of
consist mainwork graphs.
pted methodhe context otive approachto comparaberature overe WoS, which
lish-languagether languageparisons. ifference in pt is well know
ne should not
Reuters’ sciegineering, andbault et al., 20210; van Raaeed journals that publicatise from the n
nomy and astras their core mapers or citati
e place of serials imerican Society for I
ature in the scienc
chniques in the ev
ance in the human
& U. Schmoch (Ef S&T systems. Do
nly of weak co
d for measurof performanhes using difbility is to ur time, counh is used in t
e journals. Thes, their scien
publication awn that matht directly com
entific databad health field0067; Glänzean, 200411). Fare covered eion counts o
natural sciencrophysics as medium for kions of an en
in referencing praInformation Scienc
ces and social sci
valuation of feder
nities. Library Tren
Eds.), Handbook ordrecht, The Net
A Bibliometric
ollaborative li
ring the outpnce assessmefferent time puse a bibliog
ntries and scthis study, ha
hus, for counntific product
and citation hematicians pmpare publica
ases, bibliomds but are muel and SchoepFor example, extensively, wf professors fces. In the cuwell as the 20knowledge
ntity (e.g.,
actices: Comparince and Technology, 5
ences. Information
rally funded resea
nds, 50(3), 498-520
of quantitative sctherlands: Kluwer
Analysis
39
inks, to
puts of ent and periods, graphic cientific as some
ntries tion is
publish ations
etrics uch less pflin,
while from
urrent 0
ng natural 57(8): 997-
n Processing
arch in the
0.
cience and Academic

PerformResearc
Novemb© Scien
inerCoScre
The siman instof resotheir rproduccounts
Sopu(i.afsu
Alcocowh
Becausbetter indicatbased indicatresearcrelatesto find
12 King, 13(5), 26
mance and Impach in Astronom
ber 2010 ce-Metrix Inc.
nstitution, corrors arising founcil, NRC,cience-Metrixesearchers, in
mplest bibliotitution, a coources (e.g., esearch, this ced their pas for perform
ocial and polublications in.e., researcherffect data comuch as fragmelong with theollaboration, ommon. Thishose research
se all bibliomused as a s
tors point inon a single
tors do not ch (or the bess research inpd comparable
J. (1987). A review1-271
act of Canadianmy & astrophysi
untry) couldfrom differen,) or to historx analysts spestitutions, an
ometric indicountry). Howfunding, numapproach capers. King (
mance assessm
itical pressurn grant or tenrs, institutionmparability. Tentation of ree increasing nit seems that
s could lead thers adopt th
metric indicaet of indicat
n the same de indicator (
reveal whichst at convertiputs to researe data of resea
w of bibliometric
n ics
d occur in thent ways of citirical changesent an apprecnd countries
cator is the nuever, becausember of rese
annot be used1987)12 revie
ment in scient
res, such as thnure competins, countries)These pressuresults in mannumber of mt the “gratuitto what appeahis strategy.
ators have sotors for the
direction, theKing, 198712
h, among coing research irch outputs. arch inputs.
and other scienc
e WoS (as it coing the name
s in an instituciable amounin the databa
umber of pape entities can earchers, equd to compareewed a numbtific research
hose favourinitions, might) will put on res could alsony papers to o
multi-authoretous conferriars to be a be
ome weaknesassessment
e results are 2). It is also omparables, inputs into rCompared to
ce indicators and t
ould in any oe of an instituution’s nament of time harase.
pers publishediffer substa
uipment) avae the efficiencber of object
h:
ng researchert affect the empublishing ro lead to undobtain “least d papers as ang” of co-aut
etter perform
sses when coof scientificregarded as important is the most
research outpo data on res
their role in resea
other databasution (e.g., N. To limit thermonizing th
ed by an entiantially with ailable to thecy with whichtions to the
rs with the himphasis thatresults and, thdesirable pub
publishable a result of incthorship is b
mance by thos
onsidered inc performanc
being more to recognize
t efficient enputs), as nonesearch output
arch evaluation. Jo
A Bibliometric
se) due to indNational Reseese types of ehe names of
ity (i.e., a reserespect to th
em as they ch these entiti
use of publ
ighest numbet different entherefore, cou
blication pracunits”.
creased ecoming mo
se institution
ndividually, tce. When all
reliable thane that bibliontity at perfe of these indts, it is very d
Journal of Informati
Analysis
40
dexing arch rrors,
earcher, he levels conduct ies have lication
er of tities
uld ctices,
re ns
hey are of the n those ometric forming dicators difficult
ion Science.

PerformResearc
Novemb© Scien
Appe
AC
IN
AS
AS
AS
AS
AS
ASSE
AS
AS
AS
ASAS
AS
AS
AS
AS
AS
AS
AS
AS
AS
BA
BUCZ
BUIN
CE
CEAS
CH
CH
CHAS
CL
mance and Impach in Astronom
ber 2010 ce-Metrix Inc.
endix C –
CTA ASTRONOM
SPACE RESEAR
STROBIOLOGY
STRONOMICAL J
STRONOMICHES
STRONOMISCHE
STRONOMY & AS
STRONOMY & ASERIES
STRONOMY & GE
STRONOMY & AS
STRONOMY & AS
STRONOMY LETTSTRONOMY AND
STRONOMY REP
STROPARTICLE P
STROPHYSICAL
STROPHYSICAL
STROPHYSICAL
STROPHYSICAL
STROPHYSICAL
STROPHYSICS
STROPHYSICS A
ALTIC ASTRONO
ULLETIN OF THE ZECHOSLOVAKIA
ULLETIN OF THE DIA
ELESTIAL MECHA
ELESTIAL MECHASTRONOMY
HINESE ASTRON
HINESE ASTRON
HINESE JOURNASTROPHYSICS
LASSICAL AND Q
act of Canadianmy & astrophysi
List of as
ICA
RCH
JOURNAL
SKII ZHURNAL
E NACHRICHTEN
STROPHYSICS
STROPHYSICS S
EOPHYSICS
STROPHYSICS
STROPHYSICS
TERS–A JOURNAD SPACE ASTROP
PORTS
PHYSICS
BULLETIN
JOURNAL
JOURNAL LETTE
JOURNAL SUPP
LETTERS & COM
AND SPACE SCIE
MY
ASTRONOMICAA
ASTRONOMICA
ANICS
ANICS & DYNAM
OMY
OMY & ASTROP
AL OF ASTRONOM
QUANTUM GRAV
n ics
stronomy
SUPPLEMENT
REVIEW
AL OF PHYSICS
ERS
PLEMENT SERIES
MMUNICATIONS
NCE
AL INSTITUTES O
AL SOCIETY OF
MICAL
PHYSICS
MY &
VITY
y & astrop
S
OF
physics jo
COMPTES RSERIE IV PHY
COMPTES R
COSMIC RES
EARTH AND
EARTH MOO
EXPERIMENT
GENERAL RE
GEOPHYSICADYNAMICS
GRAVITATIO
ICARUS
INDIAN JOUR
INTERNATIO
JBIS–JOURNSOCIETY
JOURNAL OF
JOURNAL OF
JOURNAL OFPHYSICS
JOURNAL OFSOCIETY
JOURNAL OFOF CANADA
KINEMATICS
LABORATOR
MAGNETOSH
MONTHLY NSOCIETY
MOON AND T
NEW ASTRO
NEW ASTRO
NUOVO CIMEFISICA C–GE
OBSERVATO
PLANETARY
ournals
ENDUS DE L’ACAYSIQUE ASTROP
ENDUS PHYSIQ
SEARCH
PLANETARY SC
ON AND PLANETS
TAL ASTRONOM
ELATIVITY AND
AL AND ASTROP
ON & COSMOLOG
RNAL OF RADIO
ONAL JOURNAL O
NAL OF THE BRIT
F ASTROPHYSIC
F GEOPHYSICAL
F GEOPHYSICAL
F THE KOREAN A
F THE ROYAL AS
S AND PHYSICS
RY PLANETOLOG
HEATH
NOTICES OF THE
THE PLANETS
ONOMY
ONOMY REVIEWS
ENTO DELLA SOEOPHYSICS AND
ORY
Y AND SPACE SC
A Bibliometric
ADEMIE DES SCPHYSIQUE
UE
CIENCE LETTERS
S
MY
GRAVITATION
PHYSICAL FLUID
GY
O & SPACE PHYS
OF MODERN PHY
TISH INTERPLAN
CS AND ASTRON
L RESEARCH–PL
L RESEARCH–SP
ASTRONOMICAL
STRONOMICAL S
OF CELESTIAL B
GY
ROYAL ASTRON
S
OCIETA ITALIANAD SPACE PHYSIC
IENCE
Analysis
41
CIENCES
S
D
SICS
YSICS D
NETARY
NOMY
LANETS
PACE
L
SOCIETY
BODIES
NOMICAL
A DI CS

PerformResearc
Novemb© Scien
PRAU
PUAU
PUOF
PUOF
PUOF
QUAS
mance and Impach in Astronom
ber 2010 ce-Metrix Inc.
ROCEEDINGS ASUSTRALIA
UBLICATIONS ASUSTRALIA
UBLICATIONS OFF AUSTRALIA
UBLICATIONS OFF JAPAN
UBLICATIONS OFF THE PACIFIC
UARTERLY JOURSTRONOMICAL S
act of Canadianmy & astrophysi
STRONOMICAL S
STRONOMICAL S
F THE ASTRONO
F THE ASTRONO
F THE ASTRONO
RNAL OF THE ROSOCIETY
n ics
SOCIETY OF
SOCIETY OF
MICAL SOCIETY
MICAL SOCIETY
MICAL SOCIETY
OYAL
Y
Y
Y
RESEARCH I
REVISTA MEASTROFISIC
SOLAR PHYS
SOLAR SYST
SOVIET ASTR
SPACE ASTR
SPACE SCIEN
VISTAS IN A
IN ASTRONOMY
EXICANA DE ASTA
SICS
TEM RESEARCH
RONOMY LETTE
RONOMY
NCE REVIEWS
ASTRONOMY
A Bibliometric
Y & ASTROPHYS
TRONOMIA Y
ERS
Analysis
42
ICS