Performance and Cost of Treating Flowback and Produced ...
15
Performance and Cost of Treating Flowback and Produced Water to Surface Discharge Standards Valentina Llano August 08, 2018
Transcript of Performance and Cost of Treating Flowback and Produced ...
Performance and Cost of Treating Flowback and Produced Water to Surface Discharge Standards
Valentina Llano
August 08, 2018
2
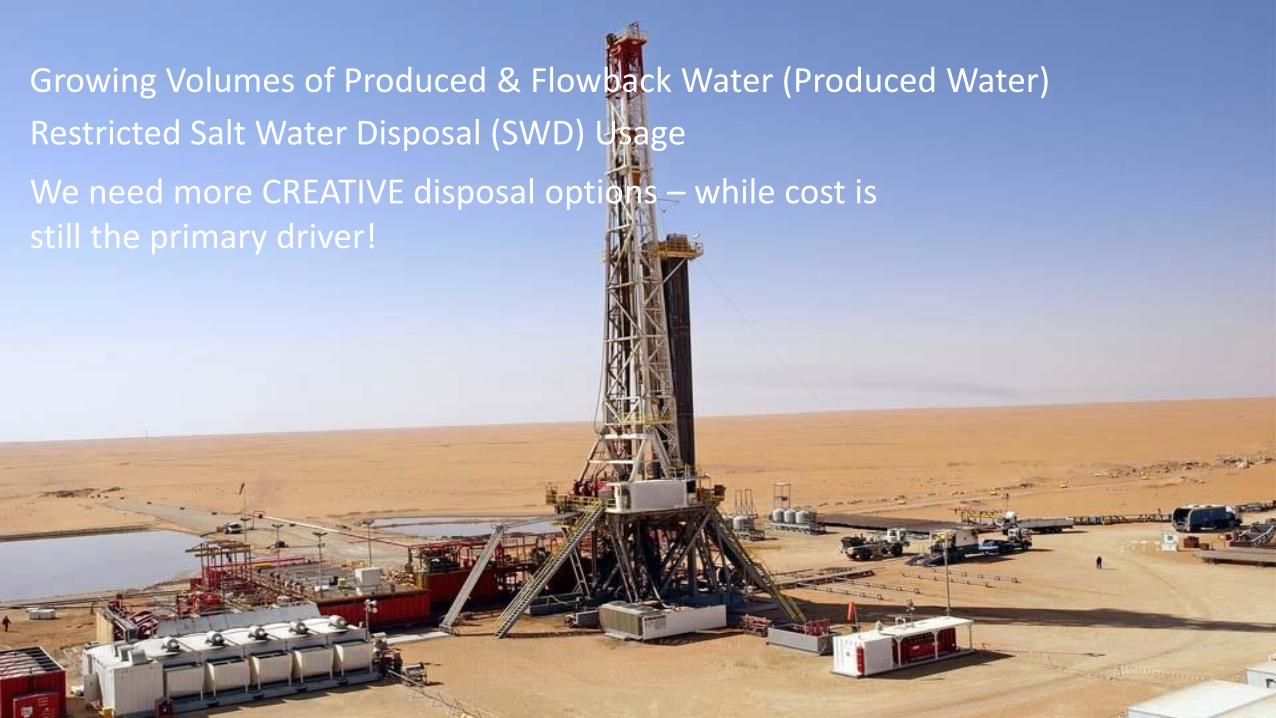
Growing Volumes of Produced & Flowback Water (Produced Water)
Restricted Salt Water Disposal (SWD) Usage
We need more CREATIVE disposal options – while cost is still the primary driver!
Common Problem: Lack of data in the industry, particularly with regard to effectiveness and costs of
individual unit operations
3
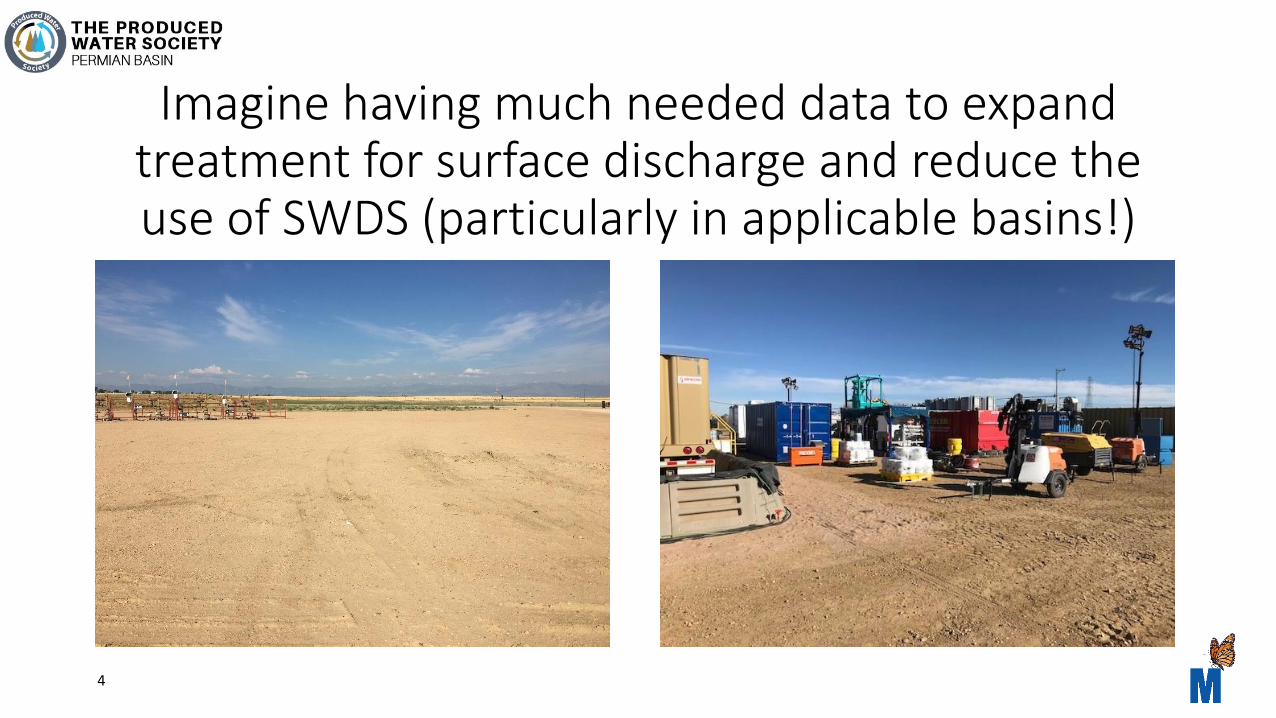
Imagine having much needed data to expand treatment for surface discharge and reduce the use of SWDS (particularly in applicable basins!)
4
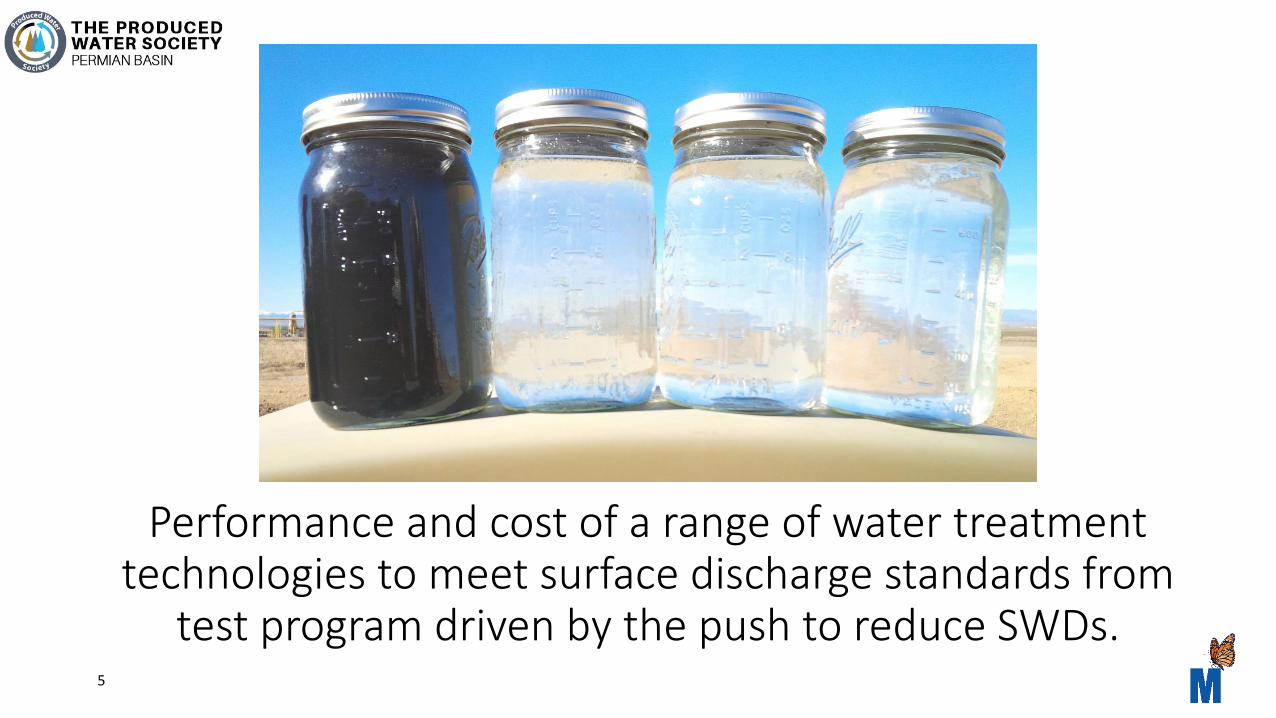
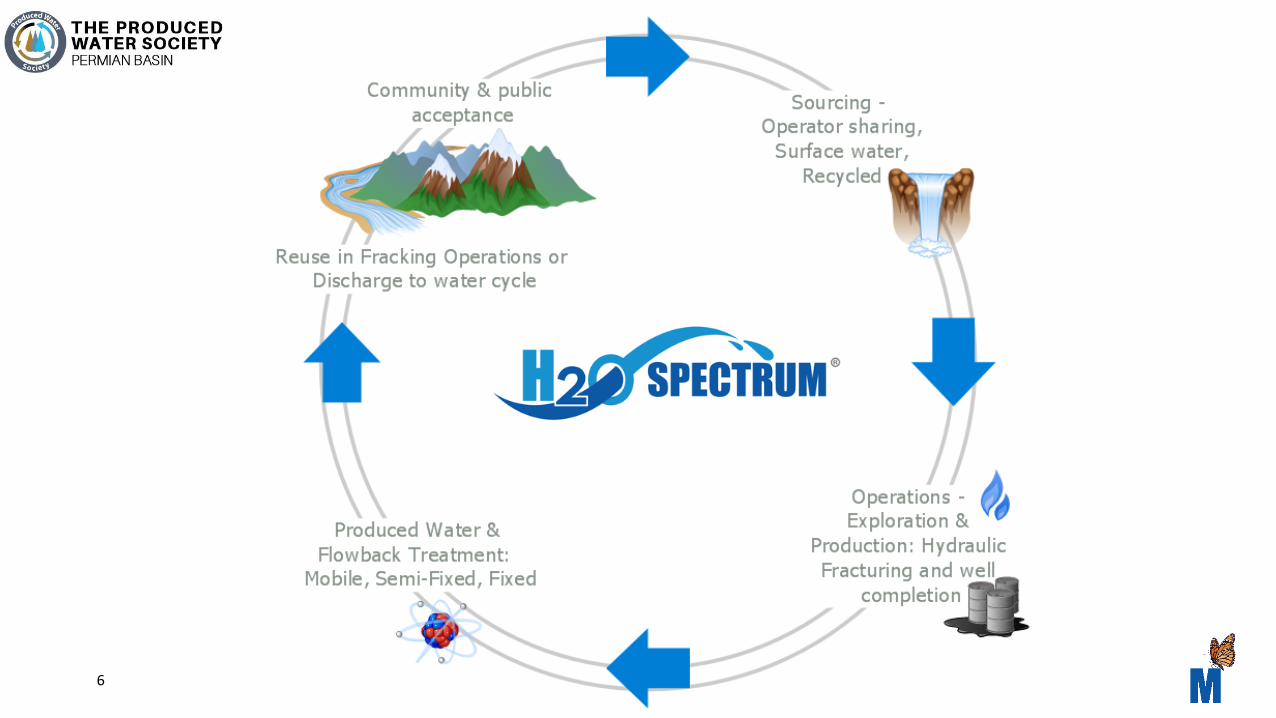
Performance and cost of a range of water treatment technologies to meet surface discharge standards from
test program driven by the push to reduce SWDs. 5
6
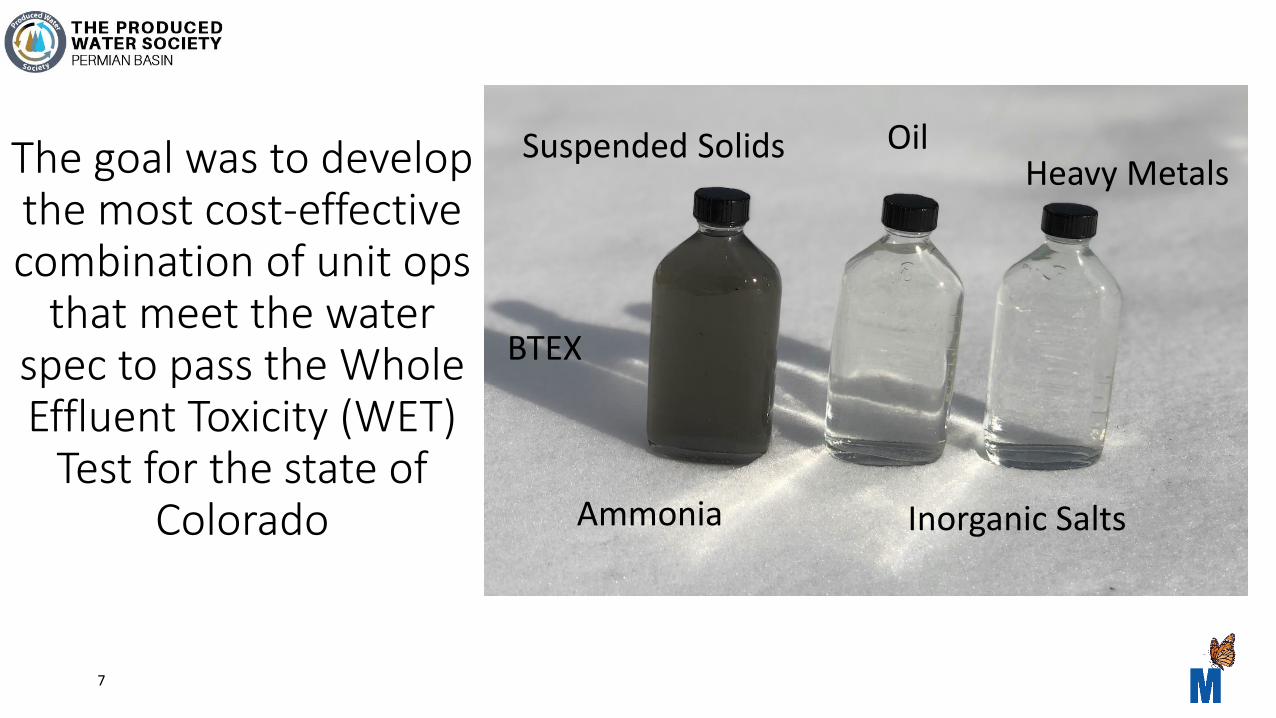
The goal was to develop the most cost-effective combination of unit ops
that meet the water spec to pass the Whole Effluent Toxicity (WET)
Test for the state of Colorado
7
Oil
BTEX
Suspended Solids
Ammonia
Heavy Metals
Inorganic Salts
8
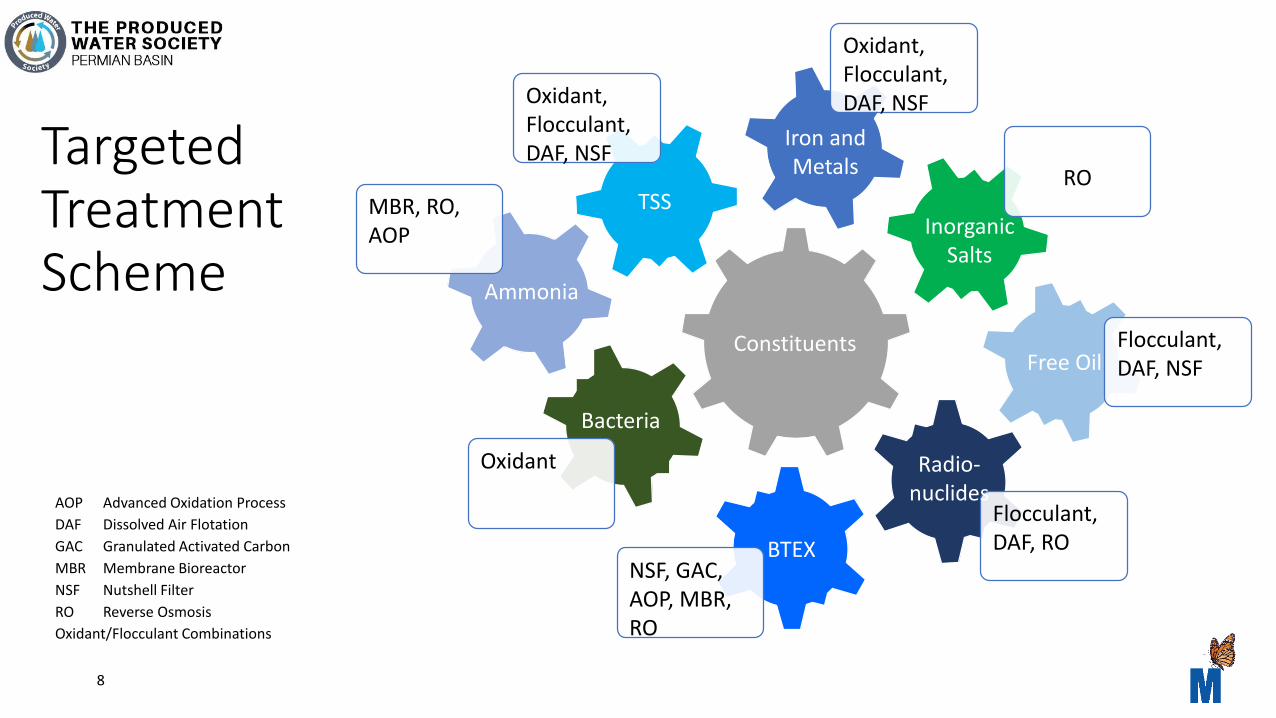
Oxidant, Flocculant, DAF, NSF
RO
Flocculant, DAF, RO
NSF, GAC, AOP, MBR, RO
Oxidant
MBR, RO, AOP
Oxidant, Flocculant, DAF, NSF
Flocculant, DAF, NSF
ConstituentsFree Oil
Ammonia
Bacteria
BTEX
Radio-nuclides
Inorganic Salts
TSS
Iron and MetalsTargeted
TreatmentScheme
AOP Advanced Oxidation Process
DAF Dissolved Air Flotation
GAC Granulated Activated Carbon
MBR Membrane Bioreactor
NSF Nutshell Filter
RO Reverse Osmosis
Oxidant/Flocculant Combinations
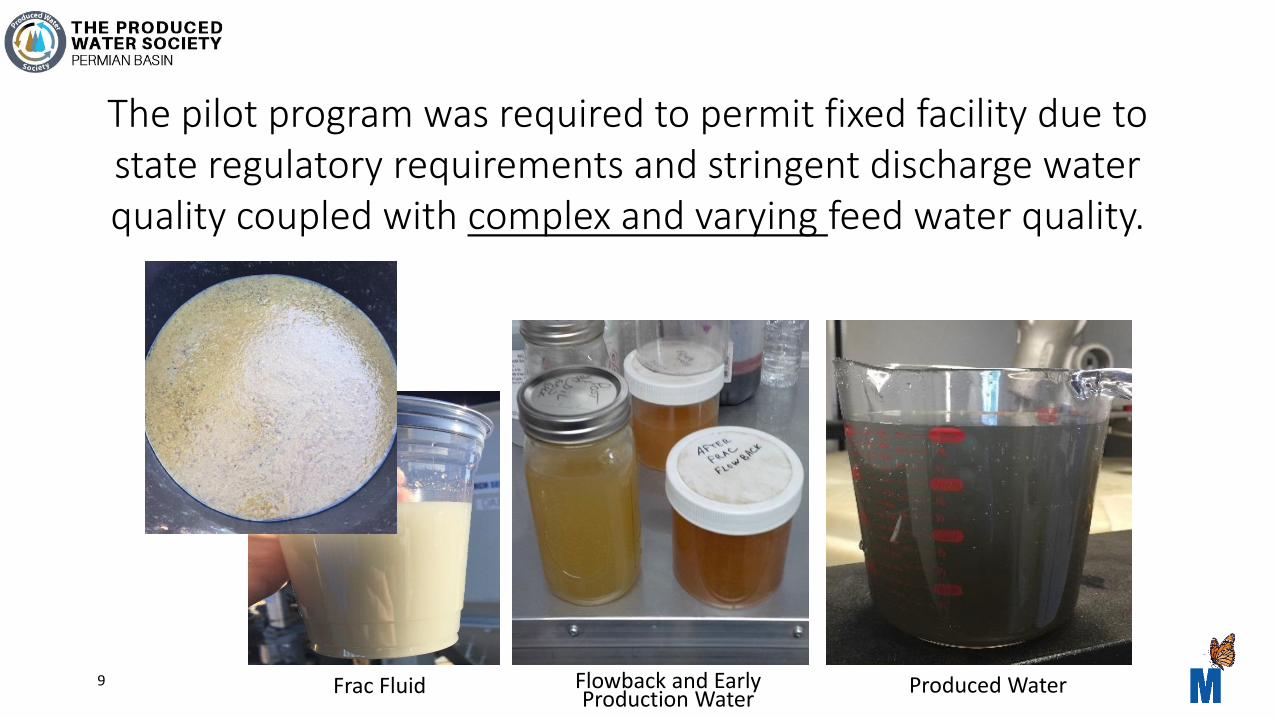
9 Flowback and Early Production Water
Produced WaterFrac Fluid
The pilot program was required to permit fixed facility due to state regulatory requirements and stringent discharge water quality coupled with complex and varying feed water quality.
10
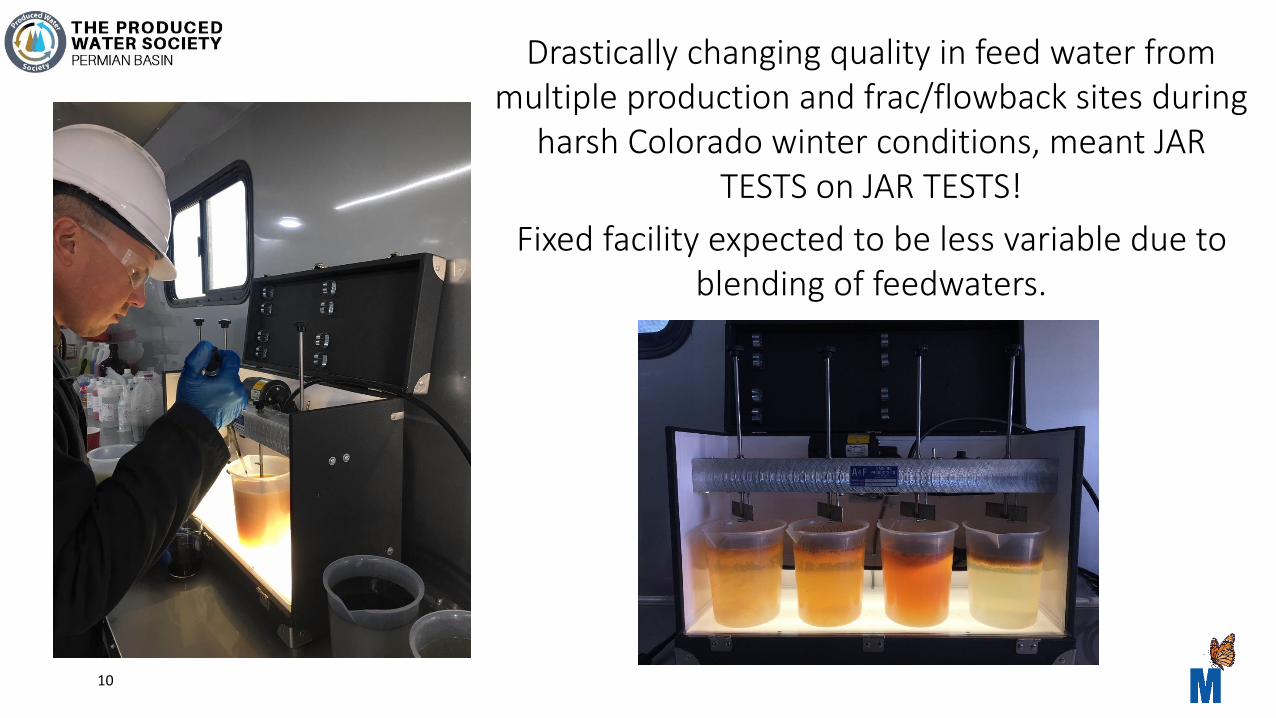
Drastically changing quality in feed water from multiple production and frac/flowback sites during
harsh Colorado winter conditions, meant JAR TESTS on JAR TESTS!
Fixed facility expected to be less variable due to blending of feedwaters.
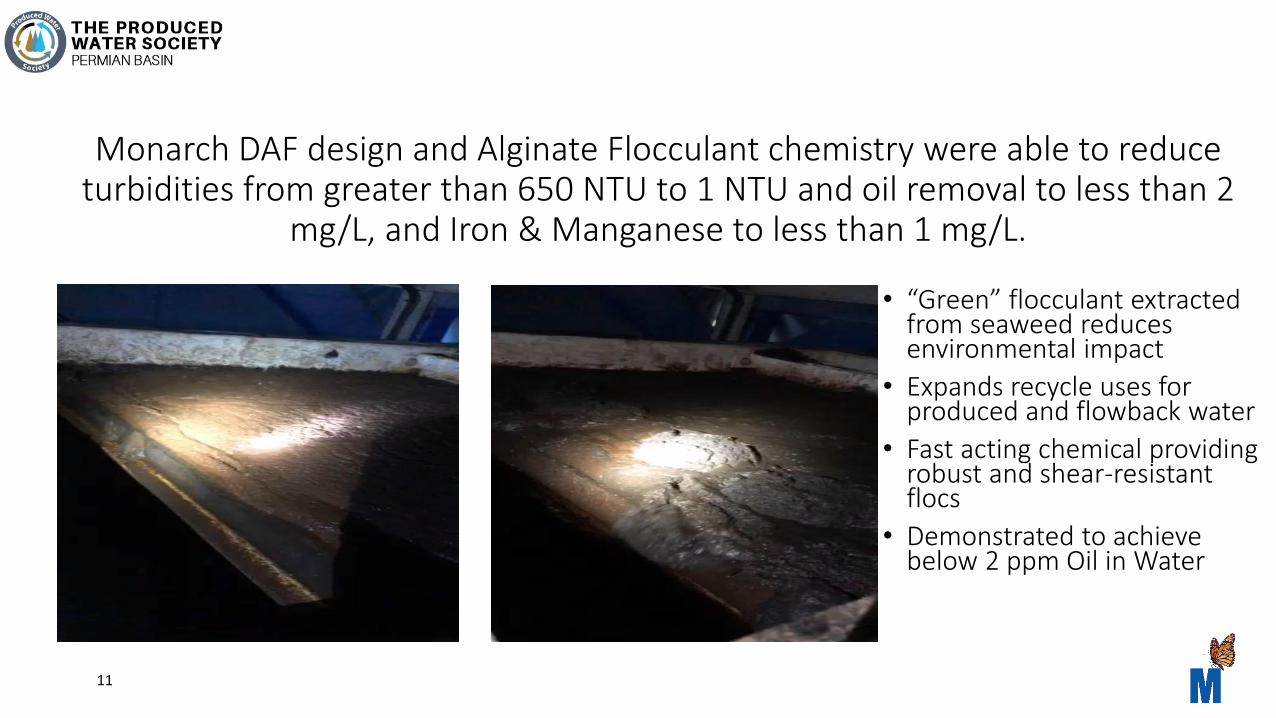
Monarch DAF design and Alginate Flocculant chemistry were able to reduce turbidities from greater than 650 NTU to 1 NTU and oil removal to less than 2
mg/L, and Iron & Manganese to less than 1 mg/L.
11
• “Green” flocculant extracted from seaweed reduces environmental impact
• Expands recycle uses for produced and flowback water
• Fast acting chemical providing robust and shear-resistant flocs
• Demonstrated to achieve below 2 ppm Oil in Water
12
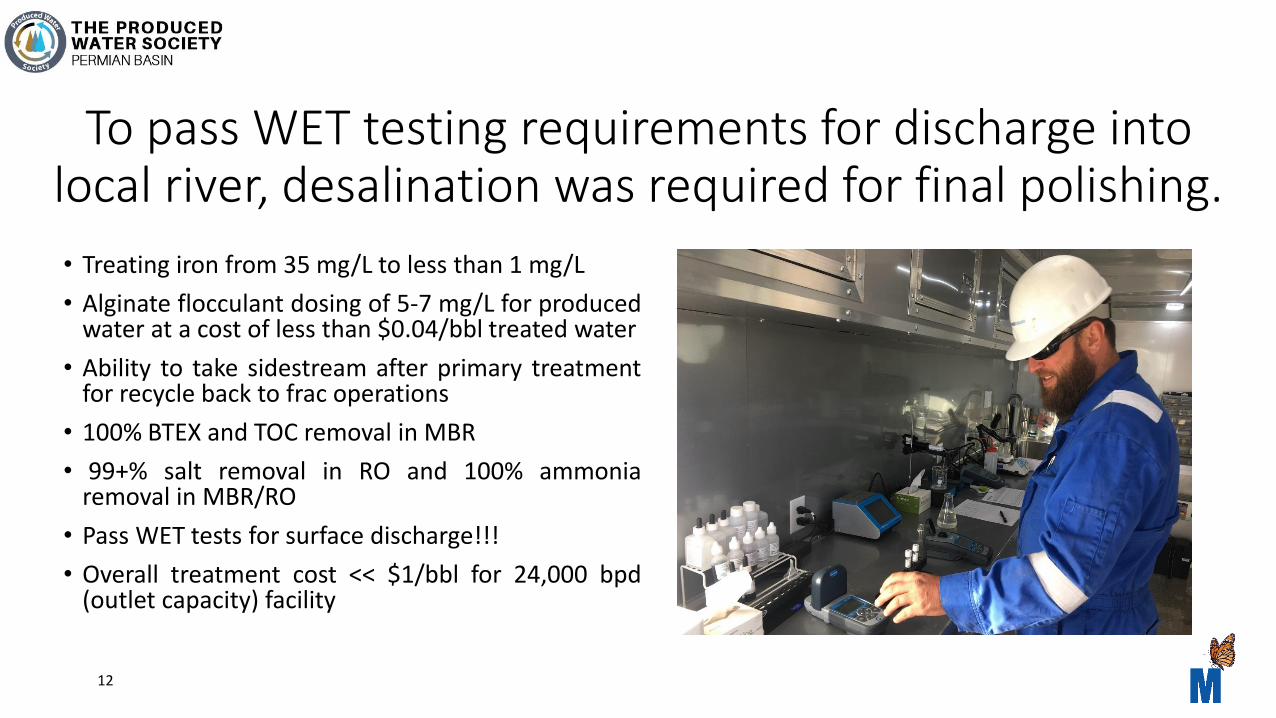
To pass WET testing requirements for discharge into local river, desalination was required for final polishing.
• Treating iron from 35 mg/L to less than 1 mg/L
• Alginate flocculant dosing of 5-7 mg/L for producedwater at a cost of less than $0.04/bbl treated water
• Ability to take sidestream after primary treatmentfor recycle back to frac operations
• 100% BTEX and TOC removal in MBR
• 99+% salt removal in RO and 100% ammoniaremoval in MBR/RO
• Pass WET tests for surface discharge!!!
• Overall treatment cost << $1/bbl for 24,000 bpd(outlet capacity) facility
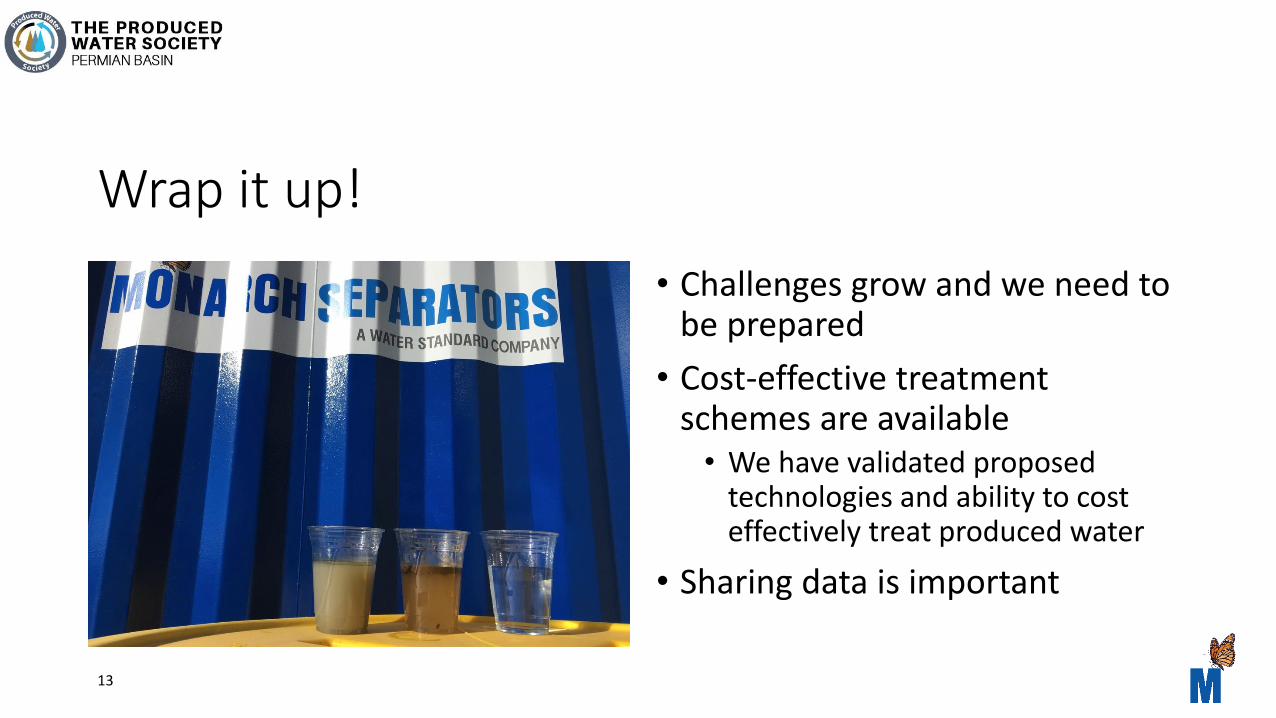
Wrap it up!
• Challenges grow and we need to be prepared
• Cost-effective treatment schemes are available • We have validated proposed
technologies and ability to cost effectively treat produced water
• Sharing data is important
13
Thank you!
14
Mike Pankratz Robert “Buddy” Boysen
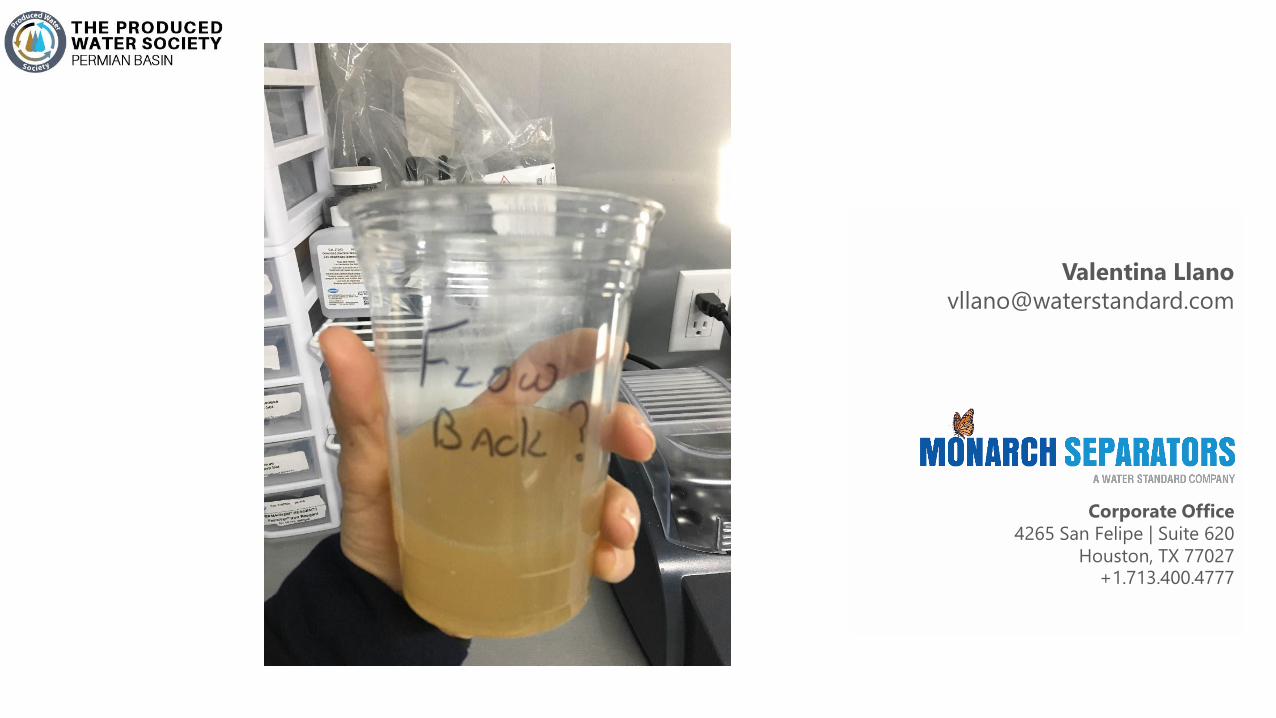
Valentina Llano
Corporate Office
4265 San Felipe | Suite 620
Houston, TX 77027+1.713.400.4777