Performance analysis of dual selectionbased … analysis of dual selectionbased macrodiversity...
11
Performance analysis of dual selection-based macrodiversity system over channels subjected to Nakagami-m fading and gamma shadowing Nikola M. Sekulovic, Edis S. Mekic, Dragana S. Krstic, Aleksandra D. Cvetkovic, Martina Zdravkovic * , Mihajlo C. Stefanovic Faculty of Electronic Engineering, Department of Telecommunications University of Nis Aleksandra Medvedeva 14 Serbia * Faculty of Occupational Safety University of Nis Carnojevica 10A Serbia [email protected] Abstract: - This paper studies wireless communication system following microdiversity to mitigate the effects of short-term fading and macrodiversity processing to reduce shadowing effects. N-branch maximal-ratio combining (MRC) is implemented at the micro level (single base station) and selection combining (SC) with two base stations (dual diversity) is implemented at the macro level. Model in the paper assumes a Nakagami- m density function for the envelope of the received signal and a gamma distribution to model the average power to account for shadowing. Analytical expressions for the probability density function (PDF), cumulative distribution function (CDF) and moments of signal after micro- and macrodiversity processing are derived. These expressions are used to study important system performance criteria such as the outage probability, average bit error probability (ABEP), average output signal value and amount of fading (AoF). Various numerical results are graphically presented to illustrate the proposed mathematical analysis and to show the effects of various system parameters to the system performance, as well as enhancement due to use of the combination of micro- and macrodiversity. Key-Words: - Gamma shadowing, Macrodiversity, Microdiversity, Nakagami-m fading. 1 Introduction In wireless communication systems, the received signal can be exposed to both short-term fading, which is the result of multipath propagation, and long-term fading (shadowing), which is the result of large obstacles and large deviations in terrain profile between transmitter and receiver [1]. The reliability of communication over the wireless channels can be improved using diversity techniques, such as space diversity techniques [2], [3]. The most popular space diversity techniques are selection combining (SC), equal-gain combining (EGC) and maximal- ratio combining (MRC). MRC is optimal combining technique in the sense that it achieves the best performance regardless of the fading statistics on the diversity branches. However, MRC requires the knowledge of the channel fading amplitudes and phases of each diversity branch which must be continuously estimated by the receiver. These estimations require separate receiver chain for each branch of the diversity system increasing its complexity. EGC provides performance comparable to MRC, but with simpler implementation complexity. EGC does not require the estimation of the channel fading amplitudes since it combines signals from all branches with the same weighting factor. SC is the least complicated technique. It is reposed on processing only one of the diversity branches. SC combiner chooses the branch with the highest signal value. Diversity techniques at single base station (microdiversity) reduce the effects of short-term fading. Impairments due to shadowing can be mitigated using macrodiversity techniques which employ the processing of signals from multiple base stations. The use of composite micro- and macrodiversity has received considerable interest due to the fact that it simultaneously combats both short-term fading and shadowing. Rayleigh, Rician and Nakagami-m statistical models are the most frequently used to describe fading envelope of the received signal. The Rayleigh distribution is frequently used to model WSEAS TRANSACTIONS on COMMUNICATIONS Nikola M. Sekulovic, Edis S. Mekic, Dragana S. Krstic, Aleksandra D. Cvetkovic, Martina Zdravkovic, Mihajlo C. Stefanovic ISSN: 1109-2742 77 Issue 3, Volume 10, March 2011
-
Upload
truongdang -
Category
Documents
-
view
222 -
download
1
Transcript of Performance analysis of dual selectionbased … analysis of dual selectionbased macrodiversity...

Performance analysis of dual selection-based macrodiversity system over channels subjected to Nakagami-m fading and gamma shadowing
Nikola M. Sekulovic, Edis S. Mekic, Dragana S. Krstic, Aleksandra D. Cvetkovic, Martina
Zdravkovic*, Mihajlo C. Stefanovic
Faculty of Electronic Engineering, Department of Telecommunications
University of Nis
Aleksandra Medvedeva 14
Serbia *Faculty of Occupational Safety
University of Nis
Carnojevica 10A
Serbia
Abstract: - This paper studies wireless communication system following microdiversity to mitigate the effects
of short-term fading and macrodiversity processing to reduce shadowing effects. N-branch maximal-ratio
combining (MRC) is implemented at the micro level (single base station) and selection combining (SC) with
two base stations (dual diversity) is implemented at the macro level. Model in the paper assumes a Nakagami-m
density function for the envelope of the received signal and a gamma distribution to model the average power
to account for shadowing. Analytical expressions for the probability density function (PDF), cumulative
distribution function (CDF) and moments of signal after micro- and macrodiversity processing are derived.
These expressions are used to study important system performance criteria such as the outage probability,
average bit error probability (ABEP), average output signal value and amount of fading (AoF). Various
numerical results are graphically presented to illustrate the proposed mathematical analysis and to show the
effects of various system parameters to the system performance, as well as enhancement due to use of the
combination of micro- and macrodiversity.
Key-Words: - Gamma shadowing, Macrodiversity, Microdiversity, Nakagami-m fading.
1 Introduction In wireless communication systems, the received
signal can be exposed to both short-term fading,
which is the result of multipath propagation, and
long-term fading (shadowing), which is the result of
large obstacles and large deviations in terrain profile
between transmitter and receiver [1]. The reliability
of communication over the wireless channels can be
improved using diversity techniques, such as space
diversity techniques [2], [3]. The most popular
space diversity techniques are selection combining
(SC), equal-gain combining (EGC) and maximal-
ratio combining (MRC). MRC is optimal combining
technique in the sense that it achieves the best
performance regardless of the fading statistics on
the diversity branches. However, MRC requires the
knowledge of the channel fading amplitudes and
phases of each diversity branch which must be
continuously estimated by the receiver. These
estimations require separate receiver chain for each
branch of the diversity system increasing its
complexity. EGC provides performance comparable
to MRC, but with simpler implementation
complexity. EGC does not require the estimation of
the channel fading amplitudes since it combines
signals from all branches with the same weighting
factor. SC is the least complicated technique. It is
reposed on processing only one of the diversity
branches. SC combiner chooses the branch with the
highest signal value. Diversity techniques at single
base station (microdiversity) reduce the effects of
short-term fading. Impairments due to shadowing
can be mitigated using macrodiversity techniques
which employ the processing of signals from
multiple base stations. The use of composite micro-
and macrodiversity has received considerable
interest due to the fact that it simultaneously
combats both short-term fading and shadowing.
Rayleigh, Rician and Nakagami-m statistical
models are the most frequently used to describe
fading envelope of the received signal. The
Rayleigh distribution is frequently used to model
WSEAS TRANSACTIONS on COMMUNICATIONSNikola M. Sekulovic, Edis S. Mekic, Dragana S. Krstic, Aleksandra D. Cvetkovic, Martina Zdravkovic, Mihajlo C. Stefanovic
ISSN: 1109-2742 77 Issue 3, Volume 10, March 2011
11r
11r
21r
11r
1Nr
11r
⋮
11r
MRC
MRC
SC
1x
11r
2x
11r
12r
11r
22r
11r
2Nr
⋮11r
x
11r
multipath fading with no direct line-of-sight (LOS)
path. The Rician distribution is often used to model
propagation paths consisting of one strong direct
LOS component and many random weaker
components. The Nakagami-m distribution has
gained widespread application in the modeling of
physical fading radio channels. The primary
justification of the use of Nakagami-m fading model
is its good fit to empirical fading data. It is versatile
and through its parameter m, we can model signal
fading conditions that range from severe to
moderate, to light fading or no fading. It includes
the one-sided Gaussian distribution (m=0.5) and the
Rayleigh distribution (m=1) as special cases.
The average power, which is random variable
due to shadowing, is usually modeled with
lognormal distribution. A composite
multipath/shadowed fading environment modeled
either as Rayleigh-lognormal, Rician-lognormal or
Nakagami-lognormal is considered in [4]-[7].
Unfortunately, the use of lognormal distribution to
model the average power does not lead to a closed
form solution for the probability density function
(PDF) of the signal envelope at the receiver. This
makes the analysis of system in shadowed fading
environment very ponderous. Based on theoretical
results and measured data, it was shown that gamma
distribution does the job as well as lognormal [8],
[9]. A compound fading model incorporates both
short-term fading and shadowing which is modeled
using gamma distribution instead of lognormal
distribution [9]-[16]. Such an approach provides
analytical solution for the PDF of the output signal
facilitating the analysis of wireless systems.
In this paper, the system following micro- and
macrodiversity reception in correlated gamma
shadowed Nakagami-m fading channels is analyzed.
Analytical expressions for the PDF, cumulative
distribution function (CDF) and moments of the
output signal are derived. These analytical
expressions can be used to obtain important
performance measures, such as the outage
probability, average bit error probability (ABEP),
average signal value and amount of fading (AoF).
Numerical results are graphically presented to show
the effects of fading severity, shadowing severity,
number of diversity branches at the micro level and
correlation coefficient on system performance, as
well as enhancement due to use of the combination
of micro- and macrodiversity.
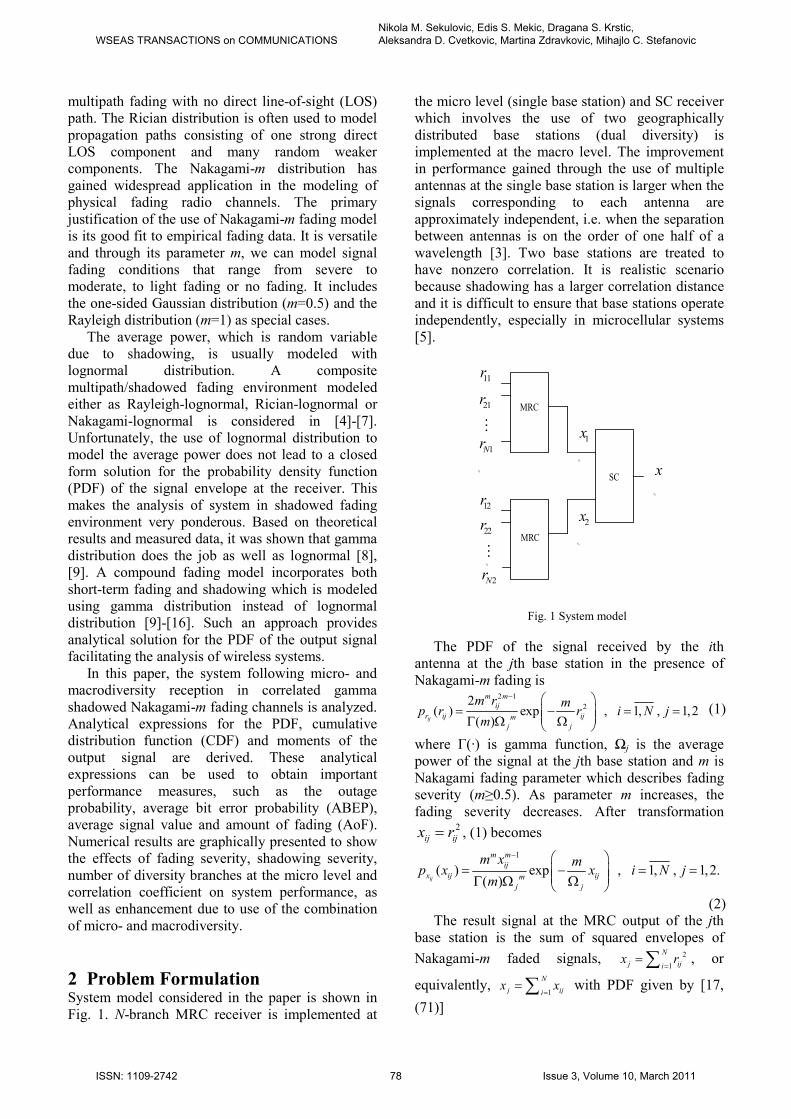
2 Problem Formulation System model considered in the paper is shown in
Fig. 1. N-branch MRC receiver is implemented at
the micro level (single base station) and SC receiver
which involves the use of two geographically
distributed base stations (dual diversity) is
implemented at the macro level. The improvement
in performance gained through the use of multiple
antennas at the single base station is larger when the
signals corresponding to each antenna are
approximately independent, i.e. when the separation
between antennas is on the order of one half of a
wavelength [3]. Two base stations are treated to
have nonzero correlation. It is realistic scenario
because shadowing has a larger correlation distance
and it is difficult to ensure that base stations operate
independently, especially in microcellular systems
[5].
Fig. 1 System model
The PDF of the signal received by the ith
antenna at the jth base station in the presence of
Nakagami-m fading is 2 1
22
( ) exp , 1, , 1,2( )ij
m mij
r ij ijmj j
m r mp r r i N j
m
− = − = = Γ Ω Ω
(1)
where Γ(·) is gamma function, Ωj is the average
power of the signal at the jth base station and m is
Nakagami fading parameter which describes fading
severity (m≥0.5). As parameter m increases, the
fading severity decreases. After transformation 2
ij ijx r= , (1) becomes
1
( ) exp , 1, , 1,2.( )ij
m mij
x ij ijmj j
m x mp x x i N j
m
− = − = = Γ Ω Ω
(2) The result signal at the MRC output of the jth
base station is the sum of squared envelopes of
Nakagami-m faded signals, 2
1
N
j ijix r
== ∑ , or
equivalently, 1
N
j ijix x
== ∑ with PDF given by [17,
(71)]
WSEAS TRANSACTIONS on COMMUNICATIONSNikola M. Sekulovic, Edis S. Mekic, Dragana S. Krstic, Aleksandra D. Cvetkovic, Martina Zdravkovic, Mihajlo C. Stefanovic
ISSN: 1109-2742 78 Issue 3, Volume 10, March 2011
1
( ) exp , 1,2( )j
M Mj
x j j jMj j
x M Mp x y x j
M y y
− = − = Γ
(3)
where yj is the total input power (yj=NΩj) and M=Nm.
The conditional nature of the PDF in (3) reflects the existence of shadowing with yj being random variable. The joint PDF of y1 and y2 follows the correlated gamma distribution [18], [19]
( ) ( )( )( ) ( )
( )
1 2
1 12 2
1 2 1 21 2 1
0 0
1 21
0
, exp1 1
2
1
c c
y y c
c
y y y yp y y
c y y
y yI
y
ρ
ρ ρ
ρρ
− −−
+
−
+= − Γ − −
× −
(4)
where ρ is the correlation between y1 and y2, c is the order of gamma distribution, y0 is related to the average power of y1 and y2 and In(·) is the first kind and nth order modified Bessel function. The severity of gamma shadowing is measured in terms of c. The lower value of c means the higher shadowing while the value of c = ∞ corresponds to a pure short-term fading channel. The relationship between the
parameter c and standard deviation σ of
shadowing in dB in the lognormal shadowing
exists through [9,(6)], ( ) ( ),4.3429dB cσ ψ= ,
where ( ),ψ ⋅ is the trigamma function. The typical
values of σ are between 2-12 dB. Selection diversity is applied at the macrolevel.
Namely, the base station with the larger average power is selected to provide service to the user. Using the concepts of probability, the PDF of the signal after diversity combining at the micro- and macrolevel can be derived as
( ) ( ) ( )
( ) ( )
( ) ( )
1
1 1 2
2
2 1 2
1
1 1 2
1 1 1 2 20 0
2 2 1 2 10 0
1 1 1 2 20 0
,
,
2 , .
y
x x y y
y
x y y
y
x y y
p x dy p x y p y y dy
dy p x y p y y dy
p x y dy p y y dy
∞
∞
∞
=
+
=
∫ ∫
∫ ∫
∫ ∫
(5)
which, by substituting (3) and (4) and using [20, (8.445), (3.381/2) and (3.471/9)], yields [15]
( )( ) ( ) ( )
( ) ( )
2
2, 0 2 2
12
20 0
1
2 1
!
k Mn c
n
x k M k Mn c nn k
k Mn c
k Mn c k
l
Mp x
M c
x
n n c y n c l
ρ
ρ
++ +
∞
− ++ + − +=
++ + −
++ +
=
=Γ Γ
−
×
Γ + + +
∑
∏
( )2( )0
22 .
1n c k M
MxK
y ρ+ + −
× −
(6)
The CDF of signal at the jth base station output is
( ) ( )0
, 1,2.j
j j
x
x j j x jF x y p t y dt j= =∫ (7)
Substituting (3) in (7) and using [20, (3.381/2)], the CDF of xj is
( ) ( ) ( )00
1 1exp .
j
M k
j j
x j j kkj j
l
Mx MxF x y
M y yM l
+∞
==
= − Γ +
∑∏
(8) The CDF of signal at the output of a dual-port
selection based macrodiversity can be obtained as
( ) ( ) ( )
( ) ( )
( ) ( )
1
1 1 2
2
2 1 2
1
1 1 2
1 1 1 2 20 0
2 2 1 2 10 0
1 1 1 2 20 0
,
,
2 ,
y
x x y y
y
x y y
y
x y y
F x dy F x y p y y dy
dy F x y p y y dy
F x y dy p y y dy
∞
∞
∞
=
+
=
∫ ∫
∫ ∫
∫ ∫
(9)
which, by substituting (4) and (8) and using [20, (3.381/2) and (3.471/9)] to solve integrals, becomes [15]
( )( ) ( ) ( )
( )
( ) ( ) ( )
( )
2, , 0 2 2
2
20 0 0
2( )0
1
2 1
!
22 .
1
n
x i k M i k Mn c nn i k
i k Mn c
i k Mn c i k
j l
n c i k M
F xM c
Mx
n n c y n c j M l
MxK
y
ρ
ρ
ρ
∞
− − + ++ + − +=
+ ++ +
+ ++ +
= =
+ + − −
=Γ Γ
−
×
Γ + + + +
× −
∑
∏ ∏
(10)
The Lth order moment of the received signal can be derived as [21, eq. (5-38)]
( )0
L LL xx x x p x dx
∞
= ε = ∫ . (11)
Substituting (6) in (11) and using [20, eq. (6.561/16)], Lth moment can be written as
( )
( ) ( )( ) ( )( ) ( ) ( )
0
2 1, 0
0
1
( )
1 2.
2 !
L
L cn L
kL n c k Ln k
l
xM c
y L n c k L M
n M n c n l c
+∞
+ + + −=
=
=Γ Γ
ρ − ρ Γ + + + Γ +×
Γ + + +∑
∏
(12)
3 Performance analysis 3.1 Outage probability The outage probability, Pout, is one of the widely accepted performance measure for diversity systems operating in fading environment. It is defined as the probability that the output signal value falls bellow a
WSEAS TRANSACTIONS on COMMUNICATIONSNikola M. Sekulovic, Edis S. Mekic, Dragana S. Krstic, Aleksandra D. Cvetkovic, Martina Zdravkovic, Mihajlo C. Stefanovic
ISSN: 1109-2742 79 Issue 3, Volume 10, March 2011
given outage threshold λth. The outage threshold is a protection value above which the quality of service (QoS) is satisfactory. The outage probability can be obtained by replacing x with λth in (10) , i.e.
( ).out x thP F λ= (13)
Expression for the outage probability is in the form of the nested infinite multiple sums. But, it converge rapidly, and therefore, it can be used efficiently. As an indicative example, the convergence rate of expression for the outage probability is examined in Table 1. Table 1 summarizes the number of terms that need to be summed to achieve accuracy at the 4th significant digit. The number of the required terms depends strongly on ρ and λth. It is obvious that the number of terms increases as ρ and/or λth increases.
TABLE 1 The number of terms needed to be summed in (13) to achieve accuracy at the 4th significant digit
(01.8, 3dB, 5 dB and =2m y Nσ= = = )
λth (dB) ρ = 0.2 ρ = 0.6
-5 7 12
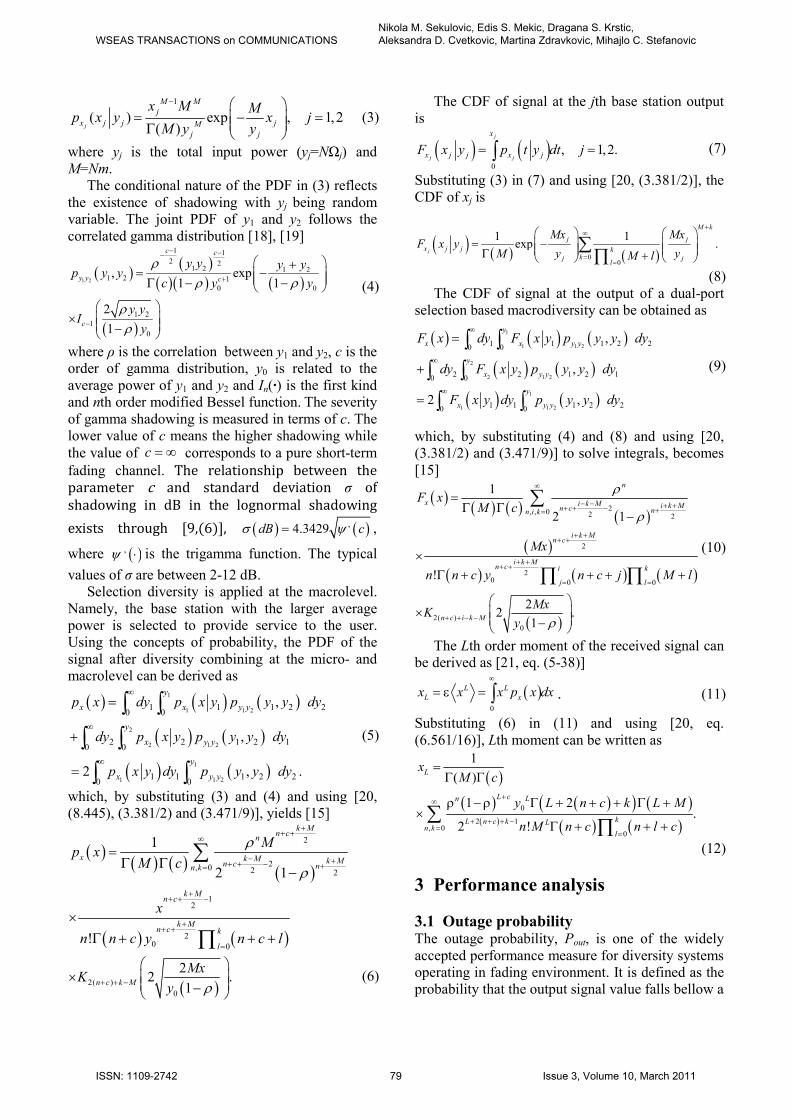
5 11 15 In Fig. 2, the outage probability versus the
normalized outage threshold, 0/th yλ , for different fading and shadowing severity is plotted. As expected, system performance improves as severity of both fading and shadowing decreases (i.e. m increases and σ decreases). In addition, fading severity has a larger influence on the outage probability of system under a lighter shadowing.
-15 -10 -5 0 5 10 15
10-6
10-5
10-4
10-3
10-2
10-1
100
Out
age
prob
abil
ity
λth/y
0 (dB)
m=1.8 m=3.1
σ =12 dB
σ =6 dBmoderate shadowing
σ =2 dBlight shadowing
heavy shadowing
ρ=0.2, N=2
Fig. 2 Outage probability versus normalized outage threshold for different fading and shadowing severity
The outage probability versus the normalized outage threshold for different number of diversity branches and correlation coefficient is plotted in Fig. 3. The system performance is better in the case of larger number of diversity branches at the base stations and for lower values of the correlation coefficient, i.e. for larger spatial separation between base stations. If the correlation is too high, then deep fades in the macrodiversity branches will occur simultaneously resulting in low improvement degree of considered space diversity system.
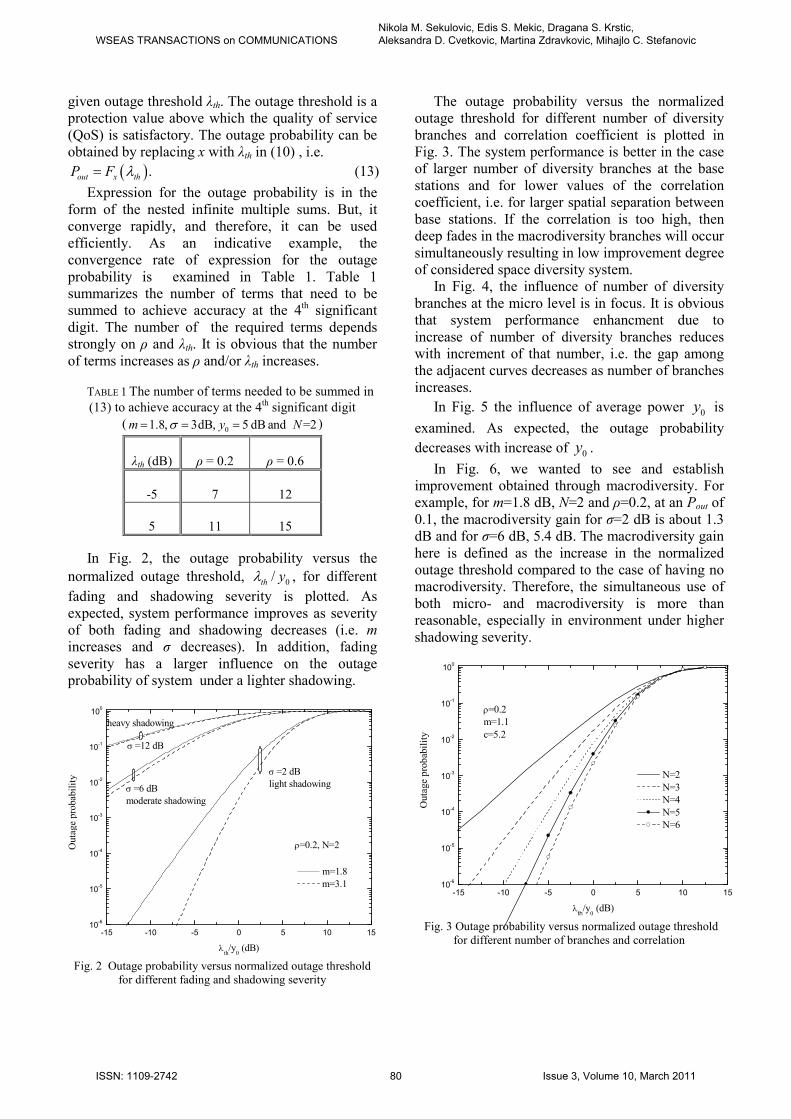
In Fig. 4, the influence of number of diversity branches at the micro level is in focus. It is obvious that system performance enhancment due to increase of number of diversity branches reduces with increment of that number, i.e. the gap among the adjacent curves decreases as number of branches increases.
In Fig. 5 the influence of average power 0y is
examined. As expected, the outage probability decreases with increase of 0y .
In Fig. 6, we wanted to see and establish improvement obtained through macrodiversity. For example, for m=1.8 dB, N=2 and ρ=0.2, at an Pout of 0.1, the macrodiversity gain for σ=2 dB is about 1.3 dB and for σ=6 dB, 5.4 dB. The macrodiversity gain here is defined as the increase in the normalized outage threshold compared to the case of having no macrodiversity. Therefore, the simultaneous use of both micro- and macrodiversity is more than reasonable, especially in environment under higher shadowing severity.
-15 -10 -5 0 5 10 15
10-6
10-5
10-4
10-3
10-2
10-1
100
Out
age
prob
abil
ity
λth/y
0 (dB)
N=2 N=3 N=4 N=5 N=6
ρ=0.2m=1.1c=5.2
Fig. 3 Outage probability versus normalized outage threshold for different number of branches and correlation
WSEAS TRANSACTIONS on COMMUNICATIONSNikola M. Sekulovic, Edis S. Mekic, Dragana S. Krstic, Aleksandra D. Cvetkovic, Martina Zdravkovic, Mihajlo C. Stefanovic
ISSN: 1109-2742 80 Issue 3, Volume 10, March 2011
-15 -10 -5 0 5 10 15
10-6
10-5
10-4
10-3
10-2
10-1
100
Out
age
prob
abil
ity
λth/y
0 (dB)
N=2 N=3 N=4 N=5 N=6
ρ=0.2m=1.1σ=2 dBy=5dB
Fig. 4 Outage probability versus normalized outage threshold for different number of branches
-10 -5 0 5 10 15 20
10-5
10-4
10-3
10-2
10-1
100
Out
age
prob
abil
ity
λth (dB)
N=3 N=5
ρ=0.2m=1.1σ=2 dB
y0=0, 5, 10 dB
Fig. 5 Outage probability versus outage threshold for different
values of average power 0y and number of branches
-15 -10 -5 0 5 10 15
10-5
10-4
10-3
10-2
10-1
100
Out
age
prob
abil
ity
λth/y
0 (dB)
with macrodiversity, ρ=0.2 without macrodiversity
σ =2 dBlight shadowing
σ =6 dBmoderate shadowing
N=2, m=1.8
Fig. 6 Outage probability versus normalized outage threshold for systems with and without macrodiversity for different
shadowing severity
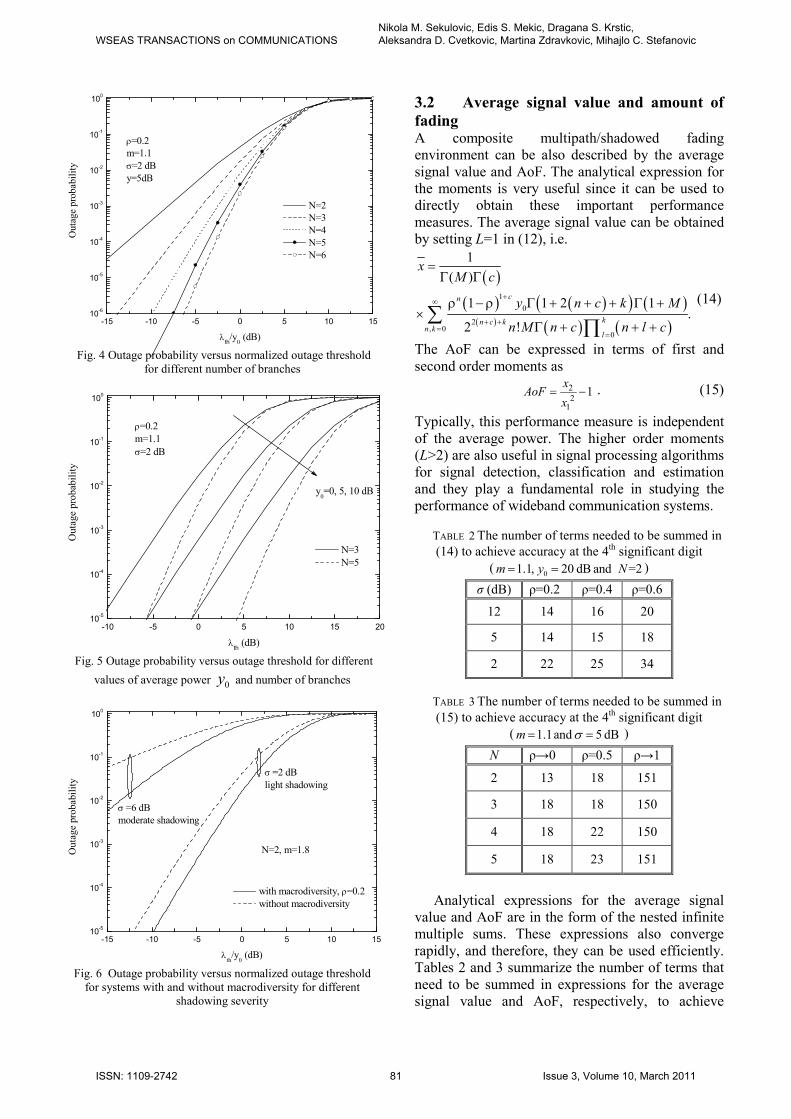
3.2 Average signal value and amount of fading A composite multipath/shadowed fading environment can be also described by the average signal value and AoF. The analytical expression for the moments is very useful since it can be used to directly obtain these important performance measures. The average signal value can be obtained by setting L=1 in (12), i.e.
( )
( ) ( )( ) ( )( ) ( ) ( )
1
0
2, 0
0
1
( )
1 1 2 1.
2 !
cn
kn c kn k
l
xM c
y n c k M
n M n c n l c
+∞
+ +=
=
=Γ Γ
ρ − ρ Γ + + + Γ +×
Γ + + +∑
∏
(14)
The AoF can be expressed in terms of first and second order moments as
22
1
1x
AoFx
= − . (15)
Typically, this performance measure is independent of the average power. The higher order moments (L>2) are also useful in signal processing algorithms for signal detection, classification and estimation and they play a fundamental role in studying the performance of wideband communication systems.
TABLE 2 The number of terms needed to be summed in (14) to achieve accuracy at the 4th significant digit
(01.1, 20 dB and =2m y N= = )
σ (dB) ρ=0.2 ρ=0.4 ρ=0.6
12 14 16 20
5 14 15 18
2 22 25 34
TABLE 3 The number of terms needed to be summed in (15) to achieve accuracy at the 4th significant digit
( 1.1and 5 dBm σ= = )
N ρ→0 ρ=0.5 ρ→1
2 13 18 151
3 18 18 150
4 18 22 150
5 18 23 151
Analytical expressions for the average signal
value and AoF are in the form of the nested infinite multiple sums. These expressions also converge rapidly, and therefore, they can be used efficiently. Tables 2 and 3 summarize the number of terms that need to be summed in expressions for the average signal value and AoF, respectively, to achieve
WSEAS TRANSACTIONS on COMMUNICATIONSNikola M. Sekulovic, Edis S. Mekic, Dragana S. Krstic, Aleksandra D. Cvetkovic, Martina Zdravkovic, Mihajlo C. Stefanovic
ISSN: 1109-2742 81 Issue 3, Volume 10, March 2011
accuracy at the 4th significant digit. The number of terms depends strongly on the correlation coefficient. In the case of strong correlation, the number of terms is large.
0 2 4 6 8 10 12 14 16 18 20
0
25
50
75
100
Ave
rage
sig
nal v
alue
y0 (dB)
ρ=0.2 ρ=0.4 ρ=0.6
N=2m=1.1
σ=2 dB σ=5 dB σ=12 dB
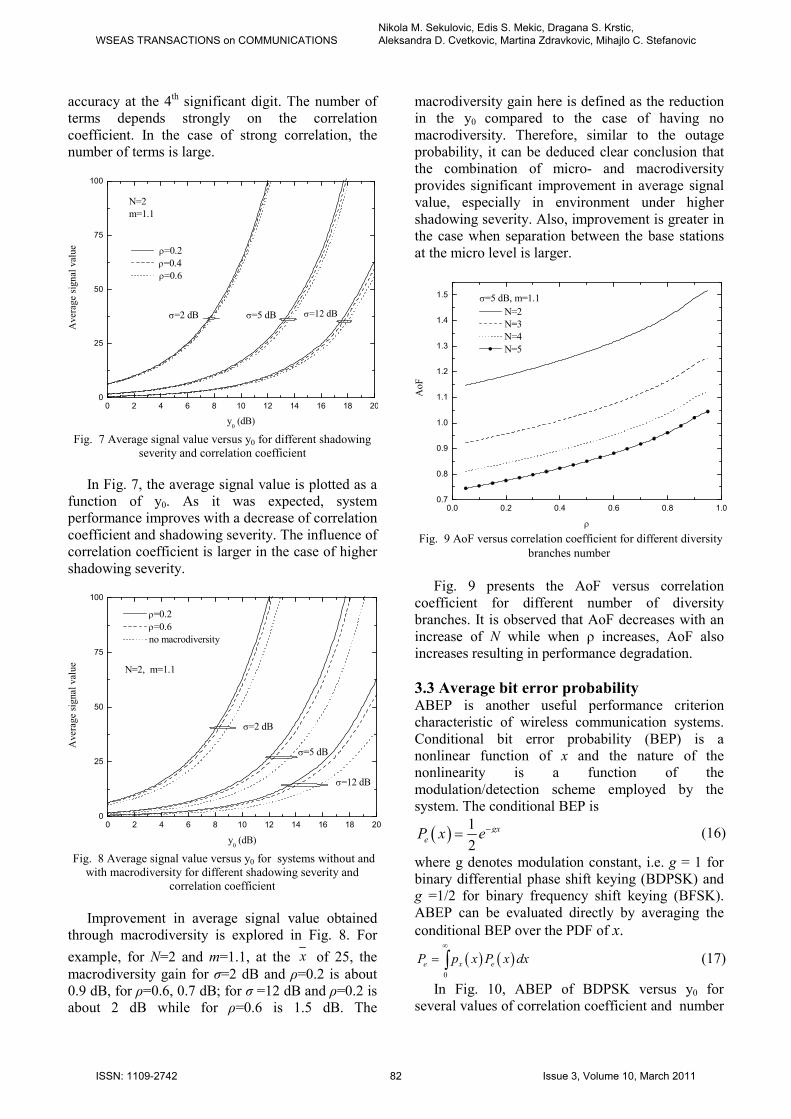
Fig. 7 Average signal value versus y0 for different shadowing severity and correlation coefficient
In Fig. 7, the average signal value is plotted as a
function of y0. As it was expected, system performance improves with a decrease of correlation coefficient and shadowing severity. The influence of correlation coefficient is larger in the case of higher shadowing severity.
0 2 4 6 8 10 12 14 16 18 20
0
25
50
75
100
Ave
rage
sig
nal v
alue
y0 (dB)
ρ=0.2 ρ=0.6 no macrodiversity
N=2, m=1.1
σ=2 dB
σ=5 dB
σ=12 dB
Fig. 8 Average signal value versus y0 for systems without and with macrodiversity for different shadowing severity and
correlation coefficient
Improvement in average signal value obtained through macrodiversity is explored in Fig. 8. For
example, for N=2 and m=1.1, at the x of 25, the macrodiversity gain for σ=2 dB and ρ=0.2 is about 0.9 dB, for ρ=0.6, 0.7 dB; for σ =12 dB and ρ=0.2 is about 2 dB while for ρ=0.6 is 1.5 dB. The
macrodiversity gain here is defined as the reduction in the y0 compared to the case of having no macrodiversity. Therefore, similar to the outage probability, it can be deduced clear conclusion that the combination of micro- and macrodiversity provides significant improvement in average signal value, especially in environment under higher shadowing severity. Also, improvement is greater in the case when separation between the base stations at the micro level is larger.
0.0 0.2 0.4 0.6 0.8 1.0
0.7
0.8
0.9
1.0
1.1
1.2
1.3
1.4
1.5
AoF
ρ
N=2 N=3 N=4 N=5
σ=5 dB, m=1.1
Fig. 9 AoF versus correlation coefficient for different diversity branches number
Fig. 9 presents the AoF versus correlation
coefficient for different number of diversity branches. It is observed that AoF decreases with an increase of N while when ρ increases, AoF also increases resulting in performance degradation. 3.3 Average bit error probability ABEP is another useful performance criterion characteristic of wireless communication systems. Conditional bit error probability (BEP) is a nonlinear function of x and the nature of the nonlinearity is a function of the modulation/detection scheme employed by the system. The conditional BEP is
( ) 1
2gx
eP x e−= (16)
where g denotes modulation constant, i.e. g = 1 for binary differential phase shift keying (BDPSK) and g =1/2 for binary frequency shift keying (BFSK). ABEP can be evaluated directly by averaging the conditional BEP over the PDF of x.
( ) ( )0
e x eP p x P x dx∞
= ∫ (17)
In Fig. 10, ABEP of BDPSK versus y0 for several values of correlation coefficient and number
WSEAS TRANSACTIONS on COMMUNICATIONSNikola M. Sekulovic, Edis S. Mekic, Dragana S. Krstic, Aleksandra D. Cvetkovic, Martina Zdravkovic, Mihajlo C. Stefanovic
ISSN: 1109-2742 82 Issue 3, Volume 10, March 2011
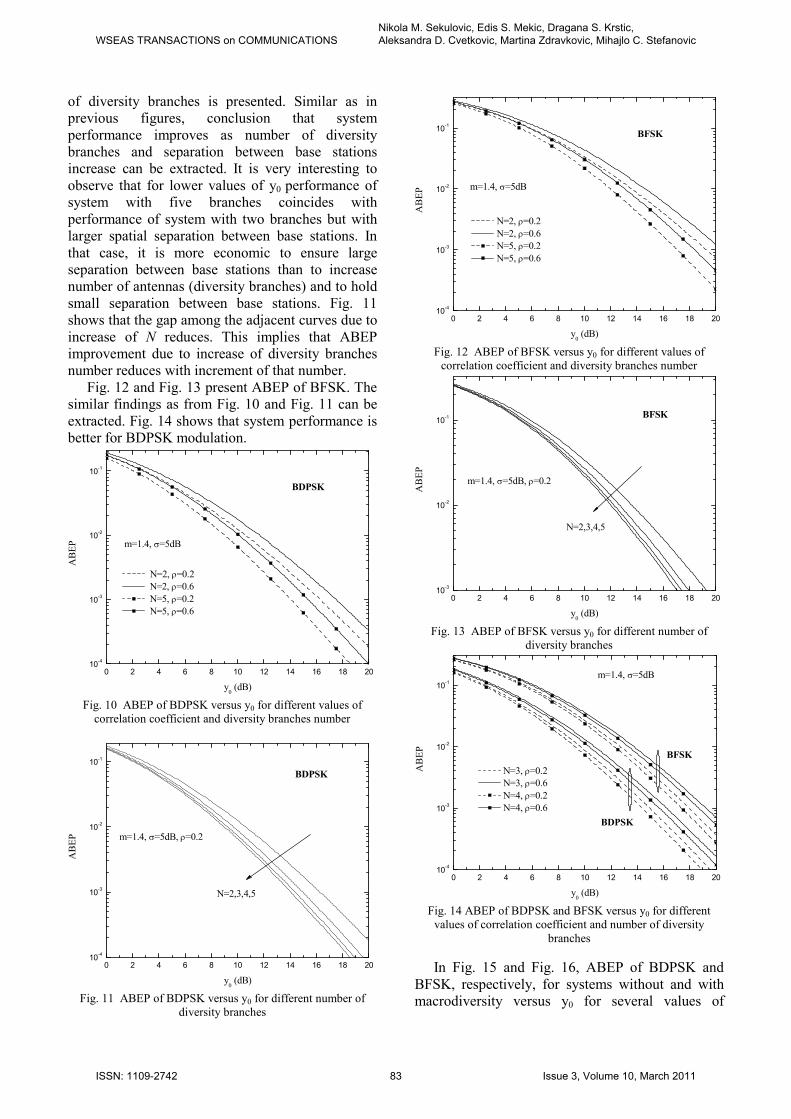
of diversity branches is presented. Similar as in previous figures, conclusion that system performance improves as number of diversity branches and separation between base stations increase can be extracted. It is very interesting to observe that for lower values of y0 performance of system with five branches coincides with performance of system with two branches but with larger spatial separation between base stations. In that case, it is more economic to ensure large separation between base stations than to increase number of antennas (diversity branches) and to hold small separation between base stations. Fig. 11 shows that the gap among the adjacent curves due to increase of N reduces. This implies that ABEP improvement due to increase of diversity branches number reduces with increment of that number.
Fig. 12 and Fig. 13 present ABEP of BFSK. The similar findings as from Fig. 10 and Fig. 11 can be extracted. Fig. 14 shows that system performance is better for BDPSK modulation.
0 2 4 6 8 10 12 14 16 18 20
10-4
10-3
10-2
10-1
AB
EP
y0 (dB)
N=2, ρ=0.2 N=2, ρ=0.6 N=5, ρ=0.2 N=5, ρ=0.6
m=1.4, σ=5dB
BDPSK
Fig. 10 ABEP of BDPSK versus y0 for different values of
correlation coefficient and diversity branches number
0 2 4 6 8 10 12 14 16 18 20
10-4
10-3
10-2
10-1
AB
EP
y0 (dB)
m=1.4, σ=5dB, ρ=0.2
N=2,3,4,5
BDPSK
Fig. 11 ABEP of BDPSK versus y0 for different number of
diversity branches
0 2 4 6 8 10 12 14 16 18 20
10-4
10-3
10-2
10-1
AB
EP
y0 (dB)
N=2, ρ=0.2 N=2, ρ=0.6 N=5, ρ=0.2 N=5, ρ=0.6
m=1.4, σ=5dB
BFSK
Fig. 12 ABEP of BFSK versus y0 for different values of
correlation coefficient and diversity branches number
0 2 4 6 8 10 12 14 16 18 20
10-3
10-2
10-1
AB
EP
y0 (dB)
m=1.4, σ=5dB, ρ=0.2
BFSK
N=2,3,4,5
Fig. 13 ABEP of BFSK versus y0 for different number of
diversity branches
0 2 4 6 8 10 12 14 16 18 20
10-4
10-3
10-2
10-1
AB
EP
y0 (dB)
N=3, ρ=0.2 N=3, ρ=0.6 N=4, ρ=0.2 N=4, ρ=0.6
m=1.4, σ=5dB
BDPSK
BFSK
Fig. 14 ABEP of BDPSK and BFSK versus y0 for different
values of correlation coefficient and number of diversity branches
In Fig. 15 and Fig. 16, ABEP of BDPSK and
BFSK, respectively, for systems without and with macrodiversity versus y0 for several values of
WSEAS TRANSACTIONS on COMMUNICATIONSNikola M. Sekulovic, Edis S. Mekic, Dragana S. Krstic, Aleksandra D. Cvetkovic, Martina Zdravkovic, Mihajlo C. Stefanovic
ISSN: 1109-2742 83 Issue 3, Volume 10, March 2011
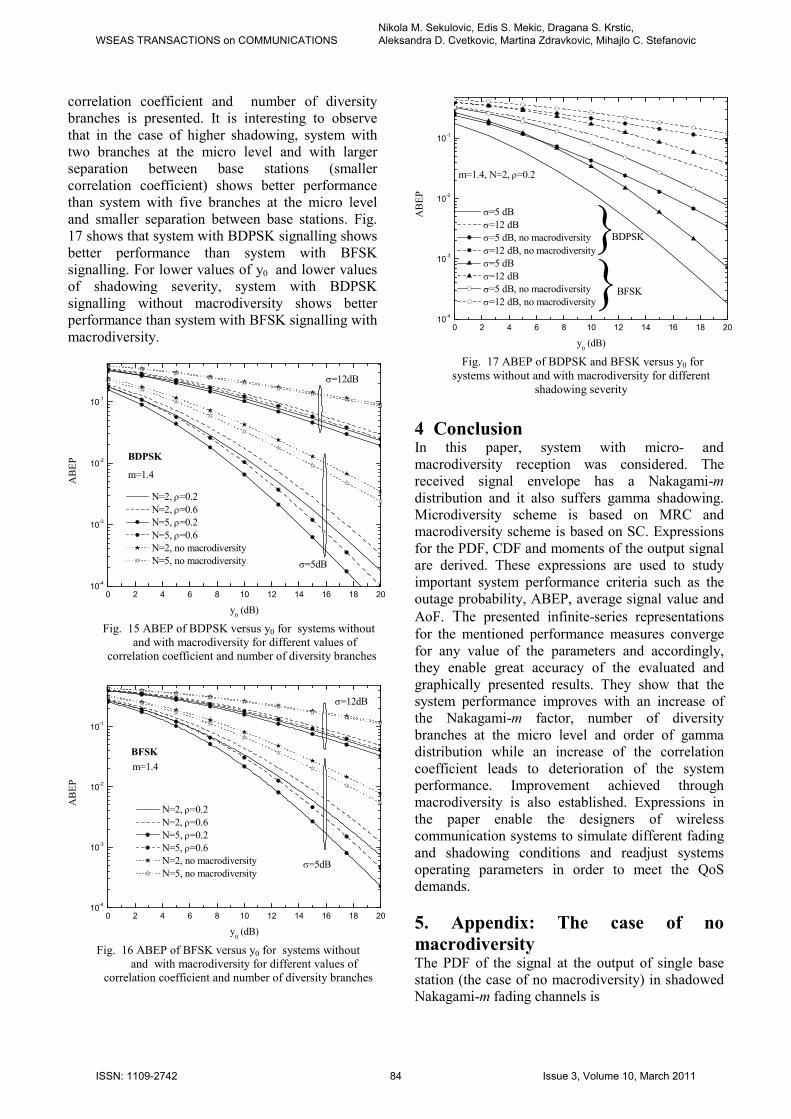
correlation coefficient and number of diversity branches is presented. It is interesting to observe that in the case of higher shadowing, system with two branches at the micro level and with larger separation between base stations (smaller correlation coefficient) shows better performance than system with five branches at the micro level and smaller separation between base stations. Fig. 17 shows that system with BDPSK signalling shows better performance than system with BFSK signalling. For lower values of y0 and lower values of shadowing severity, system with BDPSK signalling without macrodiversity shows better performance than system with BFSK signalling with macrodiversity.
0 2 4 6 8 10 12 14 16 18 20
10-4
10-3
10-2
10-1
AB
EP
y0 (dB)
N=2, ρ=0.2 N=2, ρ=0.6 N=5, ρ=0.2 N=5, ρ=0.6 N=2, no macrodiversity N=5, no macrodiversity
BDPSK
σ=5dB
σ=12dB
m=1.4
Fig. 15 ABEP of BDPSK versus y0 for systems without and with macrodiversity for different values of
correlation coefficient and number of diversity branches
0 2 4 6 8 10 12 14 16 18 20
10-4
10-3
10-2
10-1
σ=12dB
σ=5dB
AB
EP
y0 (dB)
N=2, ρ=0.2 N=2, ρ=0.6 N=5, ρ=0.2 N=5, ρ=0.6 N=2, no macrodiversity N=5, no macrodiversity
BFSK
m=1.4
Fig. 16 ABEP of BFSK versus y0 for systems without and with macrodiversity for different values of correlation coefficient and number of diversity branches
0 2 4 6 8 10 12 14 16 18 20
10-4
10-3
10-2
10-1
A
BE
P
y0 (dB)
σ=5 dB σ=12 dB σ=5 dB, no macrodiversity σ=12 dB, no macrodiversity σ=5 dB σ=12 dB σ=5 dB, no macrodiversity σ=12 dB, no macrodiversity
m=1.4, N=2, ρ=0.2
BDPSK
BFSK
Fig. 17 ABEP of BDPSK and BFSK versus y0 for systems without and with macrodiversity for different
shadowing severity
4 Conclusion In this paper, system with micro- and macrodiversity reception was considered. The received signal envelope has a Nakagami-m distribution and it also suffers gamma shadowing. Microdiversity scheme is based on MRC and macrodiversity scheme is based on SC. Expressions for the PDF, CDF and moments of the output signal are derived. These expressions are used to study important system performance criteria such as the outage probability, ABEP, average signal value and AoF. The presented infinite-series representations for the mentioned performance measures converge for any value of the parameters and accordingly, they enable great accuracy of the evaluated and graphically presented results. They show that the system performance improves with an increase of the Nakagami-m factor, number of diversity branches at the micro level and order of gamma distribution while an increase of the correlation coefficient leads to deterioration of the system performance. Improvement achieved through macrodiversity is also established. Expressions in the paper enable the designers of wireless communication systems to simulate different fading and shadowing conditions and readjust systems operating parameters in order to meet the QoS demands.
5. Appendix: The case of no macrodiversity The PDF of the signal at the output of single base station (the case of no macrodiversity) in shadowed Nakagami-m fading channels is
WSEAS TRANSACTIONS on COMMUNICATIONSNikola M. Sekulovic, Edis S. Mekic, Dragana S. Krstic, Aleksandra D. Cvetkovic, Martina Zdravkovic, Mihajlo C. Stefanovic
ISSN: 1109-2742 84 Issue 3, Volume 10, March 2011

( ) ( ) ( )0x x yp x p x y p y dy∞
= ∫ (18)
where ( )yp y is the gamma PDF of the average
power given by [19]
( ) ( )( )
10
0
exp /.
c
y c
y y yp y
c y
− −=
Γ (19)
Substituting (3) and (19) in (18) and after some straightforward manipulations, integral can be solved with the use of [20, (3.471/9)], resulting in analytical expression for the PDF of x
( )( ) ( )
12 2
020
22 .
c M c M
x c Mc M
M x Mxp x K
yM c y
+ +−
−+
=
Γ Γ
(20)
The CDF of x can be obtained using
( ) ( ) ( )0x x yF x F x y p y dy∞
= ∫ . (21)
Substituting (8) and (19) in (21) and after some straightforward manipulations, integral can be solved with the use of [20, (3.471/9)], resulting in analytical expression for the CDF of x
( )( ) ( )
( )
( )
2
0 20 0
0
2
2 .
c M k
x c M kkk
l
c M k
MxF x
M cy M l
MxK
y
+ +∞
+ +=
=
− −
=Γ Γ
+
×
∑∏ (22)
Substituting (20) in (11) and using [20, (6.561/16)], Lth moment for the case of no macrodiversity can be written as
( ) ( )( )
0
( )
L
L L
y c L M Lx
M c M
Γ + Γ +=
Γ Γ. (23)
References: [1] D. Tse and P. Viswanath, Fundamentals of
Wireless Communication, Cambrige University Press, 2005.
[2] M. K. Simon and M.-S. Alouini, Digital Communication over Fading Channels, 1st ed. New York: Wiley, 2000.
[3] A. Goldsmith, Wireless Communications, Cambridge University Press, 2005.
[4] F. Hansen and F. I. Mano, Mobile fading-Rayleigh and lognormal superimposed, IEEE Trans. Veh. Tech., vol. 26, no. 4, 1977, pp. 332–335.
[5] J. Zhang and V. Aalo, Effect of macrodiversity on average-error probabilities in a Rician fading channel with correlated lognormal shadowing, IEEE Trans. Commun., vol. 49, no. 1, 2001, pp. 14-18.
[6] E. K. Al-Hussaini, A. M. Al-Bassiouni, H. Mouradand and H. Al-Shennawy, Composite macroscopic and microscopic diversity of sectorized macrocellular and microcellular mobile radio systems employing RAKE receiver over Nakagami fading plus lognormal shadowing channel, Wireless Personal Commun., vol. 21, 2002, pp. 309–328.
[7] A. S. Panajotovic, M. C. Stefanovic and D. Lj. Draca, Effect of microdiversity and macrodiversity on average bit error probability in shadowed fading channels in the presence of interference, ETRI J., vol. 31, no. 5, 2009, pp. 500-505.
[8] A. Abdi and M. Kaveh, On the utility of gamma PDF in modeling shadow fading (slow fading), in Proc. IEEE Veh. Tech. Conf., Houston, TX, vol. 3, 1999, pp. 2308-2312.
[9] P. M. Shankar, Performance analysis of diversity combining algorithms in shadowed fading channels, Wireless Personal Commun., vol. 37, 2006, pp. 61-72.
[10] I. Kostic, Analytical approach to performance analysis for channel subject to shadowing and fading, IEE Proc. Comm., vol. 152, no. 6, 2005, pp. 821-827.
[11] P. M. Shankar, Analysis of microdiversity and dual channel macrodiversity in shadowed fading channels using a compound fading model, Int. J. Electron. Commun. AEÜ, vol. 62, no. 6, 2008, pp. 445-449.
[12] P.M. Shankar, Outage analysis in wireless channels with multiple interferers subjected to shadowing and fading using a compound pdf model, Int. J. Electron. Commun. AEÜ vol. 61, 2007, pp. 255-261.
[13] P. M. Shankar, Outage Probabilities of a MIMO Scheme in Shadowed Fading Channels with Micro- and Macrodiversity Reception, IEEE Trans. Wireless Commun., vol. 7, no. 6, 2008, pp. 2015-2019.
[14] Nikola Sekulović, Dragan Drača, Aleksandra Panajotović, Zorica Nikolić, Časlav Stefanović, Channel Capacity of a System in Shadowed fading Channels with Micro- and Macrodiversity Reception, in Proc. ICEST 2009, Veliko Tarnovo, Bulgaria, vol. 1, 2009, pp. 82-84.
[15] Nikola M. Sekulović, Edis S. Mekić, Dragana S. Krstić, Ilija M. Temelkovski, Danijela Manić, Mihajlo Č. Stefanović, Outage probability of macrodiversity system in Nakagami-m fading channels with correlated gamma shadowing, in Proc. International
WSEAS TRANSACTIONS on COMMUNICATIONSNikola M. Sekulovic, Edis S. Mekic, Dragana S. Krstic, Aleksandra D. Cvetkovic, Martina Zdravkovic, Mihajlo C. Stefanovic
ISSN: 1109-2742 85 Issue 3, Volume 10, March 2011

Conference on Circuits, Systems, Signals (CSS), Malta, 2010, pp. 266-270.
[16] V. Milenkovic, N. Sekulovic, M. Stefanovic and M. Petrovic, Effect of microdiversity and macrodiversity on average bit error probability in gamma shadowed Rician fading channels, ETRI J., vol. 32, no. 3, 2010, pp. 464-467.
[17] M. Nakagami, The m-distribution - A general formula of intensity distribution of rapid fading, in Statistical Methods in Radio Wave Propagation, Pergamon Press, Oxford, U.K., 1960, pp. 3-36.
[18] S. Yue, TBMJ Ouarda and B. Bobee, A review of bivariate gamma distributions for hydrological application, J. Hydrol., vol. 246, 2001, pp. 1-18.
[19] E. Xekalaki, J. Panaretos and S. Psarakis, A Predictive Model Evaluation and Selection Approach - The Correlated Gamma Ratio Distribution, STOCHASTIC MUSINGS: PERSPECTIVES FROM THE PIONEERS OF THE LATE 20TH CENTURY, J. Panaretos, ed., Laurence Erlbaum, Publisher, USA, pp. 188-202, 2003. Available at SSRN: http://ssrn.com/abstract=947067]
[20] I. S. Gradshteyn and I. M. Ryzhik, Table of integrals, series, and products, Academic, New York, 5th edn., 1994.
[21] A. Papoulis, Probability, Random Variables, and Stochastic Processes, 3rd ed., New York: McGraw-Hill, 1991
Authors' Biographies
Nikola M. Sekulović was born in Nis, Serbia, in 1983. He received the M. Sc. in electrical engineering from the Faculty of Electronic Engineering (Department of Telecommunications), University of Nis, Serbia, in 2007, and continues his studies toward the Ph.D. degree. His research interests are digital communications over fading channels, diversity techniques and mobile radio systems.
Edis S. Mekić was born in Pristina, Serbia, in 1976. He received his B. Sc, in electrical engineering from the Faculty of Electrotechnical engineering, University of Pristina, in 2002. M. Sc. in electrical engineering from the Faculty of Electronic Engineering (Department of Telecommunications), University of Nis, Serbia, in 2008, and continues his studies toward Ph.D. degree. His research interests are digital communications over fading channels, diversity techniques and mobile radio systems. He is assistant in State University Novi Pazar, Serbia.
Dragana S. Krstić was born in Pirot, Serbia, in 1966. She received the BSc, MSc and PhD degrees in electrical engineering from Faculty of Electronic Engineering, Department of Telecommunications, University of Niš, Serbia, in 1990, 1998 and 2006, respectively. She works at the Faculty of Electronic Engineering in Niš since 1990. Her field of interest includes statistical communication theory, wireless communication systems, etc. She participated in more Projects which are supported by Serbian Ministry of Science. She has written or co-authored of great number of papers, published to International/National Conferences and Journals. She is/was a member of numerous Program committees of International Conferences.
Aleksandra D. Cvetković was born in Nis, Serbia, in 1983. She received the M. Sc. in electrical engineering from the Faculty of Electronic Engineering (Department of Telecommunications), University of Nis, Serbia, in 2008. Currently she is at the third year of PhD studies. Her research interests are micro and macro diversity systems and digital communications over fading channels.
WSEAS TRANSACTIONS on COMMUNICATIONSNikola M. Sekulovic, Edis S. Mekic, Dragana S. Krstic, Aleksandra D. Cvetkovic, Martina Zdravkovic, Mihajlo C. Stefanovic
ISSN: 1109-2742 86 Issue 3, Volume 10, March 2011
Martina Ž. Zdravković was born in Kruševac, Serbia, in 1979. She received the MSc in Faculty of Occupational Safety, Department of Enviromental Protection, University of Nis, Serbia, in 2005, and continues her studies toward the master thesis in area of fire protection. Her research interests are safety engenering, fire protection, IT systems, GIS, security systems.
Mihajlo Č. Stefanović was born in Nis, Serbia, in 1947. He received the B. Sc., M. Sc. and Ph. D. degrees in electrical engineering from the Faculty of Electronic Engineering (Department of Telecommunications), University of Nis, Serbia, in 1971, 1976 and 1979, respectively. His primary research interests are statistical communication theory, optical and wireless communications. He has written or co-authored a great number of journal publications. He has written five monographs, too. Now, Dr. Stefanović is a Professor at the Faculty of Electronic Engineering in Nis.
WSEAS TRANSACTIONS on COMMUNICATIONSNikola M. Sekulovic, Edis S. Mekic, Dragana S. Krstic, Aleksandra D. Cvetkovic, Martina Zdravkovic, Mihajlo C. Stefanovic
ISSN: 1109-2742 87 Issue 3, Volume 10, March 2011