Performance Anal sisAnal ysis of 258 kWac Solar ......Performance Anal sisAnalysis of 258 kWac Solar...
19
Performance Anal sis of 258 kWac Performance Analysis of 258 kWac Solar Demonstration Project John Aiton Andy Bergrud November 10 2015 November 10, 2015
Transcript of Performance Anal sisAnal ysis of 258 kWac Solar ......Performance Anal sisAnalysis of 258 kWac Solar...
Performance Anal sis of 258 kWacPerformance Analysis of 258 kWacSolar Demonstration Project
John AitonAndy BergrudNovember 10 2015November 10, 2015

Company OverviewCompany Overview 28 member cooperatives
1.7 million consumers 88,000 miles distribution 1,575 employees
4th largest G&T in the nation 910 employees (MN & ND) 910 employees (MN & ND) 3,718 MW generation
• 710 MW renewables710 MW renewables(Wind, Hydro, Solar, Biomass)
4,696 miles transmission
2
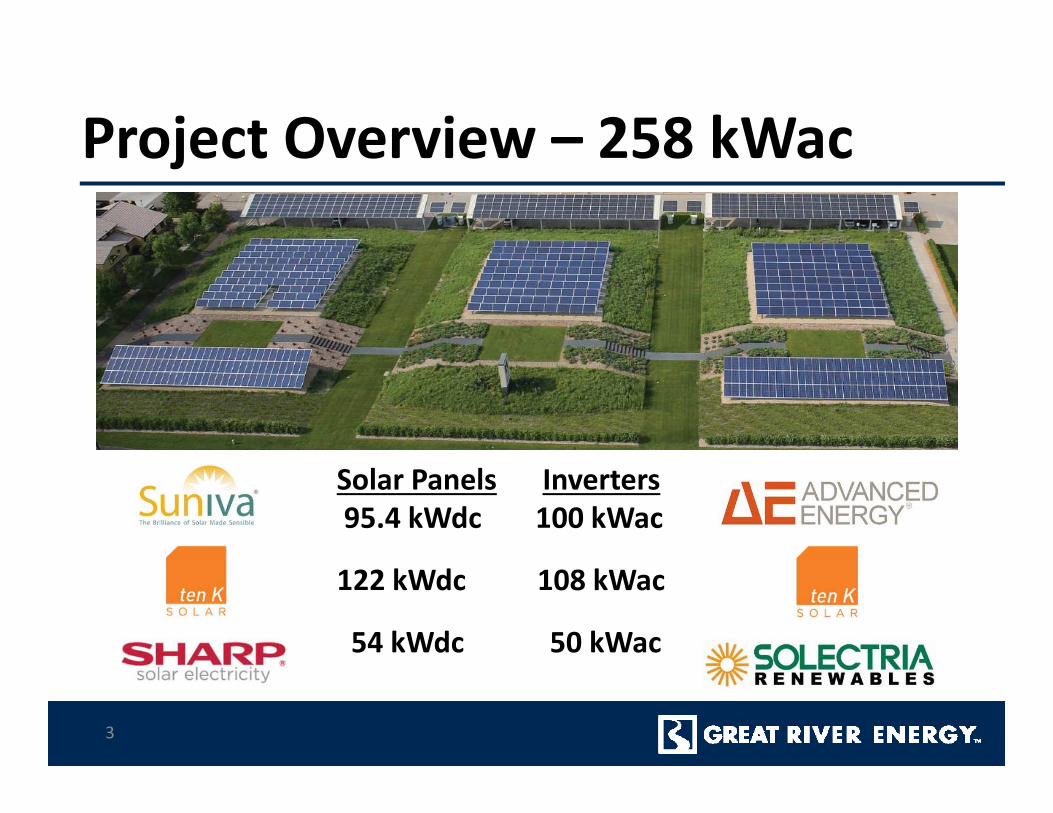
Project Overview – 258 kWacProject Overview 258 kWac
Solar Panels Inverters95.4 kWdc 100 kWac
122 kWdc 108 kWac
54 kWdc 50 kWac
3
Procurement & Construction
“Made in USA” & “Made in MN” equipment
Procurement & Construction
Made in USA & Made in MN equipment Manufacturer ownership changes
i l d i ( i f 20 6) Equipment lead times (current issue for 2016) Economies of scale pricing Tariffs on cells & module price/availability impacts Safety & NEC compliance cable management Safety & NEC compliance, cable management
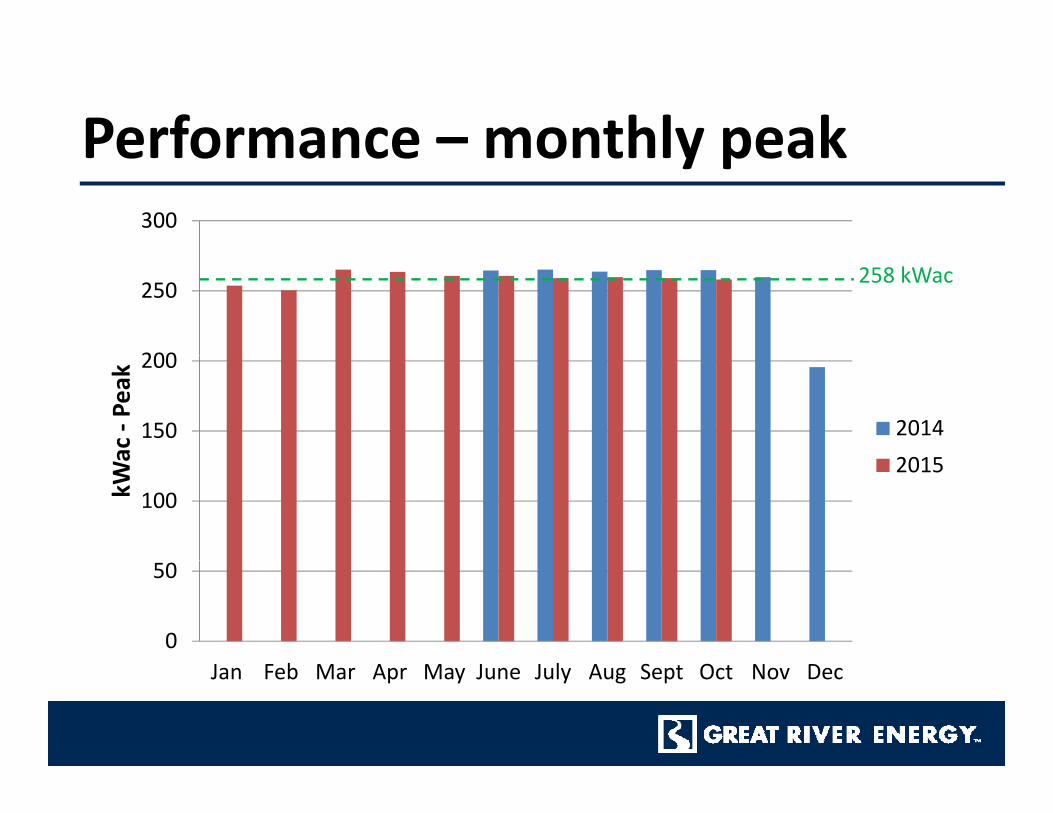
Performance – monthly peakPerformance monthly peak300
200
250258 kWac
150
200
ac ‐Pe
ak
20142015
100kWa 2015
0
50
b lJan Feb Mar Apr May June July Aug Sept Oct Nov Dec
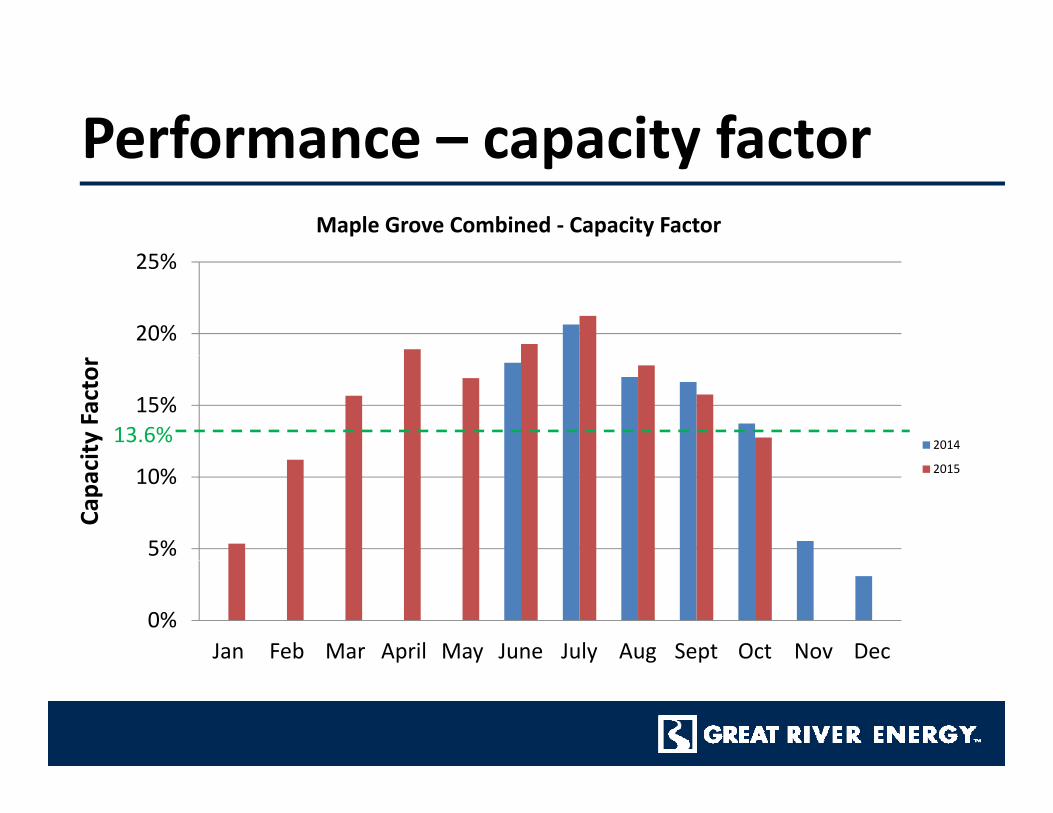
Performance – capacity factorPerformance capacity factorMaple Grove Combined ‐ Capacity Factor
20%
25%
15%
ity Factor
201413.6%
5%
10%
Capa
ci 2015
0%Jan Feb Mar April May June July Aug Sept Oct Nov Dec
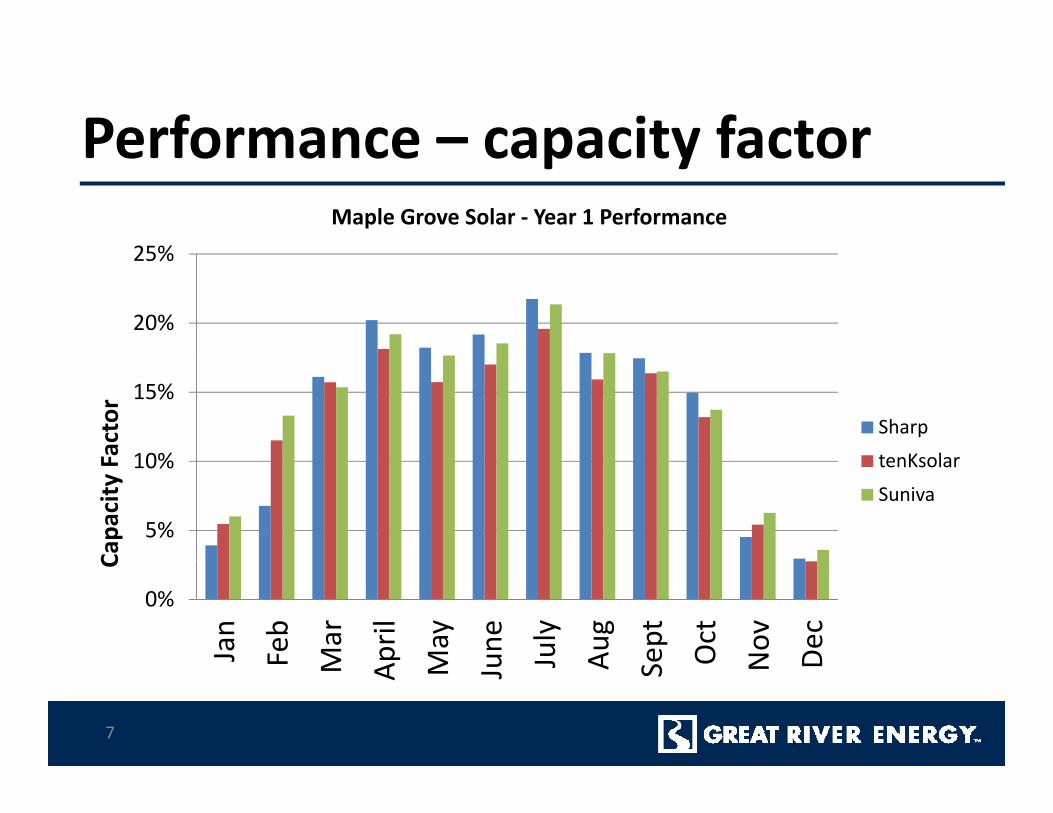
Performance – capacity factorPerformance capacity factor
25%Maple Grove Solar ‐ Year 1 Performance
20%
25%
10%
15%
Factor Sharp
tenKsolar
5%
10%
Capa
city F tenKsolar
Suniva
0%
Jan
Feb
Mar
April
May
une
July
Aug
ept
Oct
Nov Dec
C
7
F M A M Ju J A S O N D
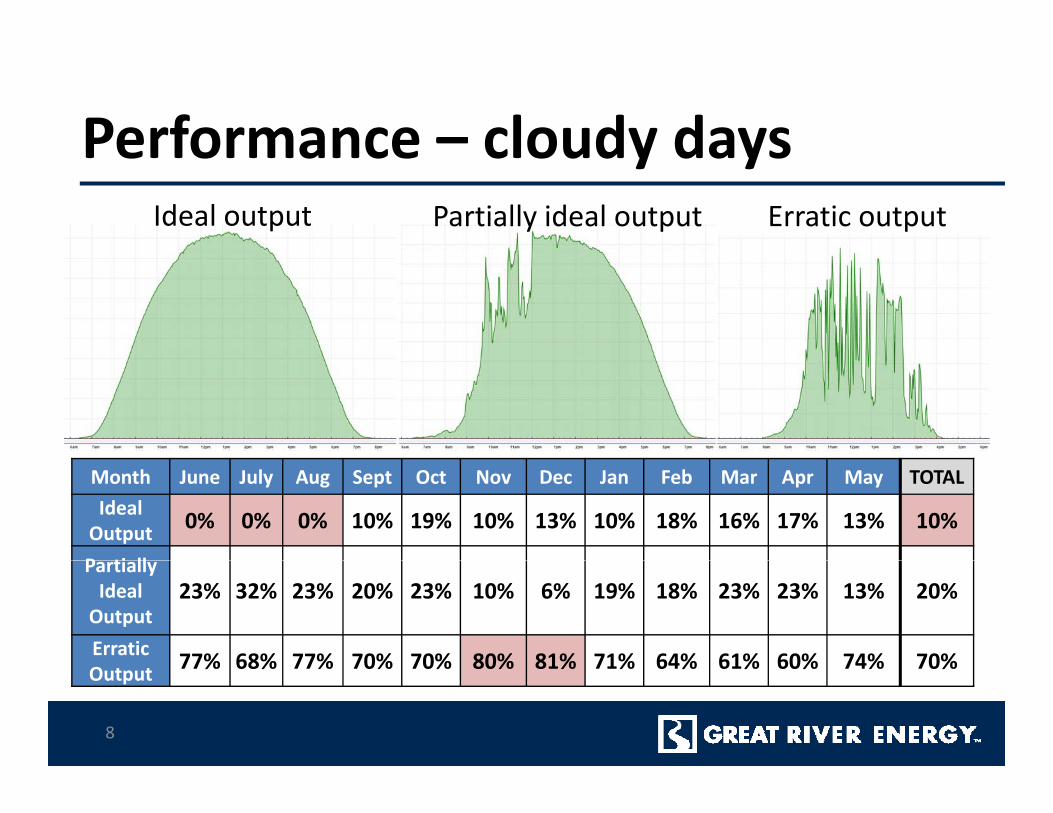
Performance – cloudy daysPerformance cloudy daysIdeal output Partially ideal output Erratic output
Month June July Aug Sept Oct Nov Dec Jan Feb Mar Apr May TOTALIdeal Output 0% 0% 0% 10% 19% 10% 13% 10% 18% 16% 17% 13% 10%
P ti llPartially Ideal Output
23% 32% 23% 20% 23% 10% 6% 19% 18% 23% 23% 13% 20%
Erratic 77% 68% 77% 70% 70% 80% 81% 71% 64% 61% 60% 74% 70%Output 77% 68% 77% 70% 70% 80% 81% 71% 64% 61% 60% 74% 70%
8
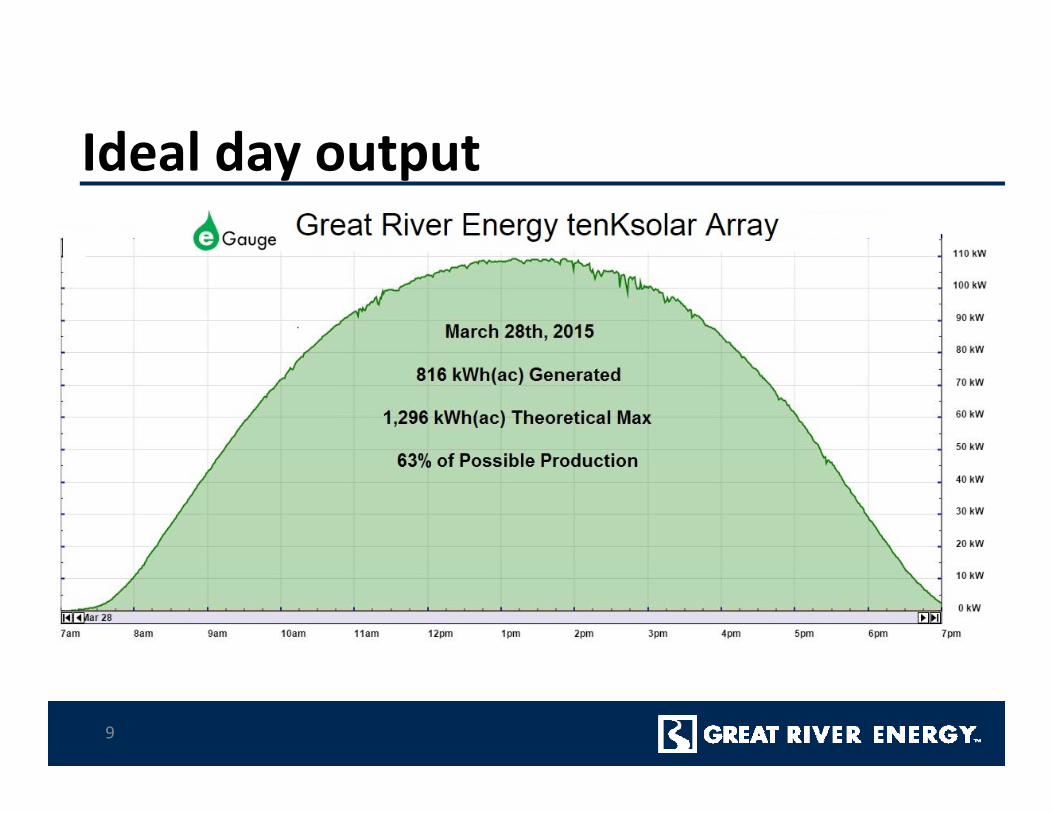
Ideal day outputIdeal day output
9
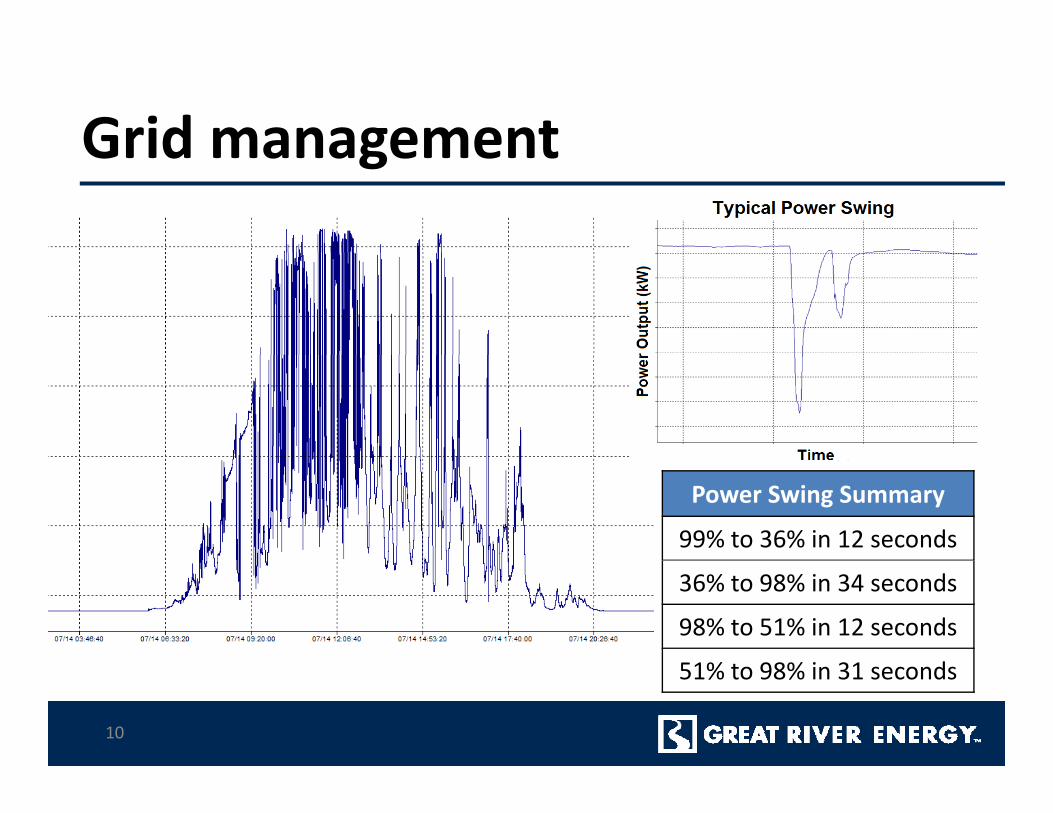
Grid managementGrid management
Power Swing Summary
99% to 36% in 12 seconds
36% to 98% in 34 seconds
98% to 51% in 12 seconds
51% 98% i 31 d51% to 98% in 31 seconds
10
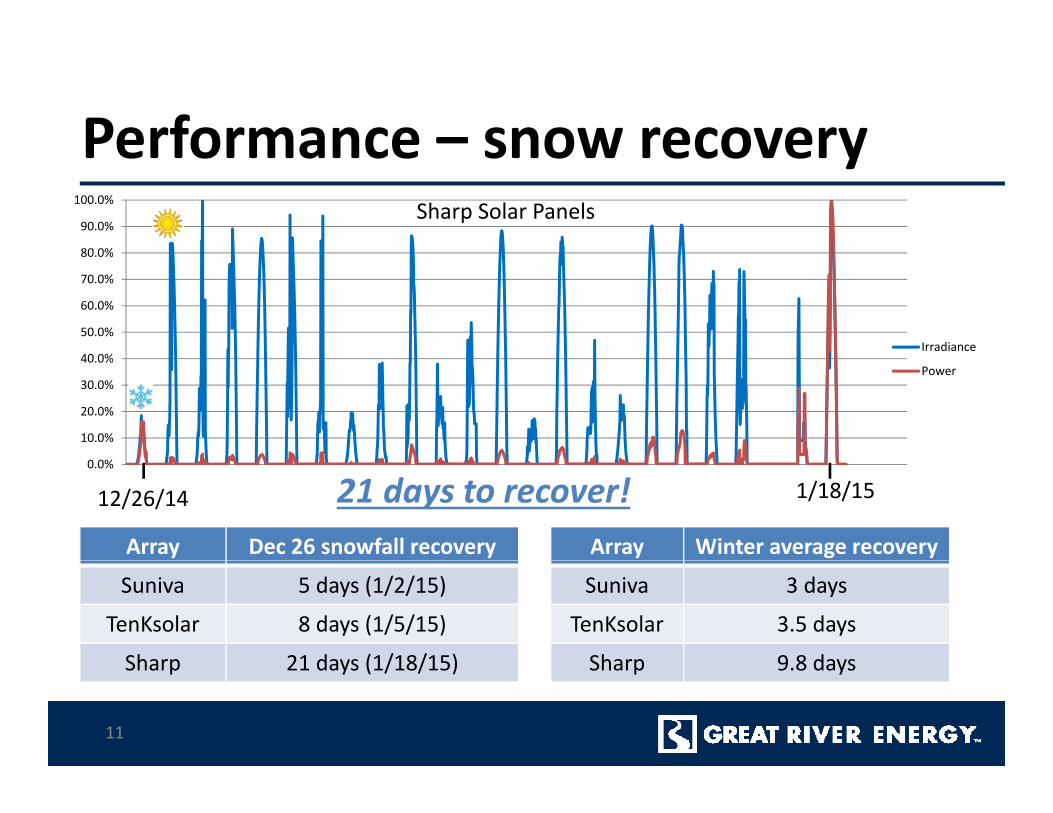
Performance – snow recoveryPerformance snow recovery80 0%
90.0%
100.0% Sharp Solar Panels
40 0%
50.0%
60.0%
70.0%
80.0%
Irradiance
10.0%
20.0%
30.0%
40.0%Power
0.0%
12/26/14 1/18/1521 days to recover!Array Winter average recovery Array Dec 26 snowfall recovery
Suniva 3 days
TenKsolar 3.5 days
Sharp 9 8 days
Suniva 5 days (1/2/15)
TenKsolar 8 days (1/5/15)
Sharp 21 days (1/18/15) Sharp 9.8 daysSharp 21 days (1/18/15)
11
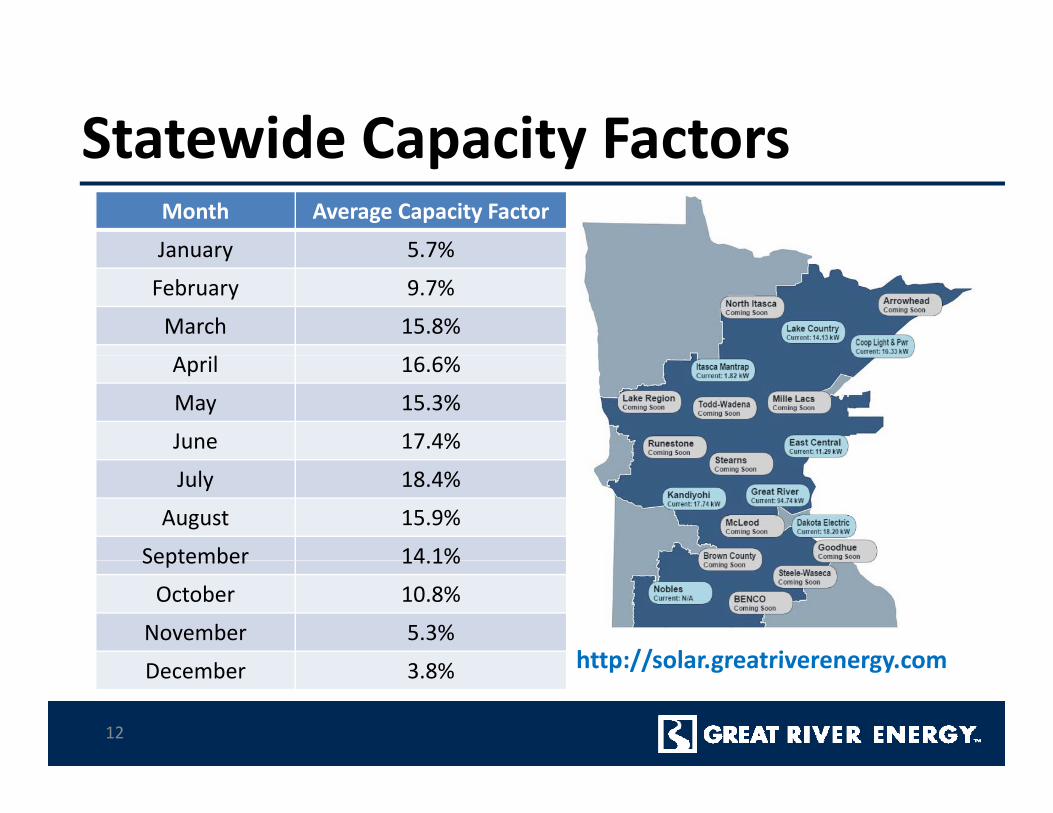
Statewide Capacity FactorsStatewide Capacity FactorsMonth Average Capacity Factor
January 5 7%January 5.7%
February 9.7%
March 15.8%
April 16.6%
May 15.3%
June 17.4%
July 18.4%
August 15.9%
September 14 1%
http://solar greatriverenergy com
September 14.1%
October 10.8%
November 5.3%
b 3 8% http://solar.greatriverenergy.com
12
December 3.8%
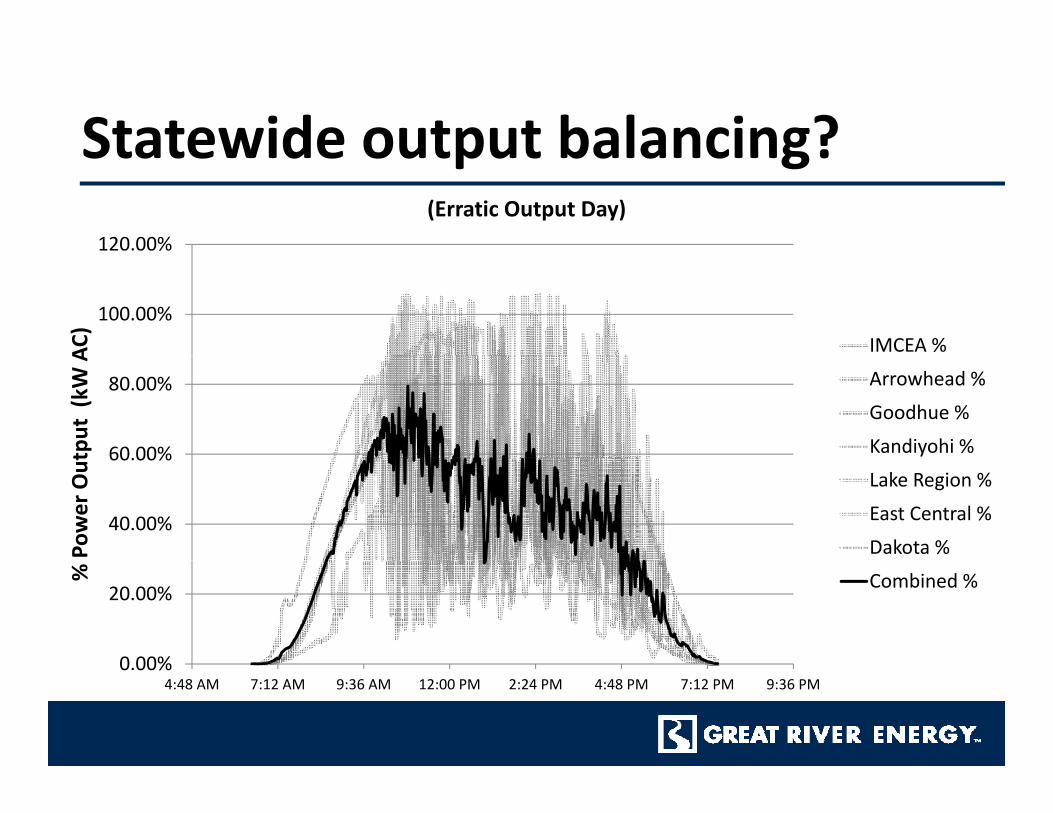
Statewide output balancing?Statewide output balancing?120.00%
(Erratic Output Day)
100.00%
AC)
IMCEA %
60.00%
80.00%
tput (kW
A
Arrowhead %
Goodhue %
Kandiyohi %
40.00%
60.00%
Power Out Lake Region %
East Central %
Dakota %
0 00%
20.00%
%
Combined %
0.00%4:48 AM 7:12 AM 9:36 AM 12:00 PM 2:24 PM 4:48 PM 7:12 PM 9:36 PM
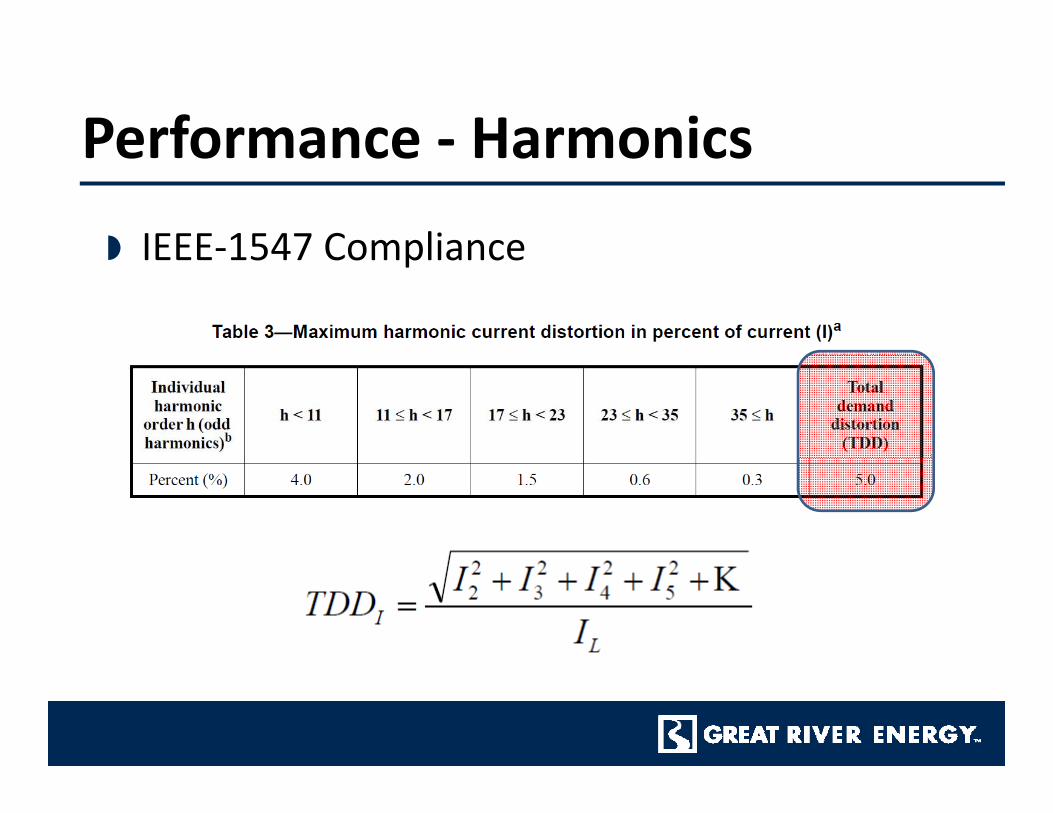
Performance ‐ Harmonics
IEEE‐1547 Compliance
Performance Harmonics
IEEE 1547 Compliance
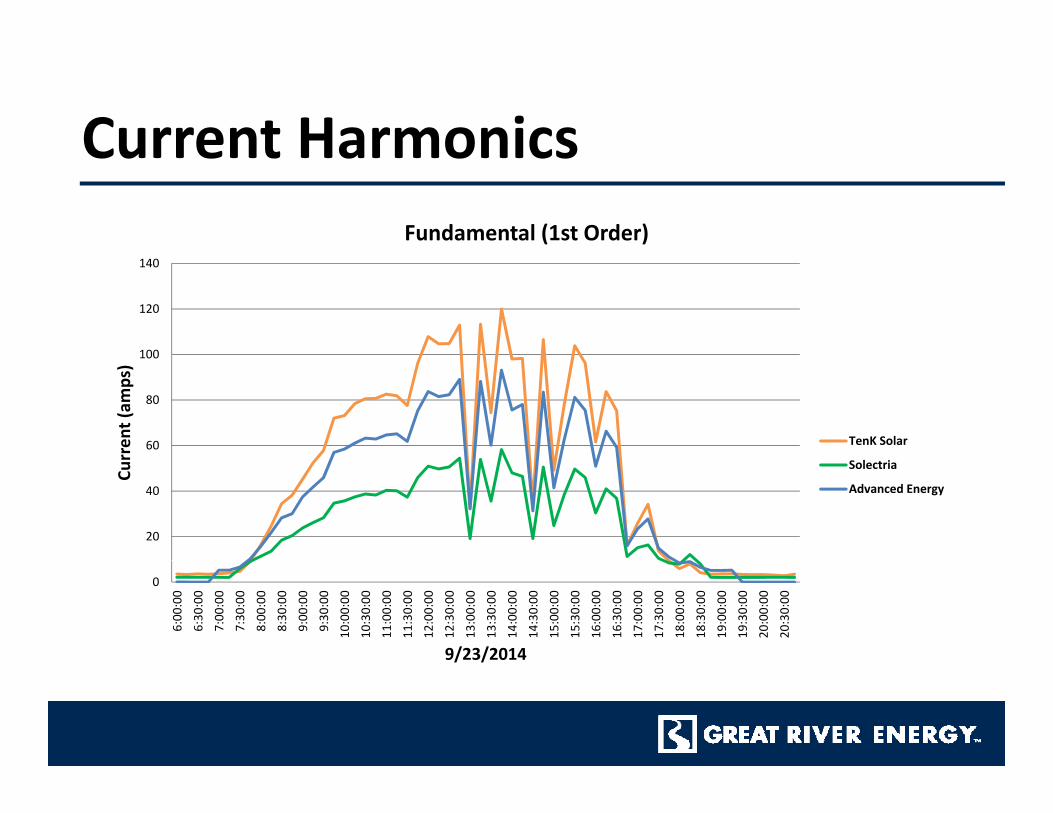
Current HarmonicsCurrent HarmonicsFundamental (1st Order)
100
120
140
60
80
100
rren
t (am
ps)
TenK Solar
20
40
Cur Solectria
Advanced Energy
0
6:00
:00
6:30
:00
7:00
:00
7:30
:00
8:00
:00
8:30
:00
9:00
:00
9:30
:00
10:00:00
10:30:00
11:00:00
11:30:00
12:00:00
12:30:00
13:00:00
13:30:00
14:00:00
14:30:00
15:00:00
15:30:00
16:00:00
16:30:00
17:00:00
17:30:00
18:00:00
18:30:00
19:00:00
19:30:00
20:00:00
20:30:00
9/23/2014
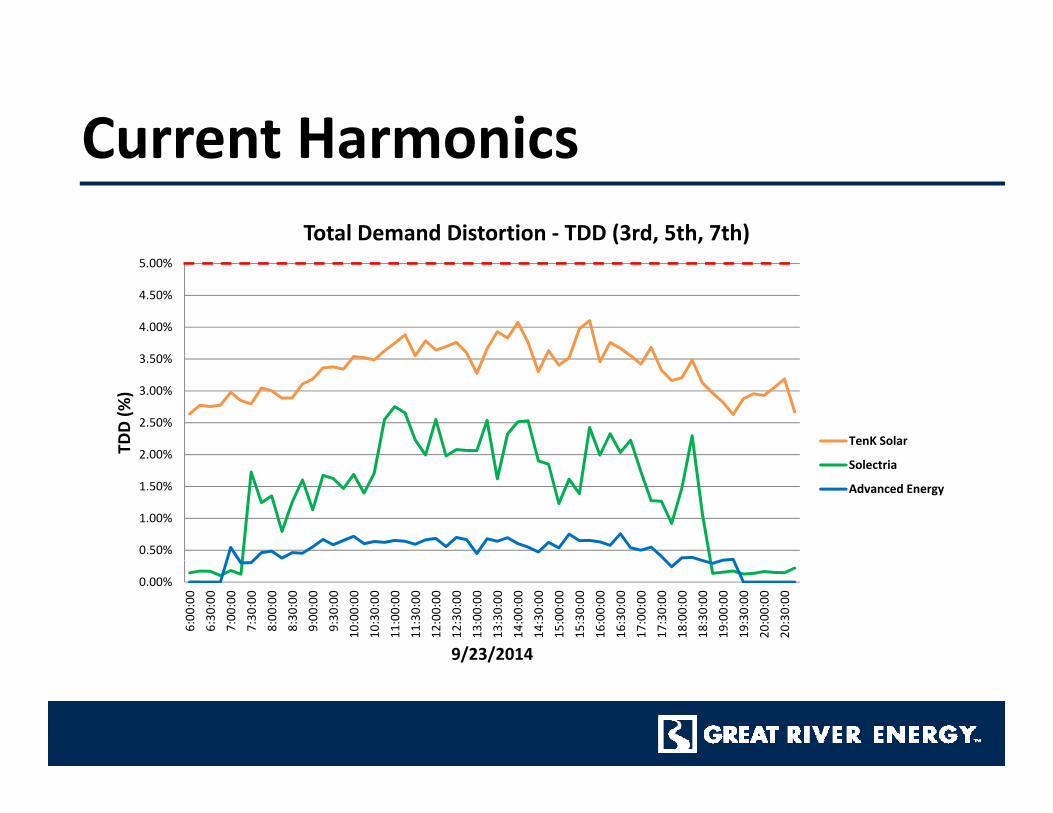
Current HarmonicsCurrent HarmonicsTotal Demand Distortion ‐ TDD (3rd, 5th, 7th)
3 50%
4.00%
4.50%
5.00%
2.00%
2.50%
3.00%
3.50%
TDD (%
)
TenK Solar
0.50%
1.00%
1.50%
2.00%Solectria
Advanced Energy
0.00%
6:00
:00
6:30
:00
7:00
:00
7:30
:00
8:00
:00
8:30
:00
9:00
:00
9:30
:00
10:00:00
10:30:00
11:00:00
11:30:00
12:00:00
12:30:00
13:00:00
13:30:00
14:00:00
14:30:00
15:00:00
15:30:00
16:00:00
16:30:00
17:00:00
17:30:00
18:00:00
18:30:00
19:00:00
19:30:00
20:00:00
20:30:00
9/23/2014
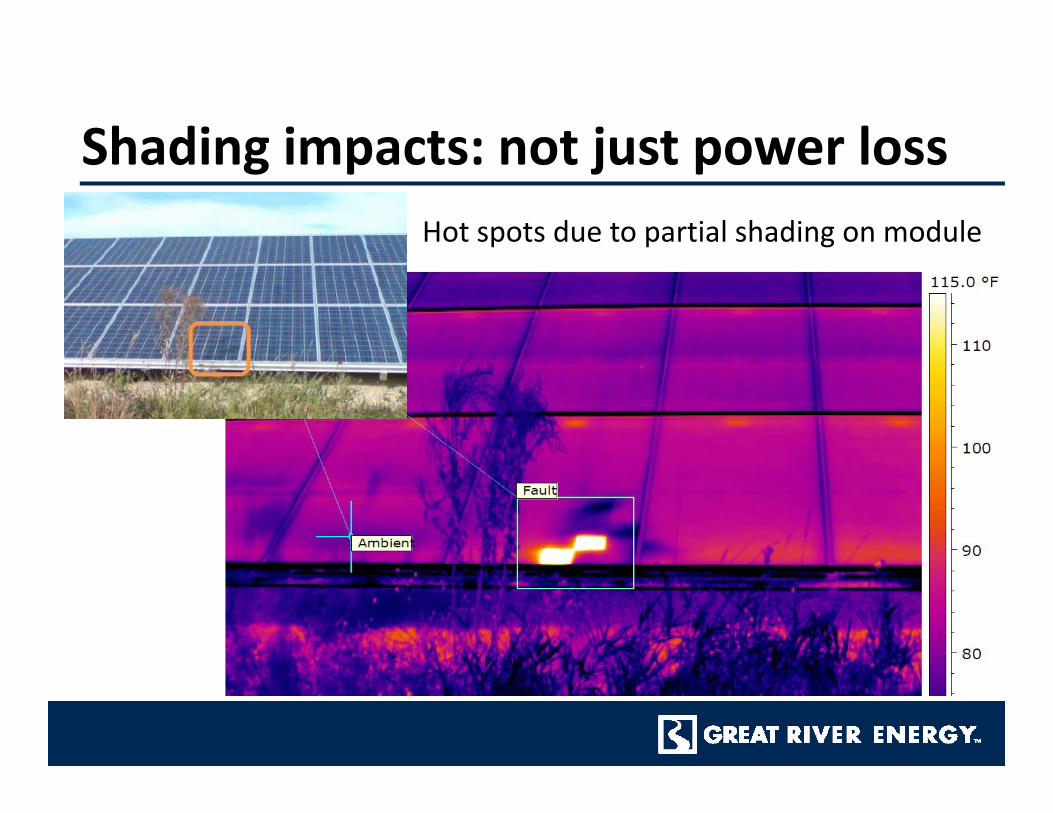
Shading impacts: not just power lossShading impacts: not just power lossHot spots due to partial shading on module
DG Metering OptionsDG Metering Options
18
Lessons learned Procurement volatility in the industry
Lessons learned
Large and rapid power swings
Significant seasonal output variance Significant seasonal output variance
Snow shed ability dependent on racking design
d l f Demonstrated value for energy storage
No observed harmonic issues
Shading impacts on equipment life
19