PERFORMANCE · 11/10/2010 · 30-Mintute Assessment Referemces ... you will notice each layer of...
61
PERFORMANCE PYR MID Needs Assessment Made Simple
Transcript of PERFORMANCE · 11/10/2010 · 30-Mintute Assessment Referemces ... you will notice each layer of...

P E R F O R M A N C EP Y R M I D
Needs Assessment Made Simple

Publication Info
All Performance Pyramid files, both images and text, are copyrighted© by John Wedman. All rights reserved with the understandings listed below:
• Anyone may download Performance Pyramid files and share them with others. Performance Pyramid materials may be used for training sessions, classroom projects, needs assessment and other sensible applications; however, under no circumstances may the information, text, or visuals be sold or redistributed for compensation of any kind without the expressed written consent of John Wedman.
• Performance Pyramid files may NOT be used for commercial gain. Commercial publication or exploitation in any form of these files is strictly prohibited. Performance Pyramid files may not be packaged and sold in any manner without the expressed written consent of John Wedman.
• All parties obtaining or using Performance Pyramid files agree to adhere to this agreement and will not violate proprietary rights to the documents.
Contact John Wedman with any questions regarding this copyright notice or the use of the Performance Pyramid files at [email protected].
© Nov. 11, 2010
Several minds helped build the Performance Pyramid. Steve Graham, my first business partner and the perfect antidote for my tendency to confuse my reach and my grasp. Ryan Watkins, who found the Pyramid in the literature and added a new perspective. Dan Cernusca, who said “Well, if it is a system, then it should look like a system.” Burt Hancock who asked me to convince his boss that training was a subset of performance support, and gave me 10 minutes to do it. Judy Hale, who gave me the idea of creating a job aid to manage the data collection process. And countless other professionals who have the explored and articulated the intricacies of needs assessment and performance support. I sincerely hope my efforts to simplify a complex process have not lowered the bar, and I ask you to think of the Performance Pyramid as a primer to your work.
Acknowledgements
Copyright & Use Info
i-1

Author Info
John Wedman is Director of the School of Information Science & Learning Technologies at the University of Missouri. He is recognized in the professional literature for improving instructional development processes, facilitating change and innovation in organizations, and guiding performance improvement efforts. In addition to over thirty years in public and higher education, Wedman founded two businesses, providing products and services to a wide range of customers, including AT&T, Ernst & Young, Nationwide Insurance, and the U.S. Department of Transportation.
Wedman developed the Performance Pyramid out of necessity. Several years ago, while thinking about why a training program he developed wasn’t producing the desired change in performance, he experienced an “inter-ocular trauma” (it hit him right between the eyes).
He finally understood what the performance technology people were talking about when they said training was seldom a total solution to a performance problem. Unfortunately, he soon discovered that many of the performance improvement models were too complex and consequently too often used piecemeal or avoided all together.
He wanted a framework that was comprehensive and convincing, systemic and simple. That framework is the Performance Pyramid.
Author Bio
Dr. John Wedman, DirectorSchool of Information Science & Learning TechnologiesUniversity of MissouriColumbia, MO Toll Free; 877-747-5868Email: [email protected]
ii-1

File Checklist
Resources
In Manual Attached P P
P
P P
P P
P P
P
P
P
P
P P P P
OverviewProcess
Score CardScore Card TutorialInterview ProtocolInterview Tutorial
SurveySurvey Tutorial
Data Job AidData Job Aid Tutorial
Report OutlineReport Tutorial
30-Mintute AssessmentCase Briefs
Pyramid GraphicsReferemces
Make sure you can find all the parts before starting to “build” your Performance Pyramid.
The Performance Pyramid is an evolving set of resources that can be used to streamline the needs assessment process. The current resources are listed and described on the next page. If we have your current contact info we can send you updates and new resources as they become available.
P
iii-1

Description Overview: A high-level look at the Performance Pyramid Model and Process.
Process: A description of how to conduct a needs assessment based on the Performance Pyramid. If you have questions about the process, send me an email and I will be happy to elaborate.
Score Card: (in the form of two Excel spread sheets) Used to help summarize your impressions as you analyze the data.
Score Card Tutorial: Helps you build and interpret your own Score Card.
Interview Protocol: Your basic needs assessment tool. Included as an attached Word file; feel free to modify the protocol to fit the context you are assessing.
Interview Tutorial: Learn to collect and analyze interview data.
File Checklist
Survey: Ideal for situations involving a large number of people who can contribute needs assessment information. Included as an attached Word file, making it easy to modify.
Survey Tutorial: Learn to create a customized version of the survey.
Data Job Aid: Helps you manage the data collection process.
Data Job Aid Tutorial: Learn to manage what you know and what you don’t know.
Report Outline: An outline of a needs assessment report to get you started.
Report Tutorial: Learn to structure your needs assessment report.
30-Minute Needs Assessment: Use the 30-Minute Needs Assessment when “Cheaper and Faster” win out over “Better”.
Case Briefs: Short reports describing needs assessment efforts.
Pyramid Graphics: Included in the manual and as attached files to make reproduction easier for you.
References: A painfully incomplete list of references related to the Performance Pyramid.
iii-2

Ta
ble
of
Co
nte
nts
Publication Info
File Checklist
Overview
The Process
Pyramid Tour
Score Card Tutorial
Survey Tutorial
Interview Tutorial
Data Job Aid Tutorial
Report Tutorial
30-Min. Needs Assessment
Case Briefs
Pyramid Graphics
References
Author Info

1-1
Overview
“The Performance Pyramid provides a simple, yet comprehensive perspective for improving the performance of individuals, groups and organizations.”

Is your organization working harder than ever but having a tough time reaching its goals? Assuming you aren’t working on the wrong thing (e.g., perfecting a telephone cord that doesn’t get tangled … phones have cords?), you may be on the doorstep of a solution. Welcome to the Performance Pyramid!
The Performance Pyramid provides a simple, yet comprehensive perspective for improving the performance of individuals, groups, and organizations. The Pyramid is based on the belief that, in order to accomplish something of significance, three factors must be in place: Vision, Resources, and Support System. As shown in the model, continuous monitoring ensures the three factors work in concert to produce the designed outcomes.
Reading from bottom to top, the Pyramid shows that resources (e.g., money, people) combine with vision, mission, and objectives to fuel and shape various performance support elements (e.g., knowledge and skills, expectations and feedback). The performance support elements play out in the context of the organizational culture.
A premise of the Performance Pyramid is that outcomes suffer and resources are wasted if one or more of the performance support elements are missing, or if the elements are not aligned (e.g., expecting “X” but rewarding “Y”). The elements must also be compatible with the culture of the group or organization.
When all elements are adequate and aligned, and the change process is managed effectively, your goals can be achieved. The Pyramid model, process, tools and resources will help make your goals a reality…so you can stop working so hard.
Knowledge & Skills
Performance Capability
Motivation, Values& Self Concept
Tools, Environment& Processes
Expectation& Feedback
Rewards, Recognition& Incentives
Organizational Culture
C 2009 Wedman & Graham
Performance Pyramid
Outcomes
Resources
SignificantAccomplishments
Vision, Missionand Objectives
ContinuousMonitoring
C
eg
na
h
ss
ec
or
P
Overview
1-2

The Process
“The Pyramid process involves a series of layers, with each layer adding more needs assessment value while consuming more time and resources.”
2-1

Many processes are actually procedures – a series of steps taken to complete a task. The process of using the Performance Pyramid can’t be described as a procedure, the reason being the process is NON-linear.
The Process
This section has two very different parts. The first part is a description of the process for using the Performance Pyramid, starting with a caution regarding how NOT to carry out the process. The second part is a “first time tour” of the Pyramid resources. The section closes with a reminder of what NOT to do.
Introduction
Process - Not Procedure
Step 1 Step 2 Step 3 END
The Pyramid process is actually more holistic than sequential; several tasks may be carried out at once, and any number of tasks can be repeated several times. The process is akin to juggling, a classic form of multi-tasking.
2-2

The Process
For those of you who like metaphors, the Pyramid process is more organic than mechanistic, with many simultaneous and interactive sub-processes. True enough, modern machines can perform simultaneous and interactive tasks, but compared to the complexity and sophistication of a living being…forget it.
Organic
NOT
MECHANISTIC
Layers
Performance Pyramid Process
ORGANIC
The Pyramid process involves a series of layers, with each layer adding more needs assessment value while consuming more time and resources.
2-3
At the first layer, the process is simple, if not simplistic. You receive an email from your boss -- “Why do those jokers in the mail room keep routing mail to the wrong people? Fix it now!” The email is your first bit of needs assessment data. A brief conversation with your boss reveals the mail room is where new hires are often assigned. And since new hires don’t know anyone in the organization, you conclude they need an Employee Location Job Aid. End of process.

The Process
However, if the email had ended with “Fix it soon”, you have a little more time, so you can conduct a 30-Minute Needs Assessment, (described elsewhere in this manual) allowing you to collect and analyze data from different perspectives and reach closure in a timely manner. End of process.
And if the email had ended with “Report back in 3-4 weeks; Joe can help you figure out what needs to be done”, you have even more time and the resources to complete your needs assessment, taking you to the next layer in the model. Here you might conduct in-depth interviews, do on-the-job observations, and review performance data over the last two quarters. As trends begin to emerge, you shift from collecting and analyzing data to drawing conclusions and communicating your findings. End of process. More layers can be added, with each subsequent layer potentially adding more insight into the performance problem and leading to better strategies for improving performance. Of course, each layer of needs assessment activity consumes more resources and takes longer.
If you back up just a little bit, you will notice each layer of the process involves finding data sources, collecting data, analyzing data, and deciding if you know enough to write your needs assessment report. If you do, start writing. If you don’t, go to the next layer and find additional data sources, collect additional data, analyze the data and meld it with your earlier findings, and decide if you know enough to write your needs assessment report.
2-4

How do you know when to stop assessing needs and start writing your needs assessment report? Two rules-of-thumb work for me.
Rule #1 When you are about to run out of time and/or money to complete the needs assessment, start writing. This is especially important to keep in mind when working on a contractual basis where over-runs typically come out of your pocket.
Rule #2 When you stop finding new patterns in your data, start writing. Report what you found and see if your customer/supervisor wants a more exhaustive assessment.
Ready to Write?
The Process
2-5

Pyram
id Tour
“There is no prescribed sequence; just a set of inter-related tasks to be carried out with some tasks revisited multiple times.”
3-1

Pyramid Tour
The Performance Pyramid has a growing number of resources you can use when conducting a needs assessment. The Pyramid Tour will acquaint you with the resources and how they work.
Re-read the Performance Pyramid Overview (Section 1). Make sure you have a general understanding of the model, its elements, and their relationships. Then skim everything else in this manual. After you do that, continue to #2 below. [Did you skim the entirety of the manual? OK, then continue.]
Select a real-life situation where you might use the Performance Pyramid approach. Give the situation a descriptive name, such as “Stamping Out Mail Room Miscues”, “Increasing Add-On Sales”, or “Reducing Patient Data Entry Errors”. Enter Descriptive Name:____________________________ Open the Performance Pyramid Score Card (Excel file). Select the Component Adequacy Sheet (click tab at bottom). Thinking about the real-life situation you selected, assign values to the Importance column for each Pyramid component (e.g., vision, resources, etc.). These ratings are your best guess based on whatever you know about the situation. After you have inserted your Importance ratings, do a “Save As”, rename the file and save it where you can find it later. Open the Performance Pyramid Interview Protocol. Edit the Protocol so it matches your situation.
[The edited Protocol would be used when carrying out your needs assessment interviews. For now, let’s assume you have completed 5 – 10 interviews, analyzed the results,and found Resources, Expectations & Feedback, and Capability to be “strong”; Vision and Knowledge & Skills to be “weak”; and the remaining components to be “adequate.”]
Open the Performance Pyramid Score Card. Select the Component Adequacy worksheet (click tab at bottom). Based on the trends you noted in your interview data, assign values to the Adequacy column for each Pyramid component. SAVE the file after you have inserted your Adequacy ratings. Use the Interpretation guidelines on the Component Adequacy worksheet to help make sense out of what you found.
Pyramid Tour
1]
2]
3]
4]
5]
3-2

Pyramid Tour
Open the Performance Pyramid Sample Survey (Word file). Edit the Survey so that it matches your situation. Do a “Save As” and save the file where you can find it later.
[The edited Survey would be used to collect additional needs assessment information. For now, let’s assume you have collected 20 – 30 surveys and analyzed the results in light of what you found in your initial interviews. You confirmed that Vision was weak, due to the fact that there was little consensus on the Vision. And you found that most people believed they had the Knowledge and Skills needed to meet Expectations, but they felt they needed more Feedback.]
Open the Performance Pyramid Score Card. Select the Component Adequacy Sheet (click on tab at bottom). Based on the trends you noted in your survey data, reconsider the values you have in the Adequacy column. SAVE the file after you have reconsidered your Adequacy ratings.
[If you were actually conducting a needs assessment, it is likely that you would want to verify the trends you found through the interviews and surveys. For now, let’s assume the trends have been verified.]
Open the Performance Pyramid Score Card. Select the Component Alignment worksheet (click on tab at bottom.) For each pair of components (e.g., Vision – Resources; Vision – Expectations & Feedback; etc.), enter an Alignment rating in the corresponding yellow cell. For this exercise, you can randomly enter numbers from 0 (no alignment) to 3 (perfect alignment). The Component Alignment values (blue cells) are automatically calculated. SAVE the file after you have inserted your Alignment ratings. Use the Interpretation guidelines on the Component Alignment Sheet to help make sense out of what you found.
[If you were actually conducting a needs assessment, it is likely that you would want to verify the alignment trends you found. This might mean additional interviews, direct observations, surveys, or other data collection methods. For now, let’s assume the trends have been verified.]
List and prioritize the performance needs to be addressed and barriers to be removed. Components with High Importance and Low Adequacy are your primary targets, as are components with Low Alignment. For this exercise, what is one component you suspect should be addressed? Enter Suspect Component:_______________________ [If you were actually conducting a needs assessment you would use the Data Job Aid to decide when you know enough to write your report.]
6]
7]
8]
9]
3-3

Pyramid Tour
The Performance Pyramid is not like the Tour. There is no prescribed sequence; just a set of inter-related tasks to be carried out with some tasks revisited (i.e., repeated) multiple times.
The next few sections look at different Performance Pyramid Resources including:
Remember
Score Card Interview Protocol Survey
Data Job Aid Report Outline 30 Minute Needs Assessment
Case Briefs HPT Podcasts
3-4

Score Card
Tutoria
l
“Accomplishments will suffer and resources will be wasted if one or more of the performance support elements are missing, or if the elements are not aligned.”
4-1

Score Card Tutorial
A premise of the Performance Pyramid is that accomplishments will suffer and resources will be wasted if one or more of the performance support elements are missing, or if the elements are not aligned (e.g., expecting “X” but rewarding “Y”).
It’s fairly easy to spot missing elements, but identifying elements that are present but not aligned can be tricky. The process below will help reduce the guesswork.
Introduction
In the Field of Dreams movie, the vision was “build it and they will come”. The support system included the baseball field, the lights and bleachers, and the encouragement Kevin Costner received from his family and eventually James Earl Jones.
The resources included the financial backing, the natural resources, and human resources (including the “ghost” players). In the end, everything was aligned, personal issues were resolved, and visitors came driving in from all directions.
How did Costner get everything aligned? Basically, he stayed focused on the vision and worked to get everything aligned with the vision.
How did he know what to do? Good screen writers. How do you know what to do? Good data, common sense, and the Alignment Score Card.
An Example
Needs assessment is a data-driven process. While the Performance Pyramid frames the process, the data you collect, analyze, and interpret moves you through the process. Data can come from interviews, surveys, observations, focus groups, product samples, and a wealth of other sources. In general, it’s a good idea to have data from multiple sources, making “triangulation” possible and avoiding sampling errors.
Good Data
4-2

Score Card Tutorial
What is “common sense”? I’m not sure how to explain it, but I suspect you know what it means. So maybe that’s the essence of common sense. Seeing things, thinking about stuff, and acting in ways that make sense to most other people. If someone “doesn’t know when to come in out of the rain” that person probably lacks common sense.
It seems like common sense has (at least) two dimensions – analysis and synthesis.
Analysis involves separating something into its individual parts in order to figure out what is there. Most needs assessment processes (including those prescribed by the Performance Pyramid) involve analysis.
For example, the Performance Pyramid Interview guides you through the analysis of a performance situation, helping you look at different aspects of the situation in order to understand what is going on and how well things fit together.
The down side of analysis is “analysis paralysis”, the tendency to over analyze a situation.
The other dimension of common sense is synthesis, combining different things into something new. The old saying, “…can’t see the forest for the trees” characterizes a person who can’t see the big picture. In other words, can’t synthesize. The Performance Pyramid will help you synthesize your needs assessment data.
The down side of synthesis is a “kludge”, a makeshift combination of stuff that appears to fit together but really doesn’t.
Since I’m probably in over my head with a discussion of common sense, I’ll end with a suggestion: Since the gap between common sense and common practice is often wider than the Grand Canyon, your best bet is to engage in both analysis and synthesis, and explain your thinking to a brutally honest associate before submitting your needs assessment report to your boss or customer.
Common Sense
4-3

Score Card Tutorial
The Performance Pyramid Score Card is designed to help you use common sense to interpret good data. The Score Card has two parts:
• Component Adequacy & Importance• Component Alignment
At this point, it will help if you open the Score Card file in Excel. Click on the Component Adequacy tab at the bottom and continue reading below.
Score Card
Component Adequacy deals with the issue of having a sufficient amount of each Pyramid element required for success. Component Adequacy asks:
Do you have enough of what you need to accomplish what you want to accomplish?
For example, if a printing company specializing in small printing jobs is trying to reduce the time required to calibrate its printing press, the company will probably need press operators who are trained in press calibration. If the company only has one trained operator, the knowledge and skills are not adequate.
Component Adequacy is closely related to Component Importance. Depending on the situation, some things are more important than other things. The Component Importance question asks:
What do you REALLY need to accomplish what you want to accomplish?
In the printing company example, the company may have a fitness-screening program to help ensure all production line employees have the strength needed to deal with heavy loads (e.g., large paper rolls). It is unlikely the press calibration problem requires a great deal of physical strength. However, the capability to discriminate colors is probably very important.
The Component Adequacy work sheet is designed to help you think about the performance situation at a high level. This work sheet does not calculate anything; it simply helps you focus on the situation at hand.
Now, click on the Component Alignment tab at the bottom and continue reading.
Importance & Adequacy
USE WITH ATTACHED FILE“SCORE CARD”
4-4

Score Card Tutorial
Alignment Component Alignment asks the question:
Do things fit together in a way that will enable you to accomplish what you want to accomplish?
For example, Expectations and Feedback might not be aligned with Tools, Environment, and Processes if:
• The tools needed to meet the expectations are not available.• Environmental factors make it difficult for quality work to be
completed.• Processes are not in place to complete the work in a timely
manner.
Examples of these inconsistencies abound.
• An independent insurance agent in a small office only has one phone line to take customer calls, send/receive faxes, and access online databases. The agent has been criticized for failing to submit reports via the online reporting system in a timely manner.
• Poisonous gasses accumulate in low-lying areas, such as carbon monoxide in utility service tunnels, creating a hazard for utility workers. Crews with the best safety records have the worst efficiency ratings and are criticized for taking too long to complete jobs.
• In a university course, student ratings of course quality are collected at the end of the course, too late for the instructor to make adjustments. The instructor is given one semester to raise student ratings.
And we have all seen resources being applied to complete work that does not contribute to the stated vision of the organization.
The key point is that misalignment is all too common, leading to reduced accomplishments and wasted resources.
USE WITH ATTACHED FILE“SCORE CARD”
4-5

Score Card Tutorial
Using the Alignment Work Sheet
The Component Alignment work sheet is a 9 x 9 grid, crossing each component of the Performance Pyramid with every other component. For example, Expectation and Feedback is crossed with Vision, Resources, Tools/Environment/Processes, Capability, etc.
The Component Alignment work sheet helps you consider every possible combination, looking for pairs that are not aligned. You assign a value to each cell in the grid using the scale below:
Perfect Alignment........................ 3Adequate Alignment................... 2Some Alignment............................1No Alignment................................. 0
Only 36 cells on the Component Alignment work sheet will accept entries. The first time you open the Performance Pyramid Score Card and click on the Component Alignment tab, you will see these cells are highlighted in yellow and contain the number “0”.
After you have collected and analyzed most of your needs assessment data, take the time to consider each component pair, asking the question: How well is [this component] aligned with [that component]. Insert your rating in the appropriate cells.
As you enter your ratings you will notice the Component Alignment values are calculated. The Component Alignment Total is the sum of all the cell values for a given component. Rather than spend time explaining this, it will probably be easier for you to play with the Component Alignment work sheet and see how the numbers work.
After you have entered your ratings in all 36 cells, you look for components having relatively low Component Alignment Totals.
Note: The work sheet will accept any number you enter in a cell. It’s certainly OK for you to use your own Alignment Rating Scale (e.g., 0 – 10), provided it passes the ‘common sense’ test. The calculations should still work.
USE WITH ATTACHED FILE“SCORE CARD”
4-6

Score Card Tutorial
Interpreting Alignment Scores
CAUTION: This section offers several general guidelines. If, in a particular situation, the guidelines don’t make sense, ignore them! Follow the guidelines until they conflict with common sense, and then follow your common sense. With that warning…
In general, three Component Alignment scenarios are possible:
• Most components are well aligned with one another (high alignment scores across components)
• Most components are aligned, but one or two components are not well aligned
• Very few of the components are aligned with each other (low align scores across components)
Each scenario is discussed and illustrated on the following pages.
High Alignment Scores Across Components
If everything fits well with everything else, most interventions will be “tweaks”. The key here is to think systemically; even a slight change in one component can produce significant changes in others. Be careful!
High Alignment Score Card
USE WITH ATTACHED FILE“SCORE CARD”
4-7

Score Card Tutorial
This situation might be found in an organization attempting to update its information processing systems. The decision makers have selected a system that promises to “propel the organization into the information age”, with the vision of a “paperless work environment that is better connected both internally and externally”.
But the reality is that the employees know the old system, including its many limitations and how to work around them. And the new system is very different, so the existing knowledge/skills are not aligned with the new tools and processes (thus the “0” score). The new system will also require considerably more screen reading, a diminishing capability for many employees who wear bifocals. Training on the new system will be required. And new computer monitors will likely be needed by some employees.
Most Aligned, But One or Two Not If most of the components are aligned but one or two are not, you probably need to change the misaligned component(s). For example, if Tools, Environment & Processes are not aligned with Vision, Expectations, Capacity, and Knowledge & Skills, you probably should change the tools, the environment where work is carried out, and/or the work processes.
In the example below, two components are not well aligned with most of the other components: Tools, Environment & Processes and Knowledge & Skills.
Moderate Alignment Score Card
USE WITH ATTACHED FILE“SCORE CARD”
4-8

In the Performance Pyramid, Vision is analogous to the straight edge pieces. The Vision frames the performance situation. Simply put, if you don’t have the Vision, none of the other components matter, even if they all align. So, starting with Vision makes good sense.
That said, the power of the organization culture cannot be underestimated. Strategies to revitalize a training program, to implement a performance review process, or to provide new tools may fall short if the culture does not support these strategies. As the old adage says...
“…culture eats strategy for breakfast every day.”
Low Alignment Scores Across Components This is the classic “where do you start” situation. If you were trying to assemble a jigsaws puzzle, you would probably start by identifying the straight edge pieces, the pieces framing the image. Once you have the straight edge pieces in place, it is easier to work with the other pieces.
Low Alignment Score Card
Score Card Tutorial
Normally I do not show the Score Card to my customers because it is an intermediate output of the needs assessment process. I prefer to have my final report the only deliverable.
Keep It To Yourself
USE WITH ATTACHED FILE“SCORE CARD”
4-9

Score Card Tutorial
More on Interpreting Alignment
The table below elaborates on the guidelines found in the Component Alignment work sheet. The table is based on the assumption the Vision is valid.
If and are NOT aligned, then... And considerVision Expectations &
Feedback...provide explicit expectations. Simply put, when people are doing wrong things right, they are consuming valuable resources and returning very little.
Embed feedback (anchored to expectations) within tasks.
Tools, Environment, & Processes
Resources …examine how resources are allocated. Too often resources are committed to maintain yesterday rather than to build tomorrow. Worse still, resources can be committed to advance a project that does not align with the vision.
Stop wasting resources! Start with the Vision and ask: What tools, environment, and processes are required to fulfill the Vision? Then ask, what resources will be required? Finally, invest more resources to meet these requirements while reducing the investment in low priority areas.
Expectations & Feedback
Reward, Recognition & Incentives
…examine what people are encouraged to do. Are they discouraged from doing what they are expected to do? Are they encouraged to do what they should not do? Every time we say, “If you want something done right, give it to a busy person”, we are perpetuating the problem.
Look for people who are performing below expectations and give them some of the work being performed by those who are “picking up the slack”. While few supervisors enjoy terminating someone, even a low performer, the alternative of punishing good performers with more work is not a good idea!
USE WITH ATTACHED FILE“SCORE CARD”
4-10

Score Card Tutorial
If and are NOT aligned, then... And considerExpectations & Feedback
Motivation, Values & Self Concept
…examine who is doing what. When people are given clear expectations and helpful feedback but they just don’t seem to want to do the work, you could have a situation where you don’t have the right people in the right position.
If the problem is most common among new-hires, the hiring process is possibly flawed. Too often we over-sell a position in order to get it filled.
Expectations & Feedback
Capability …examine what it really takes to do the job. No amount of personal motivation, external rewards, or training will change the fact that some people lack the capability to do some things. Simply put, if you can’t, you can’t.
Many capability limitations can be overcome with tools. Can’t push a nail into a board? Use a hammer. Other limitations can be overcome with a change in the work environment and/or processes. Can’t find where you put a report? Implement a filing system.
Expectations & Feedback
Knowledge/ Skills
…examine the training content. The best training in the world is only as valuable as it is relevant to the job.
Too often, training falls into the trap of being “about” X rather than “how to” X. A course about flight will not prepare you to fly a plane. A course about paintings will not prepare you to paint. A job and task analysis will help ensure training focuses on how to do the job.
Vision Organization Culture
…examine the expressed values and mores. The most likely time to find vision and culture out of alignment is after a leadership change. Successful leaders change the established culture in order to achieve their vision. Unsuccessful leaders change their vision in order to survive in the established culture. Unemployed leaders fail to change the culture while holding tightly to their vision.
Changing the culture of an organization is incredibly difficult, but it can be done. The only real question is: Will the organization change its culture soon enough to meet the challenges it must overcome in order to survive.USE WITH
ATTACHED FILE“SCORE CARD”
4-11

Inte
rview Tuto
rial
“The Performance Pyramid Interview Protocol is the backbone of the data collection process.”
5-1

Interview Tutorial
The Score Card discussed earlier is only helpful if you have data to back up your conclusions.
The Performance Pyramid Interview Protocol is the backbone of the data collection process.
Introduction
Interview Structure
A Performance Pyramid Interview has several components. These components are described below. It will help if you refer to the Interview Protocol included in the downloaded material while reading the descriptions.
1. Interview Details. Information about the interview (e.g., who? when? etc.)
2. Interview Focus. What is the interview about and who is it for?
3. Vision Questions. Compares what the interviewee thinks the group or organization is trying to accomplish to what he/she wishes it would accomplish.
4. Resources Questions. Assesses the interviewee’s perception of the resources committee to the accomplishment.
The remainder of the interview includes one or more questions about the other Pyramid elements.
An additional file “Interview” has been included for creating your own interview protocol.
USE WITH ATTACHED FILE
“INTERVIEW ANNOTATED”
5-2

Interview Tutorial
An amazing (and sometimes overwhelming) amount of data can be generated from just a few interviews. For example, an associate of mine (let’s call her Carol) recently conducted four interviews with people who worked in a library on a university campus. Like many campus libraries, this library relied heavily on student workers. There was a general recognition the student workers’ job performance was not up to par. Carol’s challenge was to find out what was going on.
As part of the needs assessment process, Carol conducted four interviews: two with student workers and two with people who supervised the student workers. Based on the interview data, Carol found several problems, including:
•Thelibrary’strainingprogramdidnotpreparethestudent workers to perform the job tasks (Knowledge & Skills)•Differentsupervisorsgavedifferent,oftenconflicting instructions (Expectations & Feedback)•Thestudentworkerssawnoreasontogobeyondminimal performance standards (Reward, Incentives, Recognition)•Thestudentworkersfelttheworkwasunimportantand menial, and they had no interest in becoming professional librarians (Self Concept)
How did Carol go from four interviews to these conclusions? Check out the next page, starting with selecting people to interview and ending with interpreting the data.
Example
USE WITH ATTACHED FILE
“INTERVIEW ANNOTATED”
5-3

Interview Tutorial
STEP EXAMPLE1. Prepare interview protocol Carol created two versions of the interview protocol -
one for student workers and one for their supervisors. For example, for the “expectation” question, she asked the student workers, “What do you believe you are expected to do? How do you find out what is expected?” And she asked their supervisors, “What do you expect student workers to do? How do they find out?”
2. Select interviewees with different perspectives
Carol selected two student workers and two supervisors. She started with a small number, knowing she could add more if trends did not start to emerge.
3. Conduct interviews Carol interviewed each person individually, taking good notes on the Performance Pyramid Interview form.
4. Compile interview results, one question at a time
For the question dealing with expectations, the responses from the student workers included:“My first priority is to check out books and stuff, unless Mary is supervising me. Mary likes the circulation desk area to be tidy, even if it means people need to wait for a while.”
“It depends on who is working that day. Mary wants things in order; Jeff always puts library patrons first; and Dr. Jones…I’m still not sure what he wants.”
The supervisors said: “They need to quickly and accurately check out materials to students and faculty.”
“I want them to keep the desk area in ship shape. A lot of people come through the library every day and we don’t want them to think we are messy and disorganized.”
5. Interpret the compiled results
Carol quickly spotted the problem of inconsistent expectations across supervisors.
6. Verify the interpretation Carol looked for other indicators to verify the inconsistency problem. She conducted a focus group with the entire supervisory team. And she surveyed all student workers, wording the survey so she did not start a rebellion.
Carol’s Interview
USE WITH ATTACHED FILE
“INTERVIEW ANNOTATED”
5-4

Interview Tutorial
Final Thoughts Based on my experience, a Performance Pyramid Interview will take about 15 minutes. During the interview, it is important to be a good listener and to ask probing questions. It’s also important to have an efficient process for taking notes and/or recording the interviews.
Through the interview process, you will discover all kinds of things, particularly if the interviewee feels comfortable and trusts you. Consequently it is important to have thought about the issue of confidentiality before you start your interviews. You should assume that someone is going to tell you something that will put your values to the test.
If several people are going to be interviewed (N>10), it’s a good idea to have an associate do some of the interviews. In addition to being more efficient, this will give you the opportunity to compare your perceptions with those of someone else. This will be particularly helpful when sorting through the mountains of data generated by the interviews.
A list of resources related to conducting interviews is in the References section.
USE WITH ATTACHED FILE
“INTERVIEW ANNOTATED”
5-5

Survey Tuto
rial
“Of course, your Survey results should be connected in some way to your Interview results.”
6-1

Introduction What do you normally do when you receive a survey? Do you set everything aside and dedicate yourself to answering the questions? Or do you start the survey, and then later throw it away when you realize that you just spent 5 minutes on the first page and you have 7 more pages to go?
The Performance Pyramid Survey is a 1-page instrument for collecting a relatively limited amount of information from a relatively large number of people.
The Survey is best used to augment the Performance Pyramid Interview. The Survey should NOT be used in place of the Interview.
Survey Structure A Performance Pyramid Survey has several components. These components are described below. It will help if you refer to the sample survey on the next page while reading the descriptions.
1) Focus statement. What the survey is about and who is it for?
2) Directions. Restates purpose of the survey and provides instructions.
3) Demographic Information. Other factors (e.g., years on job, rank, etc) could be included.
4) Qualifying Statement. Verifies the person should complete
the survey.
5) Vision Assessment. Determines what the person believes the organization is trying to accomplish. Could be open-ended.
6) Support System Assessment. Determines the person’s view of how well the support system is working.
7) General Assessment. Provides an opportunity for new issues
to surface.
Survey Tutorial
6-2

**This survey is also included as an attached word document file.
1
2
3
4
5
6
7
Reprinted with permission of Wedman/Graham Copyright 1991, 1997, 2004; Wedman/Graham
9710 N. Hartley Rd.; Hallsville, MO 65255; 573-696-2900 Revised January 8, 2006
Increasing Sales through Coaching: Supervisor Survey Directions: Please help us understand your needs related to coaching the members of your sales team. Please do not put your name on this survey. 1. Region Northeast Southeast Central
Northwest Southwest International 2. Do you supervise sales associates? ___Yes ___No
If No, STOP. You do NOT need to complete this survey. Thank you. If Yes, please continue.
3. Which one of the following statements best describes our primary corporate sales strategy?
_____We leverage the expertise of our most productive sales personnel across the entire corporation. _____We increase regional sales production by providing financial incentives to the leading team _____We position our products and services as having the best customer service track record. _____We streamline the order-fulfillment process, beating the industry standard by 50%.
4. Please evaluate the statements below as they relate to your current involvement in coaching your sales
associates. If a statement is generally true, circle T(rue). If you are unsure, circle U(nsure). If a statement is generally false, circle F(alse).
Statement T(rue) – U(nsure) – F(alse)
I receive explicit expectations about coaching my sales associates.
T - U - F
I receive regular and helpful feedback about how well I am coaching my sales associates.
T - U - F
I have ready access to the tools I need to coach my sales associates, including the sales call monitoring system.
T - U - F
The sales office set-up makes it easy for me to coach my sales associates.
T - U - F
As I get better at coaching sales associates, I will be financially rewarded.
T - U - F
I want to be a better sales supervisor, and coaching is an important part of sales supervision.
T - U - F
I’m good at working in leadership roles, particularly with a small group sharing a common goal.
T - U - F
I understand how sales coaching works and I know how to coach my sales associates.
T - U - F
5. If you could tell us one thing about increasing sales by coaching sales associates, what would that be?
Performance Pyramid Sample Survey
Survey Tutorial
6-3
Creating Your Survey
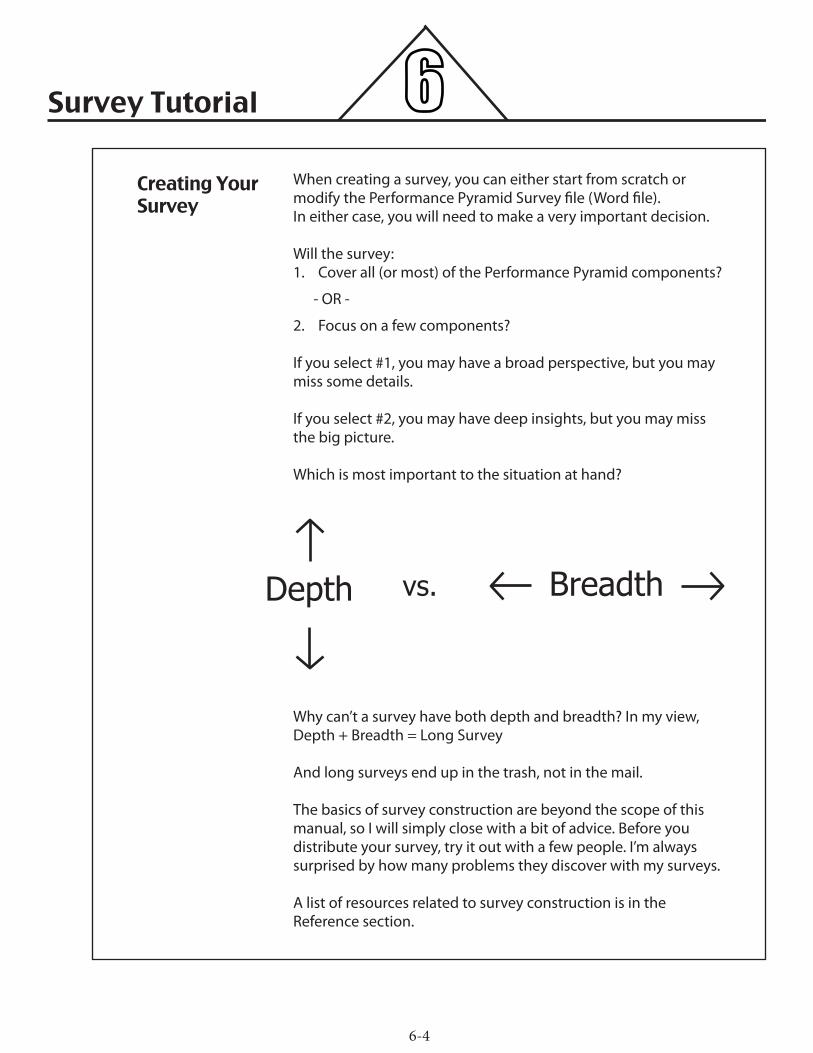
When creating a survey, you can either start from scratch or modify the Performance Pyramid Survey file (Word file). In either case, you will need to make a very important decision.
Will the survey:1. Cover all (or most) of the Performance Pyramid components?
- OR -
2. Focus on a few components?
If you select #1, you may have a broad perspective, but you may miss some details.
If you select #2, you may have deep insights, but you may miss the big picture.
Which is most important to the situation at hand?
Why can’t a survey have both depth and breadth? In my view, Depth + Breadth = Long Survey
And long surveys end up in the trash, not in the mail.
The basics of survey construction are beyond the scope of this manual, so I will simply close with a bit of advice. Before you distribute your survey, try it out with a few people. I’m always surprised by how many problems they discover with my surveys.
A list of resources related to survey construction is in the Reference section.
Depth Breadthvs.
Survey Tutorial
6-4

Survey Tutorial
Increasingly surveys are conducted online. While that trend is not likely to reverse itself anytime soon, you have to decide if an online survey is the best way to go. Think about the people who will complete the survey.
• Dothehavethecomputeraccessandskillsrequired to complete the survey? • Wherewilltheybewhenitarrives?• Do they need any special equipment or resources in order to complete the survey? • Do they feel safe knowing their online responses will not come back to haunt them?
Remember, you are not conducting a guest satisfaction survey for a hotel. You are conducting a needs assessment survey that will generate data used to improve performance.
Make sure you get the kind of survey return you need to make solid recommendations. Sometimes a paper survey passed out at a meeting is better than an online survey that is easily deleted.
Conducting Your Survey
6-5

The nature of the survey and what you want to know determines how you score the results. If your survey is similar to the sample, scoring is pretty much limited to frequency counts and percentages. Nothing wrong with that.
But there are countless other ways to construct a needs assessment survey, with some survey elements lending themselves to more sophisticated and complex scoring. If necessary, you might think about getting help from someone who’s good at statistical analysis. The same is true for coding the results from surveys generating more qualitative data (e.g., open-ended questions).
Interpretation takes place at two levels. The first level involves a narrow focus on each individual question and the associated results. If 75% of the participants said they do not get regular feedback on their performance, you’ve got a feedback problem.
The second level uses a broader focus, looking at relationship between and among questions and the associated results. That takes you back to the Score Card and a look at Component Alignment.
Of course, your Survey results should be connected in some way to your Interview results. The rich data from a handful of interviews coupled with the broad data from a hundred surveys can get to the root cause(s) of a performance problem.
Scoring & Interpreting
Survey Tutorial
YES NOUNSURE
32% 28% 40%
6-6

Data Jo
b Aid Tuto
rial
“...the biggest risk is overlooking what you don’t know - important data you have yet to uncover.”
7-1

Data Job Aid Tutorial
Introduction The needs assessment process can produce an enormous amount of data. The results of interviews, surveys, observations, focus groups, and other data collection methods can begin to obscure your view of the situation and create confusion on your part.
However, the biggest risk is overlooking what you don’t know -- important data you have yet to uncover.
The Data Job Aid will help you organize what you know, and keep track of what you don’t know…yet.
Data Job Aid Structure
The Data Job Aid has five columns. Initially, only Column 1 (Pyramid Factors) has information in it; you fill in the other columns as the information becomes available. Each column of the Data Job Aid is described and illustrated below.
1. Pyramid Factor. All the factors from the Performance Pyramid contributing to the Significant Accomplishment.
2. What you know. For each factor, briefly summarize what you think you know about the situation.
3. What you don’t know. For each factor, list what you haven’t looked into yet.
4. How will you find out? For each item listed in the What you don’t know column, describe how you will find the information needed. As you collect the information, update the What you know column (2).
5. Performance Improvement Action. Once you verify what you know for each factor, briefly describe the appropriate action to be taken.
The following abbreviated example demonstrates how to use the Data Job Aid.
USE WITH ATTACHED FILE“DATA JOB AID”
7-2
Data Job Aid Tutorial
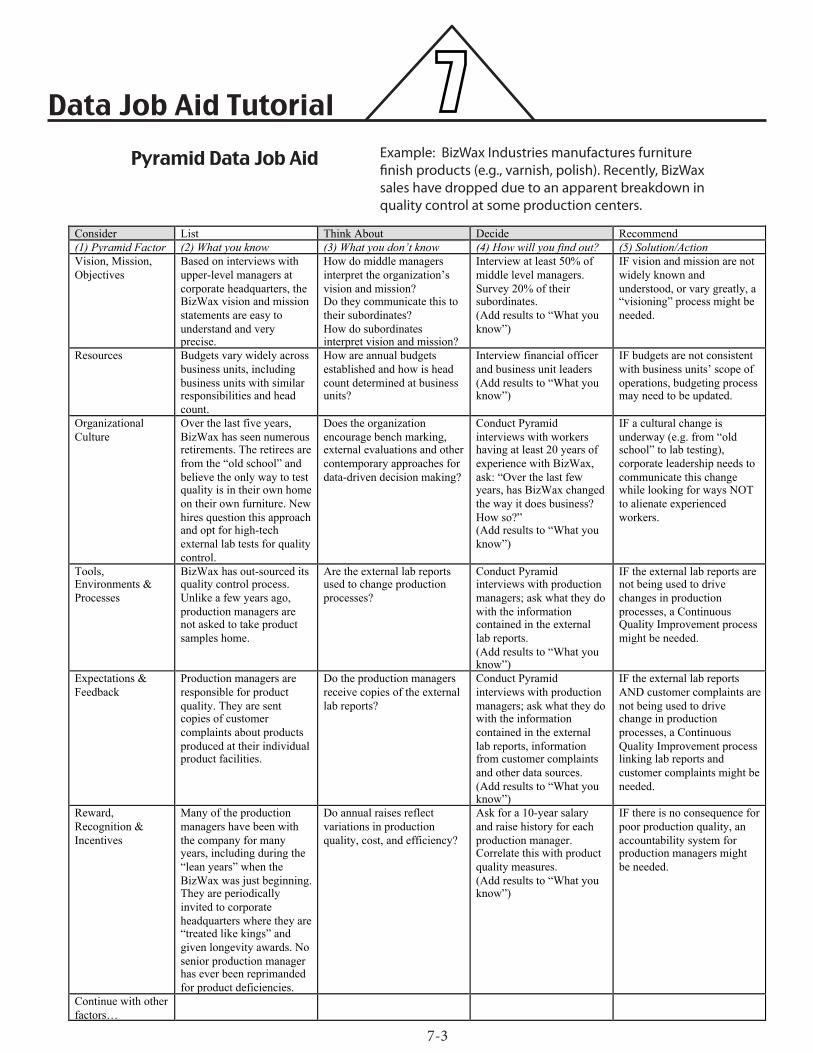
Pyramid Data Job Aid Example: BizWax Industries manufactures furniture finish products (e.g., varnish, polish). Recently, BizWax sales have dropped due to an apparent breakdown in quality control at some production centers.
Consider List Think About Decide Recommend (1) Pyramid Factor (2) What you know (3) What you don’t know (4) How will you find out? (5) Solution/Action Vision, Mission, Objectives
Based on interviews with upper-level managers at corporate headquarters, the BizWax vision and mission statements are easy to understand and very precise.
How do middle managers interpret the organization’s vision and mission? Do they communicate this to their subordinates? How do subordinates interpret vision and mission?
Interview at least 50% of middle level managers. Survey 20% of their subordinates. (Add results to “What you know”)
IF vision and mission are not widely known and understood, or vary greatly, a “visioning” process might be needed.
Resources Budgets vary widely across business units, including business units with similar responsibilities and head count.
How are annual budgets established and how is head count determined at business units?
Interview financial officer and business unit leaders (Add results to “What you know”)
IF budgets are not consistent with business units’ scope of operations, budgeting process may need to be updated.
Organizational Culture
Over the last five years, BizWax has seen numerous retirements. The retirees are from the “old school” and believe the only way to test quality is in their own home on their own furniture. New hires question this approach and opt for high-tech external lab tests for quality control.
Does the organization encourage bench marking, external evaluations and other contemporary approaches for data-driven decision making?
Conduct Pyramid interviews with workers having at least 20 years of experience with BizWax, ask: “Over the last few years, has BizWax changed the way it does business? How so?” (Add results to “What you know”)
IF a cultural change is underway (e.g. from “old school” to lab testing), corporate leadership needs to communicate this change while looking for ways NOT to alienate experienced workers.
Tools, Environments & Processes
BizWax has out-sourced its quality control process. Unlike a few years ago, production managers are not asked to take product samples home.
Are the external lab reports used to change production processes?
Conduct Pyramid interviews with production managers; ask what they do with the information contained in the external lab reports. (Add results to “What you know”)
IF the external lab reports are not being used to drive changes in production processes, a Continuous Quality Improvement process might be needed.
Expectations & Feedback
Production managers are responsible for product quality. They are sent copies of customer complaints about products produced at their individual product facilities.
Do the production managers receive copies of the external lab reports?
Conduct Pyramid interviews with production managers; ask what they do with the information contained in the external lab reports, information from customer complaints and other data sources. (Add results to “What you know”)
IF the external lab reports AND customer complaints are not being used to drive change in production processes, a Continuous Quality Improvement process linking lab reports and customer complaints might be needed.
Reward, Recognition & Incentives
Many of the production managers have been with the company for many years, including during the “lean years” when the BizWax was just beginning. They are periodically invited to corporate headquarters where they are “treated like kings” and given longevity awards. No senior production manager has ever been reprimanded for product deficiencies.
Do annual raises reflect variations in production quality, cost, and efficiency?
Ask for a 10-year salary and raise history for each production manager. Correlate this with product quality measures. (Add results to “What you know”)
IF there is no consequence for poor production quality, an accountability system for production managers might be needed.
Continue with other factors…
7-3
Data Job Aid Tutorial
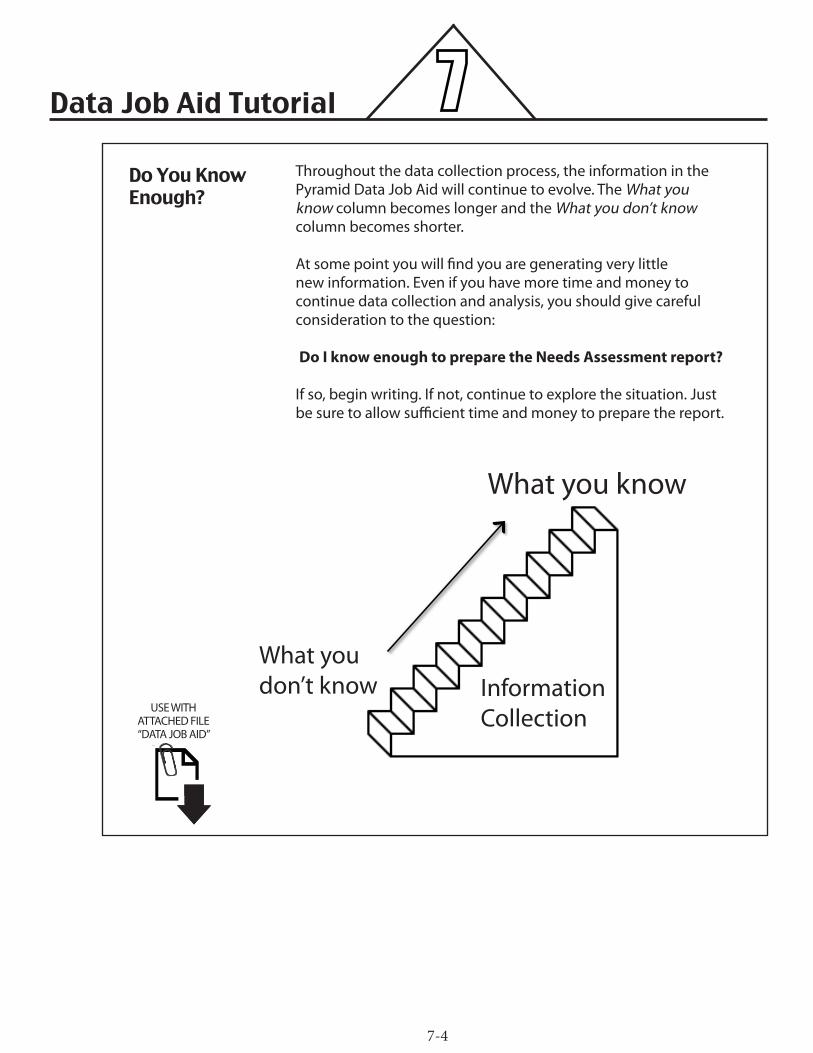
Do You Know Enough?
Throughout the data collection process, the information in the Pyramid Data Job Aid will continue to evolve. The What you know column becomes longer and the What you don’t know column becomes shorter.
At some point you will find you are generating very little new information. Even if you have more time and money to continue data collection and analysis, you should give careful consideration to the question:
Do I know enough to prepare the Needs Assessment report?
If so, begin writing. If not, continue to explore the situation. Just be sure to allow sufficient time and money to prepare the report.
Information Collection
What you don’t know
What you know
USE WITH ATTACHED FILE“DATA JOB AID”
7-4

Report Tuto
rial
“Every needs assessment produces a report.”
8-1

Report Tutorial
Every needs assessment produces a report. The report might be given orally. Or it might take the form of a PowerPoint presentation or a written document. Whatever the format, the report should probably contain the following elements:
•ExecutiveSummary•Problem/OpportunityStatement•ContextandTargetPopulation•NeedsAssessmentProcess•DataSources,DataGathering,andDataAnalysis•GeneralDataSummaryandInterpretation•Recommendations
Each element is briefly discussed below.
Introduction
The Executive Summary should answer four questions: •What’sthecurrentsituation?•What’stheproblemwiththecurrentsituation?•Whatdidyoudotoaddresstheproblem? (Hint: You conducted a Needs Assessment) •Whatdoessomeoneneedtodotoimprovethesituation?
Executive Summary
Describe the overall problem or opportunity. Focus on the problem, not the causes of the problem. For example, the problem might be:
“25% of prospective customers are not contacted within one month of being identified as a prospect and are less likely to place orders than prospects contacted within one month.”
Supporting documentation related to the problem can be included in the appendix.
Problem/Opportunity Statement
“Every needs assessment produces a report.”
8-2

Describe the organization and context in which the needs assessment was conducted. Describe the individuals and/or group(s) whose needs were assessed.
Even if you are certain your boss/customer knows the organization like the back of his/her hand, this section can serve to focus attention on the problem.
Context and Target Population
Report Tutorial
Provide an overview of the process, including the Performance Pyramid Model if it helps. Additional information about the Performance Pyramid can be included in the appendix if it helps prepare a convincing report.
Needs Assessment Process
Describe the data sources, how the data were collected, and how the data were analyzed. At a minimum, make sure you answer these questions:
•Whowasinterviewedandhowwerethey interviewed?
•Whocompletedsurveysandhowwerethey surveyed?
•Whowasobservedandhow/wherewere the observations conducted?
•Whichdocumentswerereviewed?
•Howdidyouanalyzeallthisinformation?
Data Sources,Data Gathering, and Data Analysis
8-3
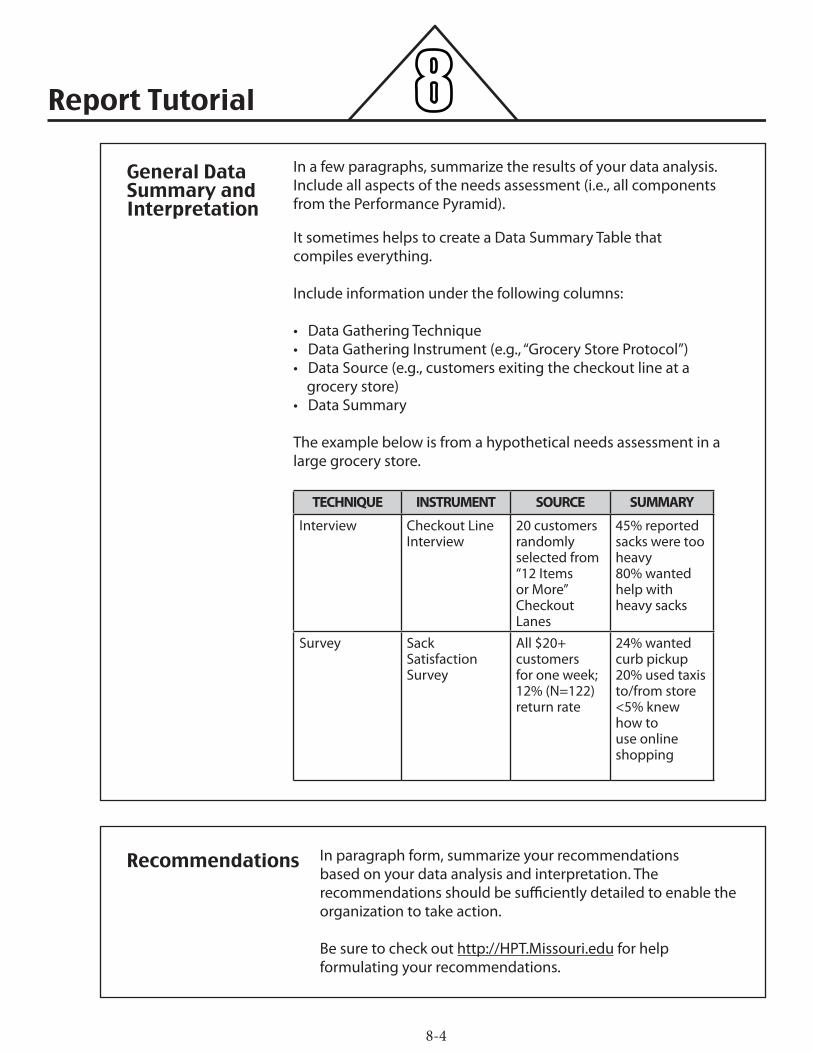
Report Tutorial
It sometimes helps to create a Data Summary Table that compiles everything.
Include information under the following columns:
•DataGatheringTechnique•DataGatheringInstrument(e.g.,“GroceryStoreProtocol”)•DataSource(e.g.,customersexitingthecheckoutlineata grocery store)•DataSummary
The example below is from a hypothetical needs assessment in a large grocery store.
TECHNIQUE INSTRUMENT SOURCE SUMMARY
Interview Checkout Line Interview
20 customers randomly selected from “12 Items or More” Checkout Lanes
45% reported sacks were too heavy80% wanted help with heavy sacks
Survey Sack Satisfaction Survey
All $20+ customers for one week; 12% (N=122) return rate
24% wanted curb pickup20% used taxis to/from store<5% knew how to use online shopping
In a few paragraphs, summarize the results of your data analysis. Include all aspects of the needs assessment (i.e., all components from the Performance Pyramid).
General Data Summary and Interpretation
In paragraph form, summarize your recommendations based on your data analysis and interpretation. The recommendations should be sufficiently detailed to enable the organization to take action.
Be sure to check out http://HPT.Missouri.edu for help formulating your recommendations.
Recommendations
8-4

30-Min
. Needs A
ssessm
ent
“So, what do you do if you only have a little time?”
9-1

30-Minute Needs Assessment
Introduction Way back in Section 2, I tossed out the idea of a layered approach to needs assessment. The basic idea was that the amount of time and resources constrain any needs assessment project. So what do you do if you only have a little time? The framework and process below will yield just enough information for you to complete a high level needs assessment, and provide the foundation for a more in-depth assessment.
If you have read this manual starting from the front, the two subsections below are reviews, but you probably should re-read them anyway.
Accomplishment Formula
As mentioned in the Overview, the Pyramid is based on the belief that, in order to accomplish something of significance, three factors must be in place: Vision, Resources, and Support System.
•Visioncommunicateswhatyouaretryingtoaccomplish.•SupportSystemenablesthevisiontobeaccomplished.•Resourcessustainthesupportsystem.
Here’s the Accomplishment Formula:
Vision +
+
Support System
Resources
Accomplishment=
9-2

30-Minute Needs Assessment
Predictable Relationships
Vision, Support System, and Resources interact in interesting but predictable ways. For example,
•Ifthesupportsystemisnotalignedwiththevision,the likelihood of accomplishing something is diminished. The support system must enable the performance called for in the vision.•Ifadequateresourcesarenotcommittedtosustainthe support system, the work flow will tend to be inefficient and/or ineffective, and accomplishments will suffer.•Ifthevisiondoesnotleadtoaccomplishmentsthatgenerate more resources than are consumed along the way, the ROI is negative, and losses mount up.
30-MinuteProcess
With the above understanding, you can conduct a simple, albeit high-level needs assessment in your organization by asking these five questions:
1. Does the leadership team agree on what they want to accomplish and communicate that vision in one clear voice?2. Are individuals and groups supported when they try to contribute to the accomplishment target?3. Are resources adequate to keep the support system functioning?4. Will accomplishments result in a net resource gain for the organization?5. Are vision, support systems and resources aligned with each other?
Reword the questions to fit the situation and ask 5-10 people the five questions, collecting “yes” or “no” answers. Compile the results and use the Interpretation Guide to shape your conclusions.
9-3

30-Minute Needs Assessment
InterpretationGuide
If most say “No” to:
Then the organization should:
1. Does the leadership team agree on what they want to accomplish and communicate that vision in one clear voice?
Figure out what it is trying to accomplish and consistently and frequently communicate this across the organization.
2. Are individuals and groups supported when they try to contribute to the accomplishment target?
Use the Performance Pyramid to assess all factors related to individual and group performance.
3. Are resources adequate to keep the support system functioning?
Redirect existing resources and/or acquire additional re-sources to sustain the support system.
4. Will accomplishments result in a net resource gain for the organization?
Find efficiencies in the support system or discover ways to increase the ROI.
5. Are vision, support systems and resources aligned with each other?
Adjust one or more of the components (vision, support system, resources) to achieve alignment.
Reporting With data and conclusions in hand, you are ready to write your report. Be sure to put in the appropriate disclaimers. For example: “Due to severe time constraints, a comprehensive needs assessment was not conducted. Decision makers are encouraged to seek additional data before taking action.”
9-4

Case Brie
fs
“...short reports describing situations where the Performance Pyramid was used.”
10-1

Case Briefs
This section contains short reports describing situations where the Performance Pyramid or another needs assessment approaches have been used. Some reports are glowing summaries of successful ventures. Others are from the other end of the continuum. Most fall somewhere in between.
My plan is to provide new Case Briefs periodically (probably sporadically). As long as I have your email address, you will receive them as they become available. If you want to be removed from the distribution list, just let me know.
Introduction
If you have a needs assessment story you would like to share with others, please consider writing a Case Brief. I’ll be honored to help with the editing and distribution.
Send your Case Brief to me at: [email protected]
At the top of the case brief, please provide the following information: --Your name --Your email address --Case Brief Title
The Case Brief itself should answer the following questions:
•Whatwastheperformancecontextandproblem?
•Whatwasdonetounderstandtheproblem?
•Whatdidyoufindoutwasneededtoaddresstheproblem?
•What(ifanything)wasdone?
•Whatwerethelessonslearned?
One last request. If you send me a Case Brief, please think about the issue of confidentiality. Use only fictitious names for people and consider doing the same for the names of organizations.
I hope to hear from you soon!
An Invitation
10-2

Transforming a Technology Wasteland
In the early 1990’s, Central State University (CSU) was a technology wasteland. If you found a new desktop computer, the individual using the computer, not by the university, most likely paid it for. The term “personal computer” took on a unique meaning in this organization.
Fortunately, things began to change by the mid-90’s. New leadership at many levels helped secure funds to upgrade everything from individual desktops to the entire campus network. Nowhere was this transformation more evident than in the CSU School of Business where millions of dollars were invested in the technology infrastructure. For some reason the business faculty were not using technology in their teaching. A needs assessment based on the Performance Pyramid was conducted to find out why.
Using a combination of surveys followed up with interviews the needs assessment revealed several reasons why faculty were not using technology in their teaching. •Onlyhalfofthefacultyreportedtheyhadreceivedexplicitexpectationsregarding the use of technology in their teaching. •Lessthanone-fourthindicatedtheyreceivedregularandhelpfulfeedbackabout how well they were meeting expectations regarding technology use. •Onlytwo-fifthsindicatedtheavailabletools,processes,andenvironment adequately supported technology use in teaching.•Amereone-fifthreportedthatrewardsandincentiveswereinplacetoencourage technology use.
How could this be? The school had invested heavily in hardware, software, networking, and technical support, conducted numerous training sessions, and provided media development services (e.g., web site creation), adding to the already high cost of transforming the wasteland into a technology-rich environment. Finally, school leaders admitted their mistake: they were investing in technology and not in technology use. Too many aspects of the support system were focused on building and maintaining a modern technology infrastructure and too few were focused on supporting the use of technology. The problem was painfully evident in our expenditures: for every dollar spend on technology and technical support, pennies were spent on technology utilization.
Armed with this information the school began the difficult task of transforming what it was doing and where it was investing. This part of the story is still unfolding and too long to be interesting, so this case report ends with one painful lesson learned.
Lesson Learned. A needs assessment can produce a wealth of information about what needs to be changed in order to improve performance. This can include information about how YOU need to change. Realizing that you are part of the problem can be a bitter pill to swallow.
Contributed by: John Wedman
10-3

Unwanted Needs Assessment
Needs assessments are conducted for a variety of reasons: to determine the source of a performance problem, to figure out how to take advantage of a performance opportunity, or to simply do what your boss told you to do or what you your customer asked you to do. Several years ago one of my customers asked me to conduct a needs assessment, the goal being to improve the performance of the company’s sales force.
With consulting contract and retainer in hand I dutifully began to collect data, using the Performance Pyramid as my guide. Within three weeks I had a good amount of interview and survey data and delivered a preliminary report to my customer. Much to my surprise, my customer told me she was not interested in many of the performance barriers I had identified; all she wanted to know was what topics to include in the sales training curriculum.
Realizing I would not be able to change her mind, I redirected my work focusing only on the sales force’s training-related needs. A week later I delivered another preliminary report, detailing the knowledge and skill deficiencies that the training curriculum needed to address and highlighting the topics not included in the curriculum. My customer glanced at the report, noted the highlighted topics, and said, “All I want to know is which of our current courses are people likely to enroll in for the next two quarters.”
Knowing better than to argue, the next week I surveyed the sales force and asked them which courses they were likely to take over the next six months. What had started as a performance improvement needs assessment had morphed into a training needs assessment and then morphed again into a course enrollment projection report. The report was easy to write and my customer (finally) seemed pleased.
Lesson Learned. Just because your customer (or boss) asks for a needs assessment, there is no guarantee that a needs assessment is what he or she really wants, even if it is really needed.
Contributed by: John Wedman
10-4

Pyram
id Gra
phics
“All of the graphics used in this manual are contained in this section and are also provided as electronic files.”
11-1

Pyramid Graphics
Introduction All of the graphics used in this manual are contained in this section and are also provided as electronic files. Please feel free to copy and/or print these files, making sure you:
1. Retain the copyright information on the image, and
2. Abide by the copyright provisions included at the front of this manual©
11-2

Pyramid Graphics
Knowledge & Skills
Performance Capability
Motivation, Values& Self Concept
Tools, Environment& Processes
Expectation& Feedback
Rewards, Recognition& Incentives
Organizational Culture
C 2009 Wedman & Graham
Performance Pyramid
Outcomes
Resources
SignificantAccomplishments
Vision, Missionand Objectives
ContinuousMonitoring
C
eg
na
h
ss
ec
or
P
11-3

Knowledge & Skills
Performance Capability
Motivation, Values& Self Concept
Tools, Environment& Processes
Expectation& Feedback
Rewards, Recognition& Incentives
Organizational Culture
C 2009 Wedman & Graham
Performance Pyramid
Outcomes
Resources
SignificantAccomplishments
Vision, Missionand Objectives
ContinuousMonitoring
C
eg
na
h
ss
ec
or
P
Pyramid Graphics
© 2009 Wedman & Graham
11-4

Refere
nces
12-1

References
Needs Assessment - In Print
Gilbert, T.F. (1978). Human Competence: Engineering Worthy Performance. McGraw-Hill, New York, NY.Mager, R.F. & Pipe R. (1970). Analyzing Performance Problems, 2nd Edition, Pitman Learning, Inc. Belmont, CA.Pershing, J.A. (2006), Handbook of Human Performance Technology, 3rd Edition. John Wiley & Sons, Inc. San Francisco, CA.Schaffer, S. & Richardson, J (2004). Supporting technology integration within a teacher education system. Journal of Educational Computing Research, 31(4), 423-435.Schaffer, S.P. (2000) A review of organizational and human performance frameworks. Performance Improvement Quarterly 13(2), 220-243.Watkins, R. & Wedman, J (2004). Assessing, analyzing, and answering: A process for aligning performance improvement resources and strategies. Performance Improvement. 42 (7), 9-17.Wedman, J. (2009) The Performance Pyramid. In R. Watkins and D. Leigh (Eds.) Handbook of Improving Performance in the Workplace. Volume 2: Selecting and Implementing Performance Interventions. John Wiley & Sons.Wedman, J. F. & Diggs, L. (2001). Identifying barriers to technology-enhanced learning environments in teacher education. Computers in Human Behavior 17: 421-430.Wedman, J. F., & Graham, S. W. (1998). Introducing the concept of performance support using the performance pyramid. Journal of Continuing Higher Education, 46(3), 8-20.
Needs Assessment - Online
Needs Assessment Basics. Overview of Performance Pyramid http://NeedsAssessment.missouri.edu While archeologists are busy exploring the ancient pyramids, professionals across the country are using the Performance Pyramid as a blueprint to guide their performance improvement efforts. Consisting of a simple model and set of data-gathering tools, the Performance Pyramid unlocks the secrets of good performance and guides the needs assessment process.
Conversations on Human Performance Technology http://hpt.missouri.edu Listen in as experts in the field of Human Performance Technology share their experiences, explore key issues, and raise challenging questions. Consisting of interviews on nearly every aspect of the Performance Pyramid, this webcast series breaks new ground by bridging the gap between theory and practice.
NeedsAssessment.org http://NeedsAssessment.org Offering a range of resources related to needs assessment, with a focus on needs assessment to improve human and organizational performance.
12-2