Perceptions of Sea Level Rise Among Adult Residents … of Sea Level Rise Among Adult Residents of...
107
Perceptions of Sea Level Rise Among Adult Residents of North Carolina's Outer Banks Region Albemarle Ecological Field Site Capstone Report December 2008 Photo by Mariah Keller (2008) University of North Carolina at Chapel Hill Institute for the Environment Prepared by: Jessie Barber, Jennifer Bellis, Andy Blackmore, Taylor Crabtree, Mariah Keller, Nathan Lamb, David Richardson, Meredith Robbins, Jamie Stubson, and Ella Wise Robert Perry, Site Director
Transcript of Perceptions of Sea Level Rise Among Adult Residents … of Sea Level Rise Among Adult Residents of...

Perceptions of Sea Level Rise Among Adult Residents of
North Carolina's Outer Banks Region
Albemarle Ecological Field Site Capstone Report December 2008
Photo by Mariah Keller (2008)
University of North Carolina at Chapel Hill
Institute for the Environment
Prepared by: Jessie Barber, Jennifer Bellis, Andy Blackmore, Taylor Crabtree, Mariah Keller,
Nathan Lamb, David Richardson, Meredith Robbins, Jamie Stubson, and Ella Wise
Robert Perry, Site Director

AEFS 2008 2
For Tobey Milne October 10, 1939 - November 27, 2008
“I drink old-growth forest in like water. This is the home-land that built us. Here I walk shoulder to shoulder with history- my history. I am in the presence of something ancient and venerable, perhaps
of time itself, its unhurried passing marked by immensity and stolidity, each year purged by fire, cinched by a ring. Here a
mortality’s roving hands grapple with air. I can see my place as human in a natural order more grand, whole, and functional than
I’ve witnessed, and I am humbled, not frightened, by it. Comforted. It is as if a round table springs up in the cathedral of pines and God graciously pulls out a chair for me, and I no longer have to
worry about what happens to souls.”
- Janisse Ray, Ecology of a Cracker Childhood

AEFS 2008 3
Table of Contents
Preface ..................................................................................................................................4 Acknowledgements ..............................................................................................................5 Abstract ................................................................................................................................6 Chapter I – Introduction .......................................................................................................7 Defining Global Climate Change.............................................................................7 Factors Contributing to Global Climate Change .....................................................8 Global Climate Change’s Contributions to Sea Level Rise .....................................9 Potential Effects of Sea Level Rise ........................................................................12 Impacts on North Carolina and the Outer Banks Region ......................................13 Minimizing the Effects of Sea Level Rise .............................................................15 Purpose of Study ....................................................................................................15 Significance of Study .............................................................................................16 Chapter II - Literature Survey ............................................................................................17 Chapter III – Methodology ................................................................................................21 Research Question .................................................................................................21 Population ..............................................................................................................21 Sampling Procedure ...............................................................................................21 Instrumentation ......................................................................................................22 Analysis..................................................................................................................23 Validity and Reliability ..........................................................................................24 Assumptions ...........................................................................................................27 Scope and Limitations............................................................................................27 Chapter IV – Results ..........................................................................................................29 Demographics of Respondents ..............................................................................29 Respondents’ Perceptions of Sea Level Rise .........................................................35 Chapter V – Conclusions ...................................................................................................54 Introduction ............................................................................................................54 Education ...............................................................................................................55 Age .........................................................................................................................57 Townships ..............................................................................................................59 Ownership Status ...................................................................................................60 Recommendations ..................................................................................................62 References ..........................................................................................................................66 Appendix ............................................................................................................................69

AEFS 2008 4
Preface
The Albemarle Ecological Field Site (AEFS) is part of the University of North Carolina
Institute for the Environment. Located in Manteo, North Carolina, AEFS is a multidisciplinary
program focused on environmental issues in the Albemarle region and the sustainable
management of its natural resources. AEFS fuses an extensive curriculum, individually focused
internships, intense community involvement and a group capstone project, which is chosen by
the Community Advisory Board (CAB), a body consisting of community members from
throughout the Outer Banks. Collectively, these elements foster a broad understanding of both
the challenges that face the coastal region and the possibilities for a responsible and sustainable
community design.
2008 AEFS Students
Jessie Barber Nathan Lamb Junior, Sociology Major/ Class of 2008 Environmental Studies Minor Environmental Studies Major Asheville, NC Apex, NC Jennifer Bellis David Richardson Senior, Environmental Studies Major Junior, Environmental Studies Major Raleigh, NC Raleigh, NC Andy Blackmore Meredith Robbins Class of 2008 Junior, Environmental Studies Major Music Major City and Regional Planning Minor Jacksonville, NC Shelby, NC Taylor Crabtree Jamie Stubson Junior, Environmental Studies Major Junior, Environmental Studies Major Gastonia, NC Cary, NC Mariah Keller Ella Wise Junior, Environmental Studies Major Junior, Environmental Studies Major Burnsville, NC Hudson River Valley, NY

AEFS 2008 5
Acknowledgements The authors would like to thank the following people who contributed to the study. This project could not have been undertaken without their invaluable help. (listed in alphabetical order by last name) Corey Adams Allen Jernigan Hillary Anderson Carol Soo Lee Marcelo Ardón Lee Leidy Alton Ballance Amy MacDonald Larry Band Anna MacLean Phil Berke Aaron McCall Paul Biemer John McCord Bill Birkemeier Michael McOwen Peggy Birkemeier Ike McRee Bruce Bortz Rob Milne Brennan Bouma Sara Mirabilio The Honorable Judge Terrence W. Boyle Meredith Morgan Alex Brewington Susanne Moser Myra Walters Burke Benny O’Neal Dwight Burrus Sam Pearsall Renee Cahoon Robert Perry Linda D'Anna Feather Phillips Linda Davis Pat Raves Jan DeBlieu Tony Reevy Lindsay Dubbs Cy Rich Brian Edwards Bland Simpson Teresa Edwards Beth Storie Willie Etheridge Scott Stroh Web Fuller Dave Sybert Helen Furr Holly White Greg Gangi Tom White Albert Gard Horrace Whitfield Carolyn Gard George Wood Kathleen Gray Ben Woody Jess Hawkins Mike Wilson Wanda Headley Joe Wilson Diane Hendry Festival Park Guest House Staff Bill Holman The Folks at Stack ‘Em High Tyler Jackson

AEFS 2008 6
Abstract
Despite the vast quantity of scientific research on sea level rise, little is known about how the public perceives the phenomenon. The lack of research on this topic leaves policymakers in the dark concerning what, if anything, they should do to address rising sea levels. This study examined the perceptions of people residing in the Outer Banks region of North Carolina regarding sea-level rise using the convenience sampling method. A survey was designed to gauge whether respondents thought sea level rise was occurring, how they felt sea level rise might impact them, what responses should be taken to address sea level rise, and how informed they felt on the topic. The survey was then distributed by hand and through a local newspaper. A total of 240 respondents completed surveys and, of those, 232 qualified to be included in the analysis. Descriptive statistics of the respondents’ answers were then compiled for interpretation. From these comparisons, it appears that formal education seemed to have the strongest correlation with how informed respondents felt about the subject of sea level rise, as well as how concerned they were about it. In general, those with higher levels of education seemed to feel more informed on the subject of sea level rise and considered it something that needed to be addressed. Considering this data and the limited influence one can have on the number of people with formal education, the two greatest recommendations to policymakers are that there should be more widespread comprehensive education of the public on the topic of sea level rise as well an inclusion of the topic, with increased emphasis, in high school curricula.

AEFS 2008 7
Chapter I - Introduction
Sea-level rise and fall are natural phenomena that have occurred repeatedly for several
millennia. At present, we appear to be in a period of sea level rise (Riggs and Ames 2003).
Over the past few decades, those in the scientific community have recorded an increase in the
rate of sea-level rise. Most experts believe this increase is a direct result of global climate
change (Gornitz et al. 1982). While there is an abundance of information concerning sea-level
rise, little research has been conducted regarding the perceptions of coastal populations with
respect to this issue.
Defining Global Climate Change
Global climate change is defined as the warming of Earth’s atmosphere as a result of
increased concentrations of greenhouse gases. These gases include carbon dioxide, methane,
water vapor, nitrous oxide, chlorofluorocarbons, hydrofluorocarbons, perfluorocarbons, and
sulfur hexafluoride (Lawrimore 2005). The warming of the earth is a result of radiation
penetrating the atmosphere and striking the earth’s surface, where energy is either absorbed and
transformed into heart or reflected back into space. The atmosphere traps some of that heat and
prevents the planet from experiencing dramatic temperature extremes. Greenhouse gases are the
agents through which heat is retained in the atmosphere. From 1765 to the present, it has been
estimated that two greenhouse gases, carbon dioxide and methane, have been responsible for an
increase (61% and 23% respectively) of infrared radiation, or heat, remaining within the earth’s
atmosphere (Bridgham 1995). This trapping of heat within the atmosphere is known as the
greenhouse effect.
The greenhouse effect keeps our planet warm enough to support life. However, as the
concentration of greenhouse gases increases, its impact on the atmosphere also increases. Over
the past century, the average global atmospheric temperature rose between 0.3 and 0.6C.

AEFS 2008 8
Moreover, the North Atlantic Ocean temperature, at a depth between 800 and 2500 meters, is
currently increasing at a rate of 1C per century (Bridgham 1995). As long as there continues to
be an increase in greenhouse gas concentrations in the atmosphere, it is likely that the average
global temperature of the earth will also continue to rise.
Factors Contributing to Global Climate Change
Increasing concentrations of greenhouse gases in the atmosphere are the primary cause of
accelerated global climate change today (Bernstein et al. 2007). These gases are released
through the burning of fossil fuels for manufacturing, transportation, heating and cooling needs,
and other modern conveniences demanded by both developed and developing countries. Tim
Flannery, an Australian scientist and advisor to the Australian Federal Parliament, states that
approximately 80% of all global warming observed today has been caused by the release of CO2
from the burning of fossil fuels (2005). As seen in Figure A, the global average surface
temperature has been rising for nearly a century. The industrial revolution, which sparked
massive fossil fuel (e.g. oil, gas, coal) extraction and consumption, began a little more than a
century ago. Therefore, it is likely that fossil fuel-based human activities are the primary cause
of the buildup in greenhouse gases in the atmosphere (Bridgham 1995).
Another anthropogenic factor contributing to accelerated global climate change is
increasing human population. As human population continues to grow, so do greenhouse gas
emissions. Marian Starkey, the Communications Manager at Population Connection, reports
that, “In the United States, population and carbon dioxide emissions have both risen by exactly
18% since 1990” (2007). She attributes 20% of greenhouse gas emissions to deforestation,
which is also related to growing human populations and their need for space, food, and
resources. As population continues to grow and developing countries increase their standard of

AEFS 2008 9
living and rates of consumption, the planet will continue to experience unprecedented emissions
of greenhouse gases into the atmosphere.
Figure A Source: IPCC AR4 Synthesis Report 2007
Global Climate Change’s Contributions to Sea Level Rise
Sea level rise is the vertical increase in seal level as opposed to the horizontal change in
the mean high tide line. There are three main causes of sea-level rise: glacial melt, thermal
expansion, and glacial isostatic adjustment resulting in the subsidence of landmasses. Since the
end of the last Ice Age approximately 15,000 years ago, global average surface temperatures
have increased, causing polar ice to melt (State of the Coast Report 2004). According to
Flannery, the melting of sea ice will affect the earth’s albedo, which is the ability of planetary
surfaces to reflect the sun’s energy back into space. He notes, “One-third of the sun’s rays
falling on the earth is reflected back to space. Ice, particularly at the poles, is responsible for a

AEFS 2008 10
lot of that albedo, for it reflects back into space up to ninety percent of the sunlight hitting it”
(2005). Glacial melt is accelerated as polar ice melts and the earth absorbs more sunlight. The
Union of Concerned Scientists estimates that the complete deglaciation of the West Antarctic Ice
Sheet alone would cause a four to six meter increase in sea level (“Early Warning Signs of
Global Warming” n.d.). According to Stanley R. Riggs and Rachel Ames, authors of Drowning
the North Carolina Coast: Sea-Level Rise and Estuarine Dynamics, “If all of the present glacial
ice in Greenland and Antarctica was to melt, sea level would be approximately 200 feet [60
meters] higher than it is now” (2003). While this amount of sea level rise would be dramatic, it
does not include the contributions of thermal expansion or land mass subsidence to rising sea
levels. Sam Pearsall, former Director of Science for the Nature Conservancy’s North Carolina
chapter, writes that, at present, “Global warming from post-industrial build-up of carbon dioxide
and other greenhouse gases in the atmosphere is causing the sea to rise, partly as the result of ice
melting, but mainly due to the thermal expansion of water” (2005).
Seawater expands as it gets warmer. Thermal expansion has already contributed ten to
twenty centimeters to sea level rise (Lovgren 2004). According to the Intergovernmental Panel
on Climate Change report released in 2007, the observed rate of sea level rise due to thermal
expansion was 0.42 millimeters per year (Bernstein et al. 2007). This is a smaller portion than
that due to glacial melt (0.69 millimeters per year). However, it appears that the rate of sea level
rise due to thermal expansion is increasing. As seen in Figure B, between 1993-2003, the
observed rate of sea level rise due to thermal expansion increased to 1.60 millimeters per year,
and to 1.19 millimeters per year due to glacial melt. According to one study, anthropogenic
emissions have already committed the planet to future thermal expansion-induced sea level rise
equivalent to 320% of the previously observed rise in sea level by the end of the 21st century
(Meehl et al. 2005).

AEFS 2008 11
Figure B Source: IPCC AR4 Synthesis Report 2007
Glacial isostatic adjustment occurs when continental plates rebound from depression
caused by the enormous weight of the glaciers that covered them 10,000 years ago. The two
principal ways sea level rise is measured are through satellite altimetry data and tide gauges
(Beckley et al. 2007). The difference between these two types of data can be used to indicate the
presence of glacial isostatic adjustment. Satellites can record the level of rising seas with a fair
degree of accuracy by measuring their surface directly. Tide gauges are not typically as reliable
as satellites. Tidal gauges rise and fall with the movement of land surfaces, thereby either under-
or over-valuing sea level rise where measured. In areas most affected by glacial isostatic
adjustment, sea level rise figures are affected by as much as 1 millimeter per year, resulting in a
global sea level rise error of 0.15 millimeters per year (Bindoff et al. 2006). While the estimates
for sea level rise from 1961 to 2003 range between 1.3 and 2.2 millimeters per year, areas most
impacted by subsidence from glacial isostatic adjustment, such as the North Carolina coast, may
actually be experiencing a sea level rise of 2.3 to 3.2 millimeters per year, which is considerably
greater than the national average (Cabanes et al. 2001).

AEFS 2008 12
Potential Effects of Sea Level Rise
If sea levels continue to rise at projected rates, both human infrastructure and natural
ecosystems will likely experience a number of adverse effects. Homes, commercial centers,
infrastructure, farms, towns, and even portions of cities located on low-lying coastal areas may
experience inundation in the relatively near future. At present, 80% of the world’s population
resides within sixty-two miles of a marine coastline. Sea level rise could affect population
densities both near the shore and inland (“Sea Level Rise” 2008). If sea level rise became a
greater threat than at present, an inland migration of displaced residents might occur, thereby
decreasing population densities near the shore and increasing them farther inland. Many natural
ecosystems located in coastal areas will also be affected by sea level rise.
Source: The North Carolina Coastal Federation
Coastal wetlands are one of the most biologically productive ecosystems on Earth.
However, they are also one of the most threatened by sea level rise. They provide critical
habitats for numerous terrestrial, avian, and aquatic species. In addition, they filter water, trap
sediments, control erosion, and mitigate floods. A rise of only fifty centimeters would inundate

AEFS 2008 13
50% of North American coastal wetlands (“Early Warning Signs of Global Warming” n.d.). It,
has been hypothesized that peat soils will break down in the presence of saltwater (Pearsall
2005). If this hypothesis proves true, pocosin wetlands, which are found throughout Eastern
North Carolina, could be destroyed by inundation. Other coastal ecosystems that are currently,
and will likely continue to be, affected by rising sea levels include estuaries, coral reefs, and
mangrove swamps (“Sea Level Rise” 2006).
Another ecological problem sea level rise may exacerbate is the introduction and spread
of non-native species. As many native species struggle to survive in the new conditions
introduced by global climate change and sea level rise, some non-native species will likely
supplant them. With little competition and diminished control from natural predators,
populations of non-natives may quickly expand, thereby reducing native populations of both
flora and fauna (Pearsall 2005).
Impacts on North Carolina and the Outer Banks Region
The Outer Banks are highly vulnerable to sea level rise. The 2004 State of the Coast
Report states that, “North Carolina has one of the highest rates of sea level rise in the world,
ranging between 12 and 17 inches [0.30 and 0.43 meters] a century”. This increase would be

AEFS 2008 14
devastating for low-lying terrain such as that found on and near the Outer Banks. “When the sea
rises a few centimeters in this part of the world, flooding extends inland many meters. About a
meter of sea level rise will inundate over 4,000 square kilometers of low-lying lands in northeast
North Carolina” (Pearsall 2005). Manteo, Rodanthe, Salvo, Wanchese, and Waves are all towns
on or near the Outer Banks with an average elevation of one meter or less that would ultimately
become inundated in 230 years should sea level continue to rise at the current, unaccelerated
rate.
Riggs and Ames state that sea level rise will cause “accelerated rates of coastal erosion
and land loss, increased economic losses due to flooding and storm damage, increased loss of
urban infrastructure, collapse of some barrier island segments, and increased loss of estuarine
wetlands and other coastal habitats” in North Carolina (2003). The 2004 State of the Coast
Report acknowledges that, “If sea level continues to rise at just its current rate and hurricane
activity remains intense, the Outer Banks will begin to break up in a couple of decades”. In
addition to these effects, the Nature Conservancy asserts the Albemarle peninsula could be
affected by saltwater intrusion, a rising water table, shifts in species distribution, an influx of
non-native species, and the disintegration of wetland peat soils (n.d.).
An additional concern regarding sea level rise in North Carolina is the destruction of
conservation lands. According to Sam Pearsall, “Up to half of the lands at risk from rising seas
are conservation lands, established and maintained for the public benefit” (2005). It will be
difficult or impossible to replace these unique lands once they are lost.
The North Carolina coastal economy may experience considerable losses due to sea level
rise. According to a study by Appalachian State University, by the year 2080, lost beach revenue
may reach $3.9 billion, and property value loss may total $6.9 billion. The value of potential
property loss due to permanent inundation could range from $242 million to $2.7 billion in Dare

AEFS 2008 15
County alone. It is estimated that by 2080, businesses (i.e. agriculture, forestry, and fishing
industries) will lose nearly $157 million per hurricane event due to business interruptions
(Appalachian State University 2007). With so much at stake, policy-makers may want to
consider a range of responses to mitigate and better adapt to the potential effects of sea level rise.
Minimizing the Effects of Sea Level Rise
There are several policy and land management strategies that could be implemented to
mitigate the effects of rising sea levels. Policy measures include ocean setback rules that would
encourage a gradual retreat from the ocean and estuarine waters. The construction of hard
shoreline protection structures, such as groins and jetties, could be limited to allow for the inland
migration of coastal wetlands. Filling in or damming ditches, which were originally dug to drain
cropland and to control water-borne pests, could slow saltwater intrusion and protect wetland
peat soils from decomposition (Pearsall 2005).
Many conservation land managers are uncertain of what they should do to protect
conservation areas in the face of global climate change. Information should be made available to
those managers seeking to protect conservation properties from sea level rise. As the ocean
rises, coastal areas farther inland could be acquired for conservation to preserve biodiversity and
to replace the loss of protected lands along the coast (Pearsall 2005). Salt-tolerant native species,
such as the bald cypress, could be introduced to help maintain ecosystems as water levels rise
(The Nature Conservancy n.d.). Finally, restoration of aquatic vegetation beds and seed marl
reefs could provide habitats for oysters, improving water quality and stabilizing shorelines,
thereby helping to slow erosion (Pearsall 2005).
Purpose of Study
This research was conducted to determine the perceptions of people residing on the Outer
Banks and Roanoke Island regarding the phenomenon of sea level rise. Citizens were asked to

AEFS 2008 16
respond to a set of questions and statements as a part of a survey designed to gauge their
knowledge of sea level rise as well as their opinions on possible mitigation measures. The
survey was also used to collect a number of demographic variables associated with each
respondent so that correlations, comparisons, and other quantitative relationships could be
calculated from the collected data.
Significance of Study
Despite the abundance of scientific studies suggesting the occurrence of sea level rise,
some people continue to deny that it is occurring, or know little about it. Others may have never
encountered the notion of sea level rise. It is important, especially in areas particularly
susceptible to the effects of sea level rise, to understand people’s perceptions and to structure and
implement educational efforts and policies accordingly. This study is significant because it
focuses on the perceptions of residents of the Outer Banks region of North Carolina, a population
that is vulnerable to sea level rise. Their perceptions regarding this phenomenon remain
relatively uninvestigated. The findings of this study may prompt researchers and government
officials to look more deeply into sea level rise and its possible impacts. The aim of this research
is to spark more in-depth and rigorous analyses of public perceptions, and inspire citizen and
government action.

AEFS 2008 17
Chapter II – Literature Survey
Before surveying the perceptions of Outer Banks residents on the phenomenon of sea
level rise, it was important to investigate any previous research concerning perceptions of sea
level rise, in particular, any completed studies that focused on the Outer Banks of North
Carolina. A literature survey would help to ensure that we were not merely replicating the work
of previous researchers.
At the beginning of our search, we were referred to the Natural Hazards Center Library at
the University of Colorado at Boulder. With the assistance of librarian Wanda Hadley, we
uncovered starting points for our survey. Using her recommendations, we contacted authors of
other studies and broadened our search.
We did not find any research about sea level rise perceptions among residents of North
Carolina’s Outer Banks. The literature examined the perceptions in other geographic regions and
at how risk perceptions might apply to public policy. We found a range of sea level rise
perception studies from across the United States and Europe. For the most part, these focused on
two populations: 1) government officials and coastal planners; and 2) the general public. We
will first look at studies centered on the latter. A summary of each study follows.
Ruud Raaijmakers, et al., published an article in 2008 in Natural Hazards entitled “Flood
risk perceptions and spatial multi-criteria analysis: An exploratory research for hazard
mitigation.” The article presented a conventional risk analysis focused on the Ebro Delta region
of Spain. The study centers on the stakeholders and lay people, assessing their awareness, worry
and preparedness in regard to sea level rise. These components reflect the community’s various
levels of knowledge, perceived security, perceived control and desired risk reduction. From
these results, a standardized risk assessment value was determined and assigned, informing
governmental agencies of stakeholders’ concerns and worries.

AEFS 2008 18
Another study of public perception was conducted by T.M.M. Carvalho and C.O.A.
Coelho in 1998. Their article in The Journal of Hazardous Materials, entitled “Coastal Risk
Perception: a Case Study in Aveiro District, Portugal,” shows the relatively low awareness of the
dangers associated with living in an urban area at risk from rapidly eroding shoreline. The study
suggests that the high rate of shoreline erosion was caused by a combination of natural and
anthropogenic factors and that engineered structures should be considered to protect the
coastline.
Finally, a third study of public perception was generated by the University of New
Orleans Department of Sociology and its Environmental Social Science Research Institute.
Shirley Laska and Rod Emmer’s 1992 article, “Resident and Public Official Perceptions of the
Effects of Coastal Erosion and Sea Level Rise on Coastal Louisiana: The Barataria Basin,”
discusses a risk perception study in a low-lying marsh area in Louisiana west of the Mississippi
River. The results show a correlation between risk perception and gender as well as risk
perception and race. Ten percent of those who did not feel that the region was experiencing
coastal erosion were more likely to be female and black. The data also shows a difference
between the perceptions of residents and public officials about both erosion and land loss
phenomena and the state’s ability to allocate relief funds.
The second set of articles addresses the options available to urban planners and
policymakers in response to the risk of sea level rise, and their own perceptions of the risk of sea
level rise. The articles summarized below give an idea of how this type of perceptual study can
be applied to local governments to achieve practical results.
The article by Raymond Burby and Arthur Nelson entitled, “Local government and
public adaptation to sea-level rise,” published in 1991, is intended as a primer for local
governments and policymakers on the risk of sea level rise. It addresses the basic science behind

AEFS 2008 19
the causes of sea level rise, the degree to which it is likely to affect coastal areas, and the
possible severity of effects that could result. Additionally, Burby and Nelson explore
management options for policymakers that range from immediate solutions, such as beach
renourishment, to both structural and nonstructural remedial measures, such as sandbags, jetties
or seawalls, to the more long-term, such as retreat. The aim is to give policymakers an
understanding of the stresses that sea level rise will create for coastal communities, as well as the
pre-existing issues that will be exacerbated. An additional aim is to educate policymakers about
what can be done now and in the future to diminish the negative impact of sea level rise on
coastal communities.
Another study also conducted by Rod Emmer and Shirley Laska (along with four
colleagues) assesses the perceptions of the public and policymakers as well as options for future
government action on the Louisiana Gulf Coast. Published in 1992, their article, entitled
“Planning for Sea Level Rise Along the Louisiana Coast: A Workbook of Ideas, Model
Ordinances, Resident and Public Official Survey Findings, and References,” expands on the
ideas of their previous article. They also included planning options for the Louisiana
government including model ordinances, regulations and codes that could address the problem in
the near future. This study serves as an example of how research on perceptions of sea level rise
can be applied to benefit the public.
A third study by Susanne Moser and John Tribbia entitled “Vulnerability to Inundation
and Climate Change Impacts in California: Coastal Managers’ Attitudes and Perceptions,”
published in 2006, deals exclusively with the perceptions of coastal managers of California’s
shoreline, an area vulnerable to sea level rise as well as a wide array of other problems. Moser
and Tribbia found that, while coastal managers are aware of inundation from sea level rise as a
serious risk, other more pressing issues vie for attention. Consequently, the report indicates that

AEFS 2008 20
California’s coastal managers are inadequately prepared to respond to the impacts of climate
change and sea level rise.
These types of studies, especially those carried out by Emmer, et al., are significant
because they reveal the lack of preparedness of most coastal regions when faced with the reality
of rising sea levels. The coast of North Carolina is no exception, as the results from this study
are expected to be similar.
No literature was found that addresses public perceptions of the risk of sea level rise on
the Outer Banks of North Carolina. It is possible that such research exists but may be
unpublished. In addition, such studies may have been conducted concurrently with our own.
This literature survey provides a good framework for understanding sea level rise risk perception
in other vulnerable areas around the world.
The papers by Raaijmakers, Carvalho, and Laska focused exclusively on public
perceptions and some policy options for their regions: the Ebro Delta of Spain, Aveiro, Portugal,
and the Barataria Basin of Louisiana, respectively. The remaining papers studied the responses
and opinions of policymakers and coastal land managers, who are most likely to make pivotal
decisions regarding coastal policy in the near future. While levels of knowledge and action vary
across demographics, policymakers tend to acknowledge a greater risk from sea level rise than
other citizens, but underestimate their local government’s ability to mitigate it. This may be an
indication that local governments are inadequately prepared to address the threat of sea level rise.
We anticipate that our study, along with those outlined above, may be used by
policymakers to develop a better understanding of the source of certain held beliefs and how to
develop site-specific policies. By understanding how communities most likely to be impacted by
sea level rise view and are likely to respond to situations, effective plans can be developed by
both government bodies and citizen groups.

AEFS 2008 21
Chapter III - Methodology
Research Question
The fundamental question of this study is: What are the perceptions of Outer Banks
residents regarding the phenomenon of sea level rise? The purpose is to gauge public perception
in order to better inform policymakers, educators, and the general public regarding sea level rise.
Population
The population of this study is defined as full- and part-time adult residents of the
Roanoke Island and the Outer Banks of North Carolina. This population was chosen because it
is rapidly growing (Figure i of Appendix A) and vulnerable to sea level rise (Figure ii of
Appendix A).
Sampling Procedure
The study used the convenience sampling method. This method is used in exploratory
research when the investigators are mainly interested in an approximation of responses to the
research question. Convenience sampling is an efficient method but lacks randomization and
generalizable results. In this study, the researchers were limited by many factors including, but
not limited to, time, funding, and prior surveying experience. These factors made it difficult to
select and survey a completely random sample. Although this study used convenience sampling,
the researchers strove to select a representative population. The sample was selected by first
defining the sampling areas, which consisted of several Outer Banks towns: Duck, Kitty Hawk,
Kill Devil Hills, Nags Head, Manteo, Wanchese, Rodanthe, Waves, Salvo, Avon, Buxton,
Frisco, Hatteras Village, and Ocracoke Village. The researchers, in groups of two to four,
surveyed for three to eight hours in each town.
The researchers chose to administer the survey by canvassing each town’s commercial

AEFS 2008 22
district to find willing respondents. Because the survey was conducted primarily in commercial
areas, the majority of the respondents were retail employees. However, respondents were also
surveyed at churches, fishing docks, and government facilities. Researchers introduced
themselves as students of UNC- Chapel Hill, briefly explained the study, and then gave the letter
and survey to residents willing to participate in the study. If individuals were unable to respond
to the survey immediately, the researchers left blank surveys and self-addressed, stamped
envelopes with potential respondents. If respondents chose to fill out the survey at the time of
administration, the researchers gave them privacy, but stayed on location to be available for
receipt of the survey. When the survey was completed, the researcher put the survey into a large
envelope to protect the identities of the respondents.
The above method was chosen in order to avoid residential door-to-door sampling, which
can be time-consuming and invasive. In addition, the investigators wanted to avoid mailing or
emailing the survey, which would likely have resulted in low return rates. The sampling took
place during the workday hours of October 23 through October 28, 2008. In addition to the
personal method of distributing surveys, a copy of the survey was published in the Tuesday
October 28, 2008 edition of the Coastland Times. The public was invited to cut out the printed
survey, fill it out, and mail it to the AEFS post office box in Manteo (Appendix E).
Instrumentation
The cover letter (Appendix B) and survey (Appendix C) were designed by the researchers
with assistance from the Odum Institute at the University of North Carolina at Chapel Hill and
professionals from the North Carolina Sea Grant office in Manteo. The purpose of the cover
letter was to assure potential respondents that the survey was voluntary and confidential. The
particular demographic questions were chosen because they could provide pertinent information
for policymakers and educators, while remaining as non-intrusive as possible. The survey was

AEFS 2008 23
constructed to determine respondents’ direct and indirect exposure to sea level rise, whether they
thought it was occurring or not, and their opinions on its causes, effects, and possible responses
to it. Certain survey questions were framed in the negative in order to encourage respondents to
read each question thoroughly, as well as to discourage habituation (repetitiveness in their
responses). For analytical purposes, the survey questions were divided into sections and labeled
according to a key included in the Appendix D.
Analysis
The first step in the analysis was the entry and organization of raw data in Microsoft
Excel. Some of the survey questions were answered with choices that were not offered in the
survey. For example, one respondent wrote “NS” (“not sure”) in response to the “check all that
apply” questions. In this particular instance, “NS” responses were considered no response. All
questions left blank, or considered left blank, were not included in the analysis.
The analysis of the data presented the demographics of the survey respondents. For
example, Figure 9 shows the percentage of male and female respondents. In addition,
comparisons between responses to individual demographic questions and responses to survey
questions were graphed. For example, Figure 10 compares the respondents’ levels of education
to responses to Question A3 about whether sea level rise is not occurring. On individual graphs,
each demographic question was plotted as the independent variable with the dependent variable
being one of a variety of survey questions. For example, responses to level of education (x-axis)
was not only compared to Question A3 (y-axis), but also to A2, A4, and A5. The specific
demographic categories used to compare various survey questions included education level, age,
town of residence, whether or not respondents have children, and whether or not their residence
is located on waterfront property. Instead of comparing all variables, the researchers chose to
compare the variables they found to be most pertinent to local policymakers.

AEFS 2008 24
Answers to the free response section were compiled, and the most relevant were used as
supportive evidence to some of the study’s conclusions. The analysis of the first free response
question, D1, included counting how many people answered “I don’t know,” or its equivalent,
out of those who responded to the question. In analysis of the free response questions, responses
were categorized by evidence cited. These categories included overwash, lost beaches, lost
houses, secondary sources (i.e. academics and the media), vegetation loss, stationary marks, and
road closures,
There were no statistical tests performed, such as calculation of Z-scores or confidence
intervals, because the sample was not random and could not be generalized. Many variables
were compared and relationships are represented in bar graphs and pie charts in the Results,
Chapter IV, of this report.
Validity and Reliability
Research professionals at the Odum Institute at the University of North Carolina at
Chapel Hill and North Carolina Sea Grant were consulted in the development of the survey. In
addition, a final draft of the survey was given to ten adult subjects before its formal
administration to see if the survey was clear, comprehensible, and error-free. The researchers
consider the survey to be valid because it was constructed with the help of knowledgeable
consultants and feedback from trial subjects.
Due to the lack of randomization in the sampling method, the study’s results could not be
generalized or analyzed for statistically significant differences or confidence intervals. However,
the survey did address the research question by collecting citizens’ written thoughts on sea level
rise. In determining the overall validity of this study, three types of validity were considered:
face, content, and construct.
Face validity, which is the likelihood that a question might be misunderstood, varies from

AEFS 2008 25
question to question. Though it was assumed that the demographic questions could not be
misinterpreted, some were. For example, one individual responded to the question, "What is your
town of residence?" by writing "Dare." Yet, Dare is a county, not a town on the Outer Banks.
While it appeared that there was nothing particularly confusing about this question, at least one
respondent did not fully understand the question. Therefore, it is possible that other questions
were answered inaccurately as well.
Based on the trial responses and some of the responses of formally surveyed individuals,
there may be a lack of validity in the first free-response question: "What do you believe the
current rate (in inches every ten years) of sea level rise is on the Outer Banks?" A particular
source of misinterpretation in this question was the difference between vertical and horizontal
sea level rise. The question did not explicitly state whether the rate should have been estimated
in vertical or horizontal inches, and there is general confusion about this difference. However,
the standard measurement of sea level rise is vertical distance. The researchers chose to
withhold any mention of vertical or horizontal measurements in the question so as to prevent
prompting or leading the respondents into using vertical distance if they were not going to
otherwise. As a result, this particular question has less face validity than the others.
Also, statement A3, "Sea level rise is not occurring on the Outer Banks," did not
distinguish between natural and accelerated rates of sea level rise. It was assumed that
respondents would indicate which type of sea level rise they were referring to by their answers to
Questions B1 through B6 about the causes of sea level rise. By itself, however, the statement,
"Sea level rise is not occurring on the Outer Banks" lacks validity because it could refer to many
different rates of sea level rise, each with different implications. According to the investigators,
professional consultants, and trial subjects' responses, all other questions possess face validity.
Content validity is used to assess adequate coverage of the topic being studied. Questions

AEFS 2008 26
A1 and A2 were meant to gather data about citizens' exposure to the topic. The responses to A2
were compared to the responses to D1 in order to analyze whether the subjects were actually
informed about sea level rise according to up-to-date scientific research. Question A3 gathered
data about whether citizens believe sea level rise is occurring or not. A4 followed with an
inquiry about whether more research is needed to decide whether the phenomenon is actually
occurring, and A10 measured the concern of subjects about the issue. Question A11, along with
C1 through C13, determined what citizens think about the potential effects of sea level rise.
Questions A5, A6, A7, A8, A9, and A12 were designed to cover possible responses to sea level
rise. The first free response question, D1, was presented to clarify what the public concept of sea
level rise might be. The second free response, D2, was included to determine the source of the
respondents’ perceptions. The purpose of the last question was to collect any personal thoughts
and experiences on the topic. The number of questions on the survey was kept to a minimum,
while still attempting to comprehensively assess the research question. Because of the examples
above, it is concluded that the survey possesses content validity.
Construct validity assesses the tool used to investigate the research question. There was
diversity in question structure. Multiple choice, "check all that apply," and free response
questions were all included in the survey to enhance the construct validity of the study. It was
assumed that the free response questions would best reflect the thoughts of the respondents.
However, many free response questions were left blank, and the majority of the others were
answered with the phrase, “I don’t know,” or its equivalent. Although it may seem that this
response reflects that the question was inadequate, the response actually provided valuable
insight into the lack of knowledge concerning sea level rise. The multiple choice questions were
inherently limited in scope and therefore could not perfectly reflect all subjects' responses.
However, it seems that these questions were an appropriate tool in investigating the research

AEFS 2008 27
question. None of the trial respondents, and only a few of the study respondents, replied to these
twelve questions with responses that were not offered by the multiple choices. Therefore, this
scale does seem to appropriately reflect respondents’ feelings. In addition, the two "check all
that apply" questions were limited in scale, but offered many choices for response, including
choices for "other" and "none of the above." Therefore, this section of questions possessed
construct validity as well.
The reliability of the study is relatively weak because of the survey administration
procedure. There was continuity of administration across all towns, but the exact locations and
times during which the researchers administered the surveys were not standardized. In general,
however, if the study were to be repeated, it seems likely that survey responses would be similar
to those collected in this study. To obtain consistent results, a repetition of this survey would
have to occur in a similar manner and during a similar time of year.
The conclusions of this study depend in part on the season during which it was
conducted: autumn, when most tourists have left the region. An additional instrument aimed at
measuring the same variables as this survey was not created. Therefore, the equivalent-form test
could not be used to measure reliability. Internal consistency could not be used as a method to
measure reliability because no two items on the survey attempted to measure the same variable.
Assumptions
Several fundamental assumptions were made in this study. It was assumed that
individuals responded to the survey with honesty. Also, it was assumed that the survey was
valid. Although the results could not be generalized, it is assumed that the study collected
individual perceptions about sea level rise.
Scope and Limitations
Both time and budget constraints limited the study. The researchers only had four

AEFS 2008 28
months to complete the study, including its design, implementation, and analysis. In addition,
the researchers were inexperienced in survey methodology and statistical analysis. However, all
procedures were thoroughly considered, and academic professionals and procedural reference
materials were frequently consulted.
The quality of research was limited by the constraints mentioned above. If time had
allowed, the sample size could have been larger and more randomized. Also, surveys could have
been administered in a variety of ways. Surveys could have been mailed to predetermined
residences or administered in predetermined public locations in each town. Mailing surveys to
private residences was not used due to budget constraints. Tabling, the administration of surveys
from one stationary location, was not used because of time constraints. Although each of these
methods might have produced a more random sample, the convenience sample method allowed
the researchers to reach a greater number of individuals per unit of time and effort.

AEFS 2008 29
Chapter IV - Results
In total, 240 respondents completed surveys, and 232 of these were included for analysis.
Of these, 11 were completed from the newspaper and mailed to researchers. Some surveys were
not included because they were completed by people who were not residents of either Roanoke
Island or the Outer Banks, and others were submitted after analysis had already occurred.
Descriptive statistics of the respondents’ surveys are summarized in this chapter, and all
corresponding tables showing raw data are included in Appendix F. All summary percentages
were taken as a percent of those who actually responded to each specific question, not as a
percentage of the total number of surveys returned.
Demographics of Respondents
The data describing the ages of respondents is summarized in Figure 1. Of the 227
respondents who provided their ages, the median age was between 41 and 50 years, with the
youngest respondents being 18 years old and the oldest being 85 years old. There was a range of
67 years among respondents. The age group “18-30” years was the most highly represented with
62 respondents.
Age of Respondents by Class
62
32
4953
25
4 20
10
20
30
40
50
60
70
18-30 31-40 41-50 51-60 61-70 71-80 80andover
Age Class
Nu
mb
er
of R
esp
on
den
ts
Figure 1. The number of respondents by age.

AEFS 2008 30
The data describing the income levels of respondents is contained in Figure 2. Of the 206
respondents who provided information, the median income was $25,000-$50,000. The fewest
number of respondents had incomes of $100,000 or more.
Income Levels by Class
45
7370
18
0
10
20
30
40
50
60
70
80
$0-$25,000 $25,000-$50,000
$50,000-$100,000
$100,000 orMore
Income Level
Nu
mb
er o
f R
esp
on
den
ts
Figure 2. The number of respondents by income level.
The education levels of respondents are shown in Figure 3. Two hundred twenty-three
respondents provided information about their education backgrounds. Approximately one-third
of respondents held a degree no higher than a high school degree or GED. Another 57% of
respondents held a higher education degree. Only one respondent had an education background
of “Less than High School.”

AEFS 2008 31
Figure 3. The percentage of respondents by level of education.
Data describing the occupation of respondents is displayed in Figure 4. Of the 228
respondents who provided information, approximately one-third stated that they worked in sales,
another 14% stated that they worked in a managerial position, and 10% stated that they were
retired.
Occupation
8%
2%
7%
14%
1%
6%
10%
31%
2%
3%2%
3%4%
1%Arts
Construction
Consulting
Engineering
Finance
Fishing
Health
Hospitality
Managerial
Odd
Public Services
Retired
Sales
Secretarial
Service
Student
Teaching
Other
Figure 4. The percentage of respondents by occupation.
Data describing the number of years respondents had lived on the Outer Banks is shown
in Figure 5. Of the 231 respondents who provided information about that variable, the median

AEFS 2008 32
amount of time was 10 to 20 years with the total timeframe ranging from 0.5 to 65 years. The
largest number of respondents had lived on the Outer Banks within the “0-10 years” timeframe,
with progressively fewer people in each successive timeframe.
Number of Years Lived on Outer Banks
87
52 49
1711
7
0
10
20
30
40
50
60
70
80
90
100
0-10 10.5-20.0
21.0-30.0
31.0-40.0
41.0-50.0
50.0 ormore
Number of Years Lived by Category
Nu
mb
er o
f R
esp
on
den
ts
Figure 5. The number of respondents by years lived on Outer Banks.
Data describing the resident status of respondents is summarized in Figure 6. Two
hundred twenty-four respondents provided information about their resident status, and almost all,
93%, were full-time residents.

AEFS 2008 33
Resident Status of Respondents
Full-time93%
Part-time4%
Unanswered3%
Full-time
Part-time
Unanswered
Figure 6. The percentage of respondents by resident status.
Data describing respondents’ towns of residence is summarized in Figure 7. Nearly one
fourth of respondents resided in Kill Devil Hills, and of the 15 towns represented, 3 towns (Kill
Devil Hills, Manteo, and Nags Head) comprised nearly half of the survey population.
Respondents' Towns of Residence
5%
9%
23%
5%
15%
10%
8%
2% 6%3% 2%
<1
6%
6%
<1
Avon
Buxton
Corolla
Frisco
Hatteras
Kill Devil Hills
Kitty Hawk
Manteo
Nags Head
Ocracoke
Poplar Branch
Salvo
Southern Shores
Wanchese
Waves
Figure 7. The percentage of respondents by towns of residence.

AEFS 2008 34
The data describing how many respondents did or did not have children is depicted in
Figure 8. Of the 228 respondents who stated whether or not they had children, slightly more
than half, 59%, had children.
Figure 8. The percentage of respondents with and without children.
Data describing the sexes of respondents is displayed in Figure 9. The number of male
and female respondents was fairly even, with a slightly higher percentage of females (53%) than
males (47%).
Sex of Respondents
Female53%
Male47%
Male
Female
Figure 9. The percentage of respondents by sex.

AEFS 2008 35
Respondents’ Perceptions of Sea Level Rise
Data comparing respondents’ opinions on whether sea level rise is not occurring (A3)
with their education levels is summarized in Figure 10. A slightly larger percentage of those
with a high school degree or GED than those with a higher education degree agreed that sea level
rise is not occurring. For each education level, the percentage of people disagreeing with the
idea that sea level rise is not occurring was between 60% and 80%, with the exception of “Less
than High School” (100%). In this figure, it is important to note that, as is shown in Table 1
(Appendix F), only one respondent had an education level in the “Less than High School”
category.
Responses to A3 by Education Level (Percentage)
020406080
100120
Less
tha
n
Hig
h S
choo
l
Hig
h S
choo
l
or G
ED
Tra
de
Sch
ool
Ass
ossi
ate'
s
Deg
ree
Bac
helo
r's
Deg
ree
Gra
duat
e
Deg
ree
Education Level
Res
ponse
Per
centa
ge
Agree
Disagree
Not Applicable
Not Sure
Figure 10. Education level versus responses to A3.
Data comparing whether or not respondents felt informed about sea level rise (A2) with
their education levels is shown in Figure 11. Again, it is important to note that, as is shown in
Table 2 (Appendix F), only one respondent had an education level of “Less than High School.”
In general, respondents with higher education levels appeared to feel more informed about sea
level rise. Other than “Less than High School” respondents, “Graduate Degree” respondents felt

AEFS 2008 36
the most informed (76%) and “Trade School” respondents felt the least informed (43%). The
“Trade School” respondents were also the most unsure (36%) about how informed they felt.
Responses to A2 by Education Level (Percentage)
0
20
40
60
80
100
120
Less thanHigh School
High Schoolor GED
Trade School Associate'sDegree
Bachelor'sDegree
GraduateDegree
Education Level
Res
po
nse
Per
cen
tag
e
Agree
Disagree
Not Sure
Not Applicable
Figure 11. Education level versus responses to A2.
Data comparing whether respondents would not consider sea level rise when making
investments and choices for the future (A5) with their education levels is shown in Figure 12. A
slightly smaller percentage of respondents with trade school or graduate levels of education than
those with other levels of education agreed that they would not consider sea level rise. Most
respondents across categories seemed to disagree with the statement. Again, “Less than High
School” had only one respondent.
Responses to A5 by Education Level (Percentage)
0
20
40
60
80
100
120
Less thanHigh
School
HighSchool or
GED
TradeSchool
Associate'sDegree
Bachelor'sDegree
GraduateDegree
Education Level
Res
po
nse
Per
cen
tag
e
Agree
Disagree
Not Applicable
Not Sure
Figure 12. Education level versus responses to A5.

AEFS 2008 37
Whether or not respondents thought more research is needed to determine whether sea
level rise was occurring (A4) is compared to their education backgrounds in Figure 13. With the
exception of respondents with bachelor’s degrees, as education level increased, the percentage
disagreeing increased. However, the plurality of every education level agreed with the
statement, “More research is needed to determine whether sea level rise is occurring.”
Response to A4 by Education Level (Percentage)
0
2040
60
80100
120
Less
tha
nH
igh
Sch
ool
Hig
hS
choo
l or
GE
D
Tra
deS
choo
l
Ass
ocia
te's
Deg
ree
Bac
helo
r'sD
egre
e
Gra
duat
eD
egre
e
Education Level
Res
po
nse
Per
cen
tag
e
Agree
Disagree
Not Applicable
Not Sure
Figure 13. Education level versus responses to A4.
Data comparing whether or not respondents had heard of sea level rise (A1) with their
ages is summarized in Figure 14. It is important to note that, as is shown in Table 5 (Appendix
F), a small number of respondents were between the ages of 71 to 90 (6). The largest percentage
of respondents who had not heard of sea level rise was in the “61 to 70” age category. A large
majority of every group had heard of sea level rise, with the highest percentage occurring among
the “51 to 60” age group (94%).

AEFS 2008 38
Responses to A1 by Age (Percentage)
0
20
40
60
80
100
120
18 to 30 31 to 40 41 to 50 51 to 60 61 to 70 71 to 80 81 to 90
Age
Res
po
nse
Per
cen
t
Agree
Diagree
Not Sure
Not Applicable
Figure 14. Age versus responses to A1.
Data comparing respondents’ opinions on whether sea level rise was not occurring (A3)
with their ages is summarized in Figure 15. The majority of respondents in all age groups
disagreed that sea level rise was not occurring. Also, approximately 20% of all age groups, with
the exception of the “81 to 90” age group, were not sure whether sea level rise was occurring.
Responses to A3 by Age (Percentage)
0
20
40
60
80
100
120
18 to 30 31 to 40 41 to 50 51 to 60 61 to 70 71 to 80 81 to 90
Age
Res
po
nse
Per
cen
tag
e
Agree
Disagree
Not Sure
Not Applicable
Figure 15. Age versus responses to A3.

AEFS 2008 39
Data comparing whether respondents considered themselves informed about sea level rise
(A2) with their ages is displayed in Figure 16. Excluding respondents ages 71 to 90, the largest
percentage of respondents who considered themselves informed were between the ages of 51 and
60. This age bracket also had the smallest percentage of those disagreeing and not sure.
Responses to A2 by Age (Percentage)
0
20
40
60
80
100
120
18 to 30 31 to 40 41 to 50 51 to 60 61 to 70 71 to 80 81 to 90
Age
Res
po
nse
Per
cen
tag
e
Agree
Diagree
Not Sure
Not Applicable
Figure 16. Age versus responses to A2.
Data comparing whether respondents were concerned about sea level rise (A10) with
their ages is depicted in Figure 17. The largest percentage of respondents disagreeing with
question A10 was in the “61 to 70” year age bracket (38%). In groups with more than five
respondents, the lowest percentage disagreeing was in the 18 to 30 age group (6%).

AEFS 2008 40
Responses to A10 by Age (Percentage)
0
20
40
60
80
100
120
18 to 30 31 to 40 41 to 50 51 to 60 61 to 70 71 to 80 81 to 90
Age
Res
po
nse
Per
cen
tag
eAgree
Disagree
Not Sure
Not Applicable
Figure 17. Age versus responses to A10.
Data comparing whether respondents thought sea level rise was not occurring (A3) with
their towns of residence is summarized in Figure 18. Excluding Corolla and Poplar Branch,
which only had one respondent, every town except Avon had more than 60% of respondents
disagreeing that sea level rise is not occurring.
Responses to A3 by Town (Percentage)
020406080
100120
Avon
Buxto
n
Coroll
a
Frisco
Hatte
ras
Kill Dev
il Hills
Kitty H
awk
Man
teo
Nags
Head
Ocrac
oke
Popla
r Bra
nch
South
ern
Shore
s
Wan
ches
e
Wav
es
Town
Pe
rce
nta
ge Agree
Disagree
Not Applicable
Not Sure
Figure 18. Town of residence versus responses to A3.
Data comparing whether or not respondents considered themselves informed about sea
level rise (A2) with their towns of residence is shown in Figure 19. For Kill Devil Hills, the

AEFS 2008 41
number of respondents who were either unsure or did not consider themselves informed was
nearly equal to the number of respondents who felt they were informed.
Responses to A2 by Town (Raw Number)
0
5
10
15
20
25
30
Avon
Buxto
n
Corolla
Frisco
Hattera
s
Kill Devil
Hills
Kitty H
awk
Man
teo
Nags H
ead
Ocrac
oke
Poplar
Bra
nch
Salvo
South
ern
Shore
s
Wanc
hese
Wave
s
Town
Res
po
nse
Nu
mb
er
Agree
Disagree
Not Sure
Not Applicable
Figure 19. Town of residence versus responses to A2.
Data summarizing whether respondents were concerned about sea level rise (A10) with
their towns of residence is shown in Figure 20. Excluding towns with very few respondents
(Corolla, Waves and Poplar Branch) Kitty Hawk and Manteo had the highest percentages of
respondents who were concerned about sea level rise. Avon, Frisco, and Southern Shores had
the lowest percentages of respondents who were concerned about sea level rise.

AEFS 2008 42
Responses to A10 by Town (Percentage)
0
2040
60
80100
120
Avon
Buxto
n
Coroll
a
Frisco
Hatte
ras
Kill Dev
il Hills
Kitty H
awk
Man
teo
Nags
Head
Ocrac
oke
Popla
r Bra
nch
South
ern
Shore
s
Wan
ches
e
Wav
es
Salvo
Town
Re
spo
ns
e P
erc
en
tag
e
Agree
Disagree
Not Applicable
Not Sure
Figure 20. Town of residence versus responses to A10.
Data comparing whether respondents felt government should consider sea level rise when
making decisions (A6) with their towns of residence, is displayed in Figure 21. Excluding
Corolla and Poplar Branch, each of which only had one respondent, all towns had more than
60% of respondents agreeing that governments should consider sea level rise when making
decisions.
Responses to A6 by Town (Percentage)
020406080
100120
Avon
Buxto
n
Coroll
a
Frisco
Hatte
ras
Kill Dev
il Hills
Kitty H
awk
Man
teo
Nags H
ead
Ocrac
oke
Poplar
Bra
nch
South
ern
Shore
s
Wan
ches
e
Wav
esSalv
o
Town
Re
sp
on
se
Pe
rce
nta
ge
Agree
Disagree
Not Applicable
Not Sure
Figure 21. Town of residence versus responses to A6.
Data comparing whether respondents thought immediate action should be taken to
address the effects of sea level rise (A12) with their towns of residence is summarized in Figure

AEFS 2008 43
22. Excluding Corolla, where there was only one respondent, Frisco was the only town in which
less than 50% of respondents agreed that immediate action should be taken.
Responses to A12 by Town (Percentage)
020406080
100120
Avon
Buxto
n
Coroll
a
Frisco
Hatte
ras
Kill Dev
il Hills
Kitty H
awk
Man
teo
Nags
Head
Ocrac
oke
Popla
r Bra
nch
South
ern
Shore
s
Wan
ches
e
Wav
es
Salvo
Town
Re
sp
on
se
Pe
rce
nta
ge
Agree
Disagree
Not Applicable
Not Sure
Figure 22. Town of residence versus responses to A12.
Data summarizing whether respondents with or without children were concerned about
sea level rise (A10) is shown in Figure 23. Only a slightly larger percentage of respondents with
no children, than those with children, were concerned about sea level rise.
Responses to A10 for respondents with and without children
0102030405060708090
100
Agree Disagree Not sure Not applicable
Pe
rce
nt
No children
Children
Figure 23. Those with and without children versus responses to A10.
Data comparing the perceptions of respondents with and without children regarding the
effects of sea level rise on themselves (C1) and future generations (C2) is summarized in Figure

AEFS 2008 44
24. A higher percentage of respondents with children, versus those without, thought that sea
level rise would affect both themselves and future generations.
Figure 24. Perceptions of respondents with and without children regarding the effects of sea
level rise.
Data summarizing whether respondents with and without children would consider sea
level rise when making investments and choices for the future (A5) is shown in Figure 25. There
appears to be little relationship between these two variables. Close to 20% of those both with
and without children agreed with the statement “I will not consider sea level rise when making
investments and choices for the future.”
Responses to A5 for people with and without children
0102030405060708090
100
Agree Disagree Not sure Not applicable
Pe
rce
nt
No children
Children
Figure 25. Those with and without children versus responses to A5.
Responses to C1 and C2 for those with and without children
010
2030
4050
6070
8090
100
Me Future generations
Per
cen
t
No children Children

AEFS 2008 45
Data summarizing whether those with and without children thought the government
should consider sea level rise when making decisions, including those regarding development of
the Outer Banks (A6), is shown in Figure 26. A slightly higher percentage of respondents
without children, than those with children, thought that government should consider sea level
rise when making decisions.
Responses to A6 for respondents with and without children
0102030405060708090
100
Agree Disagree Not sure Not applicable
Pe
rce
nt
No children
Children
Figure 26. Those with and without children versus responses to A6.
Data summarizing whether renters and owners were concerned about sea level rise (A10)
is shown in Figure 27. Only a slightly larger percentage of renters than owners responded that
they were concerned about sea level rise. About 10% of both renters and owners responded that
they were “not sure.”

AEFS 2008 46
Responses to A10 for owners and renters
0
10
20
30
40
50
60
70
80
Agree Disagree Not Applicable Not Sure
Response
Per
cen
t
Own
Rent
Figure 27. Ownership versus responses to A10.
Data summarizing whether renters and owners thought sea level rise would affect their
houses (C3) and property values (C7) is shown in Figure 28. A higher percentage of renters than
owners thought that sea level rise would affect both their houses and property values.
Figure 28. Ownership versus responses to C3 and C7.
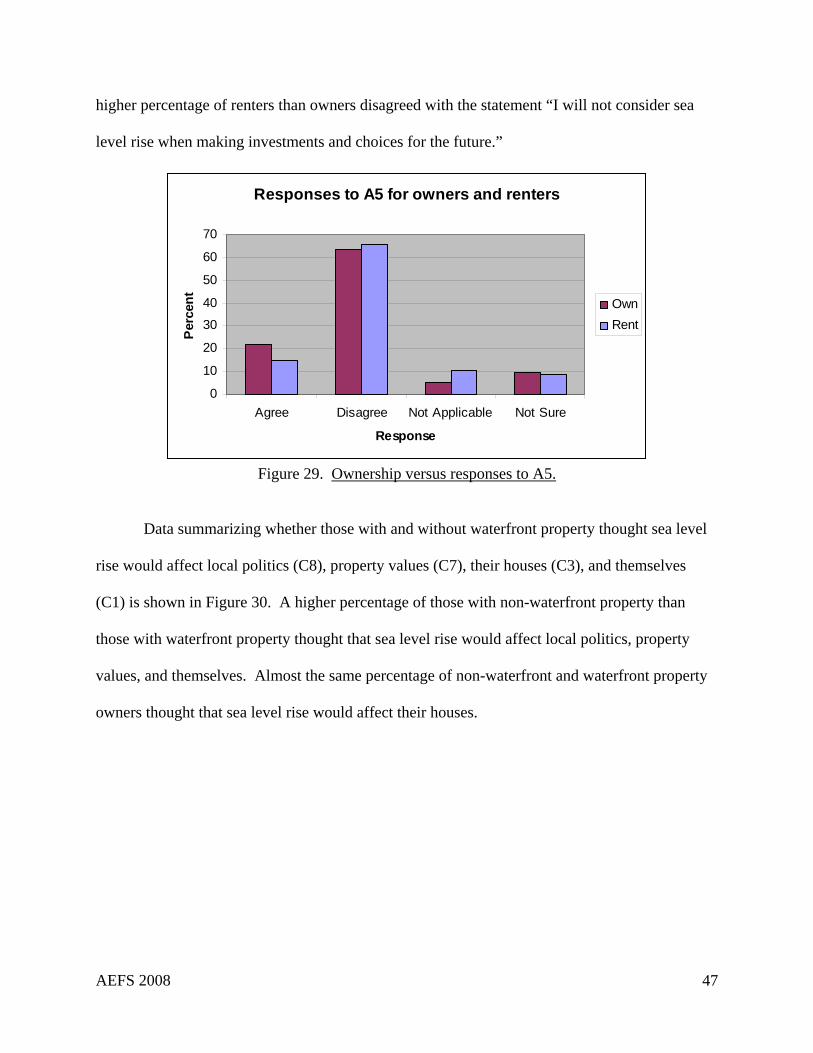
Data summarizing whether renters and owners would consider sea level rise when
making investments and choices for the future (A5) is shown in Figure 29. Only a slightly
Responses to C3 and C7 for renters and owners
0
10
20
30
40
50
60
70
80
90
100
My house Property values
Per
cen
t
Owners Renters
AEFS 2008 47
higher percentage of renters than owners disagreed with the statement “I will not consider sea
level rise when making investments and choices for the future.”
Responses to A5 for owners and renters
0
10
20
30
40
50
60
70
Agree Disagree Not Applicable Not Sure
Response
Per
cen
t
Own
Rent
Figure 29. Ownership versus responses to A5.
Data summarizing whether those with and without waterfront property thought sea level
rise would affect local politics (C8), property values (C7), their houses (C3), and themselves
(C1) is shown in Figure 30. A higher percentage of those with non-waterfront property than
those with waterfront property thought that sea level rise would affect local politics, property
values, and themselves. Almost the same percentage of non-waterfront and waterfront property
owners thought that sea level rise would affect their houses.

AEFS 2008 48
Responses to C1, C3, C7, and C8 for waterfront and non-waterfront property owners
0102030405060708090
100
Me My house Propertyvalues
Localpolitics
Pe
rce
nt
Non-waterfront owners
Waterfront owners
Figure 30. Property type versus responses to C1, C3, C7, and C8.
Data summarizing respondents’ answers to A1-A12 is displayed in Tables 22, 23, and 24
which are included in the Appendix F.
Data summarizing if respondents thought sea level rise was not occurring (A3) is shown
in Figure 31. The majority of respondents, 70%, disagreed that sea level rise was not occurring,
and 20% of respondents replied that they were not sure.

AEFS 2008 49
Figure 31. Responses to A3 by percentage.
Data summarizing if respondents considered themselves informed about sea level rise
(A2) is shown in Figure 32. The majority of respondents, 58%, considered themselves informed
about sea level rise while only 21% of respondents did not feel informed.
Responses to A2 (Percentage)
Agree58%
Disagree21%
Not Applicable3%
Not Sure18%
Agree
Disagree
Not Applicable
Not Sure
Figure 32. Responses to A2 by percentage.
Responses to A3 (Percentage)
Agree9%
Disagree70%
Not Applicable1%
Not Sure20%
AgreeDisagree Not ApplicableNot Sure

AEFS 2008 50
Data summarizing if respondents were concerned about sea level rise (A10) is shown in
Figure 33. The majority of respondents, 72%, stated that they were concerned (“Agree”) while
only 16% responded that they were not concerned (“Disagree”).
Response to A10 (Percentage)
Agree72%
Disagree16%
Not Applicable2%
Not Sure10%
Agree
Disagree
Not Applicable
Not Sure
Figure 33. Responses to A10 by percentage.
Data summarizing if respondents thought the government should consider sea level rise
when making decisions, including those regarding development of the Outer Banks, is shown in
Figure 34. A large majority, 84% of respondents, agreed that the government should consider
sea level rise when making decisions.

AEFS 2008 51
Responses to A6 (Percentage)
Agree84%
Disagree8%
Not Applicable0%
Not Sure8%
Agree
Disagree
Not Applicable
Not Sure
Figure 34. Responses to A6 by percentage.
Data summarizing what respondents believed the causes of sea level rise to be is
summarized in Figure 35. The cause indicated by the largest percentage, 82%, of respondents
was natural climate change. Man-made climate change was also noted by 70% of respondents.
Responses to B1-B6
0102030405060708090
100
Man-madeclimatechange
Naturalclimatechange
God Othernatural
processes
Other None of theabove
Cause
Per
cen
t
Figure 35. Responses to B1-B6 by percentage.

AEFS 2008 52
Data summarizing what respondents thought the current rate of sea level rise was on the
Outer Banks (D1) is shown in Figure 36. Forty-four percent of respondents stated that they
didn’t know what the current rate was, and 56% provided a quantitative estimate as to what they
thought the current rate of sea level rise was on the Outer Banks.
Response to D1 (Percentage)
Don't Know44%Response
Given56%
Don't Know
Response Given
Figure 36. Responses to D1 by percentage.
Data summarizing evidence of sea level rise cited by respondents is shown in Figure 37.
Of the 191 respondents who cited evidence, loss of beach area was cited as evidence of sea level
rise by 29% of respondents, and 19% of respondents cited some secondary source of information
(e.g. magazines, television news) as evidence of sea level rise.

AEFS 2008 53
Evidence of Sea Level Rise Cited in Free Response Section (Percentage)
0%5%
10%15%20%25%30%35%
Lo
stB
ea
che
s
Lo
stH
ou
ses
Lig
hth
ou
se
Ro
ad
Clo
sure
Ove
rwa
sh
Sta
tion
ary
Ma
rks
Se
con
da
ryS
ou
rce
s
Ve
ge
tatio
nL
oss
Evidence Cited
Pe
rce
nta
ge
Figure 37. Cited evidence of sea level rise.

AEFS 2008 54
Chapter V- Conclusions
Introduction
By pinpointing and analyzing trends and correlations within the data, we have attempted
to determine some of the underlying sources of the perceptions of sea level rise held by residents
of the Outer Banks. In so doing, we can note the perceptions and concerns of Outer Banks
citizens, and policies that might be needed or in need of change. From these conclusions, we can
make specific recommendations so that local citizens, governments, and non-profit groups might
make informed decisions regarding education, policy-making, and how to approach and plan
with specific populations to enact sensible change.
Of the 232 respondents, 69% believed sea level rise is occurring. This does not mean that
nearly 30% of residents do not believe that sea levels are rising, because 20% reported that they
were unsure about whether or not the phenomenon is occurring. With respect to the principal
causes of sea level rise, 82% attributed it to natural climate change, 70.0% to anthropogenic
climate change, 46% to other natural processes, and 20% to God. It is important to note that
respondents had the option to report more than one of these as a cause of sea level rise, and many
did. This data implies that there may be some misconceptions about what is causing sea level
rise, given that a slightly higher percentage of those surveyed believed that natural climate
change, rather than anything of anthropogenic origin, was the principal cause. Additionally,
nearly half of respondents answered that the sea level is rising as a result of other natural
processes, such as storm surges. Interestingly, 53% felt that more research is needed to
determine whether or not sea level is rising. Of all residents surveyed, 59% considered
themselves informed about sea level rise, 72% are concerned about the dangers it poses, and
83% will take it into account when making decisions in the future. Clearly, a large majority of
the sample population believes that sea level rise is occurring and that it poses a threat to the

AEFS 2008 55
Outer Banks of North Carolina. Of the respondents, 84% felt that their government should
consider sea level rise when making decisions for the future. This data suggests that sea level
rise is a point of some concern for the public, and local governments ought to take it into account
when implementing long-term policy decisions.
Correlations were drawn between residents’ perceptions and: 1) their highest levels of
education; 2) their ages; 3) whether or not they have children; 4) their towns of residence; 5)
whether or not they rent or own their property; and 6) whether or not they live on waterfront
property. Correlations drawn from the data may prove useful in addressing problems specific to
each demographic.
Due to the small sample size, and the lack of randomization, conclusions drawn may not
reflect the perceptions of all residents of the Outer Banks, and may not apply to regions outside
the sample area. However, the correlations are strong enough to be relevant to Outer Banks
communities and policymakers, particularly solutions are tailored to address the concerns of
specific demographics. In addition to providing information that will guide policymakers, this
study may also suggest areas where more research is needed.
Education
One of the goals of this study was to determine if there is a correlation between
respondents’ education and their perceptions of sea level rise. Our analysis found correlations
between education levels and perceptions of sea level rise as a risk. Residents with higher levels
of formal education typically had a better understanding of sea level rise and its threats. The data
suggests that educational efforts should focus on residents whose highest level of completed
education is high school or GED.
Many respondents reported that there is “too little data available” to come to a conclusion
about the rate, or even the existence, of sea level rise. One respondent, when asked what she

AEFS 2008 56
believed the rate of sea level rise to be, wrote “I really have no idea since this is not talked
about.” Another wrote, “I need to be more informed on this subject to make any conclusion."
These comments suggest that available data and statistics have not been presented effectively, or
perhaps not presented at all, to many Outer Banks residents.
The survey responses indicate that there is a correlation between a higher level of
education and the likelihood of belief in sea level rise. When asked whether or not sea level rise
was occurring, 15% of respondents whose highest level of education was high school or a GED
believed that it was not. Only 9% of respondents with a bachelor’s degree, and none of the
respondents with a graduate degree felt that sea levels were not rising. Responses as to whether
or not those surveyed considered themselves informed about sea level rise followed the same
trend: 65 to 76% of those with bachelor’s or graduate degrees reported feeling adequately
informed, compared to 43 to 50% of those with a trade degree, associate’s degree, high school
education or GED. Following this same trend, those with a high school education or GED were
the least likely to consider sea level rise when making investments for the future. This could be
due to a lack of education regarding the risk of rising sea levels.
The data obtained from the survey consistently shows that respondents whose highest
completed level of education is high school or GED equivalent responded more frequently that
sea level rise is not occurring and not a cause for concern. This group also feels the least
informed about current research regarding this phenomenon. Conversely, respondents with a
bachelor’s or graduate degree more frequently indicated that they felt informed and believe that
the sea level is both rising and poses a potential threat. From these results, it can be inferred that
a higher level of education confers a greater access to and, perhaps, a stronger understanding of
the research regarding the phenomenon in question. This provides residents with the information
needed to determine whether or not sea level rise is occurring.

AEFS 2008 57
Considering that those with high school or a GED as their highest level of education
showed a more profound lack of understanding concerning sea level rise, a concerted effort
should be made to give adolescent residents of the Outer Banks more information about sea level
rise in a manner that is timely, accessible, and comprehensive. This could be an effort mounted
by local governments throughout the Outer Banks. High school curricula that incorporate
current climate data and research should be developed and implemented. Municipal
governments may want to hold public forums, town hall meetings, or host a series of talks that
cover the mechanisms, rates and risks of sea level rise to the Outer Banks region. With the
information offered in this report, Outer Banks policymakers could target specific demographics.
For example, those with a high school education or GED could be offered specific educational
programs about policies intended to mitigate potential damages and economic loss that may
occur as a result of sea level rise.
Age
When analyzing study responses, a few correlations were found between age and
perceptions about sea level rise. It should be noted that nearly 88% of all respondents had heard
of sea level rise. Most respondents who had not heard of sea level rise were between 61 and 70
years old. This age group made up less than 8% of the those surveyed. This indicates that
regardless of whether citizens of the Outer Banks feel informed about and aware of sea level rise,
most have at least heard of the idea.
Respondents between the ages of 51 and 60 were the most likely to have heard of sea
level rise, with 94.1% of the respondents agreeing that they "had heard of sea level rise."
Interestingly, respondents from this age group were also the most likely to believe sea level rise
was not occurring. Almost 12% of respondents between the ages of 51 and 60 believed sea level
rise was not occurring. This could be a result of the mainstream media popularizing the term

AEFS 2008 58
"sea level rise" but not necessarily connecting the idea with any reliable data. For example,
surveys often showed that residents were confusing a rise in the vertical level of the sea with a
horizontal rise in the mean high tide line. When asked to estimate the rate of sea level rise, one
resident of Nags Head responded “48 inches every ten years.” This same respondent also
indicated that sea level rise would not affect his house, his job, agriculture, or local politics. This
individual is most likely confusing vertical sea level rise and the horizontal rise of the tide line.
If the sea level were rising 48 inches every ten years, Manteo, Rodanthe, Salvo, Wanchese, and
Waves would all be under water in 8.2 years.
In addition, 75% of the 51 to 60 age group felt they were informed about sea level rise,
suggesting that there is a lack of accurate information about the issue. Connecting accurate
information with the term itself is vital in order to ensure that citizens have not only heard of sea
level rise, but that they are using reliable information rather than hearsay for decision-making
purposes. Another problem suggested by the data is that accurate information on sea level rise is
available but not reaching certain age groups. This may be the result of media outlets focusing
primarily on younger generations when communicating information about sea level rise.
The group of respondents between the ages of 61 and 70 reported being the least
concerned about sea level rise, while the respondents between the ages of 18 and 30 reported
being the most concerned about sea level rise. Seventy-seven percent of respondents in the
youngest bracket, those between the ages of 18 and 30, felt concerned about sea level rise and
only 6% were not concerned. Given that the effects of sea level rise likely won’t be felt for some
time, it is understandable that younger respondents indicated higher levels of concern. It is
important that government and civic leaders take into account the concerns of younger
generations when considering plans to address sea level rise.

AEFS 2008 59
Townships
In reviewing the results of this study, it was found that there was not a strong correlation
between residents’ awareness of sea level rise and what they thought government responses to
sea level rise should be. However, there were several trends that showed varying degrees of
concern among residents from particular municipalities. We will highlight four Outer Banks
towns that respectively showed correlations between: 1) their residents’ belief that the sea level
was rising; 2) the degree to which residents felt informed about sea level rise; and 3) residents’
belief that government, local, state, or federal, should take sea level rise into consideration when
forming policy and making decisions.
Starting with the town of Kitty Hawk, NC, it was found that 72% of the residents
believed that sea level rise was occurring on the Outer Banks. It was also found that only 27% of
that same population felt informed about sea level rise, indicating there to be a significant
number of respondents who felt that the sea level was rising, but did not feel educated about its
causes or implications. Furthermore, a majority of Kitty Hawk residents (91%) responded that
they felt government should consider sea level rise when making decisions regarding
development of the Outer Banks. The difference between this percentage and the percentage of
residents who believe sea level rise is occurring is likely accounted for by residents who are
unsure, not those who believe that it is not occurring.
A similar situation was found in the town of Kill Devil Hills, NC. Here, 73% of
responding residents indicated that they believed sea level rise was occurring. In addition, half
of the respondents of the sample population felt that they were not informed about exactly what
sea level rise is. Kill Devil Hills residents also felt that government should be concerned with

AEFS 2008 60
sea level rise, with 81% of the respondents noting that they felt their government should consider
sea level rise when making decisions.
Two Outer Banks towns showed contrasting responses with a relatively low percentage
of residents who believed that sea level rise was occurring and high percentages of respondents
reporting that they felt informed about sea level rise. In the town of Avon, 35% of respondents
indicated that they felt sea level rise was occurring. However, 83% of the respondents felt that
they were informed about sea level rise. Similarly, 57.1% of respondents in Hatteras Village
reported that they believed sea level is rising, and 79% of respondents felt informed about sea
level rise. These values suggest that residents in these towns felt they were aware of sea level
rise and felt educated about it. However, the responses from these two towns regarding
government action on sea level rise offer a curious twist. Respondents from Avon reported that
73% felt the government should consider sea level rise when making decisions, and 71% of
residents from Hatteras Village felt the same way. The large percentages of respondents who
thought government should be concerned with sea level rise are inconsistent with the low
percentages of residents who believe it is occurring. This could be seen as an indication that
residents of this area are actually more concerned about how sea level rise will be handled in the
future rather than how it is currently affecting them. Also affecting this inconsistency is the
large number of “not sure” responses to whether sea level rise was occurring in these towns.
This, coupled with the percentage of respondents in favor of government response to sea level
rise could show a public desire for government research and education.
Ownership Status
According to the results of this survey, there appears to be little correlation between
respondents’ ownership status and their concern about rising sea levels. A higher percentage of
renters, 74%, than property owners, 69%, were concerned about sea level rise. When

AEFS 2008 61
respondents were asked if they thought sea level rise would affect their homes, 48% of renters
and 40% of owners indicated it would. When respondents were asked if they thought sea level
rise would affect overall property values, 85% of renters and 72% of owners indicated it would.
In general, renters are more concerned about sea level rise than owners, and a greater percentage
of renters than owners also felt that sea level rise would affect their homes and overall property
values. When respondents were asked if they would consider sea level rise when making
investments and choices for the future, the majority of them indicated that they would. Only
22% of property owners and 15% of renters indicated that they would not take sea level rise into
account when making future investments and decisions.
It is reasonable to assume that property owners would be more concerned about sea level
rise than those who rent because they have significant financial investments in land and housing
that will potentially be affected if sea level rise occurs. However, the results of this study do not
support this reasoning as a higher percentage of renters indicated that they were concerned about
sea level rise. It is worth noting that even though the majority of property owners expressed
concern about sea level rise, nearly a third of that demographic indicated that they would not
consider sea level rise when making future investment decisions. Perhaps this is due to the fact
that respondents who already own property are not considering making a future investment in
another property and feel as though their other investment choices will not be impacted by sea
level rise. Perhaps a similar circumstance is affecting the response of renters. While the
majority of renters also felt concerned about sea level rise, approximately 15% of those renters
indicated that they would not take sea level rise into consideration when making future
investments. Perhaps those individuals who are currently renting might not intend to purchase
property in the future and feel as though any other investments they might make will not be

AEFS 2008 62
influenced by sea level rise. Further studies should be conducted to determine the source of what
appears to be an inconsistency.
No correlation was found in this study between respondents’ concerns and whether or not
they lived on water front property. Forty-four percent of both waterfront property owners and
non-waterfront property owners indicated that they felt their house would be affected by sea
level rise. A slightly higher percentage of non-waterfront property owners than waterfront
property owners indicated that sea level rise would affect local politics, property values, and
themselves. It is interesting to note that there is virtually no difference between the perceptions
of waterfront property owners and non-waterfront property owners. Because of their proximity
to the water, it would be expected that waterfront property owners would express greater concern
regarding sea level rise. However, the data does not support this hypothesis, and the results
could be because of the general low lying nature of the entire Outer Banks.
Recommendations
North Carolina is beginning to realize that it needs a strategic plan to deal with rising sea
levels. If scientific projections regarding sea level rise occur as anticipated, North Carolina will
be one of the first states to be impacted, and one of the first states to be looked to for sound
planning and response options. North Carolina has begun looking into possible solutions ranging
from the technical to the biological. The state Coastal Zone Management subgroup has
developed an adaptation plan based on a report by the Intergovernmental Panel on Climate
Change (IPCC). Recently, several coastal towns participated in public listening sessions hosted
by The Albemarle-Pamlico National Estuary Program and The Albemarle-Pamlico Conservation
and Communities Collaborative, which focused on informing the general public about the
projections and effects of sea level rise. However, based on other states’ actions, North Carolina
is considerably behind. Maryland and Rhode Island have both adopted extensive sea level rise
AEFS 2008 63
action and adaptation plans. Both of these plans outline the current status of the states’
vulnerability to sea level rise, physical and structural response planning, and educational
initiatives to inform the public. Research and development of these and similar plans would be
an intelligent investment for the government of North Carolina. A set of sea level rise response
options should be made available as a resource for the state’s many coastal areas that could be at
risk from the effects of sea level rise. Based on the results of this study, an in-depth government
action plan that includes a strong education component would benefit Outer Banks communities.
The most effective and necessary component of addressing resident awareness of sea
level rise may be incorporating accurate and up-to-date scientific data into high school curricula.
However, local leaders could also address education on a community-wide basis by creating
outreach programs that target all ages, as Frederic O. Sargent outlines in his book Rural
Environmental Planning for Sustainable Communities (1991). Possible forms of outreach
include community workshops, storefront drop-in interviews, storytelling sessions, youth
activities, elected official receptions, and radio call-in shows. Several of these methods are
expounded upon in an article published in Practicing Planner by Al Zelinka, Susan Harden, and
Suzanne Rynne (2008), all members of the American Institute of Certified Planners. A
community workshop gathers all interested residents to learn about and discuss a particular issue.
A workshop geared towards providing education on sea level rise may include interactive
exercises that are not only informative, but which also encourage feedback, allowing citizens to
express pertinent thoughts and concerns. Zelinka et. al. suggest that storefront or residence drop-
in interviews allow local leaders to engage with business owners or residents who may be
unwilling to share their concerns in front of a larger group or simply cannot attend meetings due
to a busy schedule. When introducing sea level-related policy to towns on the Outer Banks, it
may be beneficial to foster a “storytelling” forum, where community members exchange stories

AEFS 2008 64
regarding their personal experiences of sea level change, allowing residents to learn from one
another’s experiences. In addition, youth involvement in local government and planning
processes is often undervalued. Targeting educational sessions toward youth will ensure
awareness of sea level rise at a younger age. Hosting receptions with elected officials would also
be a strategic way of addressing local awareness of sea level rise. Receptions will foster
communication between civic leaders, property owners, and key stakeholders and will hopefully
lead to the creation of more inclusive, comprehensive policies. Developing policies that consider
sea level rise should begin with community awareness. The above strategies offer local
government leaders an adaptable approach to educating the general public of the Outer Banks
about sea level rise and to receiving input on citizens’ concerns.
Regardless of how much education residents have received on the issue of sea level rise,
it appears that the majority of respondents would encourage local government leaders to address
sea level rise. More residents were concerned about the effects of sea level rise than felt well
informed about the issue. Residents are worried about the future of the Outer Banks, an area
where they have invested a great deal. Such concerns should be addressed by local leaders and
policymakers. When asked to estimate the rate of sea level rise, a resident of Kitty Hawk wrote,
"I really have no idea since this is not talked about nor is it on the top of any list." This
demonstrates the need for government leaders to give significant attention to this issue.
When comparing levels of education with perceptions of sea level rise, respondents with
a high school diploma or GED reported not being as concerned about sea level rise, but also
reported feeling uninformed. This trend reinforces the view that there is a great need for
educational outreach on the topic of sea level rise. When looking at individual townships, there
are notable gaps between the high percentage of citizens who felt sea level rise was occurring
and the low percentage of citizens who felt informed on the issue. When assessing correlations

AEFS 2008 65
between respondents' ages and their perceptions of sea level rise, notable variations were found
in the degree to which different age groups felt informed.
It will be important for local leaders to design educational outreach strategies that reach
all age groups. We hope that specific concerns have been identified toward which policymakers
and local leaders will focus their actions in order to improve awareness of sea level rise. With
the vast majority of respondents indicating a need for government involvement, we see this as a
definitive public call for action for local governments to develop plans that will help towns to
mitigate and adapt to sea level rise. Such plans have already been developed in areas of
Maryland and Rhode Island, as previously mentioned. Overall, we hope to inspire the creation
of future policies to address the vital issue of sea level rise in this magnificent area of the state.

AEFS 2008 66
References
Appalachian State University. “North Carolina Coastal Economy Vulnerable to Sea Level Rise.” 2007. Science Daily. <http://www.sciencedaily.com/releases>.
Beckley et al. “A reassessment of global and regional mean sea level trends from TOPEX and
Jason-1 altimetry based on revised reference frame and orbits.” Geophysical Research Letters, 34 (2007): 1-5.
Bernstein, Lenny, et. al. “Climate Change 2007: Synthesis Report.” Intergovernmental Panel on
Climate Change, 1993: 1-8. Bindoff, N., et al. “Oceanic Climate Change and Sea Level.” IPCC Assessment Report, 4
(2006): 389-420. Bridgham, Scott D., Carol A. Johnston, John Pastor, and Karen Updegraff. “Potential Feedbacks
of Northern Wetlands on Climate Change.” BioScience 45.4 (1995): 262-274. Bowman, Gant, David Campbell, Gray Jernigan, Ian King, Meredith Morgan, and Dylan
Sandler. “A Handbook for Sustainability: The Bowsertown Reclamation Project.” Albemarle Ecological Field Site Capstone Report, 2007.
Burby, Raymond J., and Arthur C. Nelson. “Local government and public adaptation to sea-
level rise.” Journal of Urban Planning and Development 117.4 (1991): 140-153. Cabanes et al. “Sea Level Rise During the Past 40 Years Determined from Satellite and in Situ
Observations.” Science 294 (2001): 840-842. Carvalho, T.M.M. and C.O.A. Coelho. “Coastal risk perception: a case study in Aveiro District,
Portugal.” Journal of Hazardous Materials 61.1-3(1998): 263–270. Coastal Zone Management Subgroup. "Strategies For Adaptation To Sea Level Rise."
Intergovernmental Panel on Climate Change, 1990. Emmer, Rod E., Ralph Thayer, Shirley Laska, Dan Hawkins, and Mark Davis. “Planning for Sea
Level Rise Along the Louisiana Coast: A Workbook of Ideas, Model Ordinances, Resident and Public Official Survey Findings, and References.” New Orleans, La.: University of New Orleans, Department of Sociology, Environmental Social Science Research Institute, 1992.
Flannery, Tim. The Weather Makers. Melbourne: Text Publishing Company, 2005. Gornitz, V., S. Lebedeff, and J. Hansen. “Global Sea Level Trend in the Past Century.” Science
215.4540(1982): 1611-1614.

AEFS 2008 67
Johnson, Zoe Pfahl. "A Sea Level Rise Response Strategy for the State of Maryland." 2007. State of Maryland Department of Natural Resources, Coastal Zone Management Division. <http://dnrweb.dnr.state.md.us/download/bays/ sea_level_strategy.pdf>.
Laska, Shirely, and Rod Emmer. “Resident and Public Official Perceptions of the Effects of Coastal
Erosion and Sea Level Rise on Coastal Louisiana: The Barataria Basin.” New Orleans, La.: University of New Orleans, Dept. of Sociology, Environmental Social Science Research Institute, 1992.
Lawrimore, Jay. “Greenhouse Gases.” 2005. NOAA. <http://lwf.ncdc.noaa.gov/oa/
climate/gases.html>. Moser, Susanne C., and John Tribbia. “Vulnerability to Inundation and Climate Change Impacts in
California: Coastal Managers’ Attitudes and Perceptions.” Marine Technology Society Journal 40.4 (2006): 35-44.
The Nature Conservancy. “North Carolina’s Albemarle Peninsula.” Global Climate Change.
2008. <http://www.nature.org/wherewework/northamerica/states/ northcarolina/initiatives/art20694.html>.
North Carolina Coastal Federation. “Sea Level Rise: Welcome to NC of 1,000 Years Ago.”
State of the Coast Report, 2004. Pearsall, Sam, and Benjamin Poulter. “Adapting Coastal Lowlands to Rising Seas.” Principles
of Conservation Biology 3rd edition. Sinauer Press: 2005, 366-370. Raaijmakers, Ruud, Jörg Krywkow and Anne van der Veen. “Flood risk perceptions and spatial multi-
criteria analysis: An exploratory research for hazard mitigation.” Natural Hazards 46.3 (2008): 307-322.
Rhode Island. “Rhode Island Coastal Resources Management Program.” 2008.
<http://www.crmc.state.ri.us/regulations/proposedregs/2008-0304_RICRMP_Section_145.pdf>.
Riggs, Stanley R., and Dorothea V. Ames. Drowning the North Carolina Coast: Sea Level Rise
and Estuarine Dynamics. Raleigh: North Carolina Sea Grant, 2003. Sargent, Frederic O., Paul Lusk, José A. Rivera, Marîa Varela. Rural Envrionmental Planning
for Sustainable Communities. Washington, D.C.: Island Press, 1991. Starkey, Marian. 2007. “Global Warming: Making the Population Connection.” The Reporter
39.2 (2007) : 5-10. Union of Concerned Scientists. “Early Warning Signs of Global Warming: Sea-Level Rise and
Coastal Flooding.” 2004. <http://www.ucsusa.org>. Walonick, David S. “Statpac: Elements of a Research Proposal and Report.” Statpac Inc. 2005.
<http://statpac.com/research-papers/research-proposal.htm>.

AEFS 2008 68
Weather Underground. “Sea Level Rise.” 2008. <http://www.wunderground.com/
climate/SeaLevelRise.asp>. Zelinka, Al, Susan Harden and Suzanne Rynne. “Planners… Immerse Yourselves: The
Community Immersion Approach to Public Involvement.” Practicing Planner. 2008. American Institute of Certified Planners. <http://www.planning.org/ practicingplanner/print/08summer/specialcase.htm>.

AEFS 2008 69
Appendix
Appendix A. Figure i. The Nature Conservancy Map of Past, Present, and Future Housing Density on the Outer Banks and Roanoke Island Source: Public Listening Session: Sea Level Rise and Population Growth in NC on August 18, 2008 hosted by the Albemarle-Pamlico Conservation & Communities Collaborative Figure ii. The Nature Conservancy Map of Past, Present, and Future Sea Levels on the Outer Banks and Roanoke Island Source: Public Listening Session: Sea Level Rise and Population Growth in NC on August 18, 2008 hosted by the Albemarle-Pamlico Conservation & Communities Collaborative Appendix B. Survey Letter Appendix C. Survey Appendix D. Survey with Labeling used for Analysis Appendix E. Newspaper Clipping from The Coastland Times on Tuesday October 28, 2008 Appendix F. Tables of Raw Data Table 1. Raw Data Corresponding to Figure 10. Education level versus responses to A3. Table 2. Raw Data Corresponding to Figure 11. Education level versus responses to A2. Table 3. Raw Data Corresponding to Figure 12. Education level versus responses to A5. Table 4. Raw Data Corresponding to Figure 13. Education level versus responses to A4. Table 5. Raw Data Corresponding to Figure 14. Age versus responses to A1. Table 6. Raw Data Corresponding to Figure 15. Age versus responses to A3. Table 7. Raw Data Corresponding to Figure 16. Age versus responses to A2. Table 8. Raw Data Corresponding to Figure 17. Age versus responses to A10. Table 9. Raw Data Corresponding to Figure 18. Town of residence versus responses to A3. Table 10. Raw Data Corresponding to Figure 19. Town of residence versus responses to A2. Table 11. Raw Data Corresponding to Figure 20. Town of residence versus responses to A10. Table 12. Raw Data Corresponding to Figure 21.

AEFS 2008 70
Town of residence versus responses to A6. Table 13. Raw Data Corresponding to Figure 22. Town of residence versus responses to A12. Table 14. Raw Data Corresponding to Figure 23. Those with and without children versus responses to A10. Table 15. Raw Data Corresponding to Figure 24. Perceptions of respondents with and without children regarding the effects of sea level rise. Table 16. Raw Data Corresponding to Figure 25. Those with and without children versus responses to A5. Table 17. Raw Data Corresponding to Figure 26. Those with and without children versus responses to A6. Table 18. Raw Data Corresponding to Figure 27. Ownership versus responses to A10. Table 19. Raw Data Corresponding to Figure 28. Ownership versus responses to C3 and C7. Table 20. Raw Data Corresponding to Figure 29. Ownership versus responses to A5. Table 21. Raw Data Corresponding to Figure 30. Property type versus responses to C1, C3, C7, and C8. Table 22. Raw Data Corresponding to Figures 31, 31, 33, and 34. Percentages of all respondents versus A1 - A12. Table 23. Raw Data Corresponding to Figure 35. Responses to B1-B6 by percentage. Table 24. Percentages of all respondents versus C1-C13. Table 25. Raw data corresponding to Figure 36 and Figure 37. Responses to D1 by percentage and cited evidence of sea level rise. Table 26. Raw data corresponding to Figure 1. The number of respondents by age. Table 27. Raw data corresponding to Figure 2. The number of respondents by income level. Table 28. Raw data corresponding to Figure 3. The percentage of respondents by level of education. Table 29. Raw data corresponding to Figure 4. The percentage of respondents by occupation. Table 30. Raw data corresponding to Figure 5. The number of respondents by years lived on Outer Banks. Table 31. Raw data corresponding to Figure 6. The percentage of respondents by resident status. Table 32. Raw data corresponding to Figure 7. The percentage of respondents by towns of residence. Table 33. Raw data corresponding to Figure 8. The percentage of respondents with and without children. Table 34. Raw data corresponding to Figure 9.
The percentage of respondents by sex.

AEFS 2008 71
Appendix A. Figure i. The Nature Conservancy Map of Past, Present, and Future Housing Density on the Outer Banks and Roanoke Island.

AEFS 2008 72
Figure ii. The Nature Conservancy of Past, Present, and Future Sea Levels on the Outer Banks and Roanoke Island.

AEFS 2008 73
Appendix B. Survey Letter October, 2008 Dear Outer Banks Resident, We would like to invite you to participate in a research survey to find out what local residents think about rising sea levels. We are students from the University of North Carolina at Chapel Hill who are participating in the University’s Albemarle Ecological Field Site in Manteo this fall. We would like to use the information you provide for a research project we are working on. We hope that the information you share will help us to both understand the phenomenon of sea-level rise, and to find out what people think should be done about it, if anything.
This survey is completely confidential and there is no known risk involved with participating in it. However, it is fine if you wish to stop answering questions at any time or choose to not answer a certain question or questions. To return the survey, please drop it into the manila envelope at the survey site on the day you receive it or mail it back in the self-addressed envelope before October 31st. Any information you provide will only be used to identify overall trends and patterns and will not be used to identify you personally. The results of the project will be compiled into a report that will be completed late this year or early 2009. In addition, we will present the research findings to the public at Roanoke Island Festival Park on December 12, 2008, at 2 p.m. You are invited to attend that presentation even if you do not complete the survey form. We thank you very much for participating. If, after you submit your survey, you have any questions, please feel free to contact our faculty advisor, Robert Perry, at 252-475-3663, extension 25.
Sincerely,
Students of the Albemarle Ecological Field Site Manteo, North Carolina

AEFS 2008 74
Appendix C. Survey
Albemarle Ecological Field Site of the University of North Carolina Sea Level Survey
Please respond appropriately and to the best of your knowledge to any of the following questions that you are willing to answer. You are free to stop taking the survey at any time or to leave any questions blank. Thank you for your time. Are you a resident of Roanoke Island or the Outer Banks? __________________ What is your town of residence? _______________________________________ Are you a full or part-time resident? ____________________________________ How many years have you lived in this area? _____________________________ Do you rent or own your residence? ____________________________________ Do you live on or own waterfront property? ______________________________ Are you male or female? _____________________________________________ What is your age, in years? ___________________________________________ What is your occupation?
___ Agriculture ___ Arts ___ Construction ___ Engineering ___ Entertainment ___ Finance ___ Fishing ___ Health ___ Home-making ___ Hospitality ___ Internet ___ Legal ___ Managerial ___ Networking ___ Odd ___ Personnel ___ Programming ___ Public Services ___ Retired ___ Sales ___ Secretarial ___ Service ___ Student ___ Teaching ___ Unemployed
What is your annual household income?
___ $0 - $25,000 ___ $25,000 - $50,000 ___ $50,000 - $100,000 ___ $100,000 or more
What is your highest completed level of education? ___ Less than High School ___ High School or GED ___ Trade School ___ Associate’s Degree ___ Bachelor’s Degree ___ Graduate Degree
Do you have children? ______________________________________________
Which sources of news do you check at least once a week?
___ Newspapers ___ Magazines ___ TV ___ Internet ___ Radio
(Please continue on next page)

AEFS 2008 75
For the following questions, please write A for “agree,” D for “disagree,” NS for “not sure” or NA for “does not apply.”
1. ___ I had heard of “sea level rise” before taking this survey. 2. ___ I consider myself informed about sea level rise. 3. ___ Sea level rise is not occurring on the Outer Banks. 4. ___ More research is needed to determine whether sea level rise is occurring. 5. ___ I will not consider sea level rise when making investments and choices for the
future. 6. ___ The government should consider sea level rise when making decisions
including those regarding development of the Outer Banks. 7. ___ There are things people can do to address sea level rise. 8. ___ The effects of sea level rise can be addressed without making lifestyle
changes. 9. ___ Economic forces will sufficiently address sea level rise. 10. ___ I am concerned about rising sea levels. 11. ___ Sea level rise could cause flooding of inland coastal properties. 12. ___ Immediate action should be taken to address the effects of sea level rise.
For the following questions, please check all that apply.
1. Sea level rise is caused by ___ Man-made climate change ___ Natural climate change ___ God ___ Other natural processes
___ Other: __________ ___ None of the above
2. Sea level rise will affect:
___ Me ___ Future generations ___ My house
___ My job ___ Tourism ___ Agriculture ___ Property values
___ Local politics ___ International politics ___ Population inland ___ Ecosystems and wildlife ___ Other: ___________ ___ None of the above
(Please continue on next page)

AEFS 2008 76
Please write as much as you like in response to the following questions: 1. What do you believe the current rate of sea level rise is on the Outer Banks (in
inches every ten years)? 2. How have you come to this conclusion? 3. Please describe any personal observations of sea level rise. To return this survey, please drop it into the manila envelope at the survey distribution site on the day you receive it, or mail your survey back in the self-addressed envelope before October 31st. (Address: AEFS Survey, P.O. Box 370, Manteo, NC 27954). Many thanks!

AEFS 2008 77
Appendix D. Survey with Labeling used for Analysis
Albemarle Ecological Field Site of the University of North Carolina Sea Level Survey
Please respond appropriately and to the best of your knowledge to any of the following questions that you are willing to answer. You are free to stop taking the survey at any time or to leave any questions blank. Thank you for your time. Are you a resident of Roanoke Island or the Outer Banks? __________________ What is your town of residence? _______________________________________ Are you a full or part-time resident? ____________________________________ How many years have you lived in this area? _____________________________ Do you rent or own your residence? ____________________________________ Do you live on or own waterfront property? ______________________________ Are you male or female? _____________________________________________ What is your age, in years? ___________________________________________ What is your occupation?
___ Agriculture ___ Arts ___ Construction ___ Engineering ___ Entertainment ___ Finance ___ Fishing ___ Health ___ Home-making ___ Hospitality ___ Internet ___ Legal ___ Managerial ___ Networking ___ Odd ___ Personnel ___ Programming ___ Public Services ___ Retired ___ Sales ___ Secretarial ___ Service ___ Student ___ Teaching ___ Unemployed
What is your annual household income? ___ $0 - $25,000 ___ $25,000 - $50,000 ___ $50,000 - $100,000 ___ $100,000 or more
What is your highest completed level of education? ___ Less than High School ___ High School or GED ___ Trade School ___ Associate’s Degree ___ Bachelor’s Degree ___ Graduate Degree
Do you have children? ______________________________________________
Which sources of news do you check at least once a week?
___Newspapers ___ Magazines ___ TV ___ Internet ___ Radio
(Please continue on next page)

AEFS 2008 78
For the following questions, please write A for “agree,” D for “disagree,” NS for “not sure” or NA for “does not apply.”
Label for Analysis A1 1. ___ I had heard of “sea level rise” before taking this survey. A2 2. ___ I consider myself informed about sea level rise. A3 3. ___ Sea level rise is not occurring on the Outer Banks. A4 4. ___ More research is needed to determine whether sea level rise is occurring. A5 5. ___ I will not consider sea level rise when making investments and choices for the future. A6 6. ___ The government should consider sea level rise when making decisions including those regarding development of the Outer Banks. A7 7. ___ There are things people can do to address sea level rise. A8 8. ___ The effects of sea level rise can be addressed without making lifestyle changes. A9 9. ___ Economic forces will sufficiently address sea level rise. A10 10. ___ I am concerned about rising sea levels. A11 11. ___ Sea level rise could cause flooding of inland coastal properties. A12 12. ___ Immediate action should be taken to address the effects of sea level rise. For the following questions, please check all that apply.
1. Sea level rise is caused by B1 ___ Man-made climate change B2 ___ Natural climate change B3 ___ God B4 ___ Other natural processes
B5 ___ Other: __________ B6 ___ None of the above
2. Sea level rise will affect:
C1 ___ Me C2 ___ Future generations C3___ My house C4 ___ My job C5___ Tourism C6 ___ Agriculture C7 ___ Property values C8 ___ Local politics C9 ___ International politics C10 ___ Population inland C11 ___ Ecosystems and wildlife C12 ___ Other: ___________ C13 ___ None of the above
(Please continue on next page)

AEFS 2008 79
Please write as much as you like in response to the following questions: D1 1. What do you believe the current rate of sea level rise is on the Outer Banks (in inches every ten years)? D2. 2. How have you come to this conclusion? D3 3, Please describe any personal observations of sea level rise. To return this survey, please drop it into the manila envelope at the survey distribution site on the day you receive it, or mail your survey back in the self-addressed envelope before October 31st. (Address: AEFS Survey, P.O. Box 370, Manteo, NC 27954). Many thanks!

AEFS 2008 80
Appendix E. Newspaper Clipping from The Coastland Times on Tuesday October 28, 2008.

AEFS 2008 81
(Appendix E. Newspaper Clipping from The Coastland Times on Tuesday October 28, 2008. continued)

AEFS 2008 82
Appendix F. Tables of Raw Data Table 1. Raw data corresponding to Figure 10. Education level versus responses to A3. Education Response Number Percentage (%) Less than High School A 0 0.00 High School or GED A 11 14.67 Trade School A 0 0.00 Associate's Degree A 3 8.57 Bachelor's Degree A 6 8.82 Graduate Degree A 0 0.00
Less than High School D 1 100.00 High School or GED D 46 61.33 Trade School D 11 73.33 Associate's Degree D 24 68.57 Bachelor's Degree D 49 72.06 Graduate Degree D 22 75.86
Less than High School NA 0 0.00 High School or GED NA 2 2.67 Trade School NA 0 0.00 Associate's Degree NA 0 0.00 Bachelor's Degree NA 1 1.47 Graduate Degree NA 0 0.00
Less than High School NS 0 0.00 High School or GED NS 16 21.33 Trade School NS 4 26.67 Associate's Degree NS 8 22.86 Bachelor's Degree NS 12 17.65 Graduate Degree NS 7 24.14

AEFS 2008 83
Table 2. Raw data corresponding to Figure 11. Education level versus responses to A2. Education Response Number Percentage (%) Less than High School A 1 100.00 High School or GED A 37 49.33 Trade School A 6 42.86 Associate's Degree A 17 50.00 Bachelor's Degree A 44 64.71 Graduate Degree A 22 75.86
Less than High School D 0 0.00 High School or GED D 19 25.33 Trade School D 3 21.43 Associate's Degree D 9 26.47 Bachelor's Degree D 11 16.18 Graduate Degree D 5 17.24
Less than High School NA 0 0.00 High School or GED NA 3 4.00 Trade School NA 0 0.00 Associate's Degree NA 2 5.88 Bachelor's Degree NA 1 1.47 Graduate Degree NA 0 0.00
Less than High School NS 0 0.00 High School or GED NS 16 21.33 Trade School NS 5 35.71 Associate's Degree NS 6 17.65 Bachelor's Degree NS 12 17.65 Graduate Degree NS 2 6.90

AEFS 2008 84
Table 3. Raw data corresponding to Figure 12. Education level versus responses to A5.
Education Level Response Number Percentage (%) Less than High School A 1 100.00 High School or GED A 16 21.33 Trade School A 2 14.29 Associate's Degree A 7 20.59 Bachelor's Degree A 13 19.12 Graduate Degree A 4 13.33
Less than High School D 0 0.00 High School or GED D 40 53.33 Trade School D 10 71.43 Associate's Degree D 21 61.76 Bachelor's Degree D 49 72.06 Graduate Degree D 21 70.00
Less than High School NA 0 0.00 High School or GED NA 8 10.67 Trade School NA 0 0.00 Associate's Degree NA 2 5.88 Bachelor's Degree NA 4 5.88 Graduate Degree NA 1 3.33
Less than High School NS 0 0.00 High School or GED NS 11 14.67 Trade School NS 2 14.29 Associate's Degree NS 4 11.76 Bachelor's Degree NS 2 2.94 Graduate Degree NS 4 13.33

AEFS 2008 85
Table 4. Raw data corresponding to Figure 13. Education level versus responses to A4. Education Level Response Number Percentage (%) Less than High School A 1 100.00 High School or GED A 45 60.00 Trade School A 7 50.00 Associate's Degree A 16 47.06 Bachelor's Degree A 35 51.47 Graduate Degree A 13 43.33
Less than High School D 0 0.00 High School or GED D 21 28.00 Trade School D 4 28.57 Associate's Degree D 12 35.29 Bachelor's Degree D 21 30.88 Graduate Degree D 12 40.00
Less than High School NA 0 0.00 High School or GED NA 2 2.67 Trade School NA 0 0.00 Associate's Degree NA 2 5.88 Bachelor's Degree NA 1 1.47 Graduate Degree NA 0 0.00
Less than High School NS 0 0.00 High School or GED NS 7 9.33 Trade School NS 3 21.43 Associate's Degree NS 4 11.76 Bachelor's Degree NS 11 16.18 Graduate Degree NS 5 16.67

AEFS 2008 86
Table 5. Raw data corresponding to Figure 14. Age versus responses to A1. Age Response Number Percentage (%) 18 to 30 A 57 93.44 31 to 40 A 29 90.63 41 to 50 A 45 91.84 51 to 60 A 48 94.12 61 to 70 A 22 88.00 71 to 80 A 4 100.00 81 to 90 A 2 100.00
18 to 30 D 1 1.64 31 to 40 D 1 3.13 41 to 50 D 2 4.08 51 to 60 D 0 0.00 61 to 70 D 2 8.00 71 to 80 D 0 0.00 81 to 90 D 0 0.00
18 to 30 NA 2 3.28 31 to 40 NA 2 6.25 41 to 50 NA 0 0.00 51 to 60 NA 1 1.96 61 to 70 NA 0 0.00 71 to 80 NA 0 0.00 81 to 90 NA 0 0.00
18 to 30 NS 1 1.64 31 to 40 NS 0 0.00 41 to 50 NS 2 4.08 51 to 60 NS 2 3.92 61 to 70 NS 1 4.00 71 to 80 NS 0 0.00 81 to 90 NS 0 0.00

AEFS 2008 87
Table 6. Raw data corresponding to Figure 15. Age versus responses to A3. Age Response Number Percentage (%) 18 to 30 A 3 4.84 31 to 40 A 4 12.50 41 to 50 A 4 8.16 51 to 60 A 8 15.69 61 to 70 A 2 8.00 71 to 80 A 0 0.00 81 to 90 A 0 0.00
18 to 30 D 46 74.19 31 to 40 D 19 59.38 41 to 50 D 33 67.35 51 to 60 D 32 62.75 61 to 70 D 19 76.00 71 to 80 D 3 75.00 81 to 90 D 2 100.00
18 to 30 NA 1 1.61 31 to 40 NA 1 3.13 41 to 50 NA 1 2.04 51 to 60 NA 0 0.00 61 to 70 NA 0 0.00 71 to 80 NA 0 0.00 81 to 90 NA 0 0.00
18 to 30 NS 12 19.35 31 to 40 NS 8 25.00 41 to 50 NS 11 22.45 51 to 60 NS 11 21.57 61 to 70 NS 4 16.00 71 to 80 NS 1 25.00 81 to 90 NS 0 0.00

AEFS 2008 88
Table 7. Raw data corresponding to Figure 16. Age versus responses to A2.
Age Response Number Percentage (%) 18 to 30 A 35 56.45 31 to 40 A 16 50.00 41 to 50 A 24 50.00 51 to 60 A 39 75.00 61 to 70 A 13 54.17 71 to 80 A 3 75.00 81 to 90 A 2 100.00 18 to 30 D 17 27.42 31 to 40 D 8 25.00 41 to 50 D 9 18.75 51 to 60 D 6 11.54 61 to 70 D 7 29.17 71 to 80 D 0 0.00 81 to 90 D 0 0.00 18 to 30 NA 2 3.23 31 to 40 NA 3 9.38 41 to 50 NA 0 0.00 51 to 60 NA 1 1.92 61 to 70 NA 0 0.00 71 to 80 NA 0 0.00 81 to 90 NA 0 0.00 18 to 30 NS 8 12.90 31 to 40 NS 5 15.63 41 to 50 NS 15 31.25 51 to 60 NS 6 11.54 61 to 70 NS 4 16.67 71 to 80 NS 1 25.00 81 to 90 NS 0 0.00

AEFS 2008 89
Table 8. Raw data corresponding to Figure 17. Age versus responses to A10. Age Response Number Percentage (%) 18 to 30 A 48 77.42 31 to 40 A 20 62.50 41 to 50 A 37 75.51 51 to 60 A 36 69.23 61 to 70 A 14 58.33 71 to 80 A 3 75.00 81 to 90 A 2 100.00
18 to 30 D 4 6.45 31 to 40 D 8 25.00 41 to 50 D 6 12.24 51 to 60 D 10 19.23 61 to 70 D 9 37.50 71 to 80 D 0 0.00 82 to 90 D 0 0.00
18 to 30 NA 2 3.23 31 to 40 NA 0 0.00 41 to 50 NA 0 0.00 51 to 60 NA 2 3.85 61 to 70 NA 0 0.00 71 to 80 NA 0 0.00 84 to 90 NA 0 0.00
18 to 30 NS 8 12.90 31 to 40 NS 4 12.50 41 to 50 NS 6 12.24 51 to 60 NS 4 7.69 61 to 70 NS 1 4.17 71 to 80 NS 1 25.00 83 to 90 NS 0 0.00

AEFS 2008 90
Table 9. Raw data corresponding to Figure 18. Town of residence versus responses to A3. Town of Residence Response Number Percentage (%) Avon A 2 10.00 Buxton A 2 9.52 Corolla A 0 0.00 Frisco A 4 28.57 Hatteras A 1 7.14 Kill Devil Hills A 1 1.92 Kitty Hawk A 1 9.09 Manteo A 3 8.57 Nags Head A 2 9.09 Ocracoke A 2 10.53 Poplar Branch A 0 0.00 Salvo A 1 20.00 Southern Shores A 1 7.69 Wanchese A 1 16.67 Waves A 0 0.00
Avon D 7 35.00 Buxton D 14 66.67 Corolla D 0 0.00 Frisco D 9 64.29 Hatteras D 8 57.14 Kill Devil Hills D 38 73.08 Kitty Hawk D 8 72.73 Manteo D 26 74.29 Nags Head D 13 59.09 Ocracoke D 12 63.16 Poplar Branch D 1 100.00 Salvo D 3 60.00 Southern Shores D 10 76.92 Wanchese D 5 83.33 Waves D 4 100.00

AEFS 2008 91
(Table 9. Raw data corresponding to Figure 18. continued)
Town of Residence Response Number Percentage (%)
Avon NA 0 0.00 Buxton NA 0 0.00 Corolla NA 0 0.00 Frisco NA 0 0.00 Hatteras NA 0 0.00 Kill Devil Hills NA 1 1.92 Kitty Hawk NA 0 0.00 Manteo NA 0 0.00 Nags Head NA 2 9.09 Ocracoke NA 0 0.00 Poplar Branch NA 0 0.00 Salvo NA 1 20.00 Southern Shores NA 0 0.00 Wanchese NA 0 0.00 Waves NA 0 0.00
Avon NS 11 55.00 Buxton NS 5 23.81 Corolla NS 1 100.00 Frisco NS 1 7.14 Hatteras NS 5 35.71 Kill Devil Hills NS 12 23.08 Kitty Hawk NS 2 18.18 Manteo NS 6 17.14 Nags Head NS 5 22.73 Ocracoke NS 5 26.32 Poplar Branch NS 0 0.00 Salvo NS 0 0.00 Southern Shores NS 2 15.38 Wanchese NS 0 0.00 Waves NS 0 0.00

AEFS 2008 92
Table 10. Raw data corresponding to Figure 19. Town of residence versus responses to A2.
Town of Residence Response Number Percentage (%) Avon A 10 83.33 Buxton A 13 61.90 Corolla A 1 100.00 Frisco A 8 61.54 Hatteras A 11 78.57 Kill Devil Hills A 26 50.00 Kitty Hawk A 3 27.27 Manteo A 22 64.71 Nags Head A 13 59.09 Ocracoke A 9 47.37 Poplar Branch A 0 0.00 Salvo A 3 60.00 Southern Shores A 6 46.15 Wanchese A 6 100.00 Waves A 3 75.00
Avon D 1 8.33 Buxton D 3 14.29 Corolla D 0 0.00 Frisco D 1 7.69 Hatteras D 1 7.14 Kill Devil Hills D 13 25.00 Kitty Hawk D 5 45.45 Manteo D 6 17.65 Nags Head D 7 31.82 Ocracoke D 5 26.32 Poplar Branch D 1 100.00 Salvo D 1 20.00 Southern Shores D 3 23.08 Wanchese D 0 0.00 Waves D 0 0.00

AEFS 2008 93
(Table 10. Raw data corresponding to Figure 19. continued)
Town of Residence Response Number Percentage (%)
Avon NA 0 0.00 Buxton NA 2 9.52 Corolla NA 0 0.00 Frisco NA 1 7.69 Hatteras NA 0 0.00 Kill Devil Hills NA 2 3.85 Kitty Hawk NA 1 9.09 Manteo NA 0 0.00 Nags Head NA 0 0.00 Ocracoke NA 0 0.00 Poplar Branch NA 0 0.00 Salvo NA 0 0.00 Southern Shores NA 0 0.00 Wanchese NA 0 0.00 Waves NA 0 0.00
Avon NS 1 8.33 Buxton NS 3 14.29 Corolla NS 0 0.00 Frisco NS 3 23.08 Hatteras NS 2 14.29 Kill Devil Hills NS 11 21.15 Kitty Hawk NS 2 18.18 Manteo NS 6 17.65 Nags Head NS 2 9.09 Ocracoke NS 5 26.32 Poplar Branch NS 0 0.00 Salvo NS 1 20.00 Southern Shores NS 4 30.77 Wanchese NS 0 0.00 Waves NS 1 25.00

AEFS 2008 94
Table 11. Raw data corresponding to Figure 20. Town of residence versus responses to A10. Town of Residence Response Number Percentage (%) Avon A 5 45.45 Buxton A 14 66.67 Corolla A 1 100.00 Frisco A 7 53.85 Hatteras A 8 61.54 Kill Devil Hills A 37 69.81 Kitty Hawk A 9 81.82 Manteo A 28 82.35 Nags Head A 17 77.27 Ocracoke A 15 78.95 Poplar Branch A 1 100.00 Southern Shores A 7 53.85 Wanchese A 5 83.33 Waves A 4 100.00 Salvo A 4 80.00
Avon D 4 36.36 Buxton D 5 23.81 Corolla D 0 0.00 Frisco D 4 30.77 Hatteras D 2 15.38 Kill Devil Hills D 7 13.21 Kitty Hawk D 2 18.18 Manteo D 3 8.82 Nags Head D 2 9.09 Ocracoke D 4 21.05 Poplar Branch D 0 0.00 Southern Shores D 4 30.77 Wanchese D 0 0.00 Waves D 0 0.00 Salvo D 0 0.00

AEFS 2008 95
(Table 11. Raw data corresponding to Figure 20. continued)
Town of Residence Response Number Percentage (%)
Avon NA 1 9.09 Buxton NA 0 0.00 Corolla NA 0 0.00 Frisco NA 0 0.00 Hatteras NA 1 7.69 Kill Devil Hills NA 1 1.89 Kitty Hawk NA 0 0.00 Manteo NA 0 0.00 Nags Head NA 0 0.00 Ocracoke NA 0 0.00 Poplar Branch NA 0 0.00 Southern Shores NA 1 7.69 Wanchese NA 0 0.00 Waves NA 0 0.00 Salvo NA 1 20.00
Avon NS 1 9.09 Buxton NS 2 9.52 Corolla NS 0 0.00 Frisco NS 2 15.38 Hatteras NS 2 15.38 Kill Devil Hills NS 8 15.09 Kitty Hawk NS 0 0.00 Manteo NS 3 8.82 Nags Head NS 3 13.64 Ocracoke NS 0 0.00 Poplar Branch NS 0 0.00 Southern Shores NS 1 7.69 Wanchese NS 1 16.67 Waves NS 0 0.00 Salvo NS 0 0.00

AEFS 2008 96
Table 12. Raw data corresponding to Figure 21. Town of residence versus responses to A6. Town of Residence Response Number Percentage (%) Avon A 8 72.73 Buxton A 15 71.43 Corolla A 0 0.00 Frisco A 11 84.62 Hatteras A 10 71.43 Kill Devil Hills A 43 81.13 Kitty Hawk A 10 90.91 Manteo A 33 94.29 Nags Head A 18 85.71 Ocracoke A 16 84.21 Poplar Branch A 1 100.00 Southern Shores A 10 76.92 Wanchese A 6 100.00 Waves A 3 75.00 Salvo A 5 100.00
Avon D 2 18.18 Buxton D 4 19.05 Corolla D 1 100.00 Frisco D 1 7.69 Hatteras D 1 7.14 Kill Devil Hills D 4 7.55 Kitty Hawk D 1 9.09 Manteo D 0 0.00 Nags Head D 1 4.76 Ocracoke D 2 10.53 Poplar Branch D 0 0.00 Southern Shores D 2 15.38 Wanchese D 0 0.00 Waves D 0 0.00 Salvo D 0 0.00

AEFS 2008 97
(Table 12. Raw data corresponding to Figure 21. continued)
Town Response Number Percentage (%)
Avon NA 0 0.00 Buxton NA 1 4.76 Corolla NA 0 0.00 Frisco NA 0 0.00 Hatteras NA 0 0.00 Kill Devil Hills NA 0 0.00 Kitty Hawk NA 0 0.00 Manteo NA 0 0.00 Nags Head NA 0 0.00 Ocracoke NA 0 0.00 Poplar Branch NA 0 0.00 Southern Shores NA 0 0.00 Wanchese NA 0 0.00 Waves NA 0 0.00 Salvo NA 0 0.00
Avon NS 1 9.09 Buxton NS 1 4.76 Corolla NS 0 0.00 Frisco NS 1 7.69 Hatteras NS 3 21.43 Kill Devil Hills NS 6 11.32 Kitty Hawk NS 0 0.00 Manteo NS 2 5.71 Nags Head NS 2 9.52 Ocracoke NS 1 5.26 Poplar Branch NS 0 0.00 Southern Shores NS 1 7.69 Wanchese NS 0 0.00 Waves NS 1 25.00 Salvo NS 0 0.00

AEFS 2008 98
Table 13. Raw data corresponding to Figure 22. Town of residence versus responses to A12. Town of Residence Response Number Percentage (%) Avon A 6 54.55
Buxton A 11 55.00 Corolla A 0 0.00 Frisco A 6 46.15 Hatteras A 8 61.54 Kill Devil Hills A 36 67.92 Kitty Hawk A 6 54.55 Manteo A 27 77.14 Nags Head A 13 61.90 Ocracoke A 12 66.67 Poplar Branch A 1 100.00 Southern Shores A 4 80.00 Wanchese A 5 83.33 Waves A 2 66.67 Salvo A 4 80.00
Avon D 2 18.18 Buxton D 6 30.00 Corolla D 1 100.00 Frisco D 3 23.08 Hatteras D 2 15.38 Kill Devil Hills D 5 9.43 Kitty Hawk D 2 18.18 Manteo D 2 5.71 Nags Head D 1 4.76 Ocracoke D 1 5.56 Poplar Branch D 0 0.00 Southern Shores D 0 0.00 Wanchese D 0 0.00 Waves D 0 0.00 Salvo D 0 0.00

AEFS 2008 99
(Table 13. Raw data corresponding to Figure 22. continued)
Town of Residence Response Number Percentage (%)
Avon NA 1 9.09 Buxton NA 0 0.00 Corolla NA 0 0.00 Frisco NA 1 7.69 Hatteras NA 0 0.00 Kill Devil Hills NA 0 0.00 Kitty Hawk NA 1 9.09 Manteo NA 1 2.86 Nags Head NA 0 0.00 Ocracoke NA 0 0.00 Poplar Branch NA 0 0.00 Southern Shores NA 0 0.00 Wanchese NA 0 0.00 Waves NA 0 0.00 Salvo NA 0 0.00
Avon NS 2 18.18 Buxton NS 3 15.00 Corolla NS 0 0.00 Frisco NS 3 23.08 Hatteras NS 3 23.08 Kill Devil Hills NS 12 22.64 Kitty Hawk NS 2 18.18 Manteo NS 5 14.29 Nags Head NS 7 33.33 Ocracoke NS 5 27.78 Poplar Branch NS 0 0.00 Southern Shores NS 1 20.00 Wanchese NS 1 16.67 Waves NS 1 33.33 Salvo NS 1 20.00

AEFS 2008 100
Table 14. Raw data corresponding to Figure 23. Those with and without children versus responses to A10.
Number with children
Percent (%) with children
Number without children
Percent (%) without children
Agree 72 76.60 91 67.91 Disagree 10 10.64 26 19.40 Not sure 11 11.70 13 9.70 Not applicable 1 1.06 3 2.24
Table 15. Raw data corresponding to Figure 24. Perceptions of respondents with and without children regarding the effects of sea level rise.
Number without children
Percent (%) without children
Number with children
Percent (%) without children
Me 65 69.15 78 58.21 Future generations 82 87.23 118 88.06
Table 16. Raw data corresponding to Figure 25. Those with and without children versus responses to A5. Percent (%) without children Percent (%) with children Agree 20.21 17.91 Disagree 65.96 62.69 Not sure 10.63 8.96 Not applicable 3.19 8.96
Table 17. Raw data corresponding to Figure 26. Those with and without children versus responses to A6. Percent (%) with children Percent (%) without children Agree 85.11 80.60 Disagree 7.45 8.96 Not sure 6.38 9.70 Not applicable 0 0.75

AEFS 2008 101
Table 18. Raw data corresponding to Figure 27. Ownership versus responses to A10.
Number of owners
Percent (%) of owners
Number of renters
Percent (%) of renters
Agree 109 69.43 50 74.63 Disagree 29 18.47 8 11.94 Not sure 17 10.83 7 10.45 Not applicable 2 1.27 2 2.99
Table 19. Raw data corresponding to Figure 28. Ownership versus responses to C3 and C7.
Number of owners
Percent (%) of owners
Number of renters
Percent (%) of renters
My house 66 39.62 28 47.76 Property values 114 71.70 56 85.08
Table 20. Raw data corresponding to Figure 29. Ownership versus responses to A5.
Number of owners
Percent (%) of owners
Number of renters
Percent (%) of renters
Agree 34 21.79 10 14.93 Disagree 99 63.46 44 65.67 Not sure 15 9.62 6 8.96 Not applicable 8 5.13 7 10.45

AEFS 2008 102
Table 21. Raw data corresponding to Figure 30. Property type versus responses to C1, C3, C7, and C8.
Number non-waterfront
Percent (%) non-waterfront
Number waterfront
Percent (%) waterfront
Me checked 109 68.13 36 59.02 not checked 51 31.88 25 40.98 My house checked 71 44.65 27 44.26 not checked 88 55.00 34 55.74
Property values checked 129 55.35 49 71.01 not checked 31 19.38 20 28.99 Local politics checked 99 61.88 36 59.02 not checked 61 38.13 25 40.98
Table 22. Raw Data Corresponding to Figures 31, 31, 33, and 34. Percentages of all respondents versus A1 - A12. Question Agree (%) Disagree (%) Not Sure (%) Not applicable (%) A1 92.14 2.62 3.06 2.18 A2 58.52 20.96 17.90 2.62 A3 9.13 69.13 20.43 1.30 A4 53.04 31.30 13.48 2.17 A5 19.21 64.19 10.04 6.55 A6 83.04 8.26 8.26 0.43 A7 63.48 11.30 23.48 1.74 A8 23.04 51.30 24.35 1.30 A9 21.68 51.33 23.45 3.54 A10 71.62 16.16 10.48 1.75 A11 85.22 5.22 9.13 0.43 A12 64.16 12.39 21.68 1.77

AEFS 2008 103
Table 23. Raw Data Corresponding to Figure 35. Responses to B1-B6 by percentage. Causes of sea level rise Checked (%) Not Checked (%) Man-made climate change 70.09 29.91 Natural climate change 82.14 17.86 God 19.64 80.36 Other natural processes 45.98 54.02 Other 2.68 97.32 None of the above 1.79 98.21
Table 24. Percentages of all respondents versus C1-C13. Question Checked (%) Not Checked (%) C1 65.47 34.53 C2 91.48 8.52 C3 44.84 55.16 C4 51.57 48.43 C5 76.68 23.32 C6 58.74 41.26 C7 78.48 21.52 C8 58.74 41.26 C9 43.05 56.95 C10 56.50 43.50 C11 84.30 15.70 C12 4.93 95.07 C13 3.14 96.86
Table 25. Raw data corresponding to Figure 36 and Figure 37. Responses to D1 by percentage and cited evidence of sea level rise. Response Number Percentage (%) Don't know 84 43.98Lost Beaches 56 29.32Lost Houses 18 9.42Lighthouse 4 2.09Road Closure 5 2.62Overwash 16 8.38Stationary Marks 5 2.62Secondary Sources 36 18.85Vegetation Loss 4 2.09Total Responded 191 100.00

AEFS 2008 104
Table 26. Raw data corresponding to Figure 1. The number of respondents by age. Age Number Percentage (%) 18 to 30 61 27.2331 to 40 32 14.2941 to 50 49 21.8851 to 60 51 22.7761 to 70 25 11.1671 to 80 4 1.7981 to 90 2 0.89 Table 27. Raw data corresponding to Figure 2. The number of respondents by income level. Income Level Number Percentage (%) $0-$25,000 45 21.84$25,000-$50,000 73 35.44$50,000-$100,000 70 33.98$100,000 or More 18 8.74
Table 28. Raw data corresponding to Figure 3. The percentage of respondents by level of education.
Level of Education Number Percentage (%) Associate's Degree 33 14.22Bachelor's Degree 60 25.86Graduate Degree 30 12.93High School or GED 75 32.33Less than High School 1 0.43Trade School 13 5.60Not answered 8 3.45

AEFS 2008 105
Table 29. Raw data corresponding to Figure 4. The percentage of respondents by occupation. Occupation Number Percentage (%) Arts 21 9.05Construction 3 1.29Consulting 1 0.43Engineering 3 1.29Finance 3 1.29Fishing 16 6.90Health 5 2.16Hospitality 15 6.47Managerial 30 12.93Odd 2 0.86Public Services 13 5.60Retired 21 9.05Sales 66 28.45Secretarial 4 1.72Service 7 3.02Student 5 2.16Teaching 7 3.02Other 10 4.31
Table 30. Raw data corresponding to Figure 5. The number of respondents by years lived on Outer Banks. Years Lived Number Percentage (%) 0-10 87 39.0110.5-20.0 52 23.3221.0-30.0 49 21.9731.0-40.0 17 7.6241.0-50.0 11 4.9350.0 or more 7 3.14
Table 31. Raw data corresponding to Figure 6. The percentage of respondents by resident status. Resident Status Number Percentage (%) Full-time 214 93.04Part-time 9 3.91Unanswered 7 3.04

AEFS 2008 106
Table 32. Raw data corresponding to Figure 7. The percentage of respondents by towns of residence. Town Number Percentage (%) Avon 11 4.78Buxton 21 9.13Corolla 1 0.43Frisco 13 5.65Hatteras 14 6.09Kill Devil Hills 53 23.04Kitty Hawk 11 4.78Manteo 35 15.22Nags Head 23 10.00Ocracoke 19 8.26Poplar Branch 1 0.43Salvo 5 2.17Southern Shores 13 5.65Wanchese 6 2.61Waves 4 1.74
Table 33. Raw data corresponding to Figure 8. The percentage of respondents with and without children. Number Percentage (%) No Children 94 41.23Children 134 58.77
Table 34. Raw data corresponding to Figure 9. The percentage of respondents by sex. Sex Number Percentage (%) Male 109 47.39Female 121 52.61

AEFS 2008 107
(from the left) Jamie Stubson. Ella Wise, Meredith Robbins, Nathan Lamb, Mariah Keller, Jessie
Barber, Jennifer Bellis, Andy Blackmore, David Richardon, Taylor Crabtree, Lindsay Dubbs, Robert Perry