A LGPL framework for combinatorial optimization & problem solving Renaud De Landtsheer.

PERCEPTION POLITICS:
A BELGIAN CASE STUDY
Philippe De Vries - Christ’l De Landtsheer
Paper presented at the 20th IPSA world congress
Fukuoka, Japan
9 – 13 July 2006
University of Antwerp
Sint-Jacobstraat 2
2000 Antwerpen
Belgium
University of Antwerp
Sint-Jacobstraat 2
2000 Antwerpen
Belgium
http://www.ua.ac.be/politiekecommunicatie

Philippe De Vries – Christ’l De Landtsheer: PERCEPTION POLITICS
PERCEPTION POLITICS:
A BELGIAN CASE STUDY
Philippe De Vries - Christ’l De Landtsheer
ABSTRACT
Politically relevant images can be projected by a candidate’s physical appearance and
personality. The manipulation of political impressions, as a consequence, can be
exerted as a political-marketing tool. In this experiment, the physical appearances of
fifteen council members of an average Belgian city are manipulated in a politically
favorable way. Mock elections retrieved voter preferences concerning the appearance
of the original and the adjusted politicians. The results - on the contents of a favorable
image - are in support of an analogy between Europe and the United States.
Politicians gained significantly more votes with an appearance that was manipulated
in a similar, particular way.
political impressions – images – political marketing – physical appearance –
Belgium – perception politics
Page 2 of 39

Philippe De Vries – Christ’l De Landtsheer: PERCEPTION POLITICS
INTRODUCTION
As early as the sixteenth century Machiavelli drew the attention to the importance of
impressions and perceptions by emphasizing that prominent political figures don’t
necessary need to posses all good governing qualities but they should certainly appear
to have them (Bandonella, 2005). Different scientific disciplines have - over the past
century - underlined the importance of nonverbal communication. Nonverbal aspects
of political messages consist of striking and relevant political cues. Furthermore these
nonverbal aspects influence short-term impressions and evaluations as well as more
lasting political attitudes (Masters & Sullivan, 1993; Bucy & Bradley, 2004). There
has been a substantive amount of research both from psychology and political science
on the relation between political suitability and the personal characteristics of the
politician. Many political scientists, however, consider personal characteristics and
physical appearance of less than secondary interest and importance, and it is often
refused to accept that other aspects of political communication aside from the political
message deserve serious consideration.
Traditional political science is not eager to recognize the influences of political
personality and the physical characteristics on the perception of political suitability.
Social and political psychologists nevertheless, have discovered and proven several
interesting interactions. Social psychology has for a long period been captured by
cognition, paying little to no attention to affect and emotion. Abelson, Kinder and
Peters (1982) introduced the research on the political person perception and retrieved
groundbreaking conclusions by emphasizing that affective evaluations are highly
predictive of the overall evaluation of political candidates. Their findings clearly
indicate the role played by emotions and gut reactions in politics. Marcus (2003)
Page 3 of 39

Philippe De Vries – Christ’l De Landtsheer: PERCEPTION POLITICS
conducted prominent research on the interaction between voter behavior and emotion
stating emotions are used by voters as a tool for efficient information processing. In a
multi party system - with coalition governments - voting in a rational way is a time-
consuming and labor-intensive assignment. Voters, therefore, rely on other modes of
decision-making which include personality, emotions and gut reactions. All these
different aspects influence the coming about of individual political preferences, even
though they are predominantly considered irrational and a menace to the democratic
ideal. There is much to say for a democracy based on rational choice decision-making
by all voters. Unfortunately, as this study will confirm, this ideal has been proven
utopian and unrealistic since ages.
THE POLITICAL SUITABLE IMAGE
Many scientists have - over the last decades - showed a peculiar interest in this
intriguing domain of research. Especially social psychologists (Alderlich, Gronke &
Grynaviski, 1999) have, since the evolution towards candidate centered elections,
started to reconsider how voters assess political candidates and establish preferences.
Zajonc (1980) who proclaimed that two independent systems of political evaluation
occur, herewith introduced a thesis that was considered controversially. A first
evaluation system is fast, crude and perhaps even predominant. The second system, in
contrast, is believed to be slower, more detailed and above all cognitive. No
convincing arguments, nonetheless, need to be put forward to demonstrate that
politics is as much about feelings as it is about thinking. Voters possess a wide variety
of information about political candidates. This information ranges from issue
positioning, visual image, personality, previous mistakes or victories to office
Page 4 of 39

Philippe De Vries – Christ’l De Landtsheer: PERCEPTION POLITICS
experience. These crumbs of information construe a general, and in the eyes of the
voter true, image about the political candidate. Some of this gathered information,
possibly, triggers a more profound and cognitive information processing. Other
information, that includes physical appearance and political personality, initiates
strong emotional or affective reactions. The question that subsequently surfaces is
how these types of information processing relate to each other. Does the cognitive
information out rule or overrule the more emotional and affective or is it the other
way around? Research by Redlawsk and Lau (2003) indicates that, generally, the
cognitive outweighs the affective, even though the opposite result occurred as well.
They recall, as an example, the competence and woodenness of Al Gore in contrast to
the less competent but warm and approachable George W. Bush.
People ascribe and associate certain personality characteristics to others merely by
judging them on certain physical features (De Landtsheer, 2004). Even though most
children are taught not to judge a book by its cover, the power of the physical
appearance cues overrules the believed proper behavior. People being baby-faced,
overweight, unattractive or short are perceived more negatively on a number of
characteristics. Furthermore these unattractive individuals are labeled as less socially
skilled, less healthy and even less intelligent as their more favored peers (Eagly,
Ashmore, Makhijani & Longo, 1991; Keating, Randall, & Kendrick, 1999;
Andreoletti, Zebrowitz & Lachman, 2001). Overweight individuals tend to be seen as
lazy, slow and unintelligent (Crandall, 1994). Shorter individuals on the other hand
are perceived as lower in professional status and less competent, both in social and
cognitive domains (Jackson, 1992; Giessner, 2005).
Page 5 of 39
Philippe De Vries – Christ’l De Landtsheer: PERCEPTION POLITICS
With research in business communication we are now moving from the general
domain of affective information processing to more specific research on the
perception of political suitability. Several studies in this business area revealed
conclusions that might be transposed to politics. Johnson (1987) discovered, in a
study on physical attractiveness, dress and job type, a consistent influence of dress
style on interviewer perceptions. Riggio (1988) concluded his research by stating that
appropriate dress has a stronger influence on perceptual evaluations than physical
attractiveness whilst Forsythe (1990) revealed that female candidates with a more
masculine dress style, blazers, short belted jackets or tailored suits are perceived as
more forceful, aggressive and more likely to be hired. Nonetheless Riggio concluded
his research referring that attractive but inappropriately dressed candidates have a
greater chance to be hired than unattractive appropriately dressed ones (Ilkka, 1995).
These conclusions seem to refute the ‘what is beautiful is good stereotype’ established
by Dion (1972) who suggested that this stereotype is a strong and general
phenomenon, confirmed by several other studies but overthrown by a maybe even
greater number of studies (Eagly et al, 1991). On the other hand findings by Hatfield
once more tend to show that hairstyle and appropriate dress code are of greater
importance for women seeking management positions than their physical
attractiveness (Prodratz & Dipboye, 2002) which may again apply to the world of
politics. Returning to the field of political communication Sigelman was very clear in
his conclusions, stating that physical attractiveness does not affect the political image.
He found no significant direct relationship between attractiveness and people’s votes
when studying the effect of physical attractiveness on voters’ preferences (Sigelman,
Sigelman & Fowler, 1987).
Page 6 of 39

Philippe De Vries – Christ’l De Landtsheer: PERCEPTION POLITICS
There seems to be some disagreement in the scientific world about the influence and
importance of physical appearance. It is clear, however, that political support or
preference depends, at least in part, on citizen’s emotional responses after seeing or
hearing political candidates. Viewers, in forming or modifying more generalized
attitudes of support, integrate their immediate impressions and emotions with other
sources of information These emotional reactions, particularly if reinforced, can
become part of more enduring dispositions towards candidates or programs (Sullivan
& Masters, 1988). These rapid automatic inferences from the facial appearance of
political candidates influence the processing of subsequent information about these
candidates (Todorov, Mandisodza, Goren & Hall; 2005).
POLITICAL MARKETING
Considering the research discussed above one may conclude that politically relevant
images can be projected by a candidate's physical appearance. Politicians and their
entourage are very much aware of the power of the visual presentation. These
adjustable and changeable political relevant characteristics are not the least important
for political marketers. The attention for self-monitoring and strategic-self-
presentation therefore clearly is not excessive (Eagly, et al 1991). We are all to near to
the situation where the winner of an election can be predicted based on voter
responses to a candidate’s appearance. This finding has important implications for
social decision-making, the democratic process and political marketing (Newman,
1999; Zebrowitz & Montepare, 2005).
Page 7 of 39

Philippe De Vries – Christ’l De Landtsheer: PERCEPTION POLITICS
Newman (1999) draws the attention to the marketing strategies that drive the political
system. These strategies emphasize image over substance, personality over issues and
sound bites over dialogue. Political news coverage is treated like entertainment; it has
to be sharp, quick and amusing. It is broadly assumed that especially television has
transformed the electoral process in both the US (Ranney, 1983) and Europe (Blumer,
Cayrol & Thovenon; 1978). Defeated candidates almost literally ‘lose face’ in the
print media, winners are more likely to be shown happy and smiling (Masters, 1981;
Sulllivan & Masters, 2005). Distinguishing reality from fiction is becoming
increasingly difficult for citizens. Politics is waged in the media, with in the center of
it all the mechanisms that manufacture the images. In politics an image is created
through the use of visual impressions that are mostly communicated by the
candidate’s physical appearance, media appearance and experiences. These images
are integrated into the minds of citizens and they determine their candidate preference
(Newman, 1999). The power of these political messages has long time be
underestimated and even neglected.
PERCEPTION POLITICS
As Newman (1999) puts forward the modernization of politics that unfolded during
the last decades must be understood as a trend towards commercialization,
globalization, and visual culture. In this process mass media and television in
particular, play a prominent role (Holz-Bacha and Norris, 2001; Esser, 1999; Grabe,
Zhou and Barnett, 2001; Leroy and Siune, 1994). As a result of this modernization of
politics, a new dynamic in political communication can be distinguished. This trend,
in which dramatization of politics takes place according to the rules of media logic, is
Page 8 of 39

Philippe De Vries – Christ’l De Landtsheer: PERCEPTION POLITICS
referred to as perception politics. Information, politics and entertainment became
intertwined and evolved to infotainment and politainment where politicians obey to
the fast and crude rules of the media and turn politics into perception politics. Style
has become increasingly import to the expense of content which subsequently brings
us to the domain of political impression management. Recognizing the importance of
personality, physical appearance and other style elements the wangling and handling
of the impression is vital (McGraw, 2003; De Landtsheer, 2004; De Vries, De
Landtsheer & Vertessen, 2005).
EXPERIMENT
This experiment concentrates on the power and influence of the physical appearance
in politics. The greater part of research on this topic has been conducted in the United
States of America (Rosenberg, Bohan, McCafferty & Harris, 1986; Rosenberg &
McCafferty, 1987; Rosenberg & Kahn, 1987; Rosenberg, Kahn, Tran & Le, 1991). De
Landtsheer (2004) transposed and applied the results of this research to The
Netherlands and was able to retrieve similar results concerning the determinants of the
political suitable appearance. Keeping in mind that the United States of America is a
presidency whilst The Netherlands is a constitutional monarchy these similarities
were not evident. Elections in the United States of America result in a highly
mediatized race between a republican and a democratic candidate whereas the
political system in The Netherlands consists of several political parties represented by
several candidates, meaning two extremely different political systems. The Belgian
political system is highly comparable to the Dutch one and would enable us to draw
Page 9 of 39

Philippe De Vries – Christ’l De Landtsheer: PERCEPTION POLITICS
valid and verified conclusion concerning the European and American ideal political
physical appearance.
The main objective of this research is not to hand politicians and marketers the
necessary tools to create the ultimate political appearance, but to create an awareness
and interest for the strategies used to present politicians. This clarification should on
the other hand not be understood as an attempt to rebut the importance of research
vis-à-vis the role of physical appearance and personality in politics for this research
will indicate important questions need to be answered.
RESEARCH QUESTIONS
Three presuppositions are enunciated. Firstly this experiment is designed to retrieve if
the results found in the United States of America and The Netherlands can be
reproduced in Belgium. We anticipate recovering similar results as established in
previous studies which indicated that a political preferable appearance leads to higher
election chances (Roseberg, 1986 & 1991; De Landtsheer, 2004). If this hypothesis
can be confirmed a cross cultural preferable political appearance can be put forward
for the United States of America and Europe. Secondly the experiment will try to
unveil the interplay between political party slogan and the candidate image displayed.
Although previous research showed no significant influence of the political slogan we
hope to conclude otherwise (De Landtsheer, 2004). The third and last research
question articulated tries to uncover the interaction between the respondents’
demographic data - more specific gender, age, education and political affiliation - and
the preferred political appearance.
Page 10 of 39
Philippe De Vries – Christ’l De Landtsheer: PERCEPTION POLITICS
METHOD
In order to retrieve the power of physical appearance in Belgian politics, a mock
election was designed. Fifteen politicians from the City Council of Mortsel (an
average Belgian city with approximately 25,000 inhabitants) participated in the
experiment to create a realistic political campaign. The appearance of these politicians
was adjusted by stylists, hairdressers and make-up artists based on previous research
by De Landtsheer (2004) and inspired by Rosenberg (1986, 1987a, 1987b 1991). De
Landtsheer established a checklist of political suitable characteristics for male and
female politicians deduced from data delivered by both Belgian and Dutch
respondents. The results retrieved in these countries were almost identical with the
exception of facial hair. Dutch voters prefer their male politicians without moustache
and or beard, whereas this aspect of physical representation was of no importance to
Belgian voters. Male politicians should be over 35-40 years old and have a high
forehead, dark or grey hair, combed in parts. Blond and thick hair, uncombed or
sloppy hair is disadvantageously. Furthermore males should wear a classic dark suit
with white or pale blue shirt and colored tie. Sweaters, bright colors, white or Scottish
jackets are unfavorable. Female politicians are preferably over 40-45 years old. They
should have dark or grey hair and classic hair fashion, with short or medium length
hair. Blond loose hair is unfavorable. Formal dress is the most appropriate, classic
blouse and jacket in contrasting colors are the best. Bright colors, only dark colors,
showy patterns and naked arms are unfavorable (De Landtsheer, 2004).
Participants
Five hundred respondents took part in the experiment. Two hundred and thirty five of
them are female and two hundred and sixty five of them are male. Furthermore the
Page 11 of 39
Philippe De Vries – Christ’l De Landtsheer: PERCEPTION POLITICS
respondents were selected along different levels of education and age. Considering
that there are ten different sets in which each politician appears with the original or
adjusted appearance, every picture could be selected by two hundred and fifty
respondents as is explained below.
Stimulus material
Ten out of the fifteen participating City council members were selected for the data
collection. These ten politicians belonged to the five major Flemish political parties,
CD&V or the christian democratic party, VLD or the conservative liberal party, SP.a
or the social democratic party, Groen! or the green party and Vlaams Belang or the
extreme right party. For each political party one male and one female politician was
incorporated in the experiment (appendix 1 contains the original and the adjusted
pictures of each politician together with the political party he or she belongs to).
All politicians were photographed twice. Once as they would present themselves to
their voters - which is referred to as the original appearance - and once after their
physical appearance was manipulated - which is referred to as the adjusted appearance
- according to the research findings of De Landtsheer (2004) explained above. Both
pictures were divided over ten different sets of mock election-campaign-flyers. Each
set contained the same politicians, half the time with the adjusted, or political
favorable representation and half the time with the original appearance. Every picture
is accompanied by a political slogan from one of the five political parties the
politicians belong to. The photographs are divided between ten different sets so that
every politician, displayed in both the original and the adjusted appearance, is
represented with the slogan of each political party.
Page 12 of 39

Philippe De Vries – Christ’l De Landtsheer: PERCEPTION POLITICS
Procedure
Each of the five hundred respondents is presented with ten campaign flyers, which all
include a picture accompanied by a slogan. After examining both the messages and
the images the respondents are asked to indicate five politicians by answering the
question for whom they would possibly vote, starting of with their first and second
choice all the way to their fifth choice. This means that every respondent disregards
five politicians.
RESULTS
The results of this experiment will be discussed by answering the three research
questions postulated above. Firstly the results concerning the impact of the adjusted
political physical appearance are discussed. Secondly the interplay between party
slogan and image is unveiled and thirdly the interaction between the respondents’
demographic information (age, gender, education and political affiliation) and their
preferred physical appearance for politicians is discussed.
The impact of the adjusted physical political appearance.
Table 1 shows the results from the mock elections regarding the scores for each of the
ten politicians both in their original and adjusted political appearance (the original and
adjusted pictures are included in appendix 1). Knowing respondents were presented
with ten campaign flyers of which five had to be chosen, each respondent disregarded
five politicians. Table 1 contains the results for each politician. The column ‘not
chosen’ represents the number of times that a particular politician was not chosen
Page 13 of 39

Philippe De Vries – Christ’l De Landtsheer: PERCEPTION POLITICS
whilst the column ‘order’ simply indicates the ranking with 1 as the politician who
was most popular.
INSERT
Table 1: Scores for every politician in the original and adjusted political
appearance (2005 experiment with Belgian city council members).
The results above conclude that a politician presented with the adjusted political
appearance has an average 21,68% more possibility to be included among the
politicians perceived as most political suitable. Every politician, except subject 7
(Pooters), gains considerable and significant profit from adjusting his or her
appearance. In the case of subject 7 the pictures in appendix 1 show there is little
difference between the original and the adjusted appearance. We believe this to be the
explanation for her disappointing results.
The manipulation of subject 3 (De Ridder) on the other hand led to the highest
increase of voter preference. Portrayed with her original appearance only seventy
three respondents out of two hundred and fifty considered her among the most
political suitable candidates, whilst her figures rose to one hundred and seventy seven
with the manipulated political appearance (+38,4%). Also subject 8 (Van Campfort)
was able to boost her score from only nineteen voters to one hundred and thirteen
(+37,6%). Most popular politician is without a doubt subject 4 (Dupon). Presented
with the manipulated appearance more than 85% of respondents chose him among the
most political suitable candidates.
Page 14 of 39

Philippe De Vries – Christ’l De Landtsheer: PERCEPTION POLITICS
INSERT
Table 2: Ranking of the top-five male and female politicians with original and
adjusted political appearance (2005 experiment with Belgian city council members).
Table 2 shows that 67,7% of the male politicians and 66% of the female politicians
indicated as most political suitable are presented with the adjusted appearance,
whereas just 32,3% of male politicians and 34% of female politicians retrieved in the
first choice category are portrayed with their original appearance. The same trend is
observable for each category although the strength of the effect diminishes and is
almost neglectable for the fifth choice.
Another remarkable finding which is not retrievable in the table above concerns the
segmentation of first, second, third, fourth and fifth choices. When we take a look at
the division between the different choices one can observe that a politician presented
with his or her original image has a 23% chance to end up in the category fifth choice
whereas just 17% is assigned to the category first choice. For the politicians with the
adjusted political appearance the exact opposite is observable, meaning that pictures
with adjusted appearance have a 22,4% chance to be found in the category first choice
and 17,9% in the category fifth choice. In other words the exact opposite partition is
retrieved.
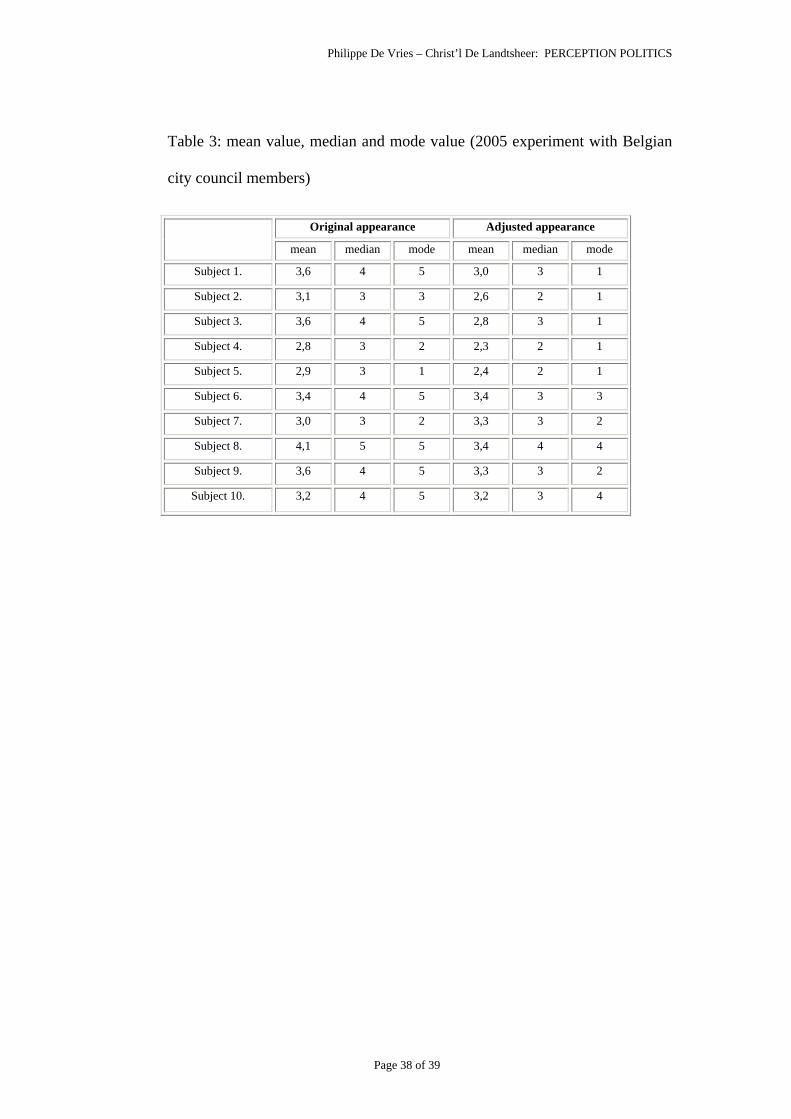
INSERT
Table 3: mean value, median and mode value (2005 experiment with Belgian city
council members).
Page 15 of 39

Philippe De Vries – Christ’l De Landtsheer: PERCEPTION POLITICS
In table 3 the represented values range between one and five where one stands for first
choice and five for fifth choice, meaning that the lower the value the better that
particular politician scored with that particular appearance. From table 3 can be
recovered that for each politician both the average, median as well as the mode moves
into the favorable direction when portrayed with the adjusted political appearance in
contrast to the original image. In other words each politician experiences a more
positive evaluation due to the appearance manipulation.
Considering the results above we can, without a doubt, conclude that the physical
appearance of politicians is a meaningful component of voter decision making. With
an average improvement of 21,68% appearance DOES matter, as Zebrowitz and
Montepare (2005) put forward. Most importantly these results confirm and affirm
previous research in the United States (Rosenberg, 1986, 1987a, 1987b 1991) and The
Netherlands (De Landtsheer, 2004) which leads us to believe European and American
perceptions of political suitability are very similar. These cross cultural analogies are
quite surprising seen the differences between both political systems. One should
expect physical appearance to be of greater importance in a presidency where
elections are run by political personalities whereas in Europe political parties still
have the upper hand, even though the personalization of politics is noticeable (Elms,
1976; Schwartzenberg, 1977; Caprara & Barbaranelli, 1999; Van Zoonen & Holtz-
Bacha, 2000; Caprara, Barbaranelli & Zimbardo, 2002; Carpini, & Williams, X).
The interplay between political party, slogan and image.
This second section will focus on the effect of the political slogan. The previous
section emphasized the importance of the physical appearance in Belgian politics
Page 16 of 39
Philippe De Vries – Christ’l De Landtsheer: PERCEPTION POLITICS
whilst the political message was disregarded. Each politician, both with original and
adjusted appearance, was presented with all five political slogans. Thereby the impact
of the political slogan and the interaction with the political image can be retrieved.
Firstly the results from the different political parties will be discussed. Figure 1
reports the top-five results for each political party, whereas figure 2 only considers the
first choices by political party.
INSERT
Figure 1: Overview of the first, second, third, fourth and fifth choices by political
party (2005 experiment with Belgian city council members).
INSERT
Figure 2: Overview of the first choices by political party (2005 experiment with
Belgian city council members).
Both figures indicate the positive effect of the adjusted political appearance on voter
preference. All political parties have a greater chance to be chosen when presented
with the political preferable appearance (figure 1). With regard to the first choice
results (figure 2) CD&V (christian democratic party), VLD (conservative liberal
party) and SP.a (social democratic party) seemingly gain the most benefit with the
adjusted appearance although Groen! (green party) and Vlaams Belang (extreme right
party) profit from the physical adjustments as well.
Page 17 of 39

Philippe De Vries – Christ’l De Landtsheer: PERCEPTION POLITICS
When all data are taken into consideration no significant correlation can be
demonstrated between political slogans and score. The different political slogans are
stated equally among the top five choices by the respondents. The results for original
and adjusted appearance show the same patterns and again indicate that no significant
interaction between political slogan and score is demonstrable. Looking at the
individual politicians and the political parties they belong to, once more no significant
relation can be retrieved.
At first sight these conclusions seem disappointing considering the manifest absence
of the relationship between the respondents’ choices and the political slogan for this
might indicate no importance is granted to the political message. Nonetheless
previous research in The Netherlands drew the same conclusions (De Landtsheer,
2004). In the next division respondents’ political preference is, along with
demographic information, linked to their preferred political physical appearance.
The interaction between the respondents’ demographic information and their
preferred physical appearance for politicians.
Firstly the relationship between the political ideology of the respondent and his or her
preferred physical appearance for politicians will be discussed. When the highest
score for each politician - in both original and adjusted version - is measured against
the respondents political preference only one significant correlation surfaces, more
specific this interaction is proven significant for subject 2 from the social democratic
party. Even when for the other politicians no significant relations are proven, some
conclusions can be drawn. Respondents who consider themselves as supporters of the
green ideas do not seem to prefer the more casual a-typical political appearance as one
Page 18 of 39
Philippe De Vries – Christ’l De Landtsheer: PERCEPTION POLITICS
should predict. Furthermore - as the data above already suggested - most respondents,
regardless of the political party they account themselves to, tend to prefer the
adjusted, political suitable appearance.
Secondly the respondents’ gender deserves attention and leads to some interesting
findings which are significant at the 0,000 level.
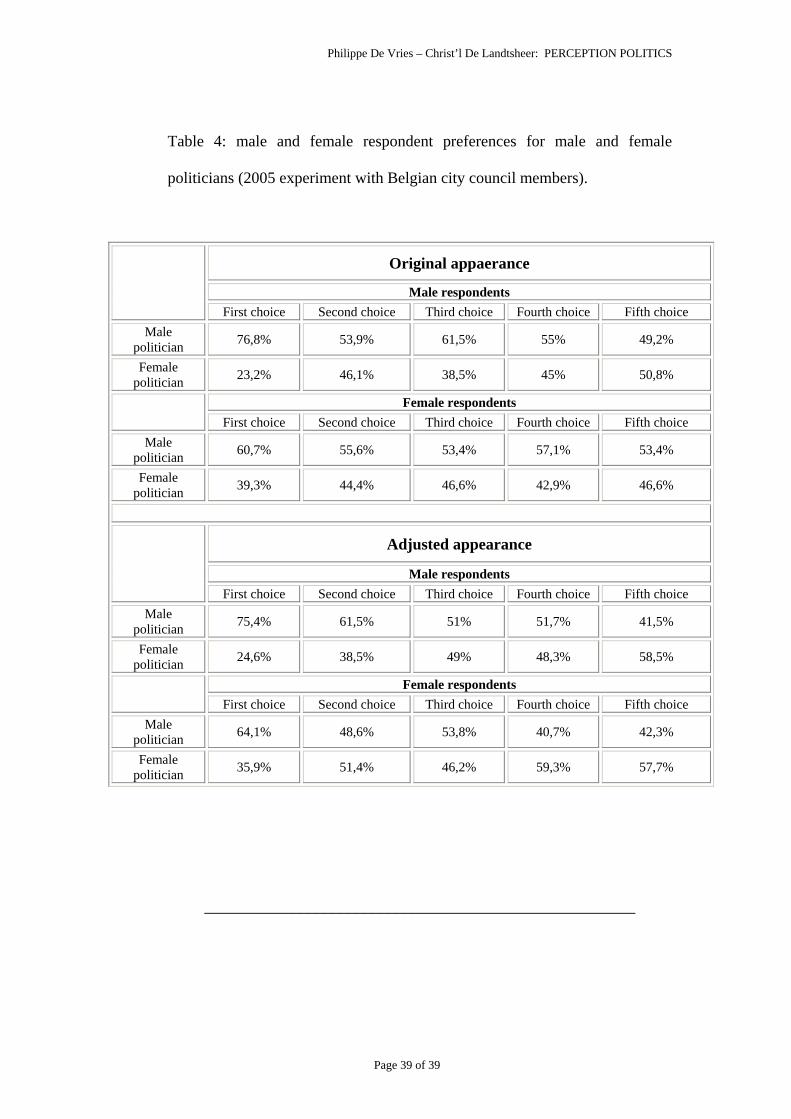
INSERT
Table 4: male and female respondent preferences for male or female politicians (2005
experiment with Belgian city council members).
The overall results from the original photographs indicate that 56,7% of the male and
52,4% of the female respondents tend to prefer male politicians to female politicians.
For each of the top five places the majority of the female respondents indicate a male
politician whereas data from the male respondents unveil the same pattern with the
exception of the fifth choice where 50,8% favors a female politician. The results from
the adjusted pictures on the other hand show a different pattern for the majority of
female respondents favor a female political candidate for their second (51,4%) , fourth
(59,3%) and fifth choice (57,7%). The data from the male respondents for the adjusted
political appearance shows very similar results as retrieved for the original pictures
since male respondents seem to prefer a male politician for the first (75,4%), second
(61,5%), third (51%) and fourth choice (51,7%). Again only with the fifth choice the
majority of male respondents favors a female politician (58,5%). These conclusions
may suggest that both according to male and female voters - conscious or unconscious
- the political suitable appearance is more important for female politicians than for
Page 19 of 39
Philippe De Vries – Christ’l De Landtsheer: PERCEPTION POLITICS
their male colleagues. Remarkably a vast majority of both male and female
respondents ascribe their first choice to male politicians (69,25%). These findings
confirm conclusions by Sigelman (1986, 1987) who postulated that men are most
reluctant to vote for women whilst the tendency for women to favor female candidates
was proven significantly less reliable. Furthermore he indicated that attractive male
candidates can take full advantage of the tendency to ascribe physical attractive
people positive characteristics whereas this is not always the case for female
candidates. The female physical attractive appearance mostly underlines the
femininity which means they are often perceived as not strong or efficient enough. On
the other hand women who appear too masculine come across as aggressive (Carroll,
1985).
Thirdly the different age categories demonstrate distinct outcomes. The adult data for
pictures with the original appearance demonstrate a clear preference for male
politicians in each possibility (first choice 67,6%, second 57,7%, third 68,4%, fourth
58,1% and fifth choice 53,8%). The results from the adult data for the adjusted
political appearance account for the trend explained above. From the adult data a
majority of the first choice politicians is male (70,5%) whilst the second (51%), third
(55,8%), fourth (54,7%) and fifth choice (64,4%) is more likely to be filled in by a
female politician. On the other hand one hundred and seventy five respondents are
younger than eighteen years of age and therefore haven’t got the privilege to vote in
Belgium. A remarkable result surfaces when we examine the results from this age-
group. If presented with the political original appearance the youngest respondents
tend to prefer female politicians (50,2%). When confronted with the adjusted pictures
they clearly favor male politicians (61,5%). These conclusions verify findings from
Page 20 of 39

Philippe De Vries – Christ’l De Landtsheer: PERCEPTION POLITICS
previous research that demonstrated the stereotype perceptions of politics by young
respondents (De Vries, De Landtsheer, Heirman & Boudini; 2005).
Fourthly the level of education is taken into consideration. A difference is made
between high and low levels of education. The category low education contains all the
respondents who posses no higher diploma than secondary education whilst high
education includes respondents who attended university or other types of advanced
education. The majority of respondents with low education tend to appoint a male
politician for both the original (53,2%) and the adjusted data (56,5%). Especially their
first choice seems to be a male politician with 69,4% for the original and 70,8% for
the adjusted pictures. The respondents with a higher education appear to have the
same preferences when it comes to the political suitable appearance with 66,7% male
politicians for the first choices with original appearance and 70,1% male politicians
for the first choices with adjusted appearance. We therefore dare to conclude that the
level of education has little to no influence on the preferred political appearance.
When all the above is taken into consideration we may conclude that for both original
and adjusted political appearance male politicians are preferred to female politicians.
In the categories and choices where female politicians take the majority they tend to
be portrayed with the political adjusted appearance which leads us to believe a
political suitable appearance is seemingly more important for female politicians as for
their male colleagues. Nevertheless there are no extreme differences noticeable,
between the results concerning gender, age or level of education. Most noteworthy
conclusion is the insignificant influence of the respondents’ political conviction on
voter preference.
Page 21 of 39

Philippe De Vries – Christ’l De Landtsheer: PERCEPTION POLITICS
DISCUSSION AND CONCLUSION
The results from this experiment undoubtably indicate the importance and influence
of the physical appearance in politics. Furthermore these conclusions link up perfectly
with previous research in the United States of America and The Netherlands,
indicating a strong and cross-cultural consensus about the political suitable
appearance in western democracies; which is consistent with findings by Masters and
Sullivan (1989). They indicated striking similarities in the system of perceived
political nonverbal behavior in France and the United States of America although
some small cultural differences could be demonstrated.
This research is imperative to learn more about the interactions and relations between
political perception and impression, political message and political appearances.
Especially in low information elections the physical appearance cues of political
candidates have been proven to be more important and decisive than candidate
experiences (Banducci, Thrasher, Rallings & Karp, 2003). The conclusions drawn in
this research demonstrate the detachment from the political slogan regardless the
respondent’s age, gender, political affiliation or level of education. At first sight these
conclusions may seem confusing. Nevertheless the extreme anxiety towards the
influence and power of the physical appearance or even personality in politics seems
misplaced. Ever since mankind walked the earth physical appearance has played an
important role in social relations. Why should facial cues or other physical inferences
be inferior to inferences from - for example - political discourse? The possibility of
manipulation has always been the prime concern - and therefore argument - to turn
against the influence of appearance and personality characteristics; even though
several studies have shown that inferences deduced from physical appearance,
Page 22 of 39

Philippe De Vries – Christ’l De Landtsheer: PERCEPTION POLITICS
personality and nonverbal behavior can be surprisingly accurate (Zebrowitz, Hall,
Murphy & Rhodes, 2002; Zebrowitz, Fellous, Mignault & Andreoletti, 2003; Todorov
et al, 2005; Zebrowitz et al, 2005).
Nonetheless a warning is imperative. The political world should be run by honest,
honorable and genuine politicians regardless personality, physical appearance
characteristics and or manipulated persuasive discourse. This idea, as enticing and
seductive as it sounds, is unfortunately not more than a utopian dream. Voters, male
or female, higher educated or not, rich or poor, European, African or American do
grant importance to several aspects of political personality and image. Or as Newman
(1999) proclaimed: “Politics comes down to gut reactions about politicians and their
ideas. The emotion that we feel when we watch leaders are an integral part of how we
judge politicians.”
The research reported in this paper clearly indicates the importance awarded to the
physical appearance of politicians initiated by gut reactions and emotions. Therefore
the question that needs to be addressed is which mechanisms underlie the reactions to
qualities like facial appearance as Zebrowitz suggests (2005), and which are the
instigators of these psychological processes. Further research is imperative to answer
these challenging questions.
_____________________________________________________________
Page 23 of 39

Philippe De Vries – Christ’l De Landtsheer: PERCEPTION POLITICS
REFERENCES:
Abelson, R., Kinder, D. & Peters, M. (1982). Affective and semantic Components in
Political Person Perception, Journal of Personality and Social Psychology, vol 42, no
4, 619-630.
Alderlich, J., Gronke, P. & Grynaviski, J. (1999). Policy, personality and Presidential
Performance. Paper presented at the Annual Meeting of the Midwest Political Science
Association, Chicago, April 15-18, 1999.
Andreoletti, C, Zebrowitz, L. & Lachman, M (2001). Physical Appearance and
Control Beliefs in Young, Middle-Aged, and Older Adults, Personality and Social
Psychology Bulletin, vol 27, no 8, 969-981.
Banducci, S., Thrasher, M., Rallings, C. & Karp, J. (2003). Candidate Appearance
Cues in Low-Information Elections, presented at the Annual Meeting of the American
Political Science Association,Philadelphia, 2003.
Bondanella, P. (2005). Niccolo Machiavelli: The Prince, Oxford: Universtity
Press,133p.
Blumer, J., Cayrol, R. & Thovenon, G. (1978). La Television fait elle l’election?,
Paris: Presses de la Fondation Nationale des Sciences Politiques.
Page 24 of 39
Philippe De Vries – Christ’l De Landtsheer: PERCEPTION POLITICS
Bucy, E. & Bradley, S. (2004). Presidential expressions and viewer emotion:
counterempathic responses to televised leader displays, Social Science Information,
vol 43, no 1, 59-94.
Caprara, G., Barbaranelli, C. & Zimbardo, P. (2002). When Parsimony Subdues
Distinctiveness: Simplified Public Perceptions of Politician’s Personalities, Political
Psychology, vol 23, no 1, 77-95.
Caprara, G. & Barbaranelli, C (1999). Personality Profiles and Political Parties,
Political Psychology, vol 20, no 1, 175-197.
Carroll, S. (1985). Women as Candidates in American Politics, Bloomington: Indiana
University Press.
Carpini, M. & Williams, B. (X). Let us Infotain You: Politics and the New Media
Environment, In L. Benett & R. Entman (Eds.): Mediated Politics. Communication in
the Future of Democracy, Cambridge: Cambridge University Press, 160-181.
Crandall, C. (1994). Prejudice against fat people: Ideology and self-interest, Journal
of Personality and Social Psychology, 66, 882-894.
De Landtsheer, C. (2004). Politiek impressiemanagement in Vlaanderen en in
Nederland, Acco, 172.
Page 25 of 39
Philippe De Vries – Christ’l De Landtsheer: PERCEPTION POLITICS
De Vries, P., De Landtsheer, C. & Vertessen D. (2005). Political Impression
Management and Perception Politics in Belgium. The way of Sound Bites, Personality
Profiles and Appearance Effectiveness of Politicians. Paper presented at the Political
Marketing and Democracy meeting, Kastoria, Greece, 2005.
De Vries, P., De Landtsheer, C., Heirman, W. & Boudini, K. (2005). The Ideal Mayor
seen through the eyes of children. A Belgian Case in Perception Politics. Paper
presented at the Conference on Marginality and Voice: Childhood in Sociology and
Society, Bergische University of Wuppertal, Germany, 2005.
Dion, K., Berscheid, E. & Walster, E. (1972). What is beautiful is good, Journal of
Personality and Social Psychology, vol 24, 285-290.
Eagly, A., Ashmore, R., Makhijani & Longo, L. (1991). What Is Good, But …: A
Meta-Analytic Review of Research on the Physical Attractiveness Stereotype,
Psychological Bullitin, vol 110, no 1, 109-128.
Elms, A. (1976). Personality in Politics, San Diego: Harcourt Brace Jovanovich
Publishers, 200p.
Esser, F.(1999). “Tabloidization” of news: A comparative analysis of Anglo-
American and German press journalism, European Journal of Communication, 14,
291-324.
Page 26 of 39

Philippe De Vries – Christ’l De Landtsheer: PERCEPTION POLITICS
Forsythe, S. (1999). Effects of applicants clothing on interviewer’s decision to hire.
Journal of Applied Social Psychology, 20, 1579-1595.
Giessner, S. & Schubert, T. (2005). Climbing up the hierarchy: How context
information on a vertical dimension in space influences leadership perceptions
regarding power, paper presented at the annual meeting of the International
Leadership Association, Amsterdam, 2005.
Grabe, M.E., Zhou, S., Barnett, B. (2001). Explicating Sensationalism in television
News: Content and the Bells and Whistles of Form, Journal of Broadcasting &
Electronic Media, 45 (4), 635-655.
Holtz-Bacha, C., Norris, P. (2001). “To Entertain, Inform, and Educate”: Still the
Role of Public Television. Political Communication, 18, 123-140.
Ilkka, R. (1995). Applicant Appearance and Selection Decision Making: Revitalizing
Employment Interview Education, Business Communication Quarterly, 11-18.
Jackson, L. & Ervin, K. (1992). Height stereotypes of women and men: The liabilities
of shortness for both sexes. Journal of Social Psychology, 132, 433-445.
Johnson, K & Roach-Higgins, M. (1987). The influence of physical attractiveness and
dress on campus recruiters’ impressions of female job applicants, Home Economics
Research Journal, 16, 87-95.
Page 27 of 39

Philippe De Vries – Christ’l De Landtsheer: PERCEPTION POLITICS
Keating, C., Randall, D. & Kendrick, T. (1999). Presidential Physiognomies: Altered
Images, Altered Perceptions, Political Psychology, vol 20, no 3, 593-610.
Leroy, P., Siune, K. (1994). The role of television in European elections: The cases of
Belgium and Denmark. European Journal of Communication, 9, 47-69.
Marcus, G. & MacKuen, M. (1993). Anxiety, Enthusiasm, and the Vote: The
Emotional Underpinnings of Learning and Involvement during Presidential
Campaigns, American Political Science Review, vol 87, no 3, 672-685.
Masters, R. (1981). Linking Ethnology and Political Science: Photographs, Political
Attention, and Presidential Elections, In M. Watts (Eds.) Bioploitics: Ethological and
Physiological Approaches. New Directions for Methodology of Social and Behavioral
Science, no 7, San Francisco: Jossey Bass, 61-80.
Masters, R. & Sullivan, D. (1989). Nonverbal Displays and Political Leadership in
France and The United States, Political behavior, vol 11, no 2, 123-156.
Masters, R. & Sullivan, D. (1993). Nonverbal Behavior and Leadership: Emotion and
Cognition in Political Information Processing, In S. Iyengard & W. Mc Guire (eds.)
Explorations in Political Psychology, Duke University Press: NC, 150-182.
McGraw, K. (2003). Political Impressions: Formation and Management, In D. Sears,
L. Huddy & R. Jervis (eds.) Oxford Handbook of Political Psychology, Oxford
University Press: Oxford, 394-432.
Page 28 of 39

Philippe De Vries – Christ’l De Landtsheer: PERCEPTION POLITICS
Newman, B. (1999). The Mass Marketing of Politics. Democracy in an Age of
Manufactured Images, Thousand Oaks: Sage Publications, 166.
Prodratz, K. & Dipboye, R. (2002). In Search of the “Beauty is Beastly” effect, paper
presented at the annual meeting of the Society for Industrial and Organizational
Psychology, Toronto, 2002.
Ranney, A (1983). Channels of Power: The impact of Television on American
Politics, New York: Basic Books, 207p.
Redlawsk, D. & Lau, R. (2003). Do Voters Want Candidates They Like or Candidates
they Agree With? Affect vs Cognition in Voter Decision Making, paper prepared for
the annual meeting of the Midwest Political Science Association, Chicago, 2003.
Riggio, R. & Throckmorton, B. (1988). The relative effects of verbal and nonverbal
behavior, appearance and social skills on evaluations made in hiring interviews.
Journal of Applied Social Psychology, 18, 331-348.
Rosenberg, S., Bohan, L., McCafferty, P. & Harris, K. (1986). The Image and the
Vote: The Effect of Candidate Presentation on Voter Preference, American Journal of
Political Science, vol 30, 108-27.
Rosenberg, S.W. & McCafferty, P. (1987a). The image and the vote: Manipulating
voters’ preferences. In: Public Opinion Quarterly, 51 (1): 31-47.
Page 29 of 39

Philippe De Vries – Christ’l De Landtsheer: PERCEPTION POLITICS
Rosenberg, S.W. & Kahn, S. (1987b). Creating a political image and manipulating
the vote: a preliminary report, Paper presented at the IXth Annual Scientific Meeting
of the International Society for Political Psychology, 5-7 July, 1987, San Francisco,
USA.
Rosenberg, S., Kahn, S., Tran, T. & Le, M. (1991). Creating a Political Image:
Shaping Appearance and Manipulating the Vote, Political Behavior, vol 13, no 4,
345-367.
Schwartzenberg, R. (1977). Politieke superstars. Vedettencultus in de politiek,
Standaard uitgeverij, 355p.
Sigelman, C., Thomas, D., Sigelman, L. & Ribich, F. (1986). Gender, Physical
Attractiveness, and Electability: An Experimental Investigation of Voter Biases,
Journal of Applied Social Psychology, 16, 229-248.
Sigelman, L., Sigelman, C. & Fowler, C. (1987). A bird of different feather? An
experimantal investigation of physical attractiveness and the electability of female
candidates, Social Psychological Quaterly, vol 50, 32-43.
Sullivan, D., & Masters, R. (1988). “Happy Warriors”: Leaders’ Facial Displays,
Viewers’ Emotions, and Political Support, American Journal of Political Science, vol
32, no 2, 345-368.
Page 30 of 39

Philippe De Vries – Christ’l De Landtsheer: PERCEPTION POLITICS
Sulllivan, D. & Masters, R. (2005). “Gut Reactions” and the Political Effect of the
Media, in publication with the American Political Science Association.
Todorov, A., Mandisodza, A., Goren, A. & Hall, C. (2005). Inferences of Competence
from Faces Predict Election Outcomes, Science, vol 308, 1623-1626.
Van Zoonen, L. & Holtz-Bacha (2000). Personalization in Dutch and German
Politics: The Case of Talk Show, The Public, vol 7, no 2, 45-56.
Zajonc, R. (1980). Feeling and thinking: Preferences need no inferences, American
Psychologist, 35, 151-175.
Zebrowitz, L, Hall, J., Murphy, N. & Rhodes, G. (2002). Looking Smart and Looking
Good: Facial Cues to Intelligence and Their Origins, Personality and Social
Psychology Bulletin, vol 28, no 2, 238-249.
Zebrowitz, L., Fellous, J., Mignault, A. & Andreoletti, C (2003). Trait Impressions as
Overgeneralized Responses to Adaptively Significant Facial Qualities: Evidence from
Connectionist Modeling, Personality and Social Psychology Review, vol 7, no 3, 194-
215.
Zebrowitz, L & Montepare, J. (2005). Appearance DOES Matter, Science, vol 308,
1565-1566.
_________________________________________________________
Page 31 of 39

Philippe De Vries – Christ’l De Landtsheer: PERCEPTION POLITICS
Appendix 1: Photographs of original and adjusted appearance of the ten
Belgian city counsel politicians.
Subject 1 Subject 2 Vlaams Belang (extreme right party) SP.a (socialist democratic party)
De Backer De Richter Original Adjusted Original Adjusted
Subject 3 Subject 4 CD&V ( christian democratic party) VLD (conservative liberal party)
De Ridder Dupon Original Adjusted Original Adjusted
Subject 5 Subject 6 Groen! (green party) Groen! (green party)
Duré Lambert Original Adjusted Original Adjusted
Page 32 of 39

Philippe De Vries – Christ’l De Landtsheer: PERCEPTION POLITICS
Appendix 1: continued
Subject 7 Subject 8 VLD (conservative liberal party) Vlaams Belang (extreme right party)
Pooters Van Campfort Original Adjusted Original Adjusted
Subject 9 Subject 10 SP.a (socialist democratic party) CD&V ( christian democratic party)
Van de Velde Vernieuwe Original Adjusted Original Adjusted
Page 33 of 39

Philippe De Vries – Christ’l De Landtsheer: PERCEPTION POLITICS
Figure 1: Overview of the first, second, third, fourth and fifth choices by
political party (2005 experiment with Belgian city council members).
050
100150200250300350
CD&V VLD SP.A Groen! VlaamsBelang
original appearanceadjusted appearance
Page 34 of 39

Philippe De Vries – Christ’l De Landtsheer: PERCEPTION POLITICS
Figure 2: Overview of the first choices by political party (2005 experiment
with Belgian city council members).
0102030405060708090
CD&V VLD SP.A Groen! VlaamsBelang
original appearanceadjusted appearance
Page 35 of 39

Table 1: Scores for every politician in the original and adjusted political
appearance (2005 experiment with Belgian city council members).
Score original
appearance Not
chosen Order Score
adjusted appearance
Not chosen
Order Difference
Subject 1. De Backer
67 26,8%
183 73,2% 7 138
55,2% 112
44,8% 6 + 28,4%
Subject 2. De Richter
121 48,4%
129 51,6% 4 170
68,0% 80
32% ¾ + 19,6%
Subject 3. De Ridder
73 29,2%
177 70,8% 6 169
67,6% 81
32,4% 5 + 38,4%
Subject 4. Dupon
163 65,2%
87 34,8% 2 214
85,6% 36
14,4% 1 + 20,4%
Subject 5. Duré
156 62,4%
94 37,6% 3 188
75,2% 62
24,8% 2 + 12,8%
Subject 6. Lambert
93 37,2%
157 62,8% 5 116
46,4% 134
53,6% 8 + 9,2%
Subject 7. Pooters
176 70,4%
74 29,6% 1 170
68,0% 80
32% ¾ - 2,4%
Subject 8. Van
Campfort
19 7,6%
231 92,4% 10 113
45,2% 137
54,8% 9 + 37,6%
Subject 9. Van de Velden
58 23,2%
192 76,8% 8 131
52,4% 119
47,6% 7 + 29,2%
Subject 10. Vernieuwe
52 20,8%
198 79,2% 9 111
44,4% 139
55,6% 10 + 23,6%

Philippe De Vries – Christ’l De Landtsheer: PERCEPTION POLITICS
Table 2: Ranking of the top-five male and female politicians with original and
adjusted political appearance (2005 experiment with Belgian city council
members).
ranking original /adjusted appearance frequency percentage male 114 32,3%
original female 52 34% male 239 67,7%
1 adjusted
female 101 66% male 98 35,6%
original female 81 36,5% male 177 64,4%
2 adjusted
female 141 63,5% male 114 42,1%
original female 83 36,7% male 157 57,9%
3 adjusted
female 143 63,3% male 118 46,8%
original female 93 37,3% male 134 53,2%
4 adjusted
female 156 62,7% male 115 50,2%
original female 110 41% male 114 49,8%
5 adjusted
female 158 59%
Page 37 of 39
Philippe De Vries – Christ’l De Landtsheer: PERCEPTION POLITICS
Table 3: mean value, median and mode value (2005 experiment with Belgian
city council members)
Original appearance Adjusted appearance
mean median mode mean median mode
Subject 1. 3,6 4 5 3,0 3 1
Subject 2. 3,1 3 3 2,6 2 1
Subject 3. 3,6 4 5 2,8 3 1
Subject 4. 2,8 3 2 2,3 2 1
Subject 5. 2,9 3 1 2,4 2 1
Subject 6. 3,4 4 5 3,4 3 3
Subject 7. 3,0 3 2 3,3 3 2
Subject 8. 4,1 5 5 3,4 4 4
Subject 9. 3,6 4 5 3,3 3 2
Subject 10. 3,2 4 5 3,2 3 4
Page 38 of 39
Philippe De Vries – Christ’l De Landtsheer: PERCEPTION POLITICS
Table 4: male and female respondent preferences for male and female
politicians (2005 experiment with Belgian city council members).
Original appaerance
Male respondents
First choice Second choice Third choice Fourth choice Fifth choice Male
politician 76,8% 53,9% 61,5% 55% 49,2%
Female politician 23,2% 46,1% 38,5% 45% 50,8%
Female respondents First choice Second choice Third choice Fourth choice Fifth choice
Male politician 60,7% 55,6% 53,4% 57,1% 53,4%
Female politician 39,3% 44,4% 46,6% 42,9% 46,6%
Adjusted appearance
Male respondents
First choice Second choice Third choice Fourth choice Fifth choice Male
politician 75,4% 61,5% 51% 51,7% 41,5%
Female politician 24,6% 38,5% 49% 48,3% 58,5%
Female respondents First choice Second choice Third choice Fourth choice Fifth choice
Male politician 64,1% 48,6% 53,8% 40,7% 42,3%
Female politician 35,9% 51,4% 46,2% 59,3% 57,7%
______________________________________________________
Page 39 of 39