Perception of Vocal Tremor - UCLA Health Voice... · Kreiman et al.: Perception of Vocal Tremor 205...
13
203 Journal of Speech, Language, and Hearing Research • Vol. 46 • 203–214 • February 2003 • ©American Speech-Language-Hearing Association 1092-4388/03/4601-0203 Jody Kreiman Brian Gabelman Bruce R. Gerratt The David Geffen School of Medicine at UCLA Los Angeles, CA Perception of Vocal Tremor Vocal tremors characterize many pathological voices, but acoustic-perceptual aspects of tremor are poorly understood. To investigate this relationship, 2 tremor models were implemented in a custom voice synthesizer. The first modulated fundamental frequency (F0) with a sine wave. The second provided irregular modulation. Control parameters in both models were the frequency and ampli- tude of the F0 modulating waveform. Thirty-two 1-s samples of /a/, produced by speakers with vocal pathology, were modeled in the synthesizer. Synthetic copies of each vowel were created by using tremor parameters derived from different features of F0 versus time plots of the natural stimuli or by using parameters chosen to match the original stimuli perceptually. Listeners compared synthetic and original stimuli in 3 experiments. Sine wave and irregular tremor models both provided excellent matches to subsets of the voices. The perceptual impor- tance of the shape of the modulating waveform depended on the severity of the tremor, with the choice of tremor model increasing in importance as the tremor increased in severity. The average frequency deviation from the mean F0 proved a good predictor of the perceived amplitude of a tremor. Differences in tremor rates were easiest to hear when the tremor was sinusoidal and of small amplitude. Differences in tremor rate were difficult to judge for tremors of large amplitude or in the context of irregularities in the pattern of frequency modulation. These results suggest that difference limens are larger for modulation rates and amplitudes when the tremor pattern is complex. Further, tremor rate, regularity, and ampli- tude interact, so that the perceptual importance of any one dimension depends on values of the others. KEY WORDS: vocal tremor, vocal quality, speech synthesis, analysis by synthesis, vocal pathology S teady state phonation is never perfectly steady. Phonation is char- acterized by slow modulations of fundamental frequency, usually in the range of 2–12 Hz, that reflect normal instabilities in hu- man neurological control (e.g., Aronson, Ramig, Winholtz, & Silber, 1992; Titze, 1994). Although such modulations in normal voices are usually not perceptually prominent, these slight tremors contribute to the natu- ral quality of the voice. More extreme and perceptually salient patterns of variability may also occur and are important aspects of overall vocal quality. Perceptually salient frequency modulations that are enhanced and exploited for artistic purposes in singing are usually called vibrato, and prominent, involuntary modulations are termed tremor (Titze, 1995a). Both tremor and vibrato are commonly (and somewhat vaguely) defined as quasi-periodic, quasi-sinusoidal modulations of the funda- mental frequency of phonation (e.g., Hibi & Hirano, 1995; Horii, 1989b; Morsomme, Orban, Remacle, & Jamart, 1997). Sundberg (1995) pro- posed four parameters to describe frequency modulations in vibrato: the rate of fundamental frequency (F0) modulation, its amplitude or extent
Transcript of Perception of Vocal Tremor - UCLA Health Voice... · Kreiman et al.: Perception of Vocal Tremor 205...

Kreiman et al.: Perception of Vocal Tremor 203Journal of Speech, Language, and Hearing Research • Vol. 46 • 203–214 • February 2003 • ©American Speech-Language-Hearing Association1092-4388/03/4601-0203
Jody KreimanBrian GabelmanBruce R. Gerratt
The David Geffen Schoolof Medicine at UCLA
Los Angeles, CA
Perception of Vocal Tremor
Vocal tremors characterize many pathological voices, but acoustic-perceptualaspects of tremor are poorly understood. To investigate this relationship, 2 tremormodels were implemented in a custom voice synthesizer. The first modulatedfundamental frequency (F0) with a sine wave. The second provided irregularmodulation. Control parameters in both models were the frequency and ampli-tude of the F0 modulating waveform. Thirty-two 1-s samples of /a/, produced byspeakers with vocal pathology, were modeled in the synthesizer. Synthetic copiesof each vowel were created by using tremor parameters derived from differentfeatures of F0 versus time plots of the natural stimuli or by using parameterschosen to match the original stimuli perceptually. Listeners compared syntheticand original stimuli in 3 experiments. Sine wave and irregular tremor modelsboth provided excellent matches to subsets of the voices. The perceptual impor-tance of the shape of the modulating waveform depended on the severity of thetremor, with the choice of tremor model increasing in importance as the tremorincreased in severity. The average frequency deviation from the mean F0 proveda good predictor of the perceived amplitude of a tremor. Differences in tremorrates were easiest to hear when the tremor was sinusoidal and of small amplitude.Differences in tremor rate were difficult to judge for tremors of large amplitude orin the context of irregularities in the pattern of frequency modulation. These resultssuggest that difference limens are larger for modulation rates and amplitudeswhen the tremor pattern is complex. Further, tremor rate, regularity, and ampli-tude interact, so that the perceptual importance of any one dimension depends onvalues of the others.
KEY WORDS: vocal tremor, vocal quality, speech synthesis, analysis bysynthesis, vocal pathology
S teady state phonation is never perfectly steady. Phonation is char-acterized by slow modulations of fundamental frequency, usuallyin the range of 2–12 Hz, that reflect normal instabilities in hu-
man neurological control (e.g., Aronson, Ramig, Winholtz, & Silber, 1992;Titze, 1994). Although such modulations in normal voices are usuallynot perceptually prominent, these slight tremors contribute to the natu-ral quality of the voice. More extreme and perceptually salient patternsof variability may also occur and are important aspects of overall vocalquality. Perceptually salient frequency modulations that are enhancedand exploited for artistic purposes in singing are usually called vibrato,and prominent, involuntary modulations are termed tremor (Titze,1995a).
Both tremor and vibrato are commonly (and somewhat vaguely)defined as quasi-periodic, quasi-sinusoidal modulations of the funda-mental frequency of phonation (e.g., Hibi & Hirano, 1995; Horii, 1989b;Morsomme, Orban, Remacle, & Jamart, 1997). Sundberg (1995) pro-posed four parameters to describe frequency modulations in vibrato: therate of fundamental frequency (F0) modulation, its amplitude or extent

204 Journal of Speech, Language, and Hearing Research • Vol. 46 • 203–214 • February 2003
about the mean F0 (usually 0.5–2 semitones; see Horii,1989a, for review), the shape of the modulating wave-form (generally more or less sinusoidal; Horii, 1989b),and the consistency of the frequency, amplitude, andshape of the modulating waveform. Tremor has beenstudied much less than vibrato, and description of vocaltremors in terms of these (or other) parameters is lack-ing. Existing studies of tremor have focused almost ex-clusively on acoustic measures of tremor rates and co-occurring short-term F0 variations like jitter and shimmer(e.g., Ackermann & Ziegler, 1994; Brown & Simonson,1963; Ramig & Shipp, 1987). The pattern and regular-ity of long-term F0 modulations have not been studiedin tremulous pathologic voices, but informal observa-tions have revealed large departures from sinusoidalityand regularity (e.g., Ackermann & Ziegler, 1994; Aronsonet al., 1992). The perceptual importance of these differ-ent aspects of frequency modulation in pathologic voicehas also never been investigated. Thus, the literature doesnot provide a clear description of vocal tremor or a way ofpredicting whether a voice will sound tremulous ortremor-free. In fact, authors have seemed uncertainabout whether tremor is a single phenomenon or severaldifferent phenomena reflecting different underlying pa-thologies. Terms like flutter and wow have been proposedto designate different modulation rates (Aronson et al.,1992; Titze, 1994), although pathologic voices do not al-ways have a single clear rate of frequency modulation(Aronson et al., 1992; Winholtz & Ramig, 1992).
Further, studies of the acoustic characteristics of fre-quency modulation provide only a partial insight intovocal tremor, because they do not describe how the acous-tic features of tremors determine their perceptual sa-lience. Judgments about voice disorders by patients andclinicians are heavily influenced by their perception ofvocal deviation, so knowledge about vocal tremor per-ception is important. Unless the perceptual relevanceof acoustic characteristics is known, there is no way todetermine what acoustic features are important to lis-teners or how to measure them to best represent theperceived tremor. Speech synthesis allows experimen-tal investigation of hypotheses about acoustic-percep-tual relations and provides a method to manipulate can-didate acoustic variables, whose perceptual significanceis then assessed by presentation to listeners. In this way,synthesis offers a technique for identifying and quanti-fying the perceptually important acoustic characteris-tics of vocal tremors, and, thus, for finding evidence tohelp resolve many issues surrounding the descriptionof frequency modulation in pathological voices.
This study describes such an investigation. We mea-sured F0 variation over time for a variety of pathologicalvoices, synthetically copied the voices using differentmodels of this variation, and then used listener judgmentsto determine how well these acoustic models captured
the perceptually salient characteristics of the frequencymodulations. In Experiment 1 we examined the percep-tual importance of the shape and regularity of the modu-lating waveform; in Experiment 2 we examined the per-ceptual significance of the amplitude of frequencymodulation; and in Experiment 3 we examined the im-portance of the rate of frequency modulation.
Analysis and Synthesis TechniquesOverview
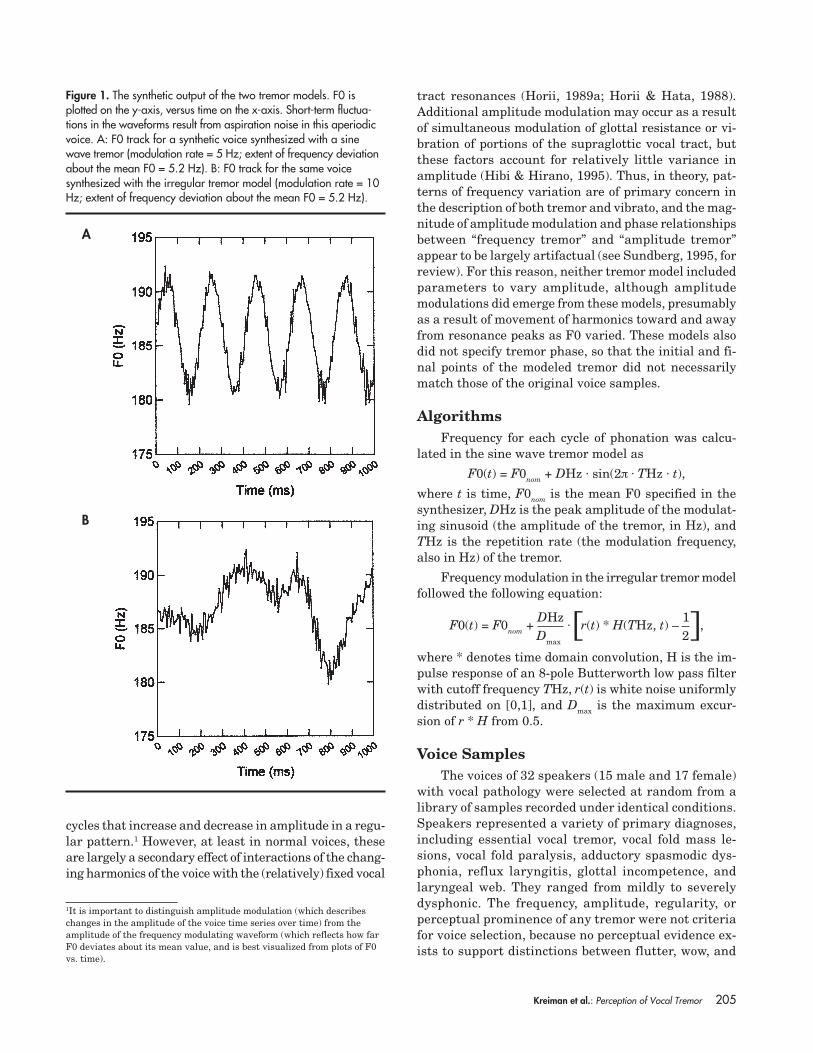
Because it is unclear what acoustic parametersshould be used to describe frequency modulation inpathological voices, Sundberg’s (1995) four-parametercharacterization of vibrato was adopted as a frameworkfor analysis and synthesis, with one modification. Acous-tic analyses and pilot perceptual studies indicated thatfrequency modulation in many pathological voices is bothnonsinusoidal in shape and irregular in rate. Therefore,we assumed that irregularities in the pattern of fre-quency modulation do not occur without simultaneousirregularities in the frequency of modulation. Given thisassumption, we combined the shape and regularity ofthe modulating waveform into a single binary “waveshape” parameter, which allowed the experimenter toselect a sine wave or irregular tremor model. Figure 1illustrates these models. Figure 1A shows the F0 trackfor a synthetic voice synthesized with a sine wave tremor,which sinusoidally modulates F0 above and below itsspecified mean value, and a typical output of the irregu-lar tremor model is shown in Figure 1B. In this model,the pattern of irregular F0 modulation is established bypassing white noise through an 8-pole Butterworth low-pass filter with cutoff frequency equal to the maximummodulation rate (which is described next). This producesan irregular pattern of frequency modulation. Note thatthe pattern of modulation remains independent of therate of modulation in this framework. For example, trem-ors can be created for which F0 changes slowly but ir-regularly, quickly but irregularly, and so on.
The rate and amplitude of frequency modulation(i.e., how fast F0 varied and how far it varied above andbelow the mean F0) can also be manipulated indepen-dently in both the sine wave and irregular tremor mod-els. In the sine wave model, the rate of frequency modu-lation represents the frequency of the modulating sinewave. In the irregular tremor model, the frequencymodulation rate represents the maximum rate of changein F0. When this irregular model is applied, the synthe-sizer output in tremor cycles/second is approximatelyhalf the nominal value of this parameter. Therefore,parameter values were doubled when the irregularmodel was applied.
Amplitude modulations may occur along with fre-quency modulations in speech waveforms, resulting in
Kreiman et al.: Perception of Vocal Tremor 205
cycles that increase and decrease in amplitude in a regu-lar pattern.1 However, at least in normal voices, theseare largely a secondary effect of interactions of the chang-ing harmonics of the voice with the (relatively) fixed vocal
tract resonances (Horii, 1989a; Horii & Hata, 1988).Additional amplitude modulation may occur as a resultof simultaneous modulation of glottal resistance or vi-bration of portions of the supraglottic vocal tract, butthese factors account for relatively little variance inamplitude (Hibi & Hirano, 1995). Thus, in theory, pat-terns of frequency variation are of primary concern inthe description of both tremor and vibrato, and the mag-nitude of amplitude modulation and phase relationshipsbetween “frequency tremor” and “amplitude tremor”appear to be largely artifactual (see Sundberg, 1995, forreview). For this reason, neither tremor model includedparameters to vary amplitude, although amplitudemodulations did emerge from these models, presumablyas a result of movement of harmonics toward and awayfrom resonance peaks as F0 varied. These models alsodid not specify tremor phase, so that the initial and fi-nal points of the modeled tremor did not necessarilymatch those of the original voice samples.
AlgorithmsFrequency for each cycle of phonation was calcu-
lated in the sine wave tremor model as
F0(t) = F0nom + DHz ⋅ sin(2π ⋅ THz ⋅ t),
where t is time, F0nom is the mean F0 specified in thesynthesizer, DHz is the peak amplitude of the modulat-ing sinusoid (the amplitude of the tremor, in Hz), andTHz is the repetition rate (the modulation frequency,also in Hz) of the tremor.
Frequency modulation in the irregular tremor modelfollowed the following equation:
where * denotes time domain convolution, H is the im-pulse response of an 8-pole Butterworth low pass filterwith cutoff frequency THz, r(t) is white noise uniformlydistributed on [0,1], and Dmax is the maximum excur-sion of r * H from 0.5.
Voice SamplesThe voices of 32 speakers (15 male and 17 female)
with vocal pathology were selected at random from alibrary of samples recorded under identical conditions.Speakers represented a variety of primary diagnoses,including essential vocal tremor, vocal fold mass le-sions, vocal fold paralysis, adductory spasmodic dys-phonia, reflux laryngitis, glottal incompetence, andlaryngeal web. They ranged from mildly to severelydysphonic. The frequency, amplitude, regularity, orperceptual prominence of any tremor were not criteriafor voice selection, because no perceptual evidence ex-ists to support distinctions between flutter, wow, and
1It is important to distinguish amplitude modulation (which describeschanges in the amplitude of the voice time series over time) from theamplitude of the frequency modulating waveform (which reflects how farF0 deviates about its mean value, and is best visualized from plots of F0vs. time).
Figure 1. The synthetic output of the two tremor models. F0 isplotted on the y-axis, versus time on the x-axis. Short-term fluctua-tions in the waveforms result from aspiration noise in this aperiodicvoice. A: F0 track for a synthetic voice synthesized with a sinewave tremor (modulation rate = 5 Hz; extent of frequency deviationabout the mean F0 = 5.2 Hz). B: F0 track for the same voicesynthesized with the irregular tremor model (modulation rate = 10Hz; extent of frequency deviation about the mean F0 = 5.2 Hz).
A
B
F0(t) = F0nom + DHz
⋅ r(t) * H(THz, t) – 1
,Dmax 2[ ]
206 Journal of Speech, Language, and Hearing Research • Vol. 46 • 203–214 • February 2003
tremor. Further, by including voices that varied widelyin tremor prominence, we hoped to learn which acousticcharacteristics affect the perceptual salience of a tremor.Five experienced listeners (including the first and thirdauthors) assessed tremor severity for each voice on a 3-point scale. All ratings for each voice agreed exactly orwithin one scale value, which was considered adequatefor the rather coarse level of measurement required here.Accordingly, these values were averaged and used toplace voices into one of three categories according totremor severity. Seven voices had mild tremors (meanrating for each voice < 1.5; SD across raters and voices= 0.28), 20 voices had moderate-to-prominent tremors(1.5 < mean rating < 2.2; SD = 1.62), and 5 voices hadsevere tremors (mean rating > 2.2; SD = 0.65).
Speakers were recorded as part of a clinical phona-tory function analysis. They were asked to sustain thevowel /a/ for as long as possible, at comfortable levels ofpitch and loudness. Voice signals were transduced witha 1" Bruel and Kjaer condenser microphone held a con-stant 5 cm off axis. Voice samples were low-pass filteredat 8 kHz and digitized at 20 kHz. A 1-s segment wasexcerpted from the middle of these productions,antialias-filtered, and downsampled to 10 kHz for fur-ther analysis.
Analyses of Fundamental FrequencyFrequency analyses were undertaken to provide
estimates of the parameters needed to synthesize trem-ors. For each original voice sample, a negative peak,positive peak, or zero crossing that could be reliably iden-tified for each cycle throughout the voice time series wasselected. This event was marked throughout the sampleby an automatic algorithm. Event marking was verifiedby the first author. For highly aperiodic stimuli, eventlocations cannot be considered precise by the standardsof perturbation analysis (e.g., Titze, 1995b), but repeatanalyses of the most severely aperiodic voices indicatedthat locations were replicable within ±2 samples (a rangeof 0.4 ms). Because these values are considerably lessthan the just-noticeable differences for F0 in this range(which are greater than 2 Hz; e.g., Rossing, 1990), thisrelatively coarse resolution was considered sufficient fortremor modeling. The frequency of phonation was cal-culated for each marked cycle of phonation and roundedto the nearest 0.1 Hz for subsequent analyses.
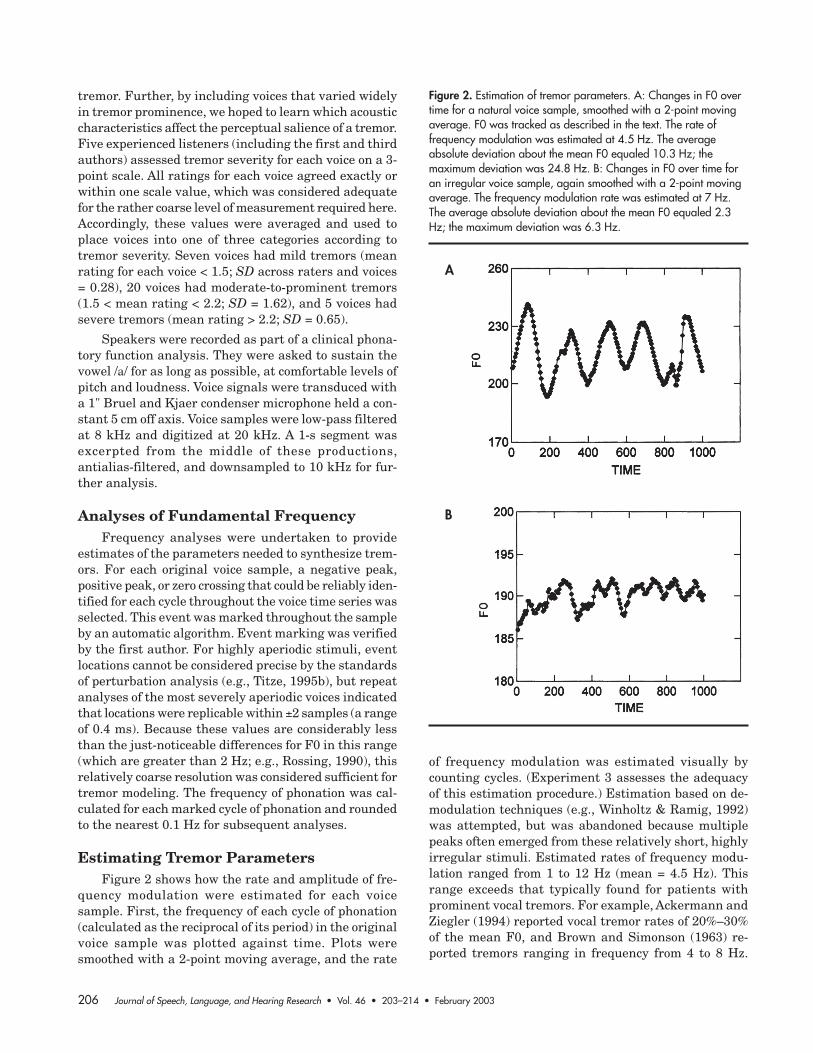
Estimating Tremor ParametersFigure 2 shows how the rate and amplitude of fre-
quency modulation were estimated for each voicesample. First, the frequency of each cycle of phonation(calculated as the reciprocal of its period) in the originalvoice sample was plotted against time. Plots weresmoothed with a 2-point moving average, and the rate
of frequency modulation was estimated visually bycounting cycles. (Experiment 3 assesses the adequacyof this estimation procedure.) Estimation based on de-modulation techniques (e.g., Winholtz & Ramig, 1992)was attempted, but was abandoned because multiplepeaks often emerged from these relatively short, highlyirregular stimuli. Estimated rates of frequency modu-lation ranged from 1 to 12 Hz (mean = 4.5 Hz). Thisrange exceeds that typically found for patients withprominent vocal tremors. For example, Ackermann andZiegler (1994) reported vocal tremor rates of 20%–30%of the mean F0, and Brown and Simonson (1963) re-ported tremors ranging in frequency from 4 to 8 Hz.
Figure 2. Estimation of tremor parameters. A: Changes in F0 overtime for a natural voice sample, smoothed with a 2-point movingaverage. F0 was tracked as described in the text. The rate offrequency modulation was estimated at 4.5 Hz. The averageabsolute deviation about the mean F0 equaled 10.3 Hz; themaximum deviation was 24.8 Hz. B: Changes in F0 over time foran irregular voice sample, again smoothed with a 2-point movingaverage. The frequency modulation rate was estimated at 7 Hz.The average absolute deviation about the mean F0 equaled 2.3Hz; the maximum deviation was 6.3 Hz.
A
B

Kreiman et al.: Perception of Vocal Tremor 207
However, those studies included only patients whoseprimary presenting complaint was tremor, and patientswith milder symptoms were excluded from study (butwere included here).
Because it is not known which aspects of frequencyvariation are perceptually important in tremor, two pro-cedures were used to estimate the extent of frequencyvariation above and below the mean F0 (the tremor am-plitude). In the first, tremor amplitude was estimated bycalculating the absolute difference between the frequencyof each phonatory cycle and the mean frequency over theentire voice sample. The mean of these absolute differ-ences was used as the initial estimate of tremor ampli-tude. In the second procedure, tremor amplitude was es-timated on the basis of the maximum deviations aboveand below the mean F0. In this case, the absolute differ-ences between the mean frequency and the maximumand minimum F0 values in each sample were calculated,and the average of these two values was used as the esti-mate of tremor amplitude. Estimates of tremor ampli-tude based on average deviations from the mean F0ranged from 0.6 Hz to 10.3 Hz (M = 2.5 Hz); estimatesbased on the maximum and minimum frequenciesranged from 2 Hz to 24.8 Hz (M = 7.3 Hz)—a significantdifference (mean difference = 4.8 Hz), matched-pairst(31) = –9.74, p < .01.
Voice SynthesisEvery voice was modeled with both the sine wave
and irregular tremor models, the relative merits of whichwere assessed in Experiment 1. A formant synthesizerimplemented in MATLAB (MathWorks, 2001) allowedusers to specify F0, the shape of the estimated volumevelocity derivative, the spectrum of the inharmonic com-ponent of the voice (the noise spectrum), signal-to-noiseratio, formant frequencies and bandwidths, and thetremor parameters described above.2,3 Initial parameterestimates for synthesis were derived from acoustic analy-ses of the voices as follows. Formant frequencies andbandwidths were estimated using autocorrelation lin-ear predictive coding (LPC) analysis (e.g., Markel &Gray, 1976) with a window of 25.6 ms (increased to 51.2ms when stimulus F0 was near or below 100 Hz). A pre-liminary estimate of the volume velocity derivative wasderived by inverse filtering a single glottal pulse fromthe microphone recordings. The resulting waveform wasfit with a Liljencrants-Fant (LF) source model (Fant,Liljencrants, & Lin, 1985), the parameters of which thenspecified the harmonic part of the source (see Gerratt &Kreiman, 2001, for further details). The frequency of
this cycle (i.e., the reciprocal of its period, as above)served as the initial value of F0. The noise spectrumwas estimated by a cepstral-domain comb filter similarto that described by de Krom (1993), which removed theharmonic part of the signal. The residual was then in-verse filtered to remove the vocal tract parameters, leav-ing the inharmonic part of the source. This was fittedwith a 25 segment piece-wise linear approximation,which served to specify the noise spectrum.
The synthesis procedure is described in detail else-where (Gerratt & Kreiman, 2001). Briefly, the synthe-sizer sampling rate was fixed at 10 kHz. To overcomequantization limits on modeling F0, the source timeseries was synthesized pulse by pulse using an inter-polation algorithm that tracked the precise beginningof each source pulse relative to sample times. The over-all effect is equivalent to digitizing an analog pulsetrain with pulses of the exact desired frequencies atthe fixed 10 kHz sample rate. A 100 tap finite impulseresponse filter was synthesized for the noise spectrum,and a spectrally shaped time series was created bypassing white noise through this filter. The LF pulsetrain was added to this noise time series to create acomplete glottal source time series. The ratio of noiseto LF energy was adjusted so that the noise-to-peri-odic energy ratio approximated the value calculatedfrom the original voice sample. Finally, the completesynthesized source was filtered through the vocal tractmodel (estimated through LPC analysis, as describedabove) to generate a preliminary version of the syn-thetic voice.
Within the synthesizer, the operator adjusted theabove parameters from their preliminary estimated val-ues as necessary to achieve the optimal perceptual matchto the original voice. In particular, the output of the in-verse filter was satisfactory as a starting point for fit-ting the LF model for all the present stimuli. Param-eters of the LF model were always adjusted until theresulting synthetic stimuli provided good perceptual andspectral matches to the original voices. Therefore, anyerrors in the inverse filtering were not fatal to the finalsynthetic stimuli. After these adjustments were made,all synthesizer parameters were held constant acrossexperimental conditions. Only tremor-related param-eters were varied experimentally.
Experiment 1This experiment examined the perceptual impor-
tance of the shape and regularity of the frequency modu-lating waveform and assessed the adequacy of the twotremor models (sine wave and irregular) for synthesiz-ing vocal tremors.
2The analysis and synthesis software described in this article is availableat http://www.medsch.ucla.edu/glottalaffairs/software_of_the_boga.htm3Jitter and shimmer were not modeled separately from the noisecomponent.
208 Journal of Speech, Language, and Hearing Research • Vol. 46 • 203–214 • February 2003
MethodListeners
Five expert listeners (4 speech-language patholo-gists and 1 phonetician, including the third author4) par-ticipated in this experiment. Listeners ranged in agefrom 25 to 55 years (M = 39). All had daily clinical orresearch exposure to disordered voices, and all reportednormal hearing.
StimuliThe original voice sample and two synthetic versions
of each voice (one created with each tremor model) wereused in this experiment. Synthetic stimuli differed onlyin the tremor model applied (sine wave vs. irregulartremor), with all other synthesizer parameters held con-stant. The amplitude of frequency modulation equaledthe average deviation from the mean F0 for all stimuli.The specified rate of modulation for irregular tremorswas twice that used for sine wave tremors, as describedabove, so that output rates from the two models wereroughly equivalent. The two sets of synthetic stimulidid not differ significantly in mean F0, F(1, 62) = 0.06, p> .01, or in standard deviation of F0, F(1, 62) = 4.65, p >.01, indicating that only the pattern of F0 modulation,and not the amount of variation in F0, distinguishedthe two tremor models.
All stimuli were 1 s in duration. They were equal-ized for peak amplitude, and onsets and offsets weremultiplied by 50-ms ramps to eliminate click artifactsprior to presentation.
ProcedureListeners heard the two synthetic versions of each
voice, each paired with the corresponding originalsample. They were asked to rate the similarity of thesynthetic to the original stimulus on a 100 mm visualanalog scale ranging from exact same (0 mm) to verydifferent (100 mm). They were asked to focus their at-tention primarily on the tremor component of the voiceand to try to consider the overall modulation pattern,instead of making their judgments solely on the basis ofthe beginning and end points of the frequency contours.An additional 12 voice pairs (20%, selected at random)were repeated, for a total of 76 trials per listener.
Stimuli within a pair were separated by 500 ms.Which stimulus (synthetic or natural) occurred first in
a pair varied at random, with the constraint that eachoccurred first an equal number of times. Pairs of voiceswere randomized separately for each listener.
Testing took place in a double-walled sound booth.Stimuli were presented in free field over good qualityspeakers at a constant comfortable listening level. Lis-teners controlled the rate of stimulus presentation andwere able to replay voice pairs as desired before makingtheir responses. Test time totaled approximately 15 min.
Results and DiscussionAcross models, listeners judged the match of the syn-
thetic stimuli to the natural targets to be excellent. Theaverage rating for stimuli synthesized with the sine wavetremor model was 25.6 on a 100-point scale (0 indicat-ing that the two stimuli were identical; SD = 26.3). Themean rating for stimuli synthesized with the irregulartremor model was 24.1 (SD = 25.9). Analysis of variance(ANOVA) showed a significant interaction between voiceand tremor model, F(31, 256) = 1.57, p < .05, indicatingthat one tremor model did not consistently perform bet-ter than the other. Instead, which tremor model pro-vided the better match to the original voice dependedon the pattern of F0 variability. Listeners differed sig-nificantly in the level of their ratings, with some usingmuch more of the rating scale than others, F(4, 299) =8.27, p < .01. However, no interaction was observed be-tween raters and stimulus versions, F(1, 299) = 0.90, p> .01, indicating the pattern of preferences was consis-tent across subjects.
The limited number of listeners and significant dif-ferences among listeners in their use of the rating scalemade it difficult to formally evaluate differences betweenthe two tremor models for individual voices. However,across voices, the difference between ratings for the twotremor models depended in part on the severity of thevocal tremor (simple linear regression; F[1, 158] = 3.76,p < .05), with selection of the appropriate model increas-ingly affecting acceptability of the synthesized stimulias tremor severity increased. In particular, when trem-ors are mild, listeners appear relatively insensitive tothe precise details of the F0 contour. For example, Fig-ure 3 shows F0 tracks for a voice with a relatively smallamount of tremor. The sinusoidal F0 contour shown inpanel B follows the original tremor fairly closely, whilethe irregular tremor in panel C forms a highly smoothedversion of the contour. Both tremor models provided ex-cellent perceptual matches to the original voice (sinewave tremor model: mean rating = 10.0 on the 100-pointscale; irregular tremor model: mean rating = 3.8). Note,however, that this voice also contains substantialamounts of high-frequency noise, as evidenced by theshort-term variations in the F0 contour in panel A. We
4The third author had no experience with or exposure to any of thestimuli prior to participating in this experiment, and (as noted below)participant identity did not interact with stimulus versions, suggestingthat all raters behaved in a similar fashion.

Kreiman et al.: Perception of Vocal Tremor 209
speculate that listeners equally preferred the highlysmoothed and less smoothed F0 contours because theyhad difficulty distinguishing the two patterns of moder-ate long-term variation in the context of significantshort-term variation in F0. We return to this hypoth-esis in the General Discussion section.
Experiment 2This experiment examined the perceptual impact
of the amplitude of frequency modulation—that is, howfar a tremor deviates above and below the mean F0. AsFigures 1–3 indicate, pathological voices do not neces-sarily have a single, well-defined modulation amplitude.Some tremor cycles in a voice depart much more (or muchless) from the mean F0 than others do, but it is notknown how listeners respond perceptually to variationsin modulation amplitude. For this reason, we evaluatedthree different approaches to modeling the amplitudeof F0 modulation—one based on the average deviationfrom the mean F0 in the original voice, one based on themaximum deviations from the mean F0, and one thatwas selected perceptually.
MethodStimuli
The 32 voice samples from Experiment 1 were usedin this study, along with three synthetic versions ofeach original voice. All versions of a given voice usedwhichever tremor model was judged the best match inExperiment 1 (10 sine wave tremors, 22 irregular trem-ors), but versions differed in the manner in whichtremor amplitudes and rates were estimated. For thefirst version of a given voice, modulation amplitude wasestimated based on the average deviation from themean F0, as described in the Method section. The sec-ond version was created with deviations based on themaximum and minimum values of F0 in a sample. Bothof these versions used the same estimated modulationrate. The third synthetic version of each voice usedperceptually rather than acoustically derived estimatesfor tremor parameters. This condition was included totest the adequacy of estimation procedures for all theparameters used to model tremors and was createdusing whatever modulation rate and amplitude pro-vided the best perceptual result, in the opinion of thefirst author (who created all the stimuli). In thesestimuli, adjustments were made to modulation ratesin 9 of 32 stimuli, to correct apparent errors in esti-mating rates for the more irregular stimuli. Values ofthe amplitude of frequency modulation were also ad-justed in 18 of 32 stimuli. Most of these adjustments
Figure 3. A voice that was equally well modeled with the sinewave and irregular tremor models. A: Plot of frequency versus timefor the original voice sample. B: Plot of frequency versus time forthe synthetic version of the voice created with the sine wave tremormodel. Rate of frequency modulation = 4 Hz; amplitude ofmodulation = 2 Hz. C: Plot of frequency versus time for thesynthetic version of the voice created with the irregular tremormodel. Rate of frequency modulation = 8 Hz; amplitude ofmodulation = 2 Hz.
A
B
C

210 Journal of Speech, Language, and Hearing Research • Vol. 46 • 203–214 • February 2003
resulted in values between the two estimates used inthe other stimuli; on average, modulation amplitudesfor the perceptually modeled stimuli were slightly butsignificantly larger than those based on average de-viations from the mean F0 (average difference = 0.9Hz), matched-pairs t(31) = 3.83, p < .01. Perceptuallyderived values for the rate of frequency modulation didnot differ consistently from the original estimates (av-erage difference = 1.06 Hz), matched-pairs t(31) = 0.78,p > .01. A repeated-measures ANOVA showed that thesethree sets of synthetic stimuli did not differ signifi-cantly from the original voice samples or from eachother in mean F0, F(3, 93) = 3.92, p > .01, but did differsignificantly in the amount of variability in F0 (mea-sured as the standard error of the mean; see Table 1),F(3, 93) = 58.06, p < .01.
ListenersTen expert listeners (6 speech-language pathologists,
3 otolaryngologists, and 1 phonetician, including thethird author) participated in this experiment. Listenersranged in age from 25 to 55 years (M = 38.4; SD = 10.6).Each had daily clinical or laboratory exposure to patho-logical voice stimuli, and all reported normal hearing.
ProcedureListeners heard the three synthetic versions of each
voice, each paired with the original sample. An addi-tional 19 voice pairs (20%, selected at random) were re-peated, for a total of 115 trials per listener. As in Ex-periment 1, listeners were asked to judge the similarityof each synthetic token to the original voice, on a 100mm visual analog scale ranging from exact same (0 mm)to very different (100 mm). Other procedures were iden-tical to those used in Experiment 1. Test time totaledapproximately 20 min.
Results and DiscussionResults of Experiment 2 confirmed that the two
tremor models provided excellent copies of naturallyoccurring frequency modulations. Of the 96 stimuli (com-prising all three synthetic versions), 51 received meanratings of 25 or less on a 100-point scale, and 93 of 96had mean ratings of 50 or less. Listeners again differedsignificantly in their levels of rating, F(9, 929) = 31.38,p < .01, but these differences did not interact with stimu-lus version, F(18, 929) = 0.56, p < .01, indicating that alllisteners shared the same general pattern of preferences.
An ANOVA showed a significant effect of stimulusversion on the acceptability of the stimuli, F(2, 929) =11.01, p < .01. Scheffé post hoc comparisons indicated that
stimuli based on maximum frequency excursions (meanrating = 29.5) were less acceptable overall than thosemodeled using the average deviation from the mean F0(mean rating = 22.4; p < .01). Stimuli based on maximumfrequency excursions produced stimuli whose tremorssounded too exaggerated. The effect was independent oftremor severity; that is, more severe tremors did not ben-efit from emphasis on the extremes of frequency devia-tion, F(1, 929) = 6.12, p > .01. Modeling based on the av-erage deviations from the mean F0 did produce stimuliwith consistently less frequency variability than the origi-nal voices, one-sample t(31) = 4.89, p < .01 (see Table 1),but these small differences in frequency variability ap-parently were considered perceptually acceptable.
Further Scheffé comparisons indicated that stimulicreated by perceptually adjusting synthesizer param-eters (mean rating = 23.2) were also significantly pre-ferred overall to stimuli based on maximum F0 devia-tions (p < .01), but did not differ in acceptability fromstimuli based on average deviations in F0 (p > .01). Ap-parently, the reliable but small differences between thesetwo sets of stimuli in frequency variability were not per-ceptually important in the context of the frequency ir-regularities that occur with pathological voices, althoughthe larger differences in modulation amplitudes instimuli based on maximum excursions in F0 are per-ceptually too extreme.
Experiment 3This experiment investigated the perceptual effects
of changes in the rate of F0 modulation. In this study,listeners heard synthetic stimuli that differed slightlyin tremor rate, and were asked to determine which bestmatched the original voice sample. They also reportedtheir confidence in their judgments. Patterns of listenerpreferences, combined with confidence ratings, providemore information about listeners’ ability to hear differ-ences in tremor rates than would similarity ratings likethose used in Experiments 1 and 2. Further, because theperceptibility of modulation rates was evaluated within
Table 1. F0 characteristics of the stimuli in Experiment 2.
Stimulus M F0 (Hz) SEM F0
Original natural sample 169.1 0.16Tremor amplitude based on 169.3 0.11a
average deviation from M F0Tremor amplitude based on 169.6 0.27a
maximum deviation from M F0Perceptually modeled 169.5 0.14a
a Differs significantly from original voice sample (p < .01).

Kreiman et al.: Perception of Vocal Tremor 211
the context of differences among voices in tremor typeand amplitude, this study also provided the opportunityto investigate potential perceptual interactions that mayoccur among different aspects of F0 modulation.
MethodStimuli
Ten voices were selected from the original set of 32to include a range of rates and extents of modulation.Five were modeled with sine wave tremors and five withirregular tremors (see Table 2). Nine synthetic versionsof each original voice were created. The first of these(the central stimulus) was created using the tremor rateestimated from the pitch track, as described in the Analy-sis and Synthesis Techniques section above. Tremor rateswere increased from this central value in steps of 0.25Hz (0.5 Hz for the irregular tremor model) to create fourstimuli; rates were decreased from this central value insteps of 0.25 Hz (0.5 Hz for the irregular tremor model)to create another four stimuli. Thus, tremor rates for eachnine-member “family” of stimuli spanned a range of 2 Hz(or 4 Hz for the irregular tremor model), centered aroundthe central stimulus value. All other synthesis param-eters were held constant across stimulus versions.
Note that changes in tremor rates have differenteffects for the two tremor models. For the sine wavemodel, changes in tremor rate also produced changes inthe ending point of the tremor. For example, decreasingthe rate by 0.25 Hz means that the tremor’s final pointwill be 90° out of phase with respect to the basic stimu-lus version (because only three fourths of a cycle will becompleted). Thus, stepwise modification of the tremorrate in the sine wave model assessed the perceptualimportance of matching the end point of an F0 contour
precisely, as well as the importance of the rate of fre-quency modulation. However, altering the rate for theirregular model had no consistent effect on tremor phase,because the model generated a different irregular pitchcontour each time it was invoked.
ListenersTen expert listeners (1 speech-language pathologist,
1 otolaryngologist, and 8 phoneticians, including the firstand third authors) participated in this experiment. Lis-teners ranged in age from 23 to 52 years (M = 32.6).Each had substantial experience evaluating voice qual-ity, through daily clinical or laboratory encounters. Allreported normal hearing.
ProcedureFor each trial, listeners heard two pairs of voices
(AB and AC). The first member of each pair (A) was al-ways the original voice sample, and the second was oneof the nine synthetic copies of that sample. In an addi-tional 90 “same” trials, both voices in one pair were theoriginal sample (for a total of 450 trials per listener).Listeners were asked to compare the pairs and decidewhether B or C provided a better match to A. They werealso asked to rate their confidence in each response on a5-point scale ranging from wild guess (1) to positive (5).Listeners were able to play each pair as often as neces-sary before making a response. Stimuli were reran-domized for each listener and were presented in freefield at a constant comfortable level in a double-walledsound booth. Voices within a pair were separated by 350ms; the interpair interval was controlled by the listener,as was the rate at which trials were presented. To re-duce listener fatigue, testing took place in two sessions,each lasting about 50 min.
Results and DiscussionListeners usually judged that the original natural
stimulus was the best match to itself, selecting this pairon 93% of “same” trials. Across the 10 voice families,error rates on these trials ranged from 1.1% to 13.3%.However, listeners were not especially confident of theirchoices. Mean confidence for comparing a syntheticstimulus to a natural voice was 3.77 (SD = 1.38) on the5-point scale. This, combined with fact that some syn-thetic stimuli were confused with natural ones for ev-ery stimulus family, demonstrates the success of thesynthesis at imitating the original voices.
The task of deciding which of two synthetic stimulibest matched the natural stimulus was difficult. Meanconfidence for trials without “same” pairs was 2.10 (SD
Table 2. Tremor parameters for stimuli used in Experiment 3.
Tremor Tremor TremorStimulus model rate (Hz) amplitude (Hz)
1 Sine wave 4 22 Sine wave 4.5 14.53 Sine wave 5 64 Sine wave 6 4.55 Sine wave 7 0.756 Irregular 4 27 Irregular 6.5 48 Irregular 8 79 Irregular 20 2
10 Irregular 20 4
Note. Tremor rates listed for stimuli with irregular tremors are twice therate estimated from the original stimuli, as discussed in the text.

212 Journal of Speech, Language, and Hearing Research • Vol. 46 • 203–214 • February 2003
= 1.21), which is significantly lower than for the “same”trials, F(1, 4498) = 1302.02, p < .05. Listeners were sig-nificantly more confident overall when judging voiceswith sine wave tremors compared to irregular tremors,F(1, 3598) = 42.19, p < .05), indicating that differencesin tremor rates were easier to hear when tremors weresinusoidal than when they were irregular.
To determine how well listeners were able to distin-guish differences in tremor rates, we examined trialswhere one pair of voices included the central stimulusand the other pair included a second synthetic voice.Among synthetic stimuli, the central stimulus (createdusing the visually guided estimate of the tremor rate)was selected as the best match to the natural voice onabout 62% of trials, which exceeded chance levels: sinewave tremors, χ2(1) = 29.16, p < .01; irregular tremors,χ2(1) = 20.25, p < .01. Responses on the remaining trialswere distributed rather evenly across the other syntheticversions (see Table 3). For both sine wave and irregulartremors, no relationship was observed between listenerpreferences and the amount of difference between thesecond synthetic voice and the central stimulus in tremorrate: sine wave tremors, F(1, 6) = 0.02, ns; irregular trem-ors, F(1, 6) = 3.03, ns. For sine wave tremors, listeners’confidence did increase with the distance between thecentral stimulus and the second synthetic stimulus, F(1,398) = 5.19, p < .05, but for irregular tremors, confi-dence did not vary with the amount of difference be-tween stimuli, F(1, 398) = 1.77, ns. These results sug-gest that listeners are not especially sensitive overall tosmall differences in tremor rate and that the tremorphase (the actual frequency endpoint) of a stimulus hadlittle effect on listeners’ judgments. Given this relativeinsensitivity, our somewhat informal method of estimat-ing tremor rates appears adequate.
For sine wave tremors, listeners’ confidence washigher for synthetic stimuli paired with the naturalstimuli having the fastest central tremor rates, indicat-ing that differences in rate are easier to hear for fasterrates, F(1, 178) = 74.97, p < .05. However, greater tremoramplitudes significantly reduced the ability to detect ratedifferences, F(1, 178) = 28.16, p < .05. Similar effects ofrate manipulations were not observed for irregular trem-ors: tremor rate, F(1, 178) = 3.15, ns; tremor amplitude,F(1, 178) = 0.74, ns.
These results suggest that perceptual sensitivity todifferences in tremor rate depends on the complexity ofthe total pattern of frequency variation. As the ampli-tude of a sine wave tremor increases, the complexity ofthe pattern increases, so listeners have more difficultyisolating and attending to rate alone. Similarly, as thepattern of frequency modulation departs from sinusoid-ality, listeners are increasingly unable to resolve thechanges in tremor, apparently because the backgroundtremor pattern is uncertain. When the overall patternof frequency modulation is most complex, listeners ap-parently respond to overall levels of F0 variability (mea-sured by the standard error of the mean, e.g., as in Ex-periment 2 above), rather than to precise patterns offrequency change.
General DiscussionIn this study, we examined the perception of fre-
quency modulation in pathological voices, using a vari-ety of voice synthesis strategies. Sine waves provided agood approximation to the perceived pattern of frequencymodulation for some voices, but other voices were bet-ter modeled with an irregular modulating waveform. Theperceptual importance of the shape of the modulatingwaveform appears to depend on the severity of thetremor, with the choice of model increasing in impor-tance as the tremor increases in severity and salience.The average deviation from the mean F0 better approxi-mated the perceived amplitude of a tremor than did themaximum deviations in F0, although listeners were notparticularly sensitive to small changes in tremor am-plitudes. Differences in tremor rates were easiest to hearwhen the tremor was sinusoidal and of small amplitude.Differences in rate were difficult to judge for tremors oflarge amplitude, or in the context of irregularities inthe pattern of frequency modulation.
Amplitude modulation (as opposed to the amplitudeof frequency modulation; see footnote 1) was not explic-itly modeled in this study, although amplitude modula-tions occurred in all the natural and synthetic stimuli,presumably due to the movement of harmonics towardand away from resonance peaks as F0 varied. The per-ceptual importance of amplitude modulation cannot be
Table 3. Preference rates for different synthetic stimuli.
Stimulus version
Tremor Central ±±±±± Central ±±±±± Central ±±±±± Central ±±±±± Total #type Central 0.25 Hz 0.5 Hz 0.75 Hz 1 Hz trials
Sine wave 245 39 35 43 38 400Irregular 254 45 38 27 36 400

Kreiman et al.: Perception of Vocal Tremor 213
determined without formal evaluation. Consistent withanecdotal evidence (Sundberg, 1995), the excellent qual-ity of the synthesis suggests that such modulations arenot perceptually important for every tremulous voice,apart from the frequency modulations that producedthem. However, some voices, including severe examplesof spasmodic dysphonia, may require formal modelingof amplitude modulations.
Note also that the present study makes no claimsregarding the physiological functions that producedacoustic frequency and amplitude modulations. Our goalwas to determine which acoustic characteristics of thevoices were perceptually important, and to examine howdifferent acoustic characteristics interacted to determinethe nature of the perceived tremor. A broader long-termgoal for such studies would be to understand whichphysiological aspects of tremor produce perceptuallyimportant acoustic changes. However, pursuit of thisdesirable but ambitious goal must await the emergenceof voice models that relate physiology to acoustics toperception in a unified theoretical framework. (See Titze& Story, 1997, for an example of a physiologically basedmodel of the voice source.)
With this caveat in mind, we found no acoustic ba-sis for formally distinguishing classes of tremors (e.g.,wow and flutter) on the basis of modulation rates. Noobvious discontinuities were observed in the distribu-tion of estimated modulation rates for these 32 voices,and modulation rates were not related to the perceivedseverity of the tremor (r = –.14, ns). It is, therefore, un-clear where boundaries should be drawn between dif-ferent categories of tremors. Synthesizer parametersprovide continuous quantification of frequency modula-tion, and using such parameters to describe tremorsobviates the need for categorical measurement systems(Gerratt & Kreiman, 2001).
The results of Experiment 2 suggest that differencelimens for the amplitude of frequency modulation arefairly large when the target stimuli themselves vary ir-regularly. That is, relatively small differences in theamount of frequency variability are apparently treatedas consistent with the overall variability of the originalstimuli and are not noticed until they exceed somethreshold level. Additional studies systematically ma-nipulating the amplitude of frequency modulation mayshed further light on how listeners perceive frequencymodulations occurring in perceptually complex, chang-ing contexts.
The present results further suggest that tremor rate,regularity, and amplitude interact, so that the percep-tual importance of any one dimension depends on val-ues of the others. Psychoacoustic studies have reportedsimilar perceptual interactions between stimulus dimen-sions (Melara & Marks, 1990; Melara & Mounts, 1994).
In those studies, variation on an unattended dimen-sion (e.g., pitch) significantly interfered with listeners’abilities to perceive differences on a target dimension(e.g., loudness). Much further work will be necessaryto determine the extent, pattern, and mechanisms ofperceptual interference among dimensions of voicequality. However, to the extent that such interferenceoccurs, it argues against the use of traditional unidi-mensional rating scale approaches to quality measure-ment. Unidimensional rating scale instruments cannever adequately measure what listeners hear whenthe value of a stimulus on one perceptual dimensiondepends on the value of another dimension. (See alsoVan Lancker, Kreiman, & Wickens, 1985, for discus-sion of similar effects in the perception of personal iden-tity from voice.) Such interactions can be modeled andstudied systematically in a synthesis approach like thatapplied here, which is a significant advantage of thisnew method.
AcknowledgmentsThis research was supported by Grant DC01797 from
the National Institute on Deafness and Other Communica-tion Disorders. We thank Norma Antonanzas for additionalprogramming support.
ReferencesAckermann, H., & Ziegler, W. (1994). Acoustic analysis of
vocal instability in cerebellar dysfunctions. Annals ofOtology, Rhinology and Laryngology, 103, 98–104.
Aronson, A. E., Ramig, L., Winholtz, W., & Silber, S.(1992). Rapid voice tremor, or “flutter,” in amyotrophiclateral sclerosis. Annals of Otology, Rhinology andLaryngology, 101, 511–518.
Brown, J. R., & Simonson, J. (1963). Organic voicetremor: A tremor of phonation. Neurology, 13, 520–523.
de Krom, G. (1993). A cepstrum-based technique fordetermining a harmonics-to-noise ratio in speech signals.Journal of Speech and Hearing Research, 36, 254–266.
Fant, G., Liljencrants, J., & Lin, Q. (1985). A four-parameter model of glottal flow. Speech TransmissionLaboratory Quarterly Status and Progress Report, 4, 1–13.
Gerratt, B. R., & Kreiman, J. (2001). Measuring voicequality with speech synthesis. Journal of the AcousticalSociety of America, 110, 2560–2566.
Hibi, S., & Hirano, M. (1995). Voice quality variationsassociated with vibrato. In O. Fujimura & M. Hirano(Eds.), Vocal fold physiology: Voice quality control (pp.189–202). San Diego, CA: Singular.
Horii, Y. (1989a). Acoustic analysis of vocal vibrato: Atheoretical interpretation of data. Journal of Voice, 3,36–43.
Horii, Y. (1989b). Frequency modulation characteristics ofsustained /a/ sung in vocal vibrato. Journal of Speech andHearing Research, 32, 829–836.

214 Journal of Speech, Language, and Hearing Research • Vol. 46 • 203–214 • February 2003
Horii, Y., & Hata, K. (1988). A note on phase relationshipsbetween frequency and amplitude modulations in vocalvibrato. Folia Phoniatrica, 40, 303–311.
Markel, J. D., & Gray, A. H., Jr. (1976). Linear predictionof speech. Berlin: Springer.
MathWorks, Inc. (2001). MATLAB (Version 6.1) [computersoftware]. Natick, MA: Author.
Melara, R. D., & Marks, L. E. (1990). Interaction amongauditory dimensions: Timbre, pitch, and loudness.Perception & Psychophysics, 48, 169–178.
Melara, R. D., & Mounts, J. R. (1994). Contextualinfluences on interactive processing: Effects of discrim-inability, quantity, and uncertainty. Perception & Psycho-physics, 56, 73–90.
Morsomme, D., Orban, A., Remacle, M., & Jamart, J.(1997). Comparison of a vibrato study by a panel of judgesand spectral voice analyzer. In Proceedings of the Larynx1997 Conference (pp. 25–28). Aix-en-Provence: ESCA.
Ramig, L., & Shipp, T. (1987). Comparative measures ofvocal tremor and vocal vibrato. Journal of Voice, 1, 162–167.
Rossing, T. D. (1990). The science of sound. Reading, MA:Addison-Wesley.
Sundberg, J. (1995). Acoustic and psychoacoustic aspectsof vocal vibrato. In P. H. Dejonckere, M. Hirano, & J.Sundberg (Eds.), Vibrato (pp. 35–62). San Diego, CA:Singular.
Titze, I. R. (1994). Principles of voice production. EnglewoodCliffs, NJ: Prentice-Hall.
Titze, I. R. (1995a). Singing: A story of training entrainedoscillators. Journal of the Acoustical Society of America,97, 704.
Titze, I. R. (1995b). Summary statement: Workshop onAcoustic Voice Analysis. Denver, CO: National Center forVoice and Speech.
Titze, I. R., & Story, B. (1997). Acoustic interactions of thevoice source with the lower vocal tract. Journal of theAcoustical Society of America, 101, 2234–2243.
Van Lancker, D., Kreiman, J., & Wickens, T. (1985).Familiar voice recognition: Patterns and parameters: PartII. Perception of rate-altered voices. Journal of Phonetics,13, 39–52.
Winholtz, W. S., & Ramig, L. (1992). Vocal tremor analysiswith the vocal demodulator. Journal of Speech andHearing Research, 35, 562–573.
Received May 22, 2002
Accepted August 20, 2002
DOI: 10.1044/1092-4388(2003/016)
Contact author: Jody Kreiman, Head/Neck Surgery, TheDavid Geffen School of Medicine at UCLA, 31-24 RehabCenter, Los Angeles, California 90095-1794. E-mail:[email protected]

DOI: 10.1044/1092-4388(2003/016) 2003;46;203-214 J Speech Lang Hear Res
Jody Kreiman, Brian Gabelman, and Bruce R. Gerratt
Perception of Vocal Tremor
http://jslhr.asha.org/cgi/content/abstract/46/1/203#otherarticles
This article has been cited by 1 HighWire-hosted article(s) which you can access for free at:
This information is current as of April 1, 2011
http://jslhr.asha.org/cgi/content/abstract/46/1/203located on the World Wide Web at:
This article, along with updated information and services, is