percent of the total Oahu inventory of the state ... · neighborhoods, Kalihi-Palama and the...
115
DOCUMENT RESUME ED 029 981 VT 008 580 By-Yoshida. Teruo The Model Neighborhood Jobseeker. A Survey of Hawaii State Employment Service Job Applicants from Kalihi-Palama and Waianae Coast. Hawaii State Dept. of Labor and Industrial Relations. Honolulu. Research and Statistics Office. Spons Agency-Hawaii State Dept. of Education. Honolulu. Pub Date Nov 68 Note-113p. EDRS Price MF-$0.50 HC-$5.75 Descriptors-Community Problems. Disadvantaged Croups. *Employment Problems. Employment Qualifications. Employment Services. Individual Charactpristics. Interagency Cooperation. Job Applicants. *Occupational Surveys. Profile Evaluation. 'Unemployed Identifiers-Honolulu. 'Model Cities Program This study of job-seekers from the model neighborhoods of Kalihi-Palama and the Waianae Coast consists of a stock analysis of ;nclividuals from these areas who were active applicants of the Oahu Employment Service Division Placement Branches and Employment Opportunity Center. Unemployment is estimated at between 597 and 1.600 in Kalihi-Palama and between 382 and 750 in Waianae Coast. Model neighborhood residents seeking full-time. permanent employment make up 12.6 percent of the total Oahu inventory of the state employment service offices. The unusual nature of the model neighborhoods was apparent in that over 80 percent of the fob-seekers were defined as disadvantaged in their job hunt and over two-thirds of the disadvantaged had more than one problem. About 43 percent were not fully qualified for their area of search. Recommendations include: (1) future study of the effects of local intake centers, both in improved assistance to registrants and more comprehensive identification of job seekers. and -(2) a followup study which would look at successful job-seekers. (JK)
Transcript of percent of the total Oahu inventory of the state ... · neighborhoods, Kalihi-Palama and the...
DOCUMENT RESUME
ED 029 981 VT 008 580
By-Yoshida. TeruoThe Model Neighborhood Jobseeker. A Survey of Hawaii State Employment Service Job Applicants fromKalihi-Palama and Waianae Coast.
Hawaii State Dept. of Labor and Industrial Relations. Honolulu. Research and Statistics Office.Spons Agency-Hawaii State Dept. of Education. Honolulu.Pub Date Nov 68Note-113p.EDRS Price MF-$0.50 HC-$5.75Descriptors-Community Problems. Disadvantaged Croups. *Employment Problems. Employment Qualifications.Employment Services. Individual Charactpristics. Interagency Cooperation. Job Applicants. *OccupationalSurveys. Profile Evaluation. 'Unemployed
Identifiers-Honolulu. 'Model Cities ProgramThis study of job-seekers from the model neighborhoods of Kalihi-Palama and
the Waianae Coast consists of a stock analysis of ;nclividuals from these areas whowere active applicants of the Oahu Employment Service Division Placement Branchesand Employment Opportunity Center. Unemployment is estimated at between 597 and1.600 in Kalihi-Palama and between 382 and 750 in Waianae Coast. Modelneighborhood residents seeking full-time. permanent employment make up 12.6percent of the total Oahu inventory of the state employment service offices. Theunusual nature of the model neighborhoods was apparent in that over 80 percent ofthe fob-seekers were defined as disadvantaged in their job hunt and over two-thirdsof the disadvantaged had more than one problem. About 43 percent were not fullyqualified for their area of search. Recommendations include: (1) future study of theeffects of local intake centers, both in improved assistance to registrants and morecomprehensive identification of job seekers. and -(2) a followup study which would lookat successful job-seekers. (JK)
cocr% /scrc\Ic) THE1.0
EL \ELRUMr-N n r-
it..JULLKLK,U.S. DEPARTMENT Of HEALTH, EDUCATION & WELFARE
OFFICE OF EDUCATION
THIS DOCUMENT HAS BEEN REPRODUCED EXACTLY AS RECEIVED FROM THE
PERSON OR ORGANIZATION ORIGINATING IT. POINTS Of VIEW OR OPINIONS
STATED DO NOT NECESSARILY REPRESENT OFFICIAL OFFICE OF EDUCATION
POSITION OR POLICY.
A SURVEY OF HAWAII STATE
EMPLOYMENT SERVICE JOB APPLICANTS FROM
KALIHI-PALAMA AND WAIANAE COAST ,
NOVEMBER 1968
C)0 -,t 4t 4, t -State-ef-Hawaii -- -N-- -
'cZDepartment of Labor and Industrial Relations 4 \Aor,o\ t,..) \ J ,
)
V4I Research and Statistics Office,
STATE OF HAWAII
JOHN A. BURNS, GOVERNOR
DEPARTMENT OF LABOR AND INDUSTRIAL RELATIONS
ROBERT HASEGAWA, Director
ROBERT GILKEY, Deputy Director
EMPLOYMENT SERVICE DIVISIONROBERT AG ENA, Administrator
Prepared by:
RESEARCH AND STATISTICS OFFICETERUO YOSHIDA, Chief
STAFF: Sybil Kyi, Research StatisticianKenneth Mihata, Research StatisticianEdward Sanpei, Research Technician
FUNDS TO CONDUCT A MAJOR PART OF THIS SURVEY WERE PROVIDED BY THEHAWAII STATE DEPARTMENT OF EDUCATION AND THE CITY AND COUNTY OFHONOLULU CITY DEMONSTRATION AGENCY MODEL CITIES PROGRAM.
WHO IS THE MODEL NEIGHBORHOOD JOB-SEEKER?
A Survey of Hawaii State Employment Service Applicants
from the Kalihi-Palama and Waianae Coast
TABLE OF CONTENTS
I. Introduction
A. Nature of Survey
Un Atilt/10j illent 411 the Mrviel Nwighl.,nrhnodq
1
3
II. Kalihi-Palama
A. A General Profile of Job-Seekers Residing in Kalihi-Palama . . . 5
B. A Comparison Between Disadvantaged and Non-DisadvantagedJob-Seekers in Kalihi-Palama 13
C. Problems of the Disadvantaged Job-Seekers in Kalihi-Palama . 22
III. Waianae Coast
A. A General Profile of Job-Seekers Residing in the Waianae Coast 27
B. A Comparison Between the Disadvantaged and Non-DisadvantagedJob-Seekers in the Waianae Coast 34
C. Problems of the Disadvantaged Job-Seekers in Waianae Coast . 40
IV. Summary
A. Comments on Data 44
B. Follow-Up Suggestions OOOOOOOOOOO . 2 44
Appendix A: Derivation of Unemployment Al
Appendix B: Survey Procedures and Glossary of Definitions Bl
Miscellaneous Notes B7
Appendix C: Census Tract Tabulations Cl
I. INTRODUCTION
I. Introduction
A. Nature of Survey
"Employment is good, and full employment is the greatest good." This
axiam of American society is unique due to the consensus it has produced
among experts and the general public. Ever since full employment was first
identified as a goal of government economic activity, economists of all
ideologies have made it the key to their policy systems. The postwar
period in the U. S., the so called modern period of economic analysis, has
seen a sdbordination of all other goals to that of full employment.
Policy-makers who would otherwise have demanded more radical governmentaction to achieve a more equitable incame distribution have turned to full
employment as the answer. On the other hand, laissez-faire economists who
wish to minimize government economic activ#y have recognized that their
approach to economic welfare is tenable only with the assumption of full
employment.
Although same have recently begun to question our ability to reachfull employment and the desirability of pinning all our policy hopes upon
it, in practice the unemployed worker is still a social misfit. One does
not need to speculate about an instinct of wrkmanship to recognize that
in a job-oriented society the jobless worker is disoriented. Thus, it is
appropriate that Honolulu's Model Cities Program under the provisions of
the Demonstration Cities Act of 1966 has as an integral component a concernfor the employability of those left outside of the affluent society. In
the long run, the Model Cities Program, like all people-oriented programs,must look towards aiding people in finding meaningful employment in order
to have the target areas become functioning partners with the rest of the
community.
The key word in the Mbdel Cities Program is "balance": balance among
public agencies, between public groups and private groups, and among the
approadhes to the different problems. The Mbdel Cities Program is concerned
with the total environment of a resident in a target area: physical, social,
and economic. The job hunt is a good example of how the different aspects
of a resident's environment are intertwined. The job hunt is affected by
physical factors, e.g., transportation facilities, social factors, e.g.,the sense of hope or despair an area produces, as well as economic factors.
Although in the long run the variables of the job hunt include thetotal environment, in the short run the State Employment Service Division
of the Department of Labor and Industrial Relations whose main function is
to identify and encourage the coincidence of wants between the job-seeker
and the employer, is of primary importance. To achieve its goal the
EMployment Service Division provides Oahu with manpower services throughits Placement Branch and the Employment Opportunity Center. The Placement
Branch consists of two sections::
1. The Professional, Clerical and Sales Office which services job-seekers and employers in the professional, managerial, technical,clerical, and sales occupations
2. The Industrial Office which services job-seekers and employers in
the service4iskilled, semi-skilled, unskilled, and agricultural
occupations-1J
The Employment OpportunitT Center serves the needs of all job-seekers
requiring employability development services.
This survey is an attempt at a partial answer to the question: Who
are the job-seekers from the model neighborhoods? It 1,s a stock analysis
of the active applicants at the offices listed above.2/ The job-seeking
behavior of unemployed workers, however, extends beyond simply using the
state employment service offices. A job-seeker might: 1) consult friends
and relatives, 2) register at a state employment service office, 3) register
at private employment agencies, 4) use newspaper ads, or 5) apply directly
to canpanies and unions.
In a recent study of job-seeking behavior, it was discovered that the
effectiveneR9 of each of these approaches varied according to the type of
job sought.2/ For example, friends and relatives were found to be 50 per-
cent to 75 percent more effective than any other means of job-seeking at
low skill levels, while white collar workers rarely used them. These
methods were positively reinforced so that job-seekers with similar
backgrounds and job skills tended to use similar methods whenever they
engage in the job hunt. Thus, an obvious shortcoming of this survey is
that state employment service applicants represent a biased sampling of
job-seekers. This bias is aggravated by the fact that unemploymentinsurance, for which anly certain job-seekers are eligible, requires all
recipients to apply at the state employment service. A full study would
have to consider the sources of the relevant job-seekers, the model neigh-
borhoods themselves, by interviewing a sampling of households in these
areas. Nevertheless it seems safe to suggest that the state employment
service offices are in contact with a sizeable nuMber of job-seekers. Job-
seekers no doubt use more than one method of search simultaneously,including the state employment service. The previously mentioned study
also found that state employment agencies were well publicized; job-seekers
usually registered at these agencies in addition to using other mthods.
Another shortcaming of this survey is that as a stock analysis it is
concerned only with discovering who are the job-seekers from the model
neighborhoods.
vlsorwat
lj This mrvey was conducted on June 251 1968. On September 31 19681 two additional
offices under the Concentrated Employment Program were established in Kalihi-
Palama and the Waianae Coast.2,/ For a fuller description of the survey procedures, see Appendix B.
2/ Sheppard, Harold and Belitsky, Harvey "The Job Hunt: job-Seeking Behavior of
Unemployed Workers in a Local Econany," Baltimore, Maryland; Johns Hopkins Press
1966.
Survey Point1
1
HawaiiState Employ.
Service
(
ModelNeighborhoods
OtherMethods
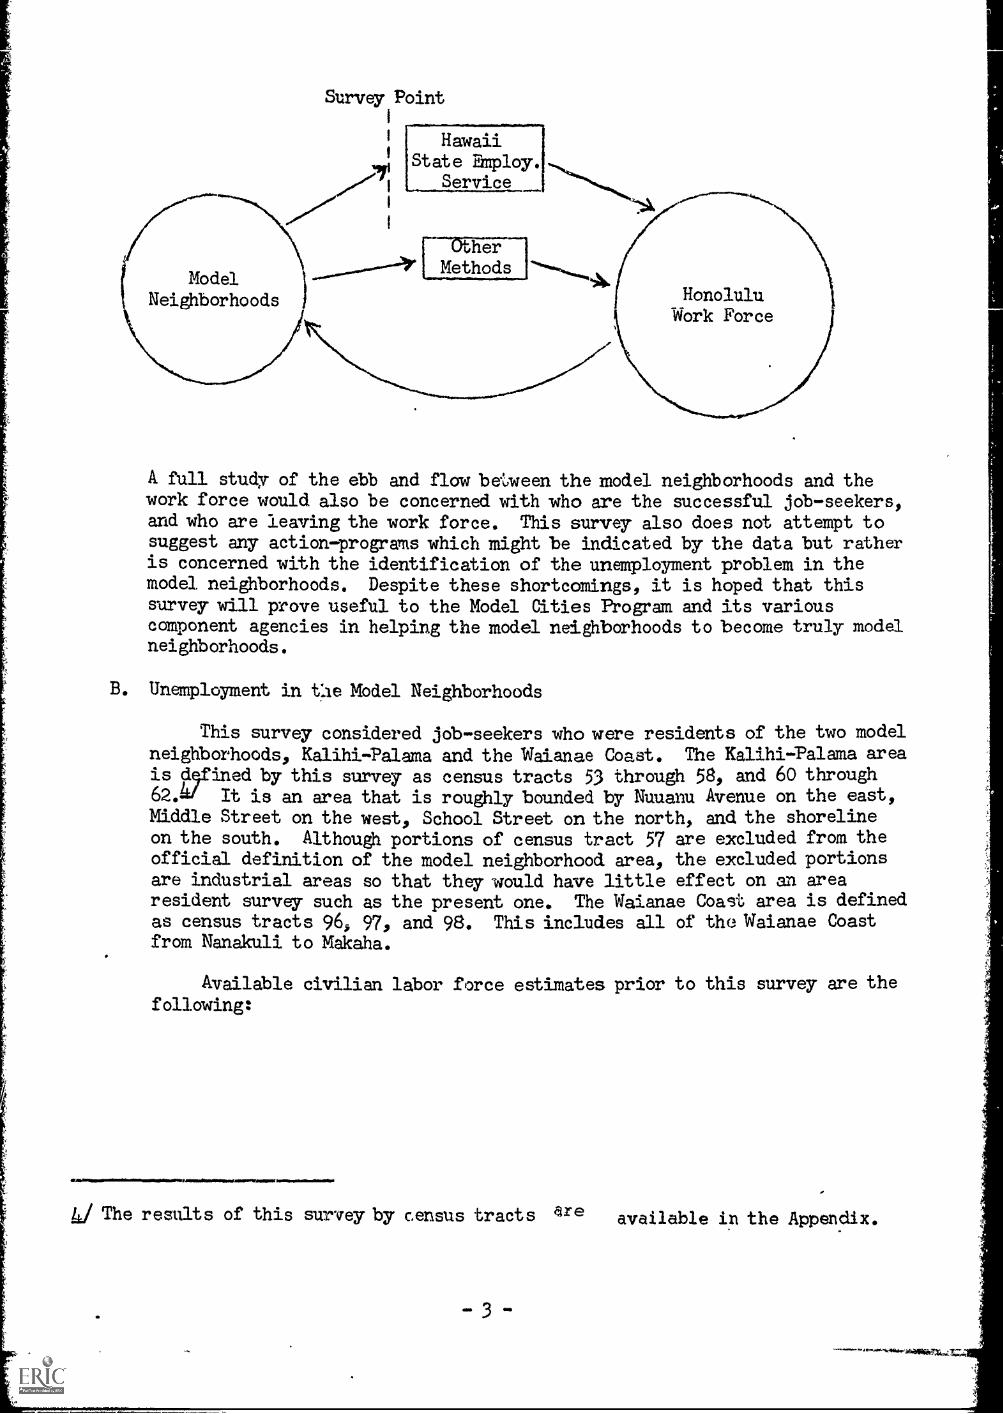
A. full study of the ebb and flaw bemeen the nndel neighborhoods and thework force would also be concerned with mho are the successful job-seekers,and who are leaving the work force. This survey also does not attempt tosuggest any action-programs which might be indicated by the data but ratheris concerned with the identification of the unemployment problem in themodel neighborhoods. Despite these shortcomings, it is hoped that thissurvey will prove useful to the Model Cities Program and its variouscomponent agencies in helping the model neighborhoods to become truly modelneighborhoods.
B. Unemployment in -Lie Mbdel Neighborhoods
This survey considered jdb-seekers who were residents of the two model
neighborhoods, Kalihi-Palama and the Waianae Coast. The Kalihi-Palama areais Wined by this survey as census tracts 53 through 58, and 60 through62.al It is an area that is roughly bounded by Nuuanu Avenue on the east,Middle Street on the west, School Street on the north, and the shorelineon the south. Although portions of census tract 57 are excluded from theofficial definition of the model neighborhood area, the excluded portionsare industrial areas so that they-would have little effect on an arearesident survey such as the present one. The Waianae Coast area is definedas census tracts 96, 97, and 98. This includes all of the Waianae Coastfrom Nanakuli to Makaha.
Available civilian labor force estimates prior to this survey are thefollowing:
Vox..
4./ The results of this survey by census tracts *re available in the Appendix.
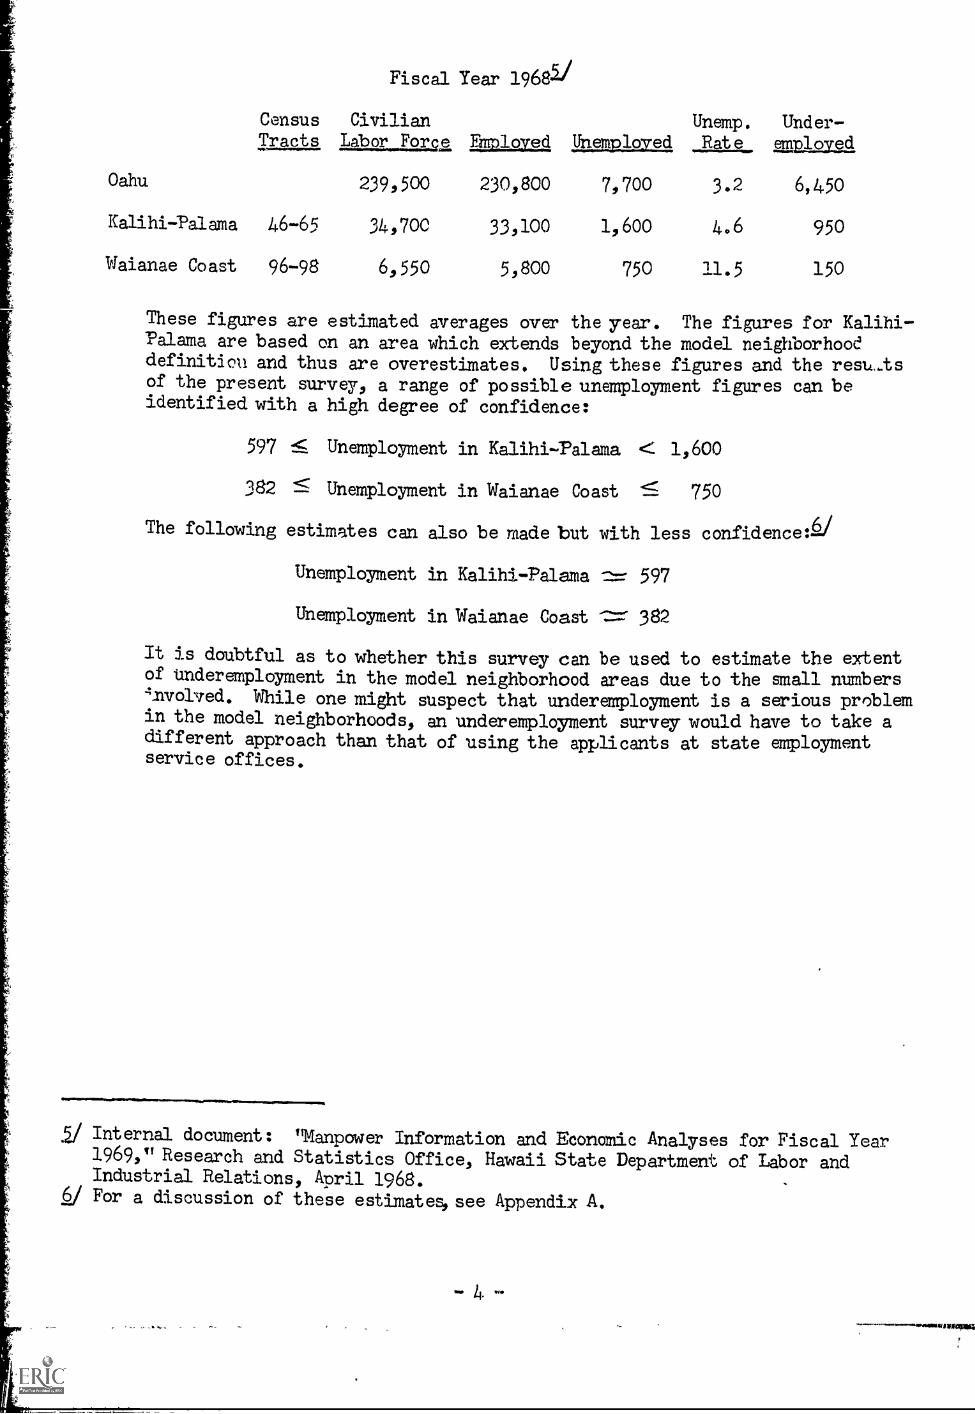
Fiscal Year 196851
Census Civilian Unemp. Under-Tracts Lgbor Force EMDloved Unemplaved Rate =played
Oahu 239,500 230,800 7,700 3.2 6,450
Kalihi-:Palama 46-65 34,700 33,100 1,600 4.6 950
Waianae Coast 96-98 6,550 5,800 750 11.5 150
These figures are estimated averages over the year. The figures for Kalihi-Palama are based on an area which extends beyand the model neighborhooddefinition and thus are overestimates. Using these figures and the resu-tsof the present gurvey, a range of possible unemployment figures can beidentified with a high degree of confidence:
597 1.4.C.: Unemployment in Kalihi-Palama < 1,600
382 Unemployment in Waianae Coast 750
The following estimates can also be made tmt with less confidence:Li
Unemployment in Kalihi-Palama 597
Unemployment in Waianae Coast 382
It is doubtful as to whether this survey can be used to estimate the extentof underemployment in the model neighborhood areas due to the snall numbers4.nvolved. While one might suspect that underemployment is a serious problemin the model neighborhoods, an underemployment survey would have to take adifferent approach than that of using the aRplicants at state enploymentservice offices.
2/ Internal document: "Manpower Information and Ecommic Analyses for Fiscal Year1969," Research and Statistics Office, Hawaii State Department of labor andIndustrial Relations, April 1968.
6/ For a discussion of these estimateg,see Appendix A.
- 4 -

II. KALIHI-PALAMA
II. Kalihi-Palama
A. A General Tofile of Job-Seekers Residing in Kalihi-Palmma
This survey considered all employment service applicants who wereactively seeking full-time, permanent employment (as of 4:00 p.m.,June 25, 1968), summer workem, other temporary workers, and part-time
workers were not considered.li Thus, the total number of Kalihi-Palamaresidents who were in contact with the state employment service is largerthan the number included in this survey. This survey sought to obtain aprofile of the job-seekers for whom emplcon ent was ..;ruciall i.e., thoseseeking full-time, permanent work.
There were 499 Kalihi-Palama residents seeking full-time, permanentemployment. Two-thirds of these job-seekers mere males, one-third females.The largest nuMber of job-seekers came fram census tract 60 (table II-1).Over half of the Kalihi-Palama job-seekers had registered at the IndustrialOffice. Only 19.4 percent had contacted the Employment Opportunity Center(table II-2), although a much higher percentage were recognized as having
"problems in seeking employment" (table II-11).
All job-seekers in this survey fall in one of the following categories:
1. Fully employed: those working full-time and at their skill level
2. Underemployed: those working part-time amd who are seeking full-time work, and those working below their skill level
3. Unemployed: those not working and who are seeking employment
Over 90 percent of those in the present sarv (tables I1-3 and 111-3) wereunemployed. An inportant imponderable as far as this survey is concernedis the number of underemployed workers who are not actively engaged in thejob hunt but who would seek other employment if they- felt it Isms available.
The unemployed worker nmst fall in one and only one of the followingcategories:
1. Continuing: those who have not left the labor force since theirlast employment
2. Local entrants: those with no previous job experience
3. In-migrant entrants: those mith no previous j6b experience in thestate though they have worked elsewhere
4. Local re-entrants: those who have left the labor force since theirlast employment
5. Inmigrant re-entrants: those whojave worked elsewhere since1
their last employment in the stat
2/ See Appendix B for definitions.
In addition, table 11-3 subdivides the cmtinuing unemployed according to
the t_Ime span since their lasz employmen.
The median age for the male job-seeker is 36 and that for the female
job-seeker is 26 (table 11-4). This difference is due to the fact that
there are more older male job-seekers than female j6b-seekers; males and
females are evenly distributed in the younger age groups (tdble 11-5).
These older male job-seekers constitute the bulk of the non-U. S. citizen
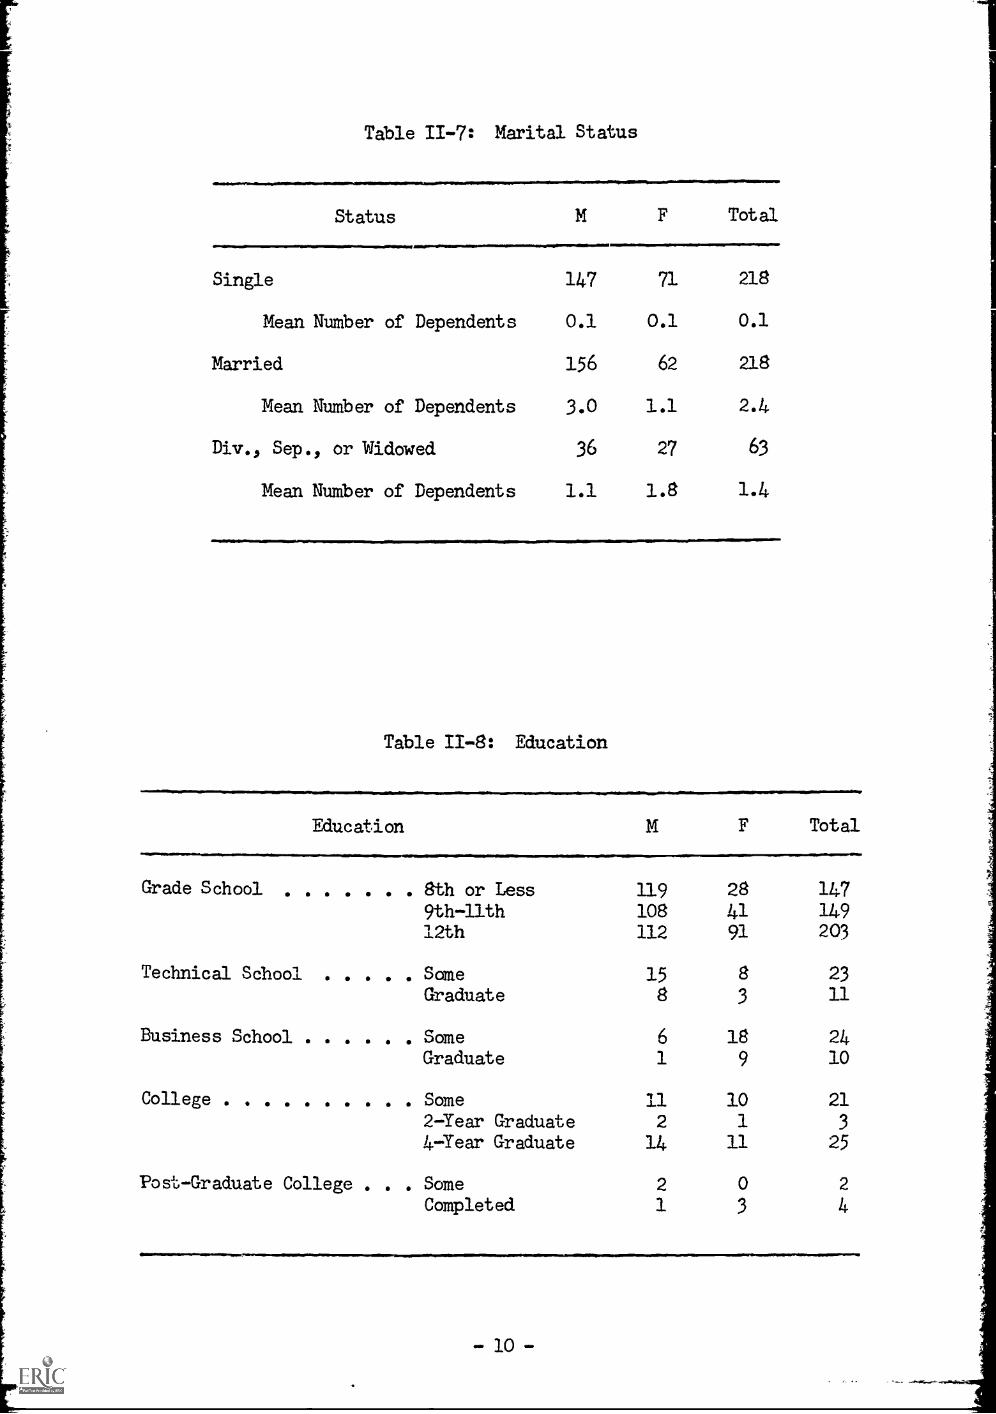
job-seekers (table 11-6). Married and single j6b-seekers are evenly
distributed (+mbio TT.7), Nei ve qingle job-seekers (largely female) did
have at least one dependent.
About 60 percent of the job-seekers have not completed high school
(table 11-8). A larger percentage of the male applicants fall in this
category, which seems related to the fact that male job-seekers tend to be
older. The sum of the technical school, business school, college, and
post-graduate college work categories is larger than the total number of
job-seekers who have post-high school training since several high school
graduates fell in more than one category. For example, nearly all of
those who entered but did not complete college also have some business or
technical school training.
Table 11-9 presents an occupational breakdown of the Kalihi-Palama
job-seekers and the state employment service total for Oahu. It gives the
number of job-seekers who are fully qualified, i.e., those who have no Vs
appearing in their occupational title, in each category, Entries represent
those mho are not fully qualified but who usually are amenable to further
training in the area in which they are seeking employment. Kalihi-Palama
job-seekers who are not fully qualified make up 9.3 percent of the Oahu
total as compared to 6.5 percent for those who are fully qualified. The
bulk of those not fully qualified are in the service occupaUons and
miscellaneous occupations categories. The latter includes those job-
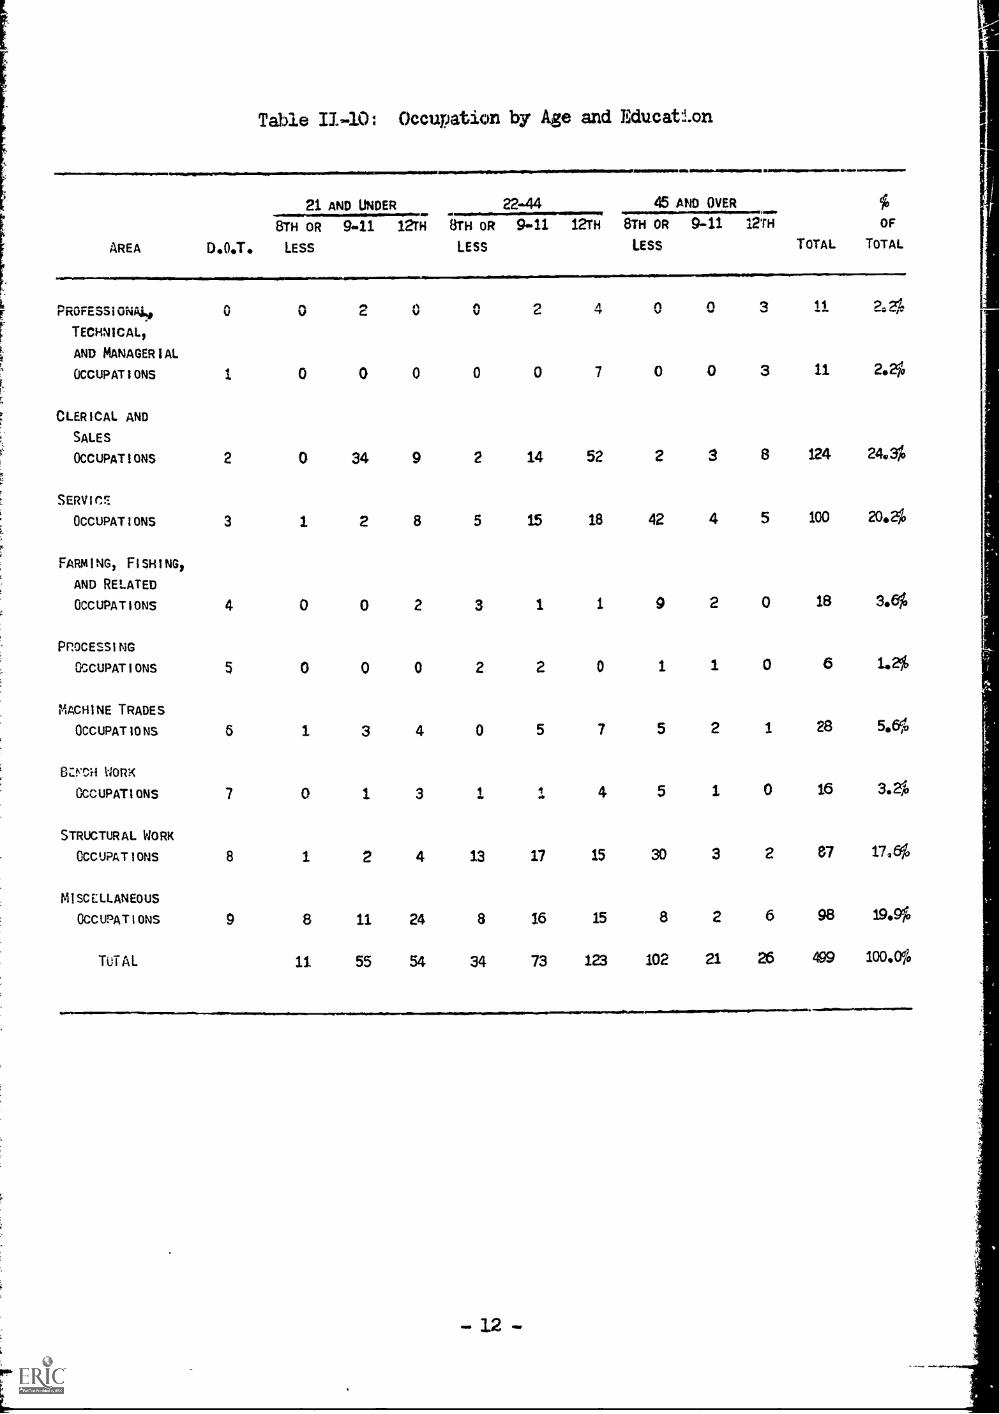
seekers mhose classification was still pending. Table II-10 gives an age
and grade school breakdown of those seeking work in each occupational
category (including those not fully qualified). The bulx of the age 21 and
under high school dropouts fall in the clerical and sales occupations and
miscellaneous occupations categories. These are generally not fully
qualified. On the other hand, the bulk of the age 45 and aver high school
dropouts fall in the service and structural occupations. Apparently younger
job-seekers prefer office work, despite the fact that they are not fully
qualified rather than blue collar work for which they may have been fully
qualified.
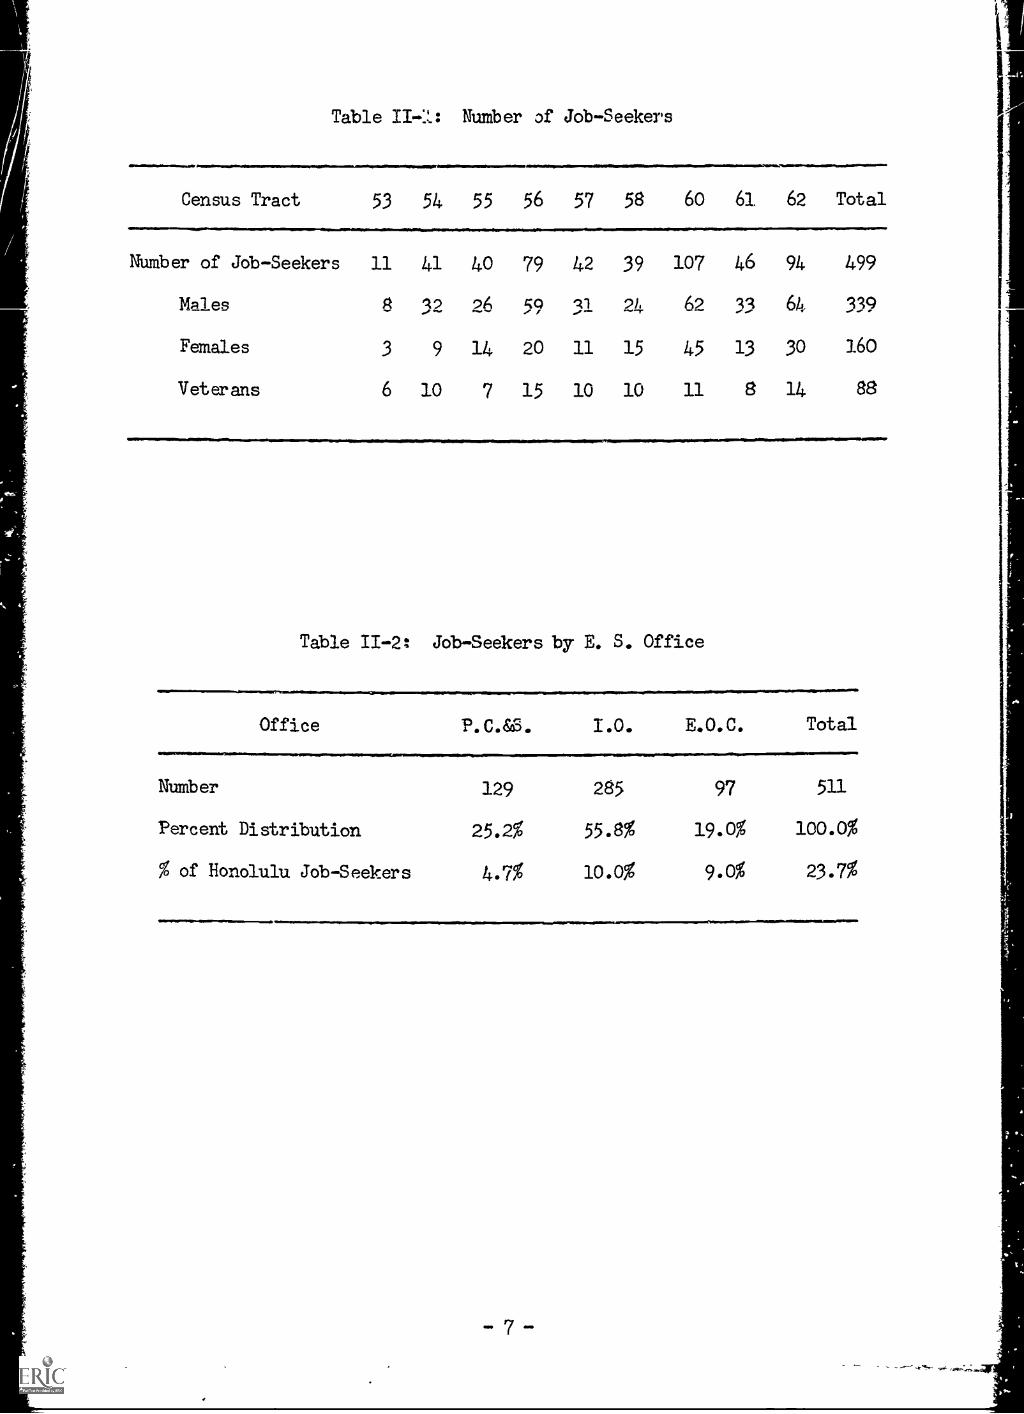
Table NurOoer of Job-Seekers
Census Tract 53 54 55 56 57 58 60 61 62 Total
Nuthber of J6b-Seekers 11 41 40 79 42 39 107 46 94 499
Males
Females
Veterans
g 39 94 59 31 24 62 33 64 339
3 9 14 20 11 15 45 13 30 160
6 10 7 15 10 10 11 8 14 88
Table 11-2: Job-Seekers by E. S. Office
Office 1.0. E.O.C. Total
Nuthber 129 285 97 511
Percent Distribution 25.2% 558% 19.0% 100.0%
% of Honolulu Job-Seekers 4.7% 10.0% 9.0% 23.7%
7
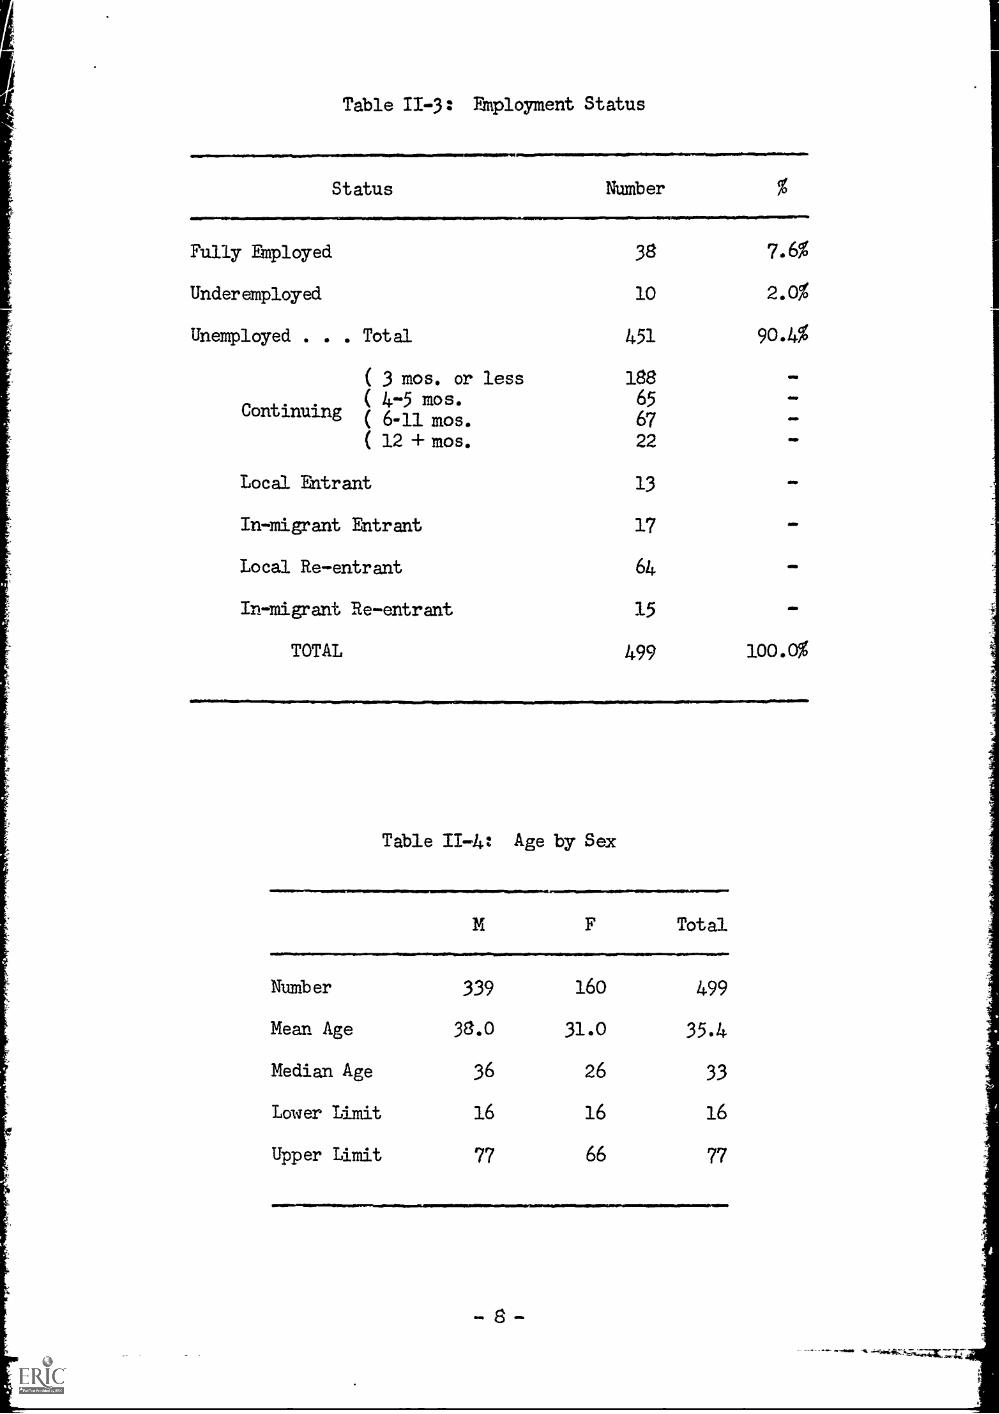
Table II-3: Employment Status
Status NuMber
Fully Employed 38 7.6%
Underemployed 10 2.0%
Unemployed . . . Total 451 90.4%
( 3 mos. or less 188
( 4-5 mos. 65Continuing ( 6-11ms. 67 -
( 12 4-mos. 22
Local Entrant
In-migrant Entrant
Local Re-entrant
In-,migrant Re-entrant
TOTAL
13
17
64
15
499
=ND
AIM
AIM
loo.0%
Table 11-4: Age by Sex
Total
Number 339 160 499
Mean Age 38.0 31.0 35.4
Median Age 36 26 33
Lower Limit 16 16 16
Upper Limit 77 66 77
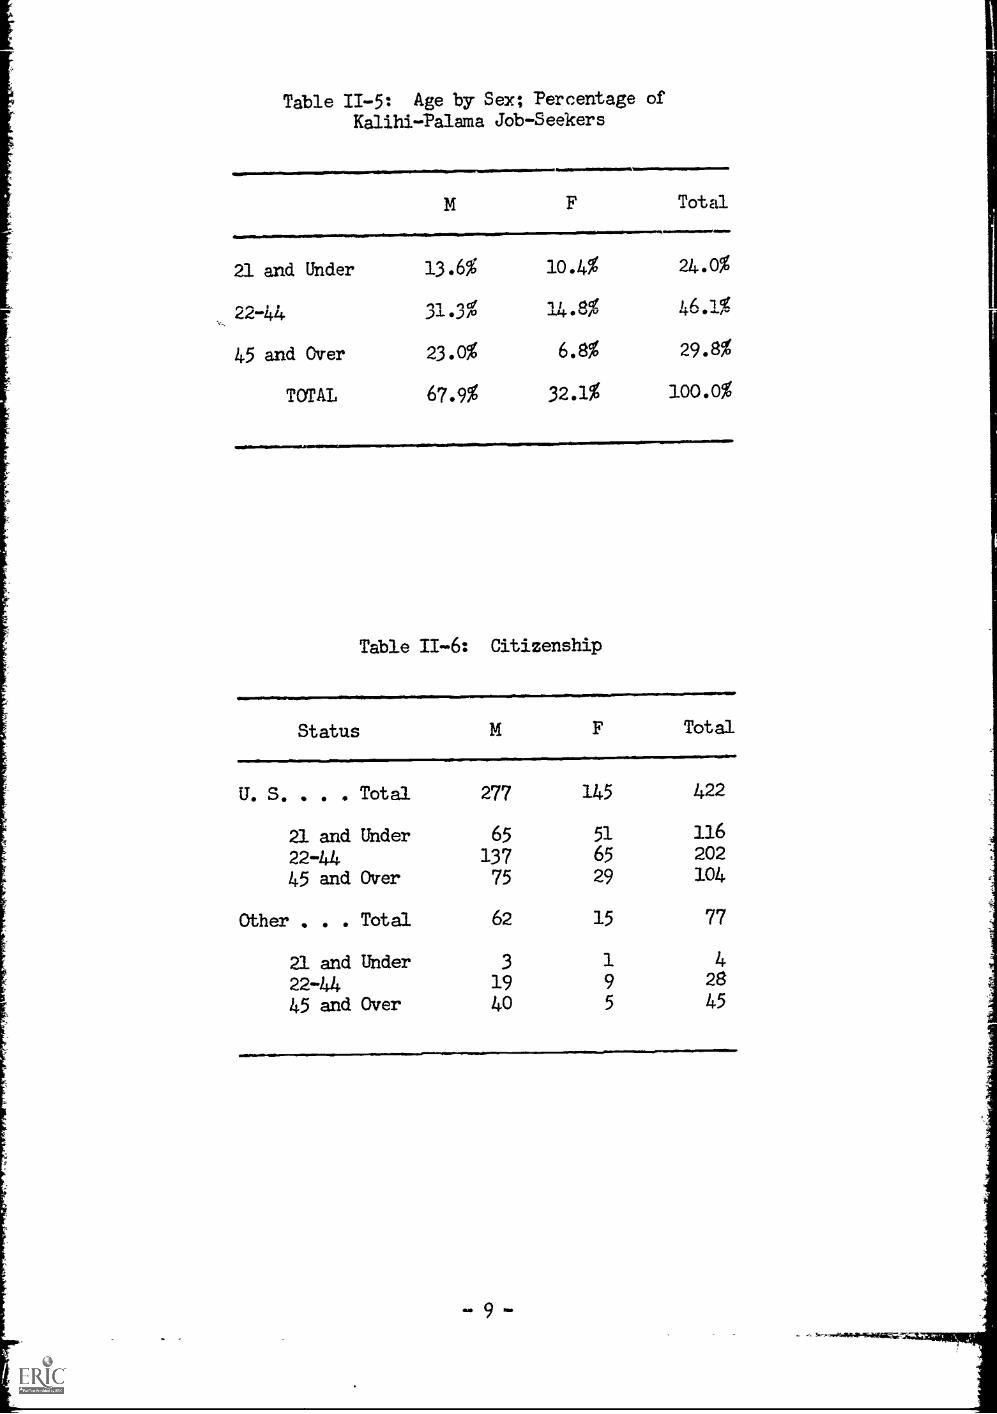
Table 11-5: Age by Sex; Percentage ofKalihi-Palmna Job-Seekers
21 and Under
22-44
45 and Over
TOTAL
13.6%
n of/0
23.0%
67.9%
Tatal
10.4% 24.0%
1/ 00/ 4601%
6.8% 29.8%
32.1% 100.0%
Table 11-6: Citizenship
Status M F Total
U. S. . . . Total 277 145 422
21 and Under 65 51 116
22-44 137 65 202
45 and Over 75 29 104
Other . . Total 62 15 77
21 and Under 3 1 4
22-44 19 9 28
45 and Over 40 5 45
- 9 -
Tdble 11-7: Marital Status
Status M
Single 147
Mean NuMber of Dependents 0.1
Married 156
Mean NuMber of Dependents 3.0
F Total
71 218
0.1 0.1
62 218
1.1 2.4
Div., Sep., or Widowed 36 27 63
Mean NuMber of Dependents 1.1 1.8 1.4
Table 11-8: Education
Education M F Total
Grade School 8th or Less 119 28 1479th-llth 108 41 14912th 112 91 203
Technical School Same 15 8 23
Graduate 8 3 11
Business School Some 6 18 24Graduate 1 9 10
College Some 11 10 212-Year Graduate 2 1 34-Year Graduate 14 11 25
Post-Graduate College . . Same 2 0 2
Completed 1 3 4
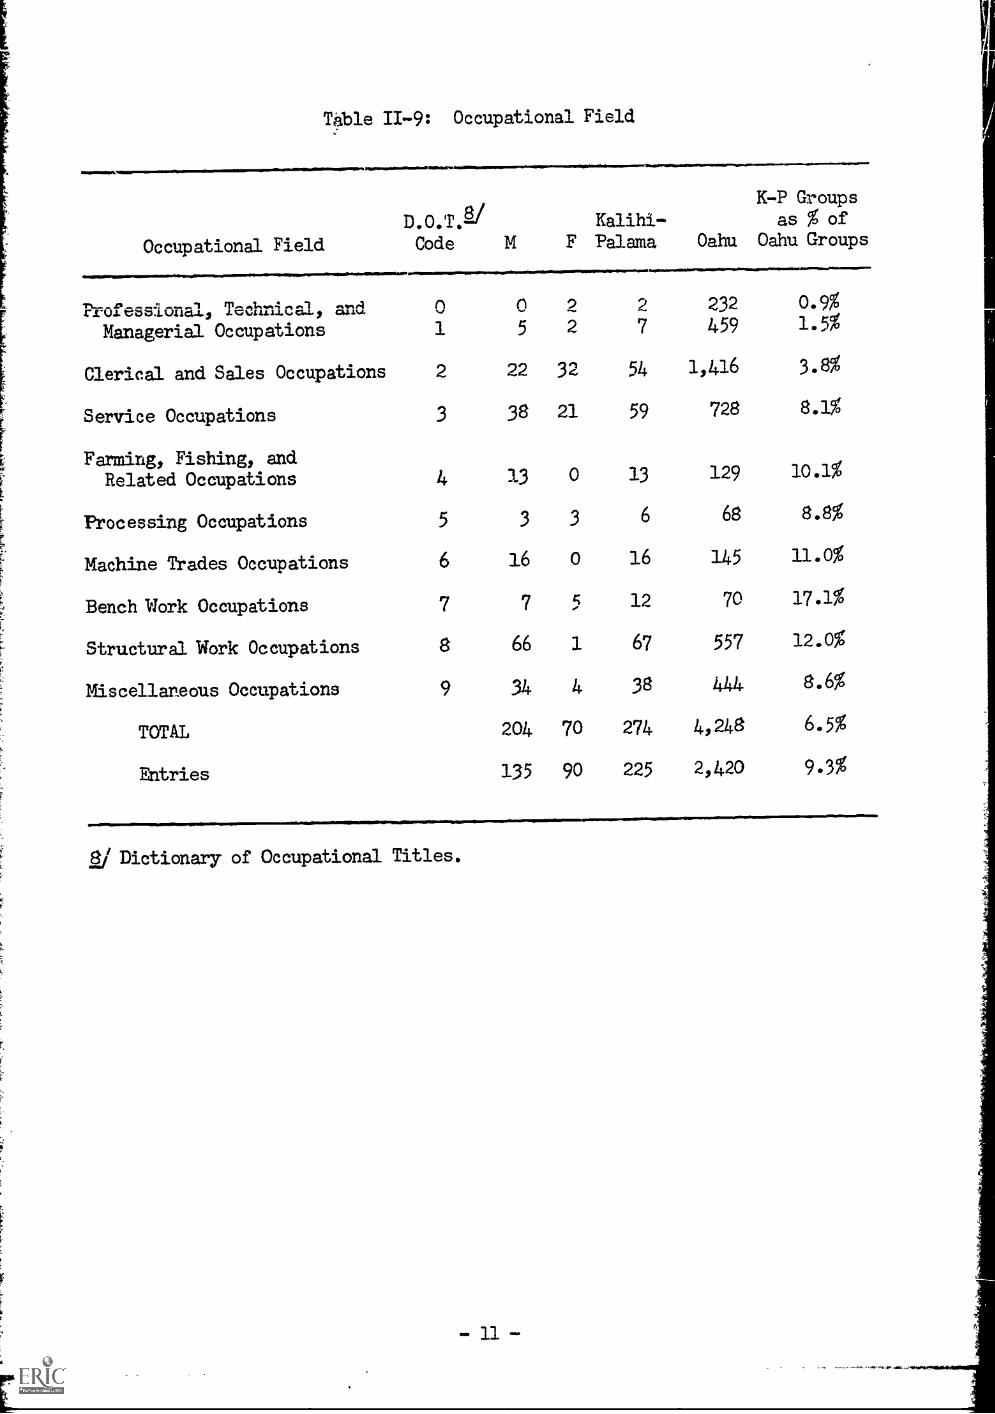
Table 11-9: Occupational Field
Occupational Field
aw.i.lumfwwm=of
K-P Groups
D.O.TA/ Kalihi- as % of
Code M F Palama Oahu Oahu Groups
Professional, Technical, and 0 n 9 2 232 0.9%
Managerial Occupations 1 5 2 7 459 1.5%
Clerical and Sales Occupations 2 22 32 54 1,416 3.
Service Occupations 3 38 21 59 728
Farming, Fishing, andRelated Occupations 4 13 0 13 129 10.1%
Frocessing Occupations 5 3 3 6 68 8.8%
Machine Trades Occupations 6 16 0 16 145 11.0%
Bench Work Occupations 7 7 5 12 70 17.1%
Structural Work Occupations 8 66 1 67 557 12.0%
Miscellaneous Occupations 9 34 4 38 hilh 8.6%
TOTAL 204 70 274 41248 6.5%
Entries 135 90 225 2,420 9.3%
8.1%
ES Dictionary of Occupational Titles.
AREA D.O.T. LESS
,8TH OR 941 12TH 8TH OR 911 12TH 8TH OR 9-11 12TH
LESS LESS
.1=11010111..0.011
..
TOTAL TOTAL
OF
1
Table I1-10: Occupation by Age and EducatLan
-----21 AND UNDER 22-44 45 AND OVER
..
%
rrcurtaturimisy 0 0 G0%
VA
VA 2 -,
r, A 0 0 Q 11 2
TECHNICAL,
AND MANAGERIAL
OCCUPATIONS 1 0 0 0 0 0 7 0 0 3 11. 2.40
CLERICAL AND
SALES
OCCUPATIONS 2 0 34 9 2 14 52 2 3 8 124 24.3%
SERVICE
OCCUPATIONS 3 1 2 8 5 15 18 42 4 5 100 20.2%
FARMING, FISHING,
AND RELATED
OCCUPATIONS 4 0 0 2 3 1 1 9 2 0 18 366%
PROCESSING
OCCUPATIONS 5 0 0 0 2 2 0 1 1 0 6 1.2%
MACHINE TRADES
OCCUPATIONS 6 1 3 4 0 5 7 5 2 1 28 5,6%
sa.cii WORK
OCCUPATIONS 7 0 1 3 1 1 4 5 1 0 16 3.2%
STRUCTURAL WORK
OCCUPATIONS 8 1 2 4 13 17 15 30 3 2 87 17.6%
MISCELLANEOUS
OCCUPATIONS 9 8 11 24 8 16 15 8 2 6 98 19.9%
ToTAL 11 55 54 34 73 123 102 21 26 499 100.0%
-12-
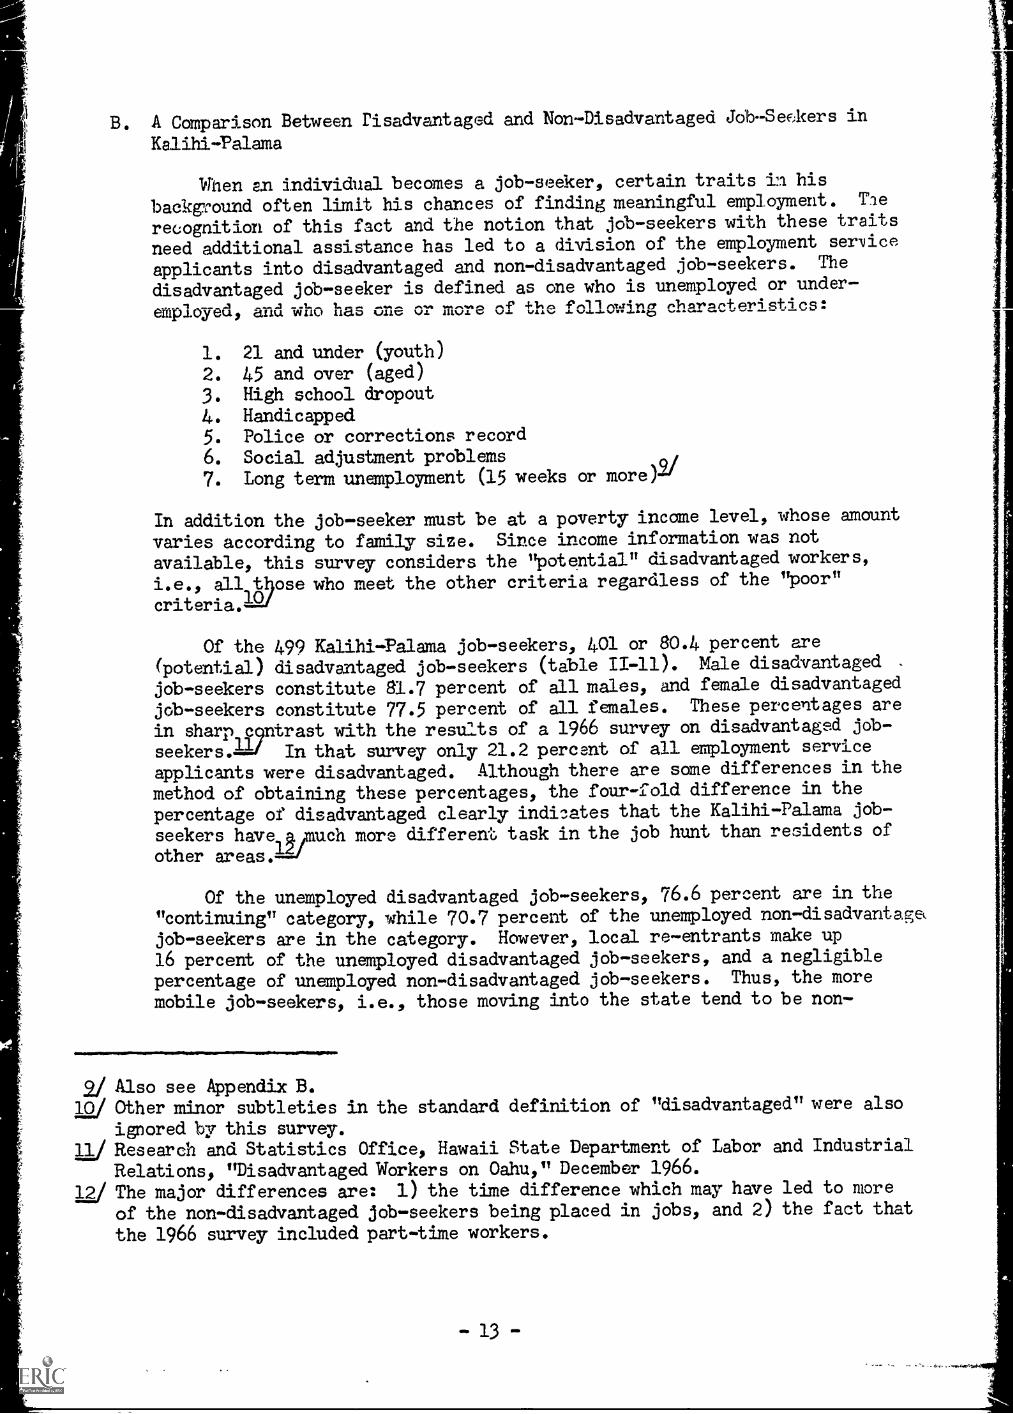
B. A Comparison Between risadvantaged and Non-Disadvantaged JdbSef;kers in
Kalihi-Palama
When an individual becomes a job-seeker, certain traits in his
background often limit his chances of finding meaningful employment. Tle
recognition of this fact and the notion that job-seekers with these traits
need additional assistance has led to a division of the employment service
applicants into disadvantaged and non-disadvantaged job-seekers. The
disadvantaged job-seeker is defined as one who is unemployed or under-
empldyed, and who has one or more of the following characteristics:
1. 21 and under (youth)
2. 45 and over (aged)3. High school dropout
4. Handicapped5. Police or corrections record6. Social adjustment prdblems
7. Long term unemployment (15 weeks or more)2/
In addition the job-seeker must be at a poverty incame level, whose amount
varies according to family size. Since income information was not
available, this survey considers the "potential" disadvantaged workers,
i.e., all those who meet the other criteria regardless of the "poor"
criteria.12/
Of the 499 Kalihi-Palama job-seekers, 401 or 80.4 percent are
(potential) disadvantaged job-seekers (table II-11). Male disadvantaged .
job-seekers constitute 81.7 percent of all males, and female disadvantaged
jdb-seekers constitute 77.5 percent of all females. These percentages are
in sharp c9ntrast with the results of a 1966 survey on disadvantaged job-
seekers...11i In that survey only 21.2 percent of all employment service
applicants w.ere disadvantaged. Although there are some differences in the
method of obtaining these percentages, the four-fold difference in the
percentage of disadvantaged clearly indicates that the Kalihi-Palama job-
seekers have,41much more different task in the job hunt than residents of
other areas.4,41
Of the unemployed disadvantaged job-seekers, 76.6 percent are in the
"comtinuing" category, while 70.7 percent of the unemployed non-disadvantae.
jdb-seekers are in the category. However, local re-entrants make up
16 percent of the unemployed disadvantaged job-seekers, and a negligiblepercentage of unemployed non-disadvantaged job-seekers. Thus, the more
mobile job-seekers, i.e., those moving into the state tend to be non-
2/ Also see Appendix B.12/ Other minor sUbtleties in the standard definition of "disadvantaged" were also
igrored by this survey.11/ Research and Statistics Office, Hawaii State Department of Lgbor and Industrial
Relations, "Disadvantaged Workers on Oahu," December 1966.12/ The major differences are: 1) the time difference which may have led to more
of the non-disadvantaged job-seekers being placed in jobs, and 2) the fact that
the 1966 survey included part-time workers.
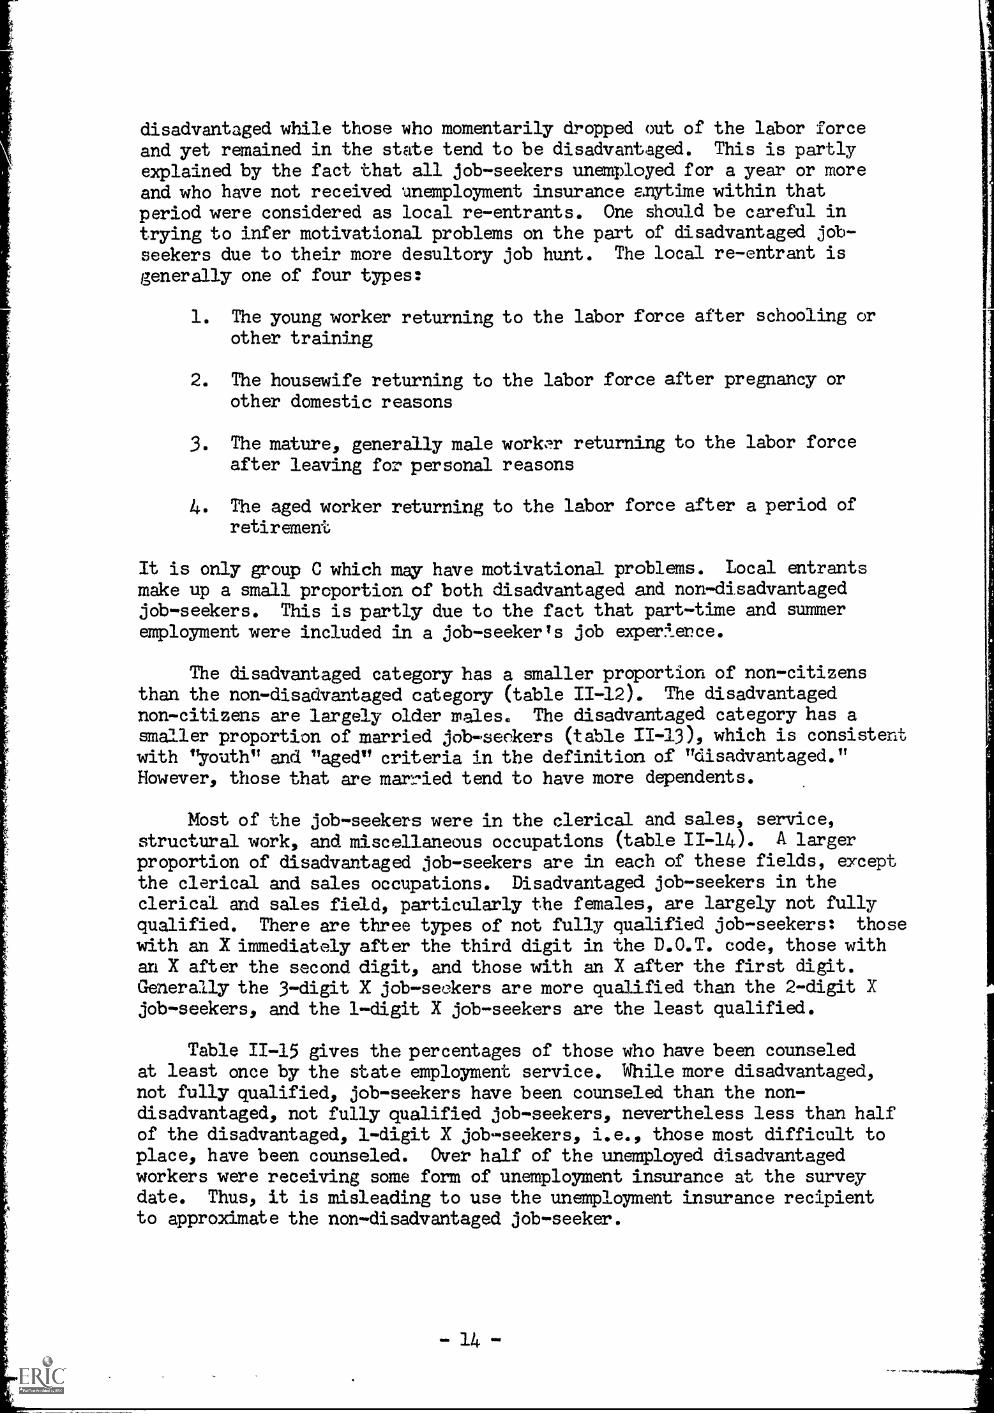
disadvantaged while those who momentarily dropped out of the labor forceand yet remained in the state tend to be disadvantaged. This is partlyexplained by the fact that all job-seekers unemployed for a year or moreand who have not received unemployment insurance anytime within thatperiod were considered as local re-entrants. One Should be careful intrying to infer motivational problems on the part of disadvantaged job-seekers due to their more desultory job hunt. The local re-entrant is
generally one of four types:
1. The young worker returning to the labor force after schooling orother training
2. The housewife returning to the labor force after pregnancy orother domestic reasons
3. The mature, generally male woriv,r returning to the labor forceafter leaving for personal reasons
4. The aged worker returning to the labor force after a period ofretirement
It is only group C which may have motivational prcblems. Local entrants
make up a small proportion of both disadvantaged and non-disadvantagedjob-seekers. This is partly due to the fact that part-time and summeremployment were included in a job-seeker's job experl_erce.
The disadvantaged category has a smaller proportion of non-citizensthan the non-disadvantaged category (table 11-12). The disadvantagednon-citizens are largely older males. The disadvantaged category has asmaller proportion of married job-seokers (table II-13), which is consistentwith "youth" and "aged" criteria in the definitian of "disadvantaged."However, those that are married tend to have more dependents.
Most of the job-seekers were in the clerical and sales, service,structural work, and miscellaneous occupations (table 11-14). A largerproportion of disadvantaged job-seekers are in each of these fields, exceptthe clerical and sales occupations. Disadvantaged job-seekers in theclerical and sales field, particularly the females, are largely not fullyqualified. There are three types of not fully qualified job-seekers: those
with an X immediately after the third digit in the D.O.T. code, those withan X after the second digit, and those with an X after the first digit.Generally-the 3-digit X job-seekers are more qualified than the 2-digit Xjob-seekers, and the 1-digtt X job-seekers are the least qualified.
Table 11-15 gives the percentages of those who have been counseledat least once by the state employment service. While more disadvantaged,not fully qualified, job-seekers have been counseled than the non-disadvantaged, not fully qualified job-seekers, nevertheless less than halfof the disadvantaged, 1-digit X job-seekers, i.e., those most difficult toplace, have been counseled. Over half of the unemployed disadvantagedworkers were receiving same form of unemployment insurance at the surveydate. Thus, it is misleading to use the unemployment insurance recipientto approximate the non-disadvantaged job-seeker.
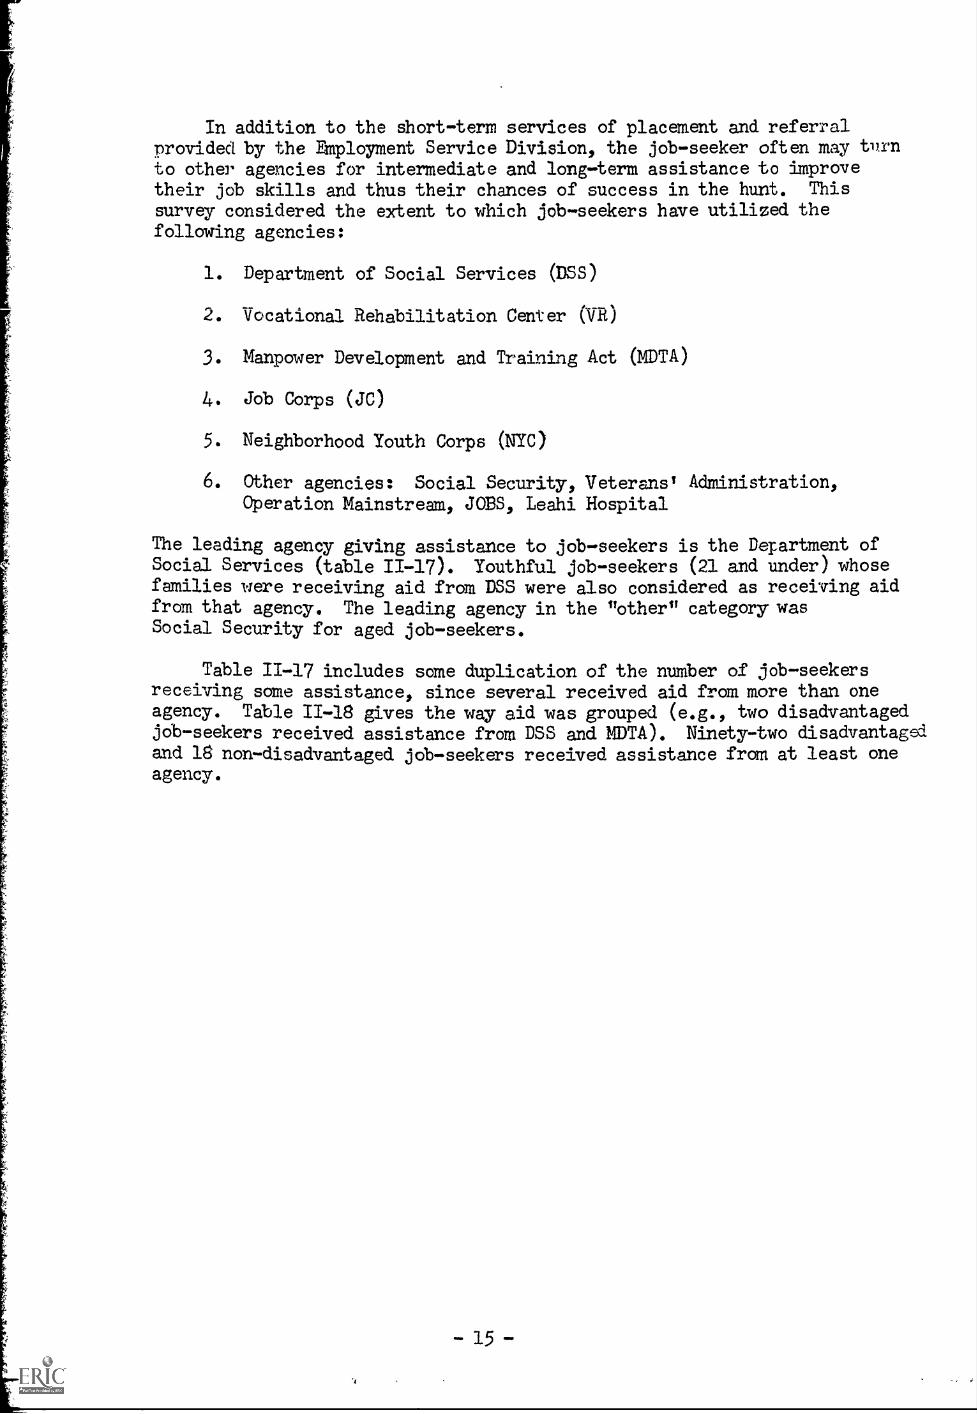
In addition to the short-term services of placement and referralprovided by the Employment Service Division, the job-seeker often may turnto other agencies for intermediate and long-term assistance to improvetheir job skills and thus their chances of success in the hunt. This
aurvey considered the extent to which job-seekers have utilized thefollowing agencies:
1. Department of Social Services (DSS)
2. Vocational Rehabilitation Center (VR)
3. Manpower Development and Training Act (MDTA)
4. Job Corps (JC)
5. Neighborhood Youth Corps (NYC)
6. Other agencies: Social Security, Veterans' Administration,Operation Mainstream, JOBS, Leahi Hospital
The leading agency giving assistance to job-seekers is the Department ofSocial Services (table 11-17). Youthful job-seekers (21 and under) whosefamilies were receiving aid from DSS were also considered as receiving aidfrom that agency. The leading agency in the "other" category wasSocial Security for aged job-seekers.
Table 11-17 includes same duplication of the number of job-seekersreceiving same assistance, since several received aid from more than oneagency. Table II-18 gives the way aid was grouped (e.g., two disadvantaged
job-seekers received assistance fram DSS and MDTA). Ninety-two disadvantagedand 18 non-disadvantaged job-seekers received assistance from at least oneagency.
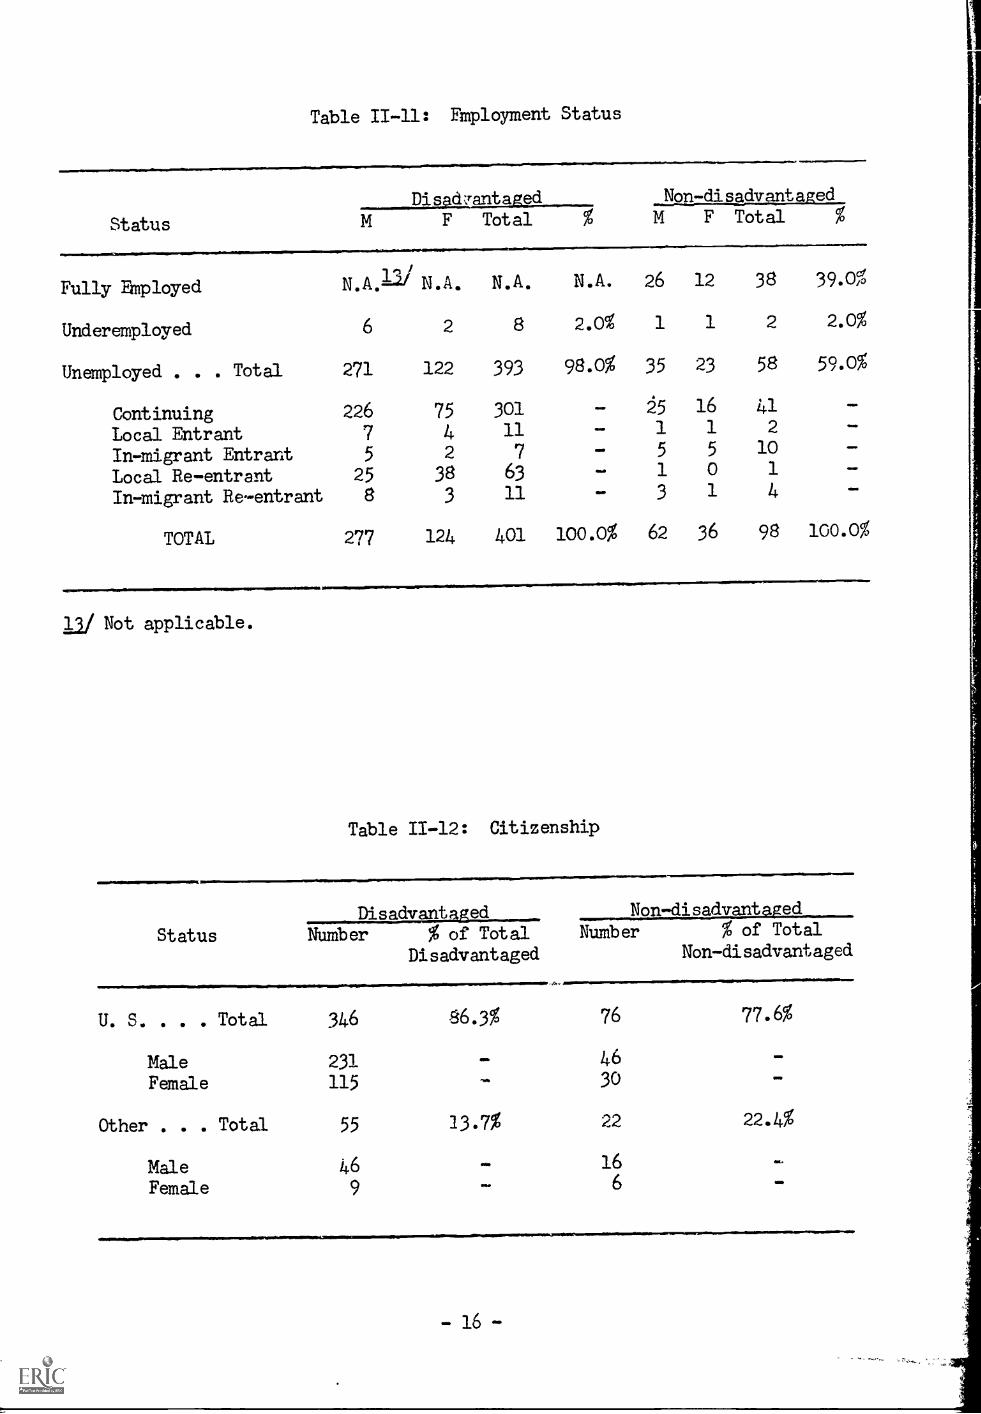
Table II-11: Fmployment Status
Dis chranta ed Non-disadvantaged
Status F
Fully EMployed
Underemployed
Unemployed . . . Total
N.A.12/ N.A.
6 2
271 122
Continuing 226 75
Local Entrant 7 4
In-amigrant Entrant 5 2
Local Re-entrant 25 38
In-migrant Re-entrant 8 3
TOTAL 277 124
Total % M F Total
N.A. N.A.
8 2.0%
26 12 38 39.0%
1 1 2 2.0%
393 98.0% 35 23 58 59.0%
301 - 5 16 41
11 _ 1 1 2
7 - 5 5 10
63 - 1 0 1
11 - 3 1 4
OMR
401 100.0% 62 36 98 100.0%
12/ Not applicable.
Table 11-12: Citizenship
Status
Non-disadvantaged
Number % of Total Number % of Total
Disadvantaged Non-disadvantaged
U. S. . . . Total 346 86.3% 76
Male 231 - 46
Female 115 - 30
Other . . Total 55 23.7% 22
Male 46 _ 16
Fenale 9 - 6
77.6%
11=11
22.4%
11=11
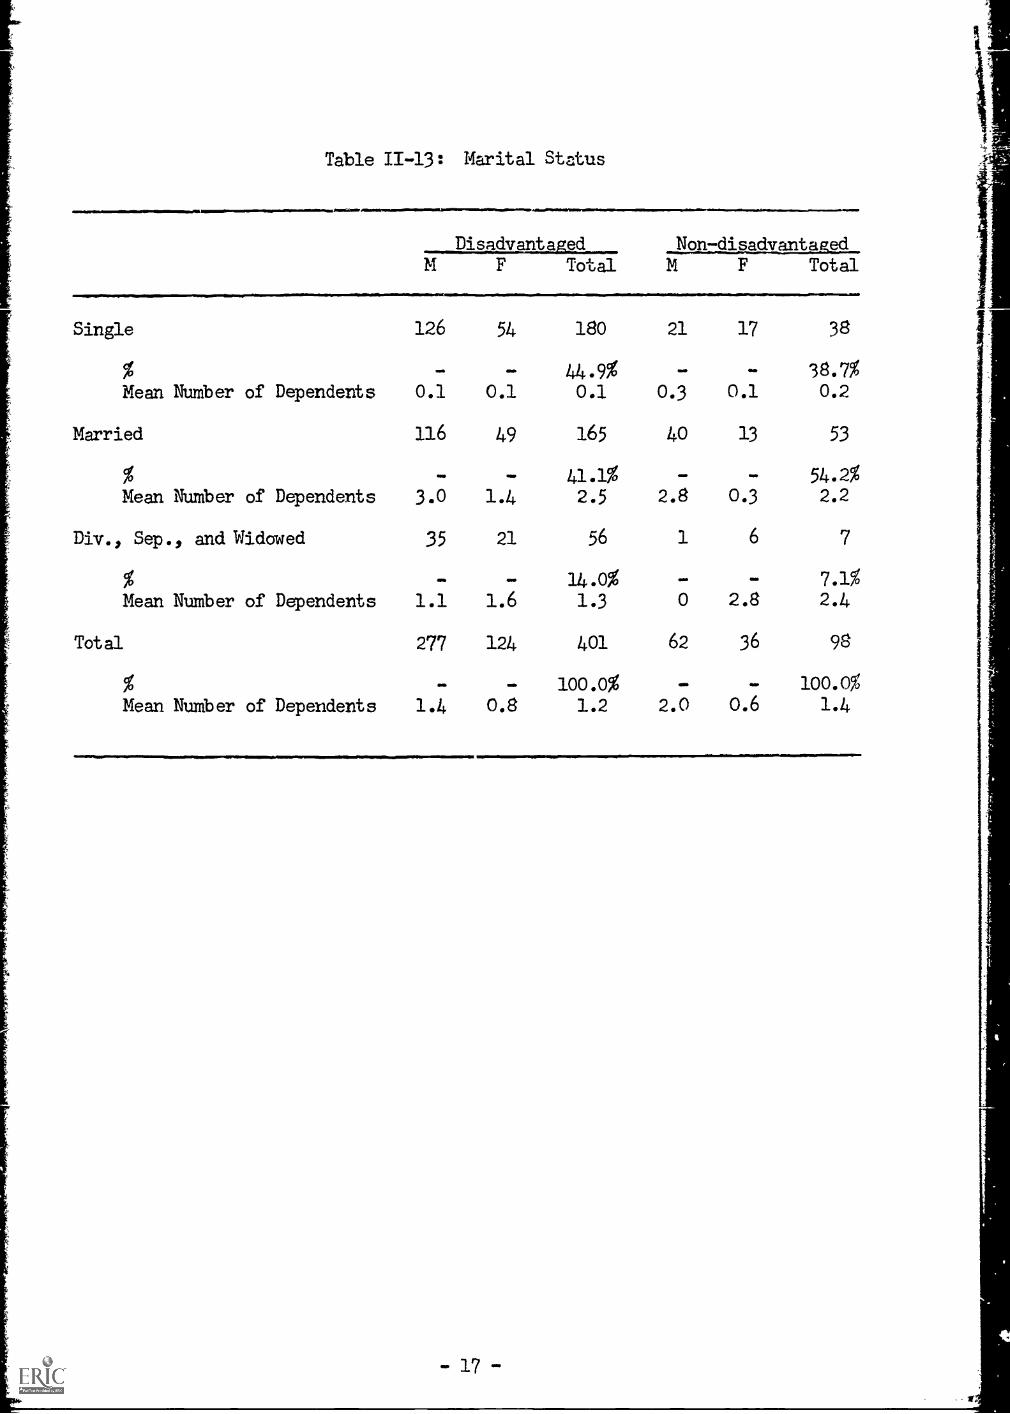
Table 11-13: Marital Status
Disadvantaged Non-disadvantagedTotal M F Total
Single 126
-
Mean NuMber of Dependents 0.1
Married 116
54 180 21 17 38
- 44.9% - - 38.7%
0.1 0.1 0.3 0.1 0.2
49 165 40 13 53
. - 41.1%Mean Number of Dependents 3.0 1.4 2.5
Div., Sep., and Widowed 35 21 56
- - 14.0%Mean Number of Dependents 1.1 1.6 1.3
Total 277 124 401
- - 100.0%Mean Number of Dependents 1.4 0.8 1.2
- - 54.2%2.8 0.3 2.2
1 6 7
- - 7.1%0 2.8 2.4
62 36 98
- - 100.0%
2.0 0.6 1.4
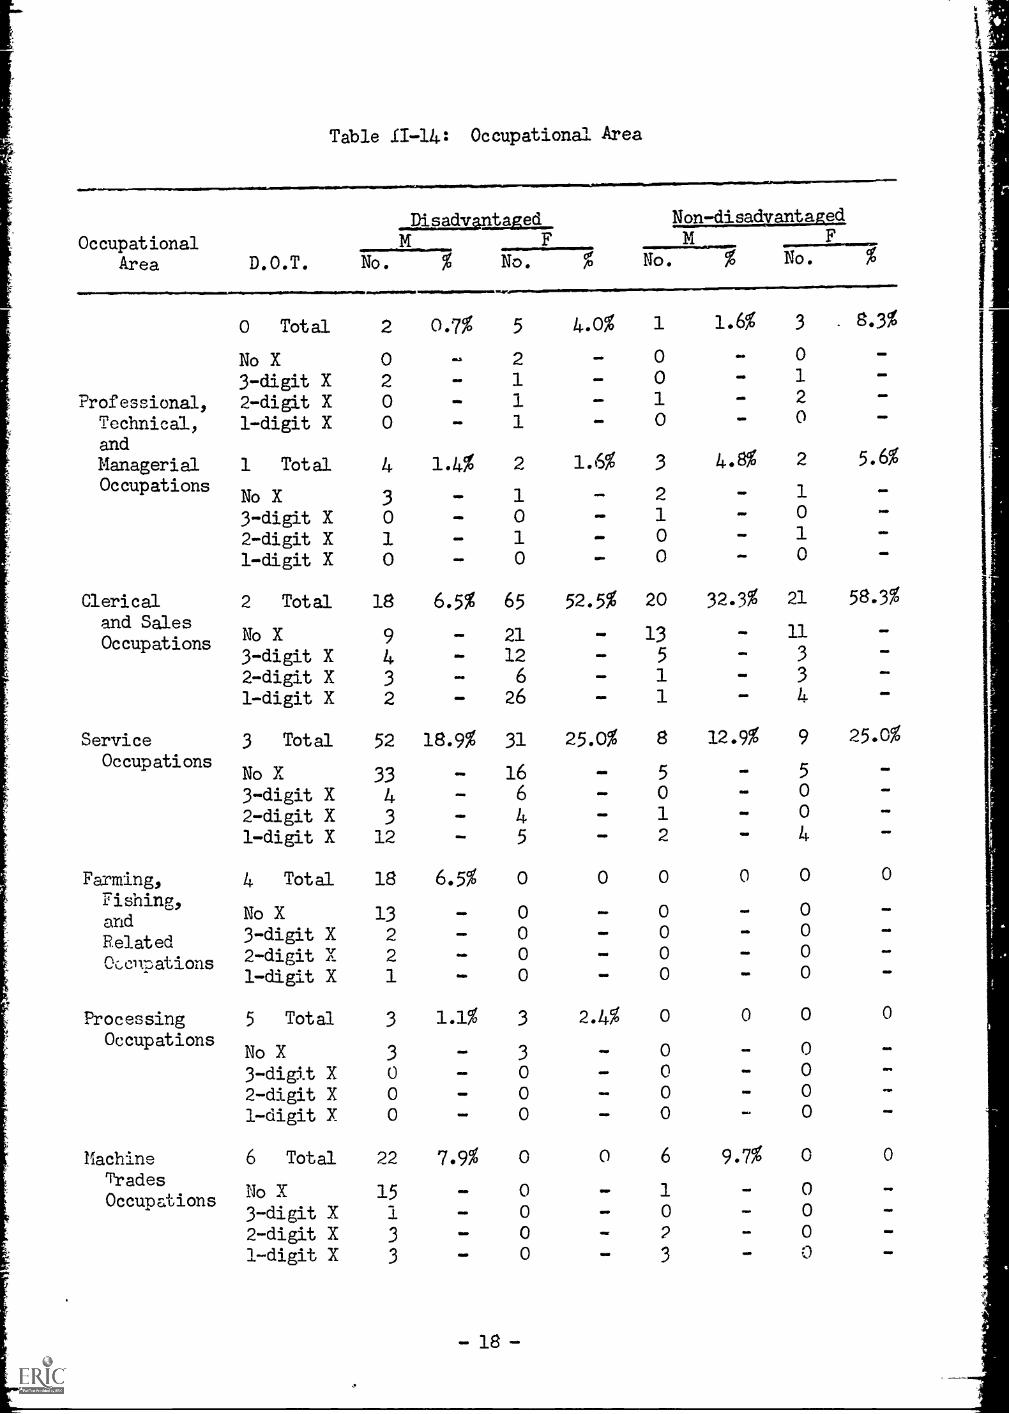
Table 11-14: Occupational Area
OccupationalArea D.O.T.
Professional,Technical,
andManagerialOccupations
Clericaland SalesOccupations
ServiceOccupations
Farming,Fishing,
andRelatedOccnpations
ProcessingOccupations
MachineTradesOccupations
0 Total
No X3-digit X2-digit X1-digit X
1 Total
No X3-digit X2-digit X1-digit X
j21,§14zary. Non-disadvantaged
No. % No. No. % No.
2
0200
4
3
10
0.7%
.
.
--
1.4%
MN.
INS
5
2111
2
1
1
4.0%
----
1.6%
*M.
MID
41
1
0010
3
21
0
1.6%
-.
--
4.8%
MI/
OEM
3
0
1
20
2
1
1
.
5.6%
INS
tad.
MOD
2 Total 18 6.5% 65 52.5% 20 32.3% 21 58.3%
No X3-digit X2-digit X1-digit X
3 Total
No X3-digit X2-digit X1-digit X
4 Total
No X3-digit X2-digit X1-digit X
5 Total
No X3-digit X2-digit X1-digit X
9 21 13 11
4 - 12
3 - 6
2 - 26
- 5 - 3
- 1 - 3
- 1 - 4
MOP
*We
INS
52 18.9% 31 25.0% 8 12.9% 9 25.0%
33 - 16 - 5 - 5
4 - 6 - 0 - 0
3 - 4 - 1 . 0
12 - 5 .4. 2 - 4
18 6.5% 0 0 0 0 0 0
41111.
ONO
13 - 0 - o - 0
2 - 0 - o - o
2 - o - o - o
1 . o - o - o
3
3
1.1% 3 2.4% 0 0 0
... 3 ... 0 - 0.4. 0 ... 0 - 0
0 - 0 - 0 - 0
0 - 0 . 0 - 0
6 Total 22 7.9% 0 0 6 9.7% 0
No X 153-digit X 12-digit X 3
1-digit X 3 IMO
MEP
Ma'
1
2
3
MI/
IMO
en*
0
ONO
011111,
ON.
enlID
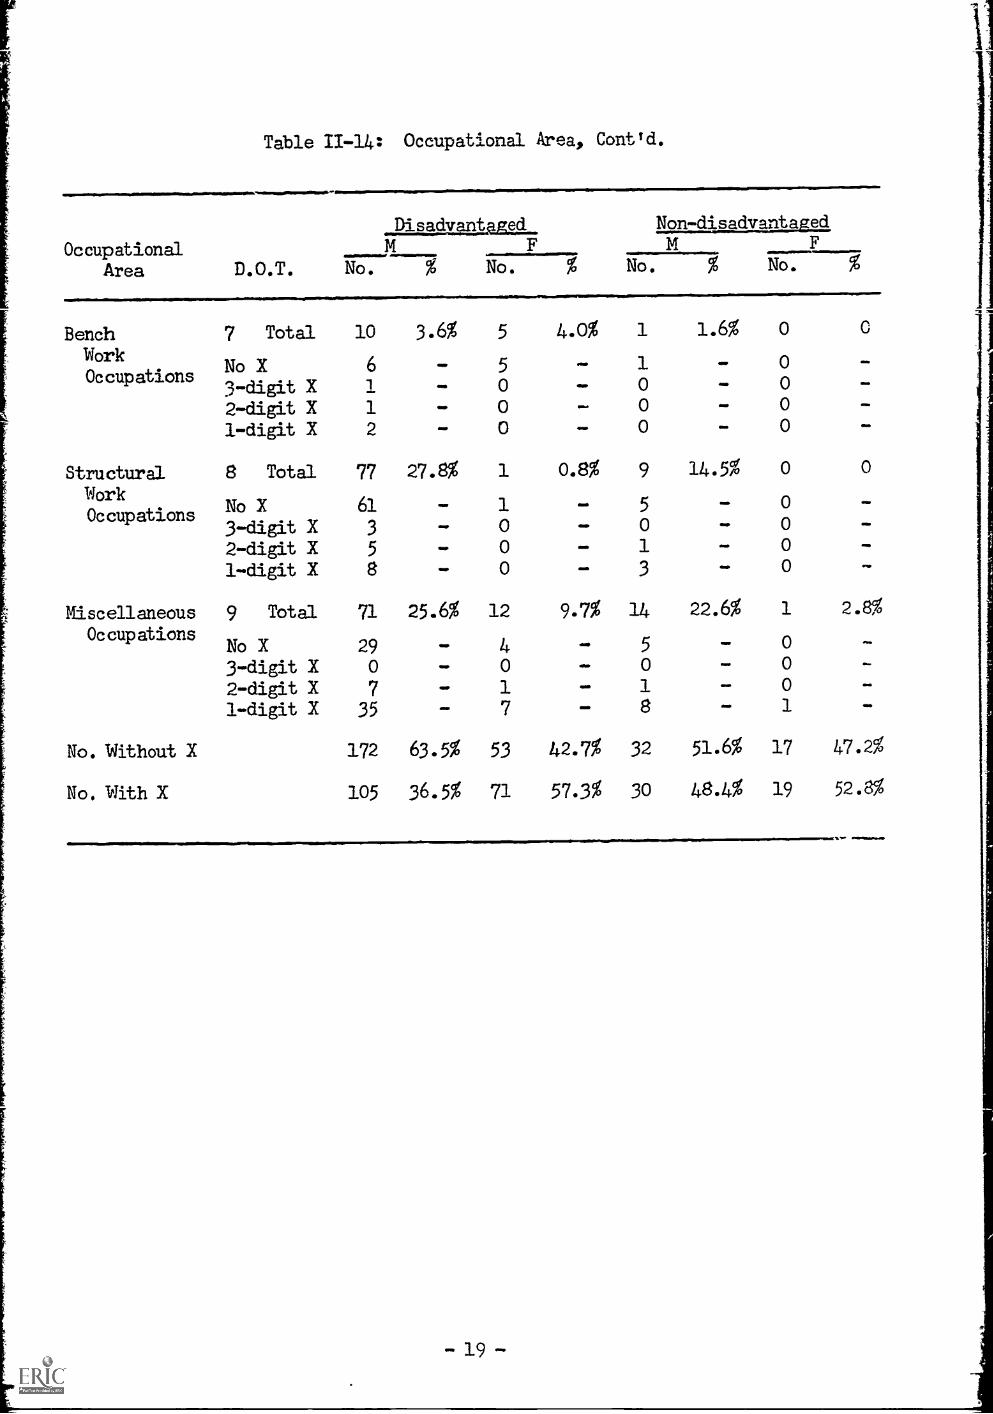
Table 11-14: Occupational Area, Conttd.
Disailuntampl_ Non-dtaaLluaLlmiOccupational
Area D.O.T. No. % No. No. % No. %
Bench 7 Total 10 3.6% 5 4.0% 1 1.6% 0
WorkNo X 6 5 1 0
Occupations3-digit X 1 - 0 . 0 - 0 _
2-digit X 1 - 0 _ 0 _ 0
1-digit X 2 _ 0 _ 0 _ 0 -
Structural 8 Total 77 27.8% 1 0.8% 9 14.5% 0 0
WorkNo X 61 - 1 . 5
_ 0Occupations
1111
3-digit X 3 - 0 - 0 - 0
2-di4t X 5 - 0 _ 1 _ 0
1-digit X 8 - 0 _ 3 - 0
Miscellaneous 9 Total 71 25.6% 12 9.7% 14 22.6% 1 2.8%
OccupationsNo X 29 - 4 - 5 0
3-digit X 0 - 0 - 0 _ 0 ._
2-digit X 7 . 1 - 1 _ 0
1-digit X 35 _ 7 - 8 - 1 -
No. Idithout X 172 63.5% 53 42.7% 32 51.6% 17 47.2%
1111
1111
M111
4,0
No. With X 105 36.5% 71 57.3% 30 48.4% 19 52.8%
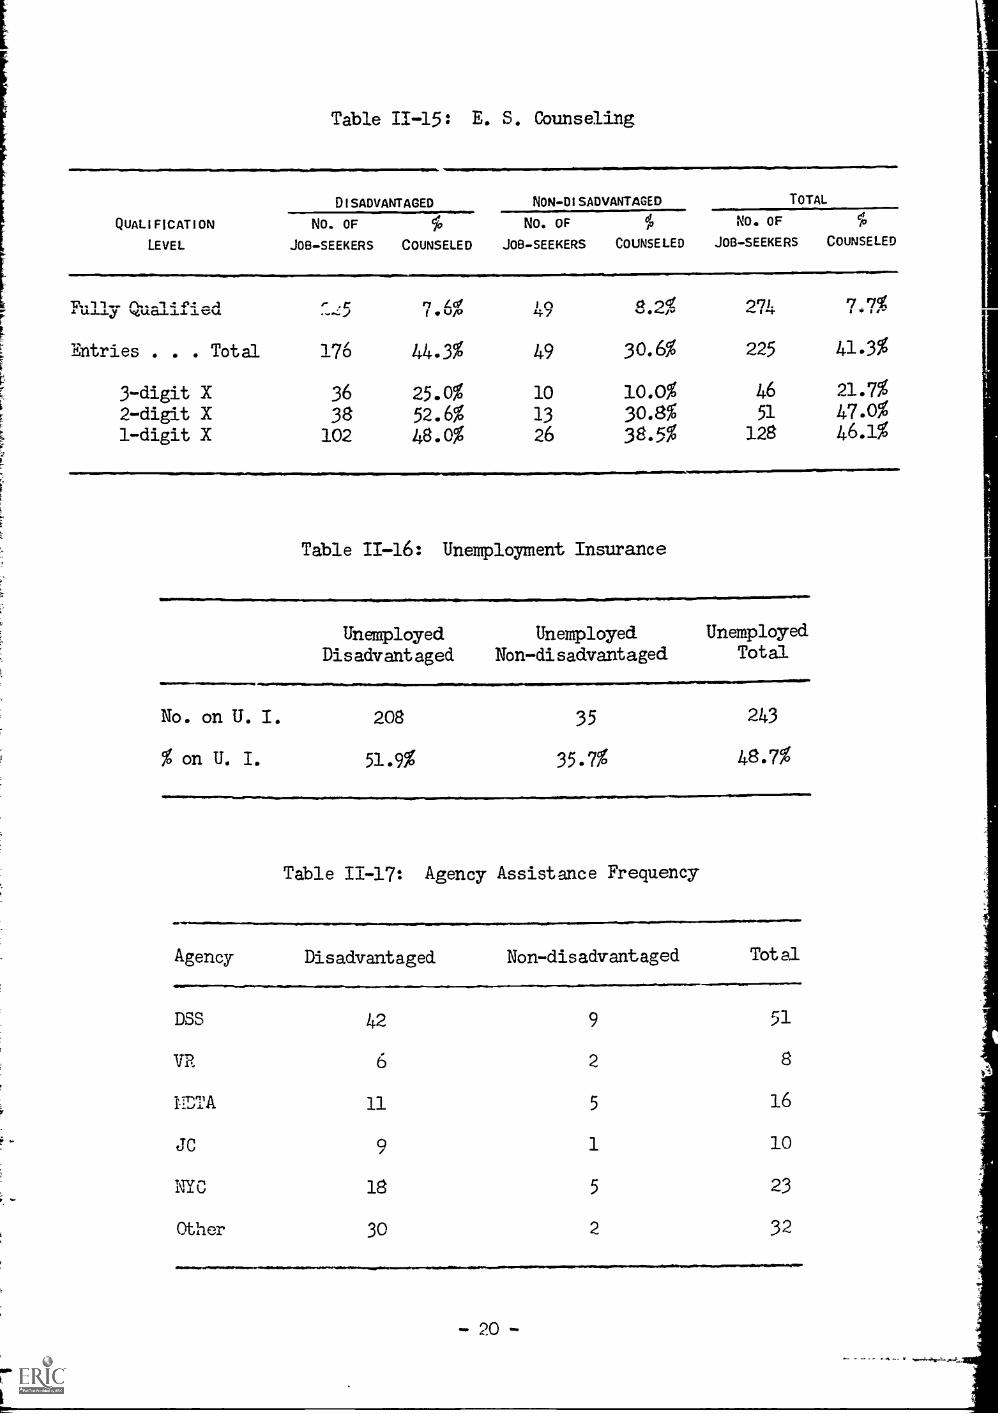
Table 11-15: E. S. Counseling
DISADVANTAGED NON-DISADVANTAGED TOTAL
QUALIFICATION
LEVEL
NO. OF
JOB-SEEKERS
%COUNSELED
NO. OF
JOB-SEEKERS
eP
COUNSELED
NO. OF
JOB-SEEKERS
eP
COUNSELED
«. n..-14-P4-Au.l.s4j c6uot-I-1.-1..i
Entries . . . Total
3-digit X2-digit X1-digit X
e" .r...... i
176
3638102
ri 4afwvp
44.3%
25.0%52.6%48.0%
47
49
101326
30.6
10.0%30.8%38.5%
974
225
4651
128
7.7%
41.3%
21.7%47.0%46.1%
Table 11-16: Unemployment Insurance
Unemployed Unemployed Unemployed
Disadvantaged Non-disadvantaged Total
No. on U. I. 208 35
% on U. I. 51.9% 35.7%
243
48.7%
Table 11-17: Agency Assistance Frequency
Agency Disadvantaged
DSS 42
ITR 6
11L'TA 11
JC 9
NYC 18
Other 30
Non-disadvantaged Total
9 51
2 8
5 16
1 10
5 23
2 32
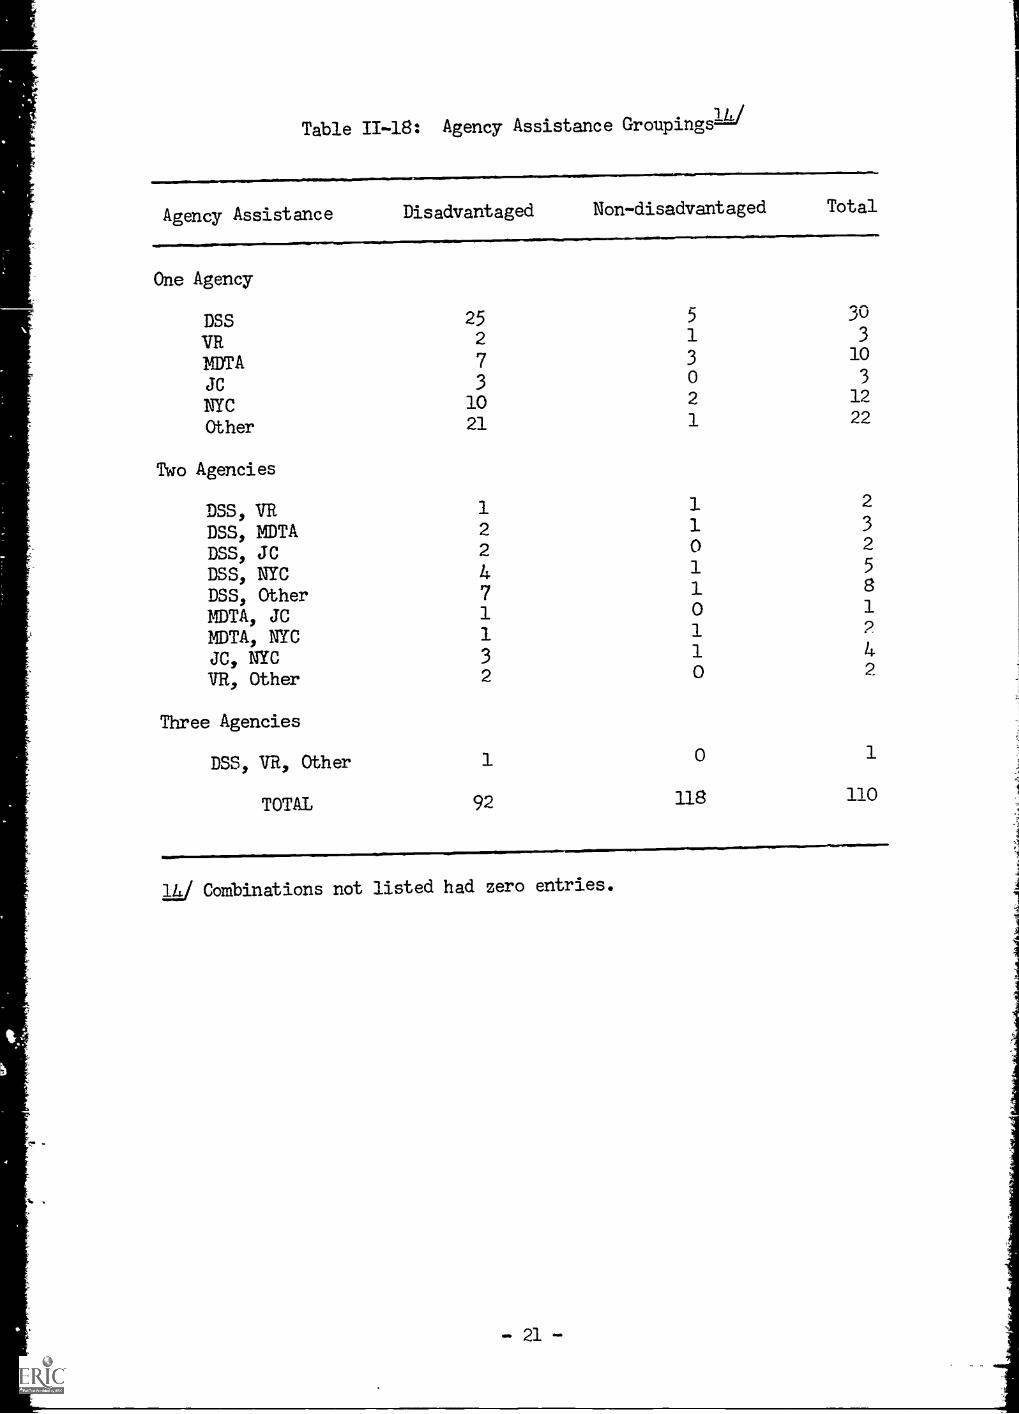
Table II-18: Agency Assistance Groupings:W
Agency Assistance Disadvantaged Non-disadvantaged Total
One Agency
DSS 25 5 30
VR 2 1 3
MITA 7 3 10
JC 3 0 3
NYC 10 2 12
Other 21 1 22
Two Agencies
DSS, VR 1 1 2
DSS, MDTA 2 1 3
DSS, JC 2 0 2
DSS, NYC 4 1 5
DSS, Other 7 1 8
MDTA, JC 1 0 1
MDTA, NYC 1 1 2
JC, NYC 3 1 4
VR, Other 2 0 2
Three Agencies
DSS, VR, Cther 1 1
TOTAL 92 118 110
14/ Combinations not listed had zero entries.

C. Problems of the Disadvantaged Job -Seekersin Kalihi-Palama
Since the disadvantaged category is such a large one, it seems usefulto subdivide it in terms of havr3ach disadvantaged job-seeker meets thedefinition of "disadvantaged."121 Table 11-19 gives the frequency of each
problem area. It overestimates the total number of disadvantaged job-seekers, as several job-seekers had more than one problem. The mostpervasive problem is that of failing to graduate from high school, withmore than two-thirds of the disadvantaged job-seekers being high school
dropouts. Mbreover, of the male disadvantaged job-seekers, three-fourthsare high school dropouts with half of the males having gone no higher than
the 8th grade. The percentages are less for females, with half being highschool dropouts and 40 percent going no higher than the 8th grade.
The next serious problem is that of age, with 60 percent either in the
youth or aged categories. Over half of the disadvantaged job-seekers were
unemployed for four months or more. This however may overestimate thenuMber of long-term unemployed who were actively seeking employmentthroughout their period of unemployment. Re-entrants and in-migrant
entrants -who were unemployed for four months or more were also included.If these types of job-seekers are not to be considered as being long-termunemployed, the number of disadvantaged job-seekers would decrease by 12to 389.
Over two-thirds of the disadvantaged job-seekers had more than oneproblem area. The largest grouping is that which includes job-seekers 1:ho
are high school dropouts 45 and over, and long-term unemployed.
2,2/ See Part II. B. and Appendix B for the definition of "disadvantaged."
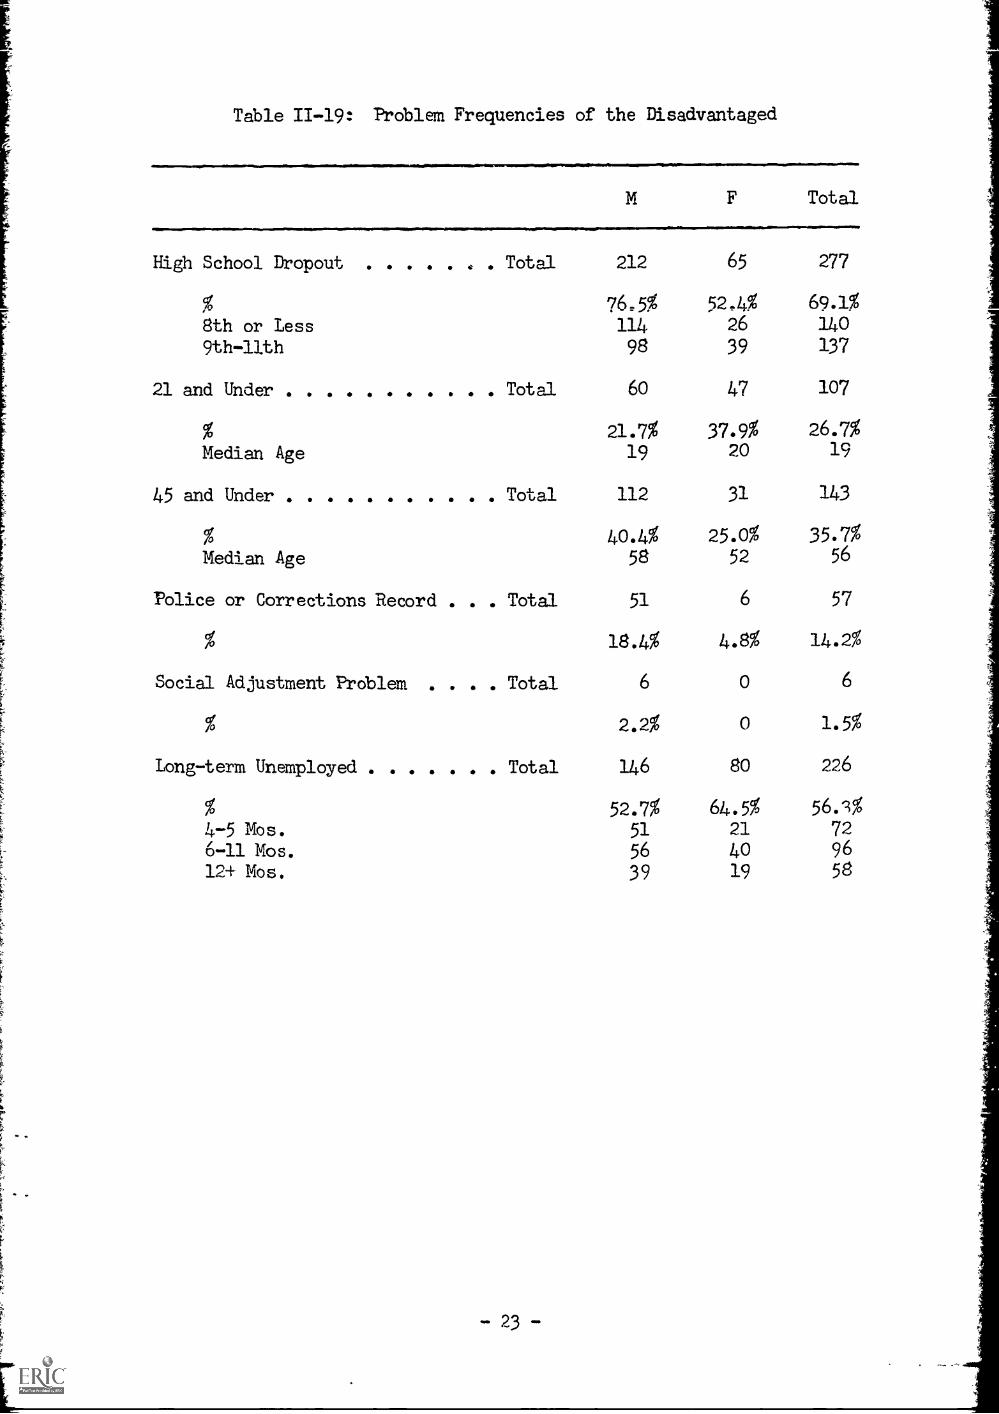
Table 11-19: Problem Frequencies of the Disadvantaged
Total
High School Dropouf Total 212 65 277
52J4% 69.1%8th or Less 114 26 1409th-llth 98 39 137
21 and Under Total 60 47 107
% 21.7% 37.9% 26.7%Median Age 19 20 19
45 and Under Total 112 31 143
%Median Age
Police or Corrections Record . . Total
%
Social Adjustment Problem . . . . Total
%
Long-term Unemployed Total
%4-5 Mos.6-11 Mos.
12+ Mos.
40.4% 25.0% 35.7%58 52 56
51 6 57
18.4% 4.8% 14.2%
6 0
2.2% 0
146 80
52.7% 64.5%51 21
56 40
39 19
6
1.5%
226
729658
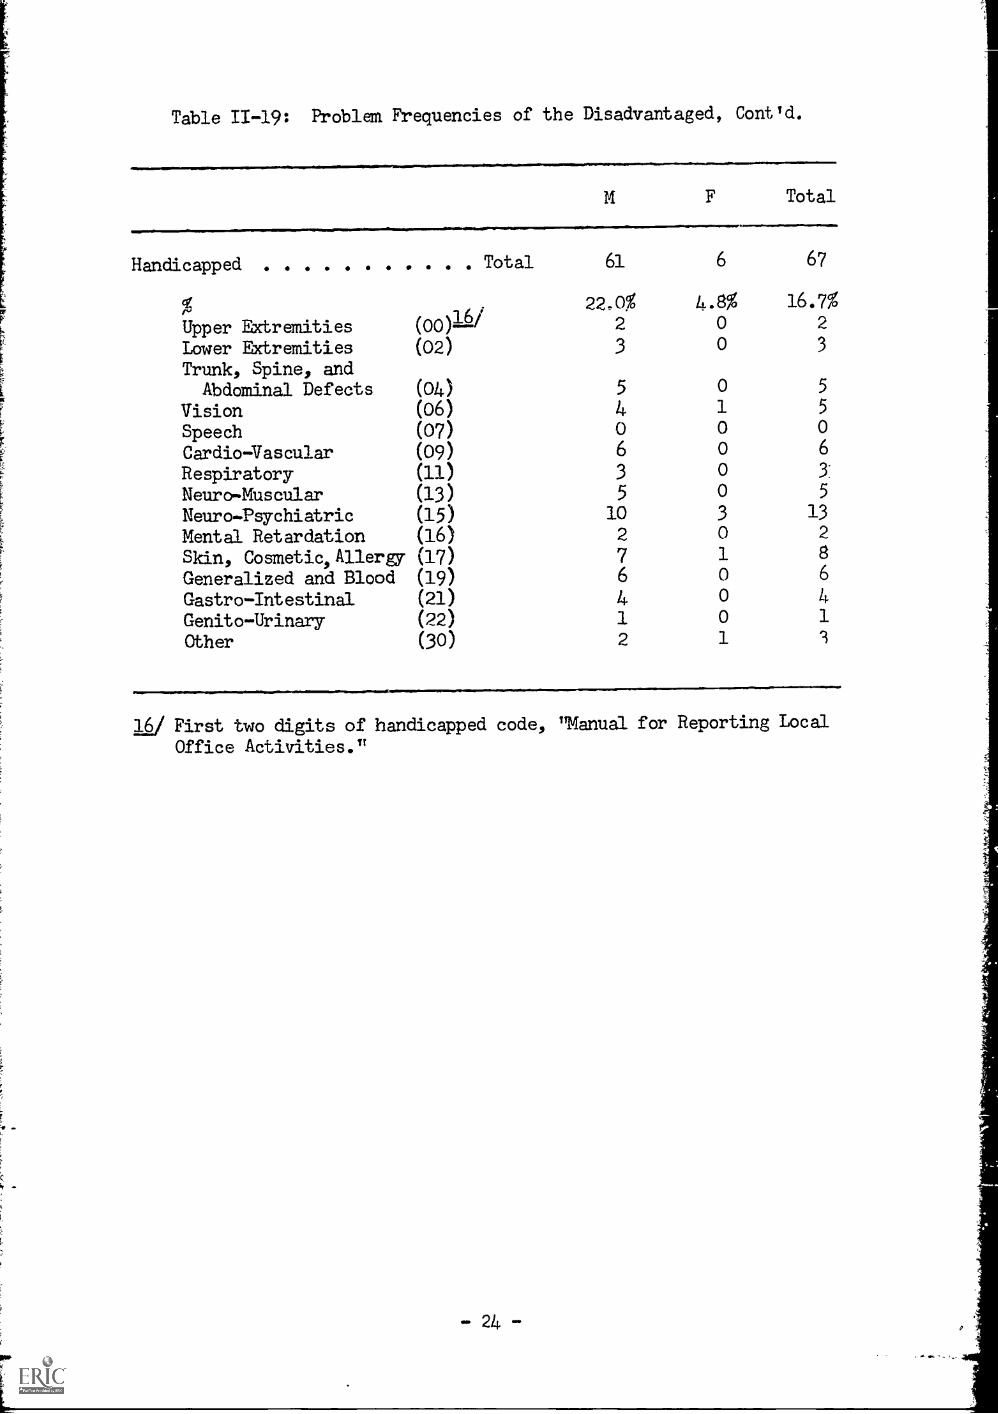
Table 11-19: Problem Frequencies of the Disadvantaged, Cont'd.
Handicapped Total
%Upper Extremities (00)161'
Lower Extremities (02)
Trunk, Spine, andAbdaminal Defects (04)
Vision (06)
Speech (07)
Cardio -Vascular (09)
Respiratory (11)
Neuro-Muscular (13)
Neuro.Psychiatric (15)
Mental Retardation (16)
61
22.0%2
3
5
4o6
3
5102
Skin, Cosmetic,Allergy (17) 7Generalized and Blood (19) 6
Gastro -Intestinal (21) 4Genito -Urinary (22) 1
Other (30) 2
Total
6 67
4.8% 16.7%0 2
0 3
0 5
1 5
o 0
o 6
o 3
o 5
3 13o 2
1 8
o 6
o 4o 1
1 'I
16/ First two digits of handicapped code, 'Manual for Reporting LocalOffice Activities."
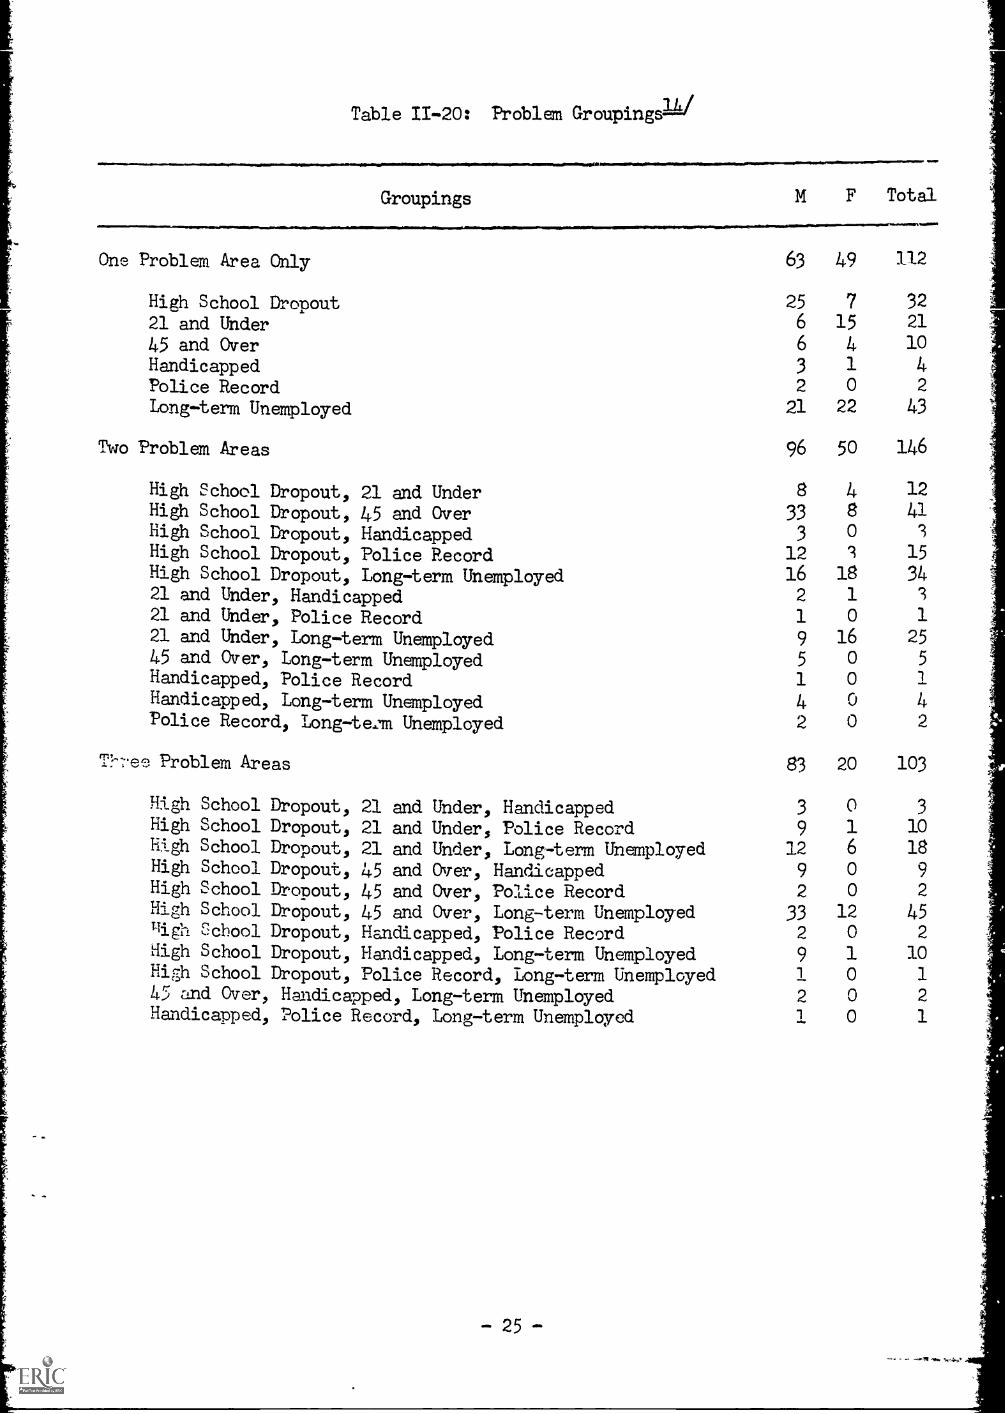
Table 11-20: Problem GroupingsW
Groupings
,.1.0.M F Total
One Problem Area Only 63 49 112
High School Dropout21 and Under45 and OverHandicappedPolice Record
256
63
2
715
41
0
3221
104
2
Long-term Unemployed 21 22 43
Two 'Problem Areas 96 50 146
High School Dropout, 21 and Under 8 4 12
High School Dropout, 45 and OverHigh School Dropout, Handicapped
333
80
41'3
High School Dropout, Police Record 12 1 15
High School Dropout, Long-term Unemployed 16 18 3421 and Under, Handicapped 2 1 '3
21 and Under, Police Record 1 0 1
21 and Under, Long-term Unemployed 9 16 25
45 and Over, Long-term UnemployedHandicapped, Police Record
5
1
0
0
5
Handicapped, Long-term Unemployed 4 0 4Police Record, Long-tam Unemployed 2 0 2
Th-ee Problem Areas 83 20 103
High School Dropout, 21 and Under, HandicappedHigh School Dropout, 21 and Under, Police Record
3
9
0
13
10
High School Dropout, 21 and Under, Long-term Unemployed 12 6 18High School Dropout, 45 and Over, Handicapped 9 0 9
High School Dropout, 45 and Over, Police Record 2 0 2High School Dropout, 45 and Over, Long-term Unemployed 33 12 45gigh School Dropout, Handicapped, Police Record 2 0 2
High School Dropout, Handicapped, Long-term Unemployed 9 1 10High School Dropout, Police Record, Long-term Unemployed 0 1
45 and Over, Handicapped, Long-term Unemployed 2 0 2
Handicapped, Police Record, Long-term Unemployed 1 0 1
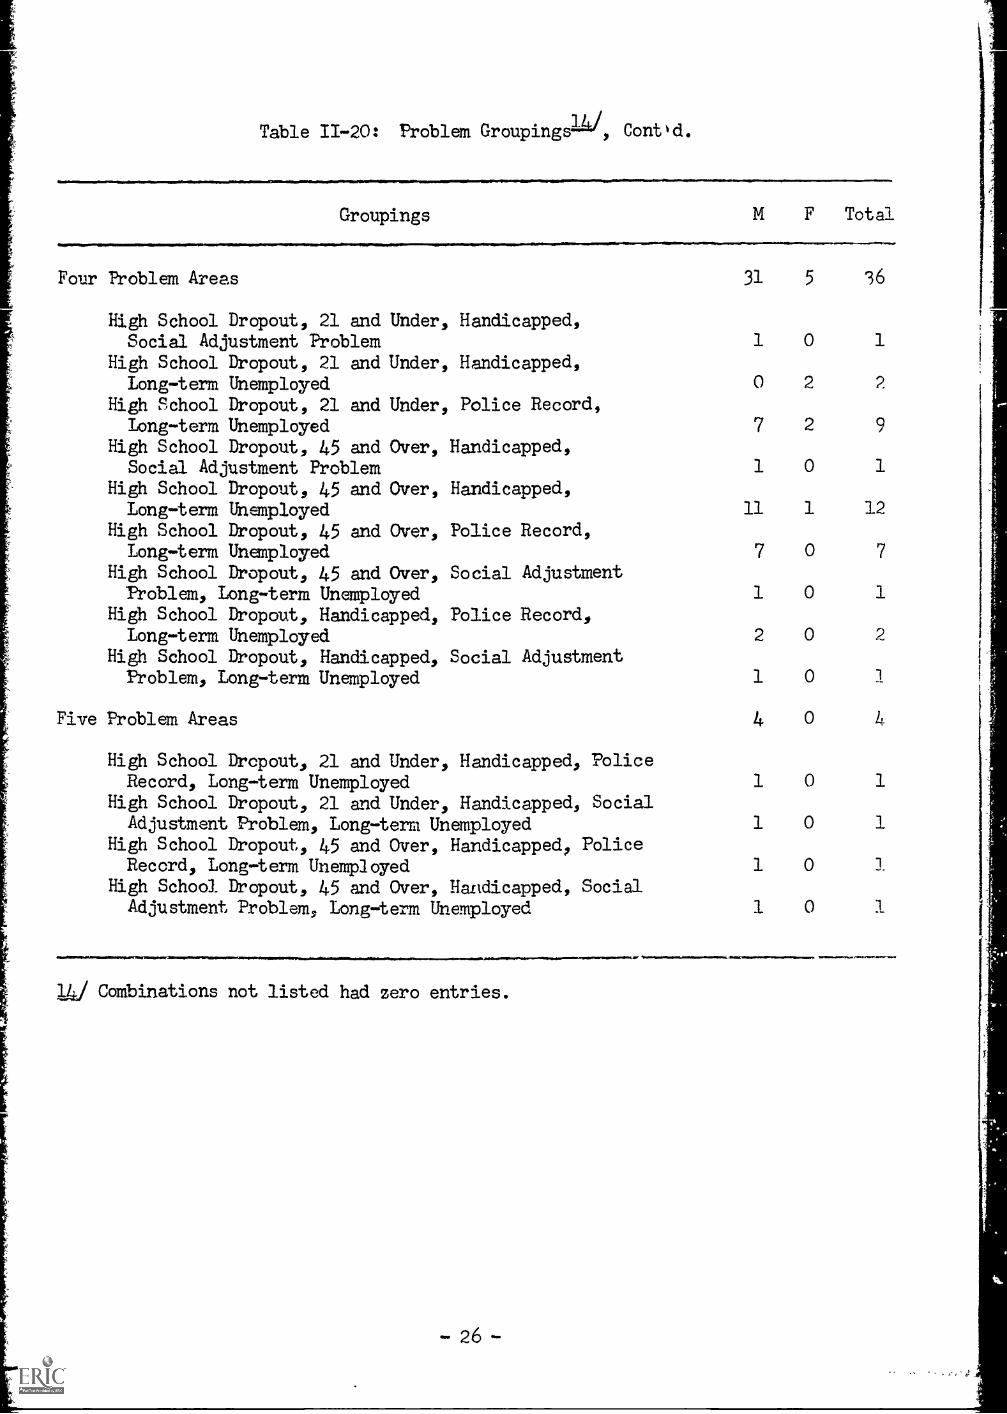
Table 11-20: Problem Groupings14/, Contbd.
Groupings M F Total
Four Problem Areas 31 5 36
High School Dropout, 21 and Under, Handicapped,Social Adjustment Problem 1 0 1
High School Dropout, 21 and Under, Handicapped,Long-term Unemployed 0 2 2
High School Dropout, 21 and Under, Police Record,Iong-term Unemployed 7 2 9
High School Dropout, 45 and Over, Handicapped,Social Adjustment Problem 1 0 1
High School Dropout, 45 and Over, Handicapped,Long-term Unemployed 11 1 12
High School Dropout, 45 and Over, Police Record,Long-term Unemployed 7 0 7
High School Dropout, 45 and Over, Social AdjustmentProblem, Long-term Unemployed 1 0 1
High School Dropout, Handicapped, Police Record,Long-term Unemployed 2 0 9
High School Dropout, Handicapped, Social AdjustmentProblem, Long-term Unemployed 1 0 1
Five Problem Areas 4 0
High School Dropout, 21 and Under, Handicapped, PoliceRecord, Long-term Unemployed 1 0 1
High School Dropout, 21 and Under, Handicapped, SocialAdjustment Problem, Long-term Unemployed 1 0 1
High School Dropout, 45 and Over, Handicapped, PoliceRecord, Long-term Unemployed 1 0
High School Dropout, 45 and Over, Handicapped, SocialAdjustment Problem, Long-term Unemployed 1 0
11111111111.00}11.1RMNIIIINNOON.M.M1101111.111.11=NIIIMos 1.1......10111PlaNIM............."
Combinations not listed had zero entries.
- 26

III. WAIANAE C OAST
TIT. Wa-1P,nae Coast
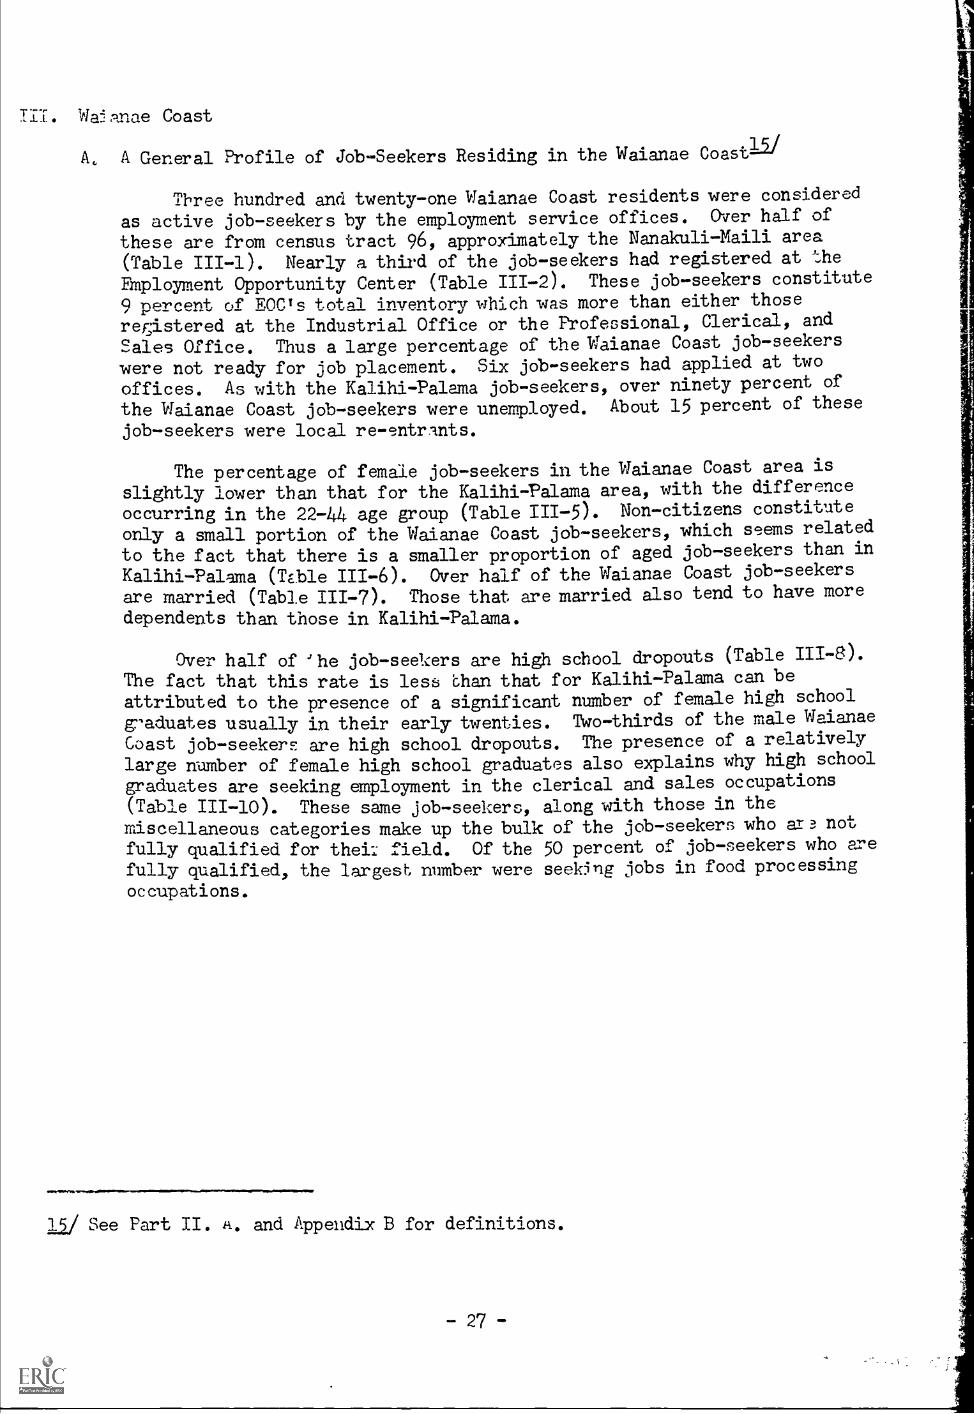
A, A General Profile of Job-Seekers Residing in the Waianae Coast15/
Three hundred and twenty-one Waianae Coast residents were considered
as active job-seekers by the employment service offices. Over half of
these are from census tract 96, approximately the Nanakuli-Maili area
(Table III-1). Nearly a third of the job-seekers had registered at the
Employment Opportunity Center (Table 111-2). These job-seekers constitute
9 percent of EOCTq tntn1 inventory which was more than either those
rer;istered at the Industrial Office or the Professional, Clerical, and
Sales Office. Thus a large percentage of the Waianae Coast job-seekers
were not ready for job placement. Six job-seekers had applied at two
offices. As with the Kalihi-Palama job-seekers, over ninety percent of
the Waianae Coast job-seekers were unemployed. gbout 15 percent of these
job-seekers were local re-entrints.
The percentage of female job-seekers in the Waianae Coast area is
slightly lower than that for the Kalihi-:Palama area, with the difference
occurring in the 22-44 age group (Table 111-5). Non-citizens constitute
only a amall portion of the Waianae Coast job-seekers, which seems related
to the fact that there is a smaller proportion of aged job-seekers than in
Kalihi-Palama (Tble 111-6). Over half of the Waianae Coast job-seekers
are married (Table III-7). Those that are married also tend to have more
dependents than those in Kalihi-Palama.
Over half of 'he job-seet,:ers are high school dropouts (Table 111-8).
The fact that this rate is less bhan that for Kalihi-Palama can be
attributed to the presence of a significant nuMber of female high school
g7aduates usually in their early twenties. Two-thirds of the male Waianae
Coast job-seekers are high school dropouts. The presence of a relatively
large number of female high school graduates also explains why high school
graduates are seeking employment in the clerical and sales occupations
(Table III-10). These same job-seekers, along with those in the
miscellaneous categories make up the bulk of the job-seekers who ar not
fully qualified for thei: field. Of the 50 percent of job-seekers who are
fully qualified, the largest number were seek5ng jobs in food processing
occupations.
....Y.....n...".V.s.aw...Immwmae.w..ftwlww.......ManwWIMN
li/ See Part II. A. and Appendix B for definitions.
-27-
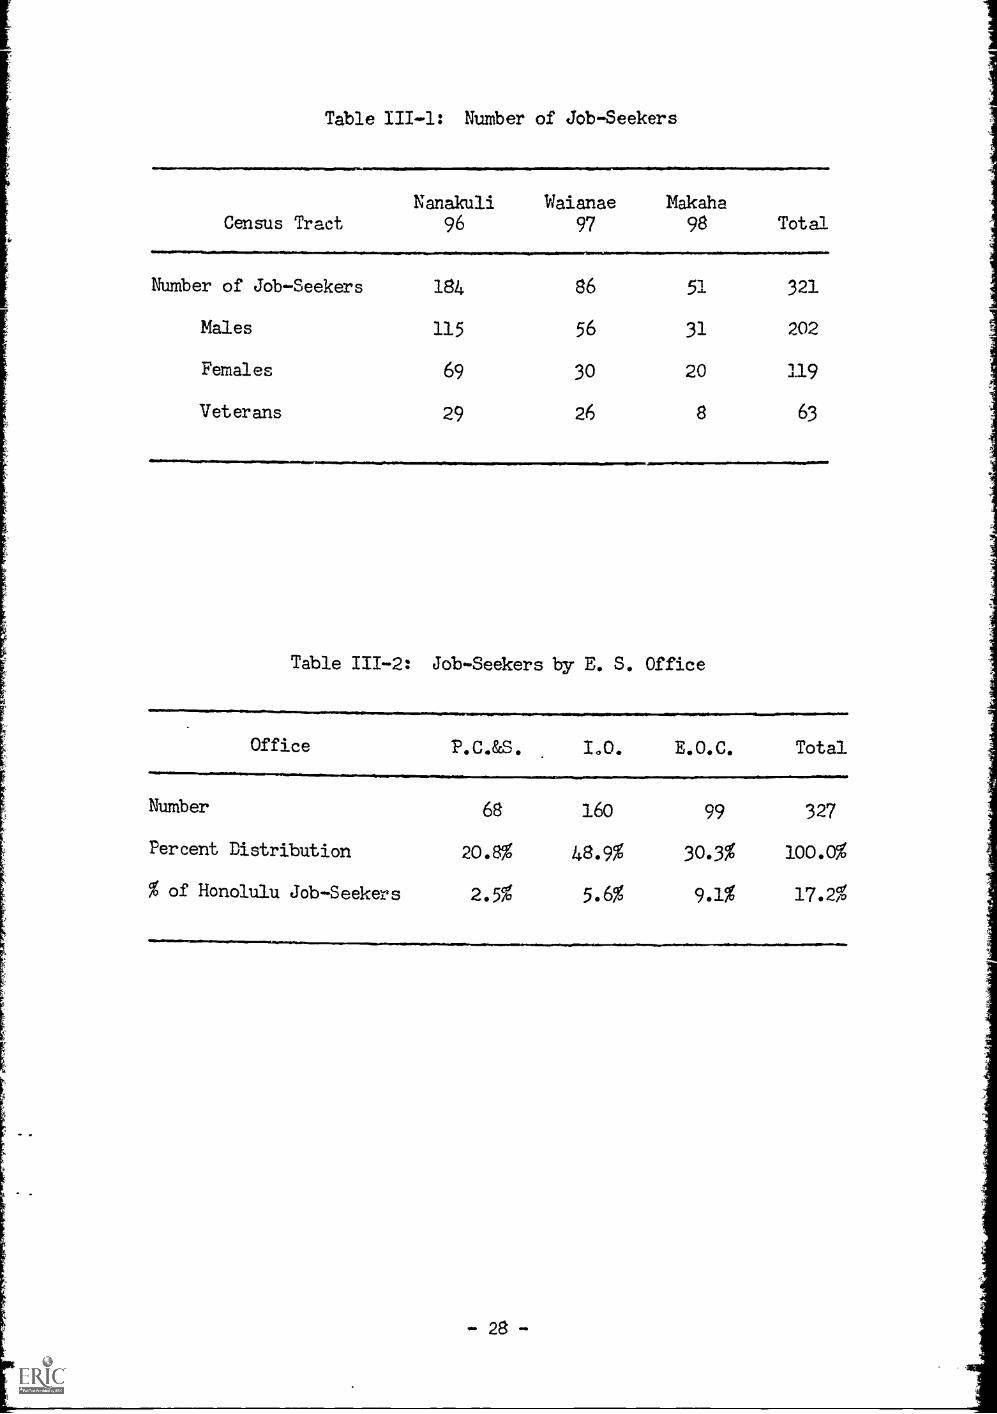
Table 111-1: Number of job-Seekers
Census TractNanakuli
96
Number of Job-Seekers 184
Males 115
Females 69
Veterans 29
411=
Waianae Makaha
97 98
86 51
56 31
30 20
26 8
Total
321
202
119
63
Table 111-2: Job-Seekers by E. S. Office
Office P.C.&S. I.O. E.O.C. Total
Number 68 160 99 327
Percent Distribution 20.8% 48.9% 30.3% 100.0%
% of Honolulu Job-Seekers 2.5% 5.6% 9.1% 17.2%
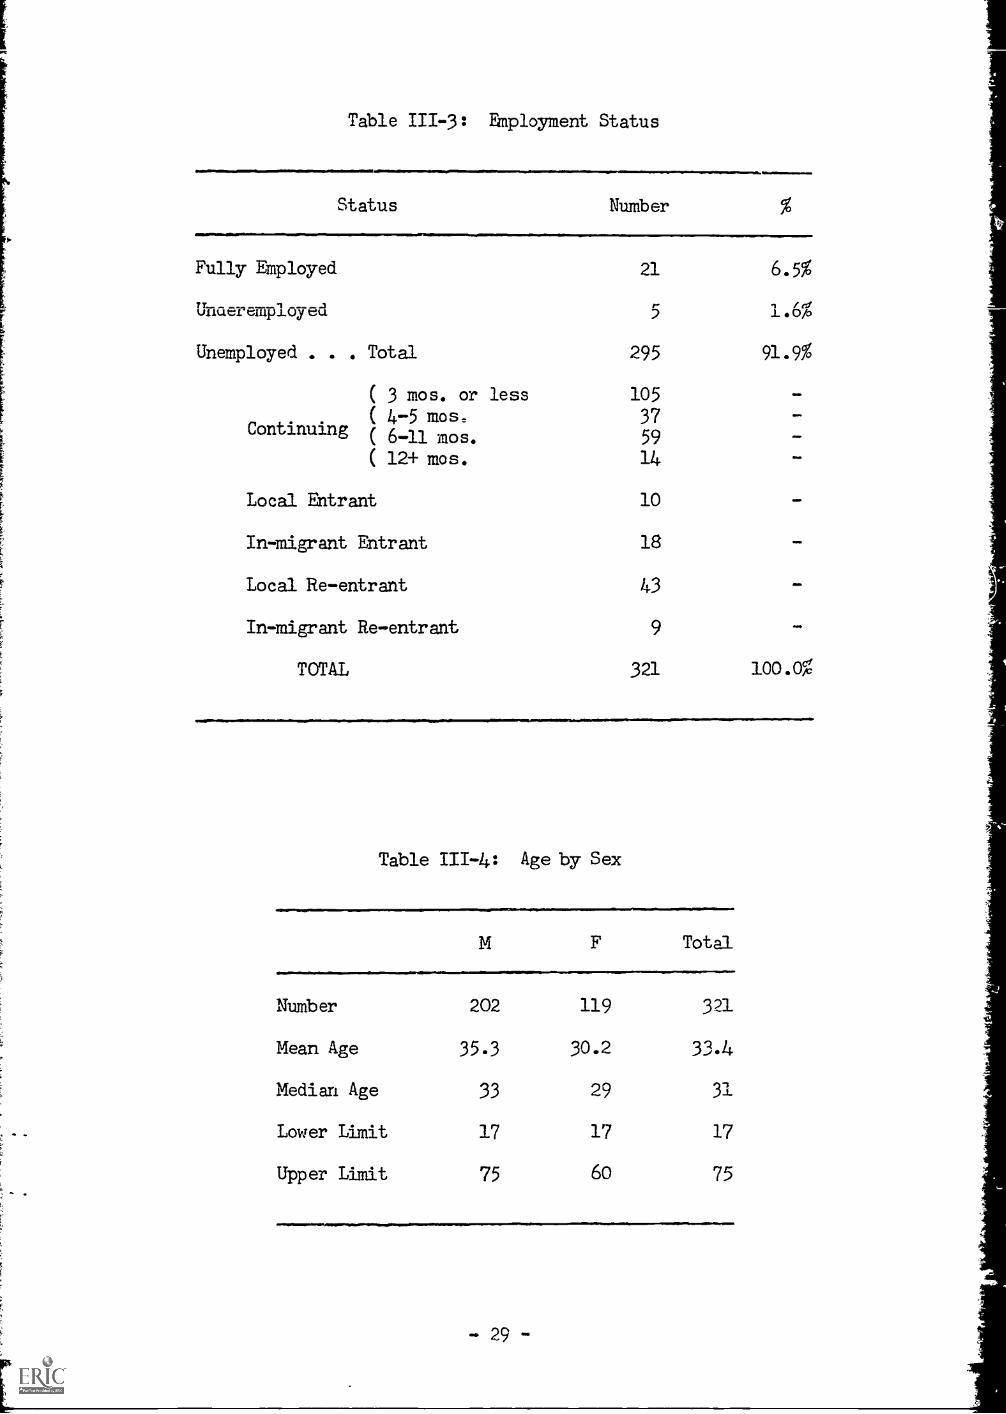
Table 111-3: Employment Status
Status Number
Fully EMployed
unuelempl.uyu
Unemployed . . . Total
( 3 mos. or less
( 4-5 mos,Continuing ( 6-11 mos.
( 12+ mos.
Local Ehtrant
In-migrant Entrant
Local Re-entrant
In-migrant Re-entrant
TOTAL
21
5
295
105
3759
14
10
18
43
9
321
6.5%
1.6%
91.9%
1100
0/0
aiND
000
100.0%
Table 111-4: Age by Sex
Total
Number 202 119
Mean Age 35.3 30.2
Median Age 33 29
Lower Limit 17 17
Upper Limit 75 60
321
33.4
31
17
75
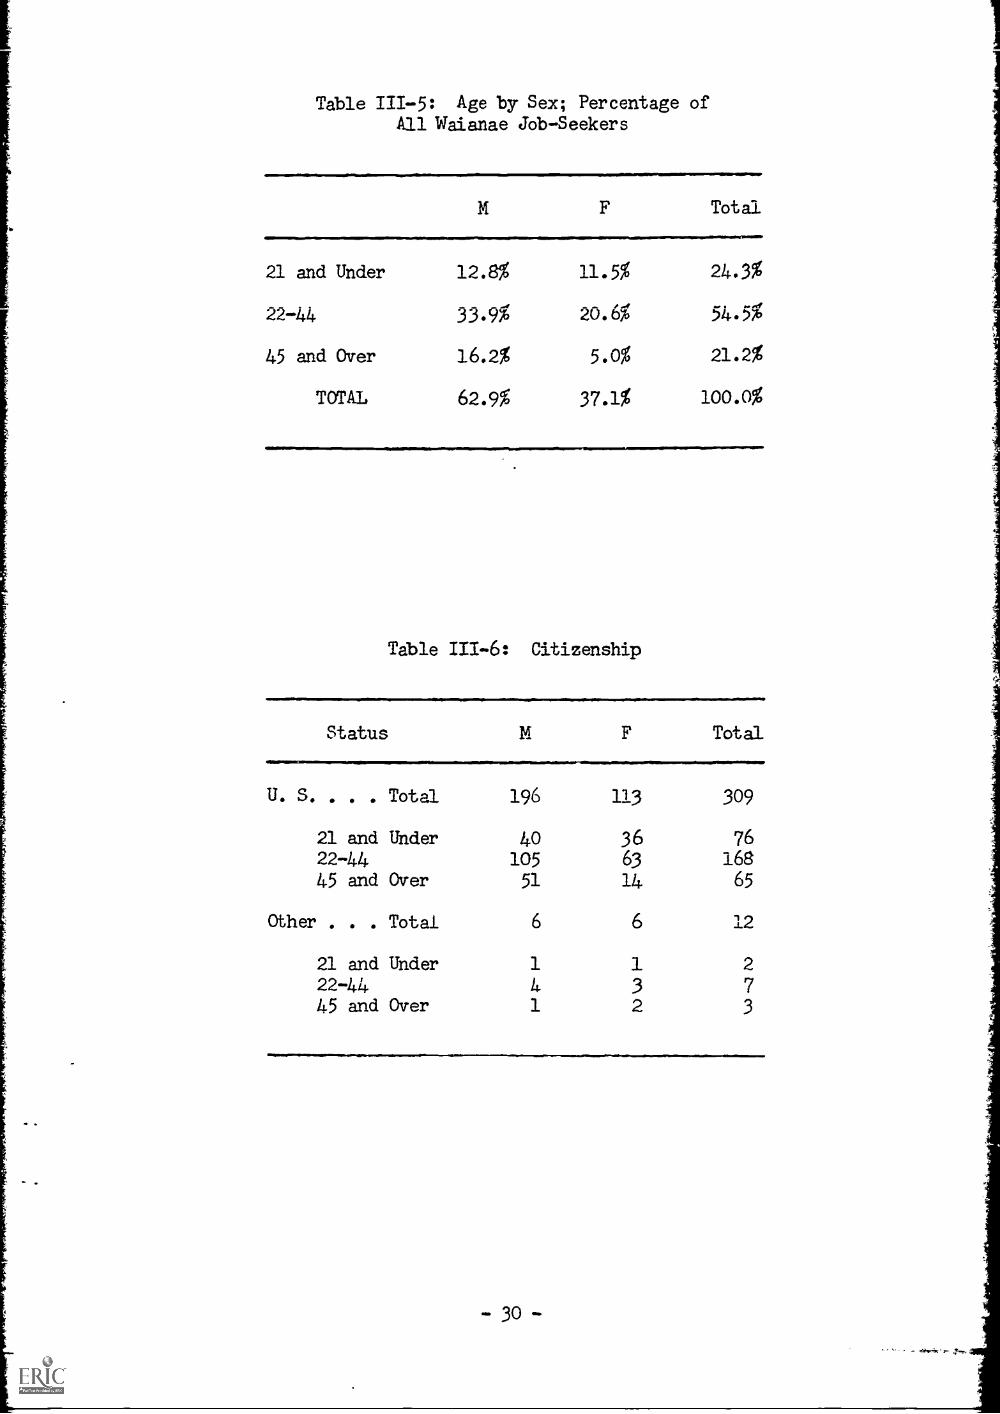
Table 111-5: Age by Sex; Percentage ofAll Waianae Job-Seekers
Total
21 and Under 12.8% 11.5% 24.3%
22-44 33.9% 20.6% 54.5%
45 and Over 16.2% 5.0% 21.2%
TOTAL 62.9% 37.1% 100.0%
Table 111-6: Citizenship
Status Total
U. S. . . . Total 196 113 309
21 and Under 40 36 7622-44 105 63 16845 and Over 51 14 65
Other . . . Total 6 6 12
21 and Under 1 1 222-44 L. 3 745 and Over 1 2 3
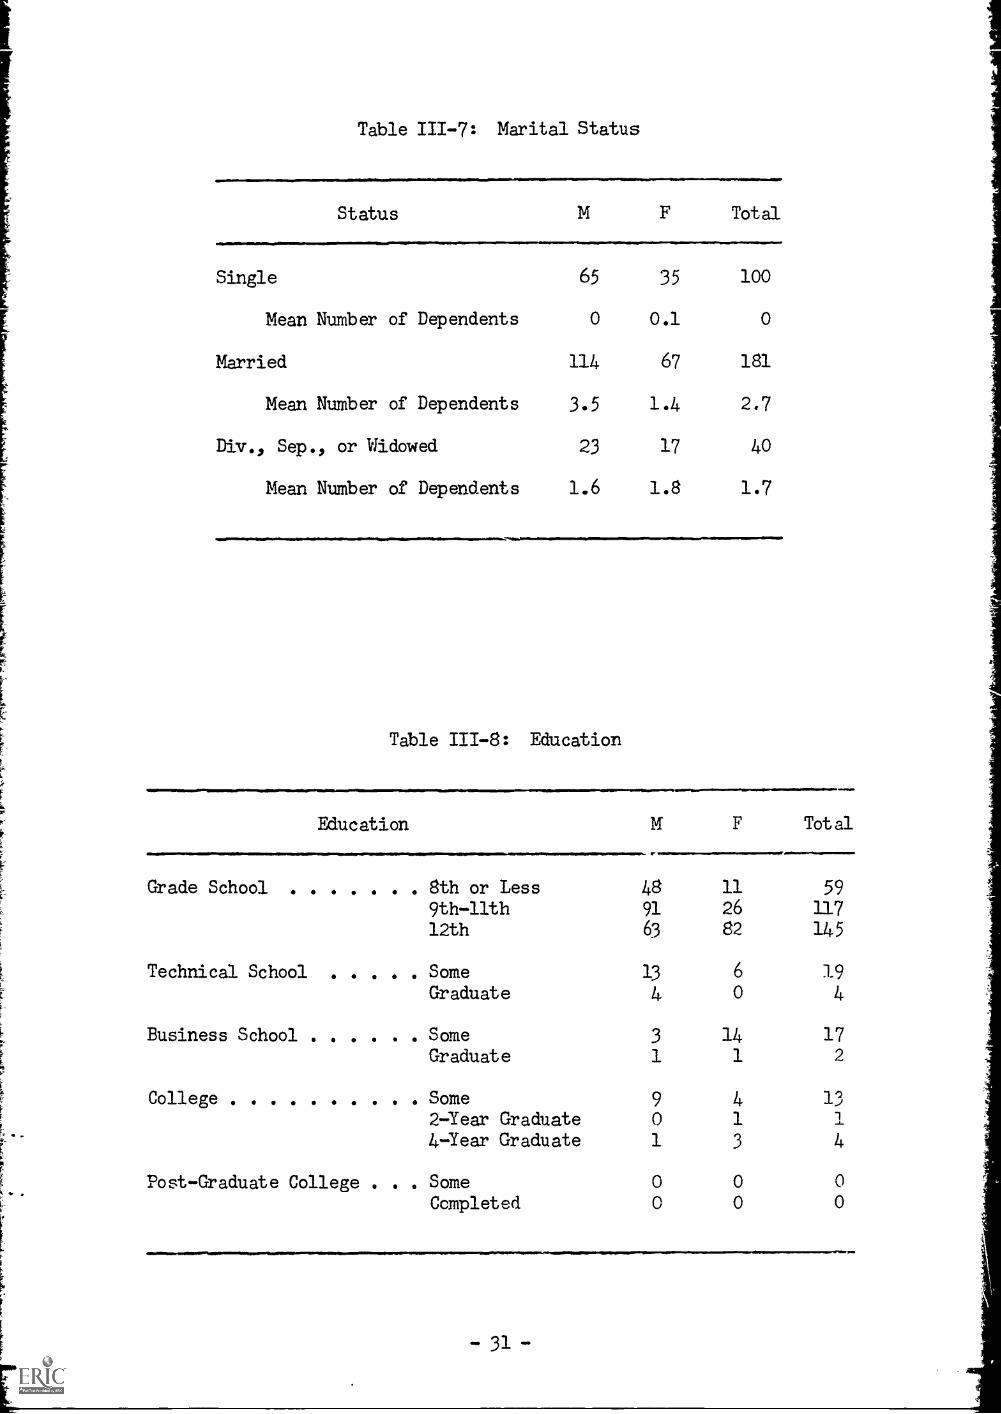
Table 111-7: Marital Status
Status N F Total
Single 65 35 100
Mean Number of Dependents 0 0.1 0
Married 114 67 181
Mean NuMber of Dependents 3.5 1.4 2.7
Div., Sep., or Widowed 23 17 40
Mean NuMber of Dependents 1.6 1.8 1.7
Table 111-8: Education
Education Total
Grade School 8th or Less 48 11 599th-llth 91 26 117
12th 63 82 145
Technical School Some 13 6 19Graduate 4 0 4
Business School SomeGraduate
College Some
2-Year Graduate4-Year Graduate
Post-Graduate College Some
Ccmpleted
3 141 1
9 40 1
1 3
0 0
0 0
172
13
1
4
0
0
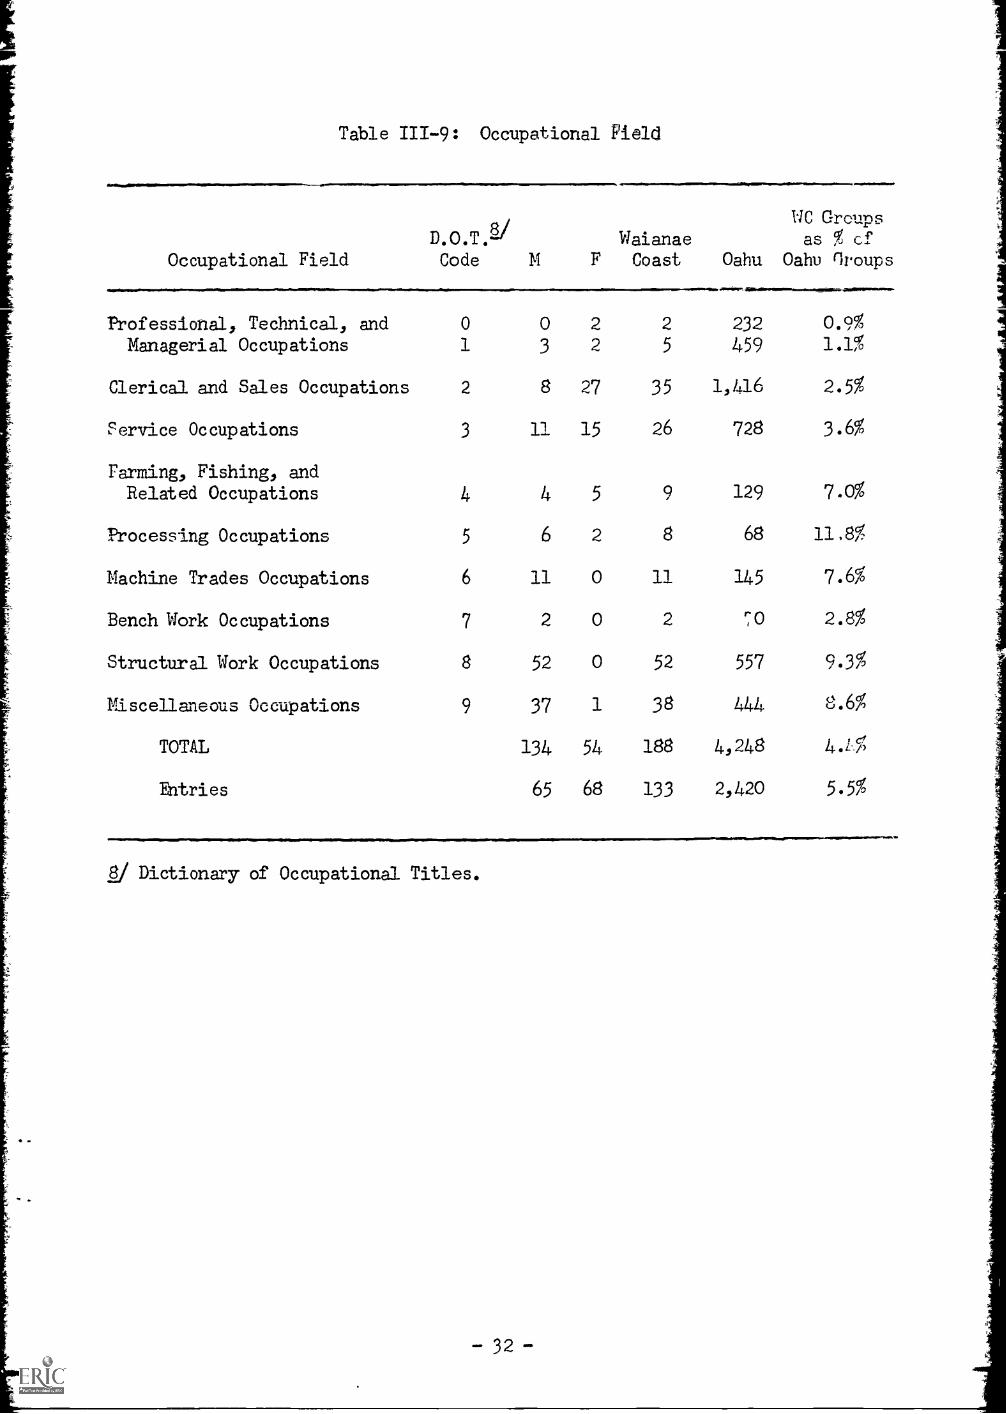
Table III-9: Occupational P1@1d
Occupational Field
Professional, Technical, andManagerial Occupations
Clerical and Sales Occupations
Service Occupations
Farming, Fishing, and
Code M
0 0
1 3
2 8
3 11
.41M...111/
WC GroupsWaianae as % cf
F Coast Oahu Oahu Oroups
2 2
2 5
27 35
15 26
Related Occupations 4 4 5 9
Processing Occupations 5 6 2 8
Machine Trades Occupations 6 11 0 11
Bench Work Occupations 7 2 0 2
Structural Work Occupations 8 52 0 52
Miscellaneous Occupations 9 37 1 38
TOTAL 134 54 188
Entries 65 68 133
232 0.9%
459 1.1%
1,416 2.5%
728 3.6%
129
68
7.0%
11,8%
145 7.6%
70 2.8%
557 9.3%
444 8.6%
4,248 4.L%
2,420 5.5%
g/ Dictionary of Occupational Titles.
32
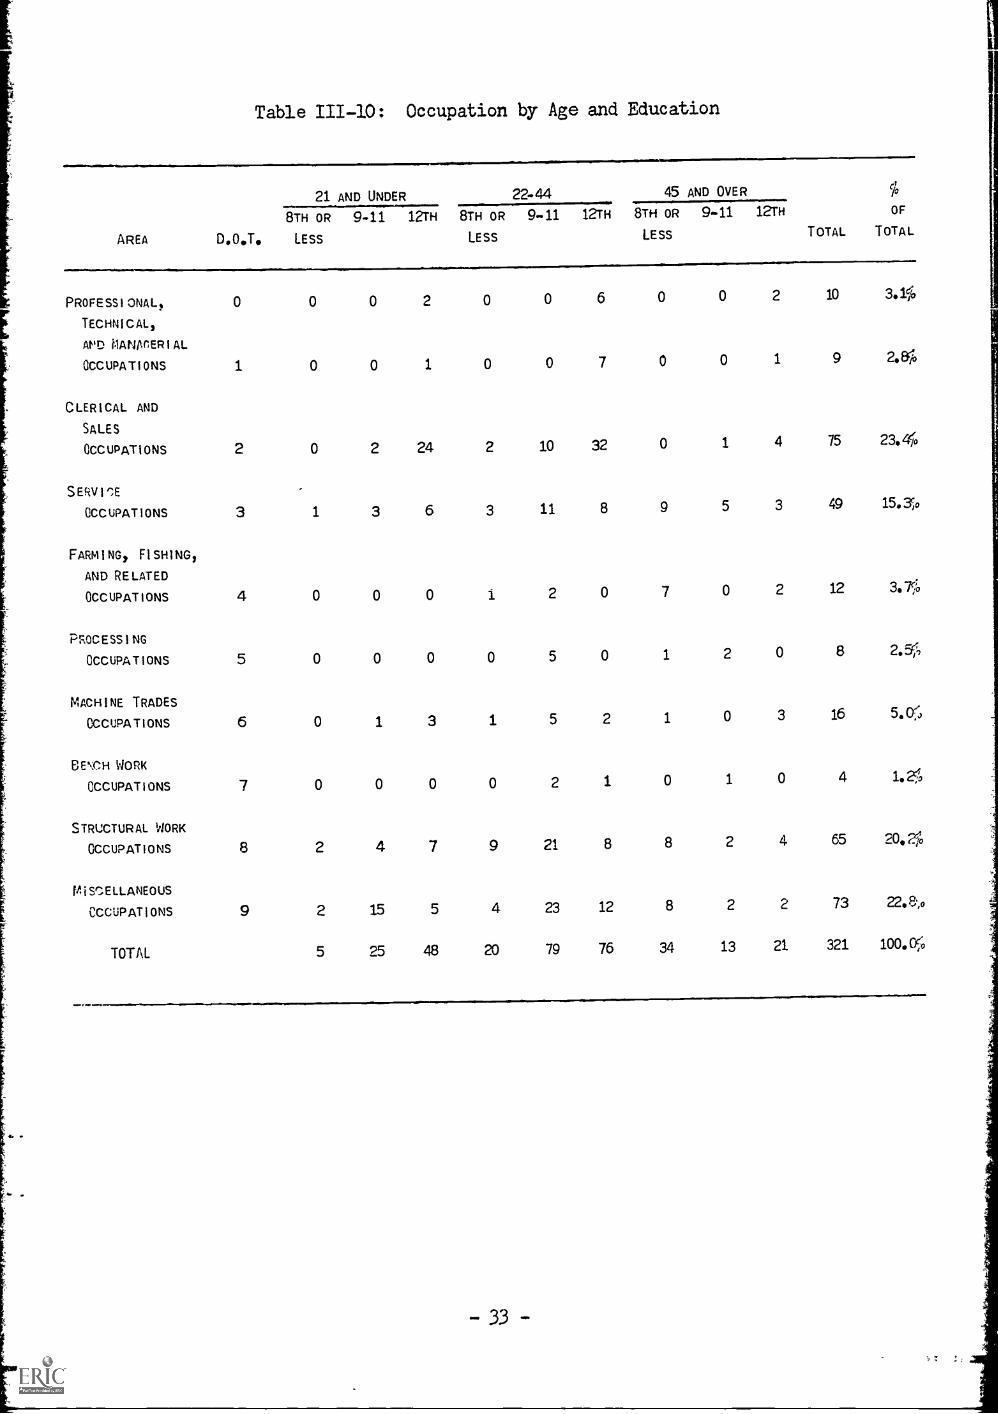
Table III-10: Occupation by Age and Education
AREA D.O.T.
21 AND UNDER 22-44 45 AND OVER
TOTAL
%
OF
TOTAL8TH OR
LESS
9-11 12TH 8TH OR
LESS
9-11 12TH 8TH OR
LESS
9-41 12TH
PROFE SS I ONAL, 0 0 0 2 0 0 6 0 0 2 10
TECHNICAL,
AtoD ilANAnER I AL
OCC UPAT I ONS 1 0 0 1 0 0 7 0 0 1 9 2.Kb
C LER 1 CAL AND
SALES
OCCUPATIONS 2 0 2 24 2 10 32 0 1 4 75 23.410
S ERV I ^,E
OCCUPAT IONS 3 1 3 6 3 11 8 9 5 3 49 15.3c,o
FARM I NG, F I sH1 NG,
AND RE LATED
OCCUPAT IONS 4 0 0 0 i 2 0 7 0 2 12 3.710
PROCESS I NG
OCCUPAT IONS 5 0 0 0 0 5 0 1 2 0 8 2.5
MACH I NE TRADES
OCCUPAT I ONS 6 0 1 3 1 5 2 1 0 3 16 5.05;
BE %CH WORK
OCCUPAT I ONS 7 0 0 0 0 2 1 0 1 0 4 1.4
STRUCTURAL WORK
CCCUPAT I ONS 8 2 4 7 9 21 8 8 2 4 65 20,2%
M iSrELLANEOUS
OCCUP AT I ONS
TOTAL
9 2
5
15
25
5
48
4
20
23
79
12
76
8
34
2
13
2
21
73
321
22. 8,,,,
100.05.0
B. A Comparison Between the Disadvantaged and Non-Disadvantaged Job-Seekers
in the Waianae Coast
In the Waianae Coast, 83.2 percent of the job-seekrs are disadvantaged
(Table III-11). This is a slightly higher rate than that in Kalihi-Palama
and again is four times as great as the Oahu rate faand in the 1966 sarvey.
Moreover of those who are either underemployed or unemployed, 89 percent
are disadvantaged. Local re-entrants constitute 16 percent of the
unemployed, disadvantaged j6b-seekers as opposed to 10 percent of the
unemployed, non-disadvantaged job-seekers. On the other hand, job-seekers
who have recently moved into the state, in-migrant entrants and in-migrant
re-entrants, constitute only 6 percent of the unemployed disadvantaged
and 22 percent of the non-disadvantaged.
Nearly two-thirds of the male disadvantaged job-seekers are seeking
employment in structural occupations or miscellaneous occupations
(Table III-14). Half of the male non-disadvantaged job-seekers weresearching in these fields. Male job-seekers in these fields also make up
the bulk of the fully qualified male job-seekers. While similar percentages
of female, disadvantaged and female, non-disadvantaged job-seekers are
searching in the clerical and sales fields, a higher percentage of the
di9advantaged are not fully qualified. Only about half of the not fully
qualified, disadvantaged job-seekers have been counseled by the state
employment service (Table III-15). About half of the unemployed
disadvantaged job-seekers were unemployment insurance recipients(Tdble III-16). The agency most frequently aiding the Waianae Coast job -
seekers was the Department of Social Services (Tdble III-17).
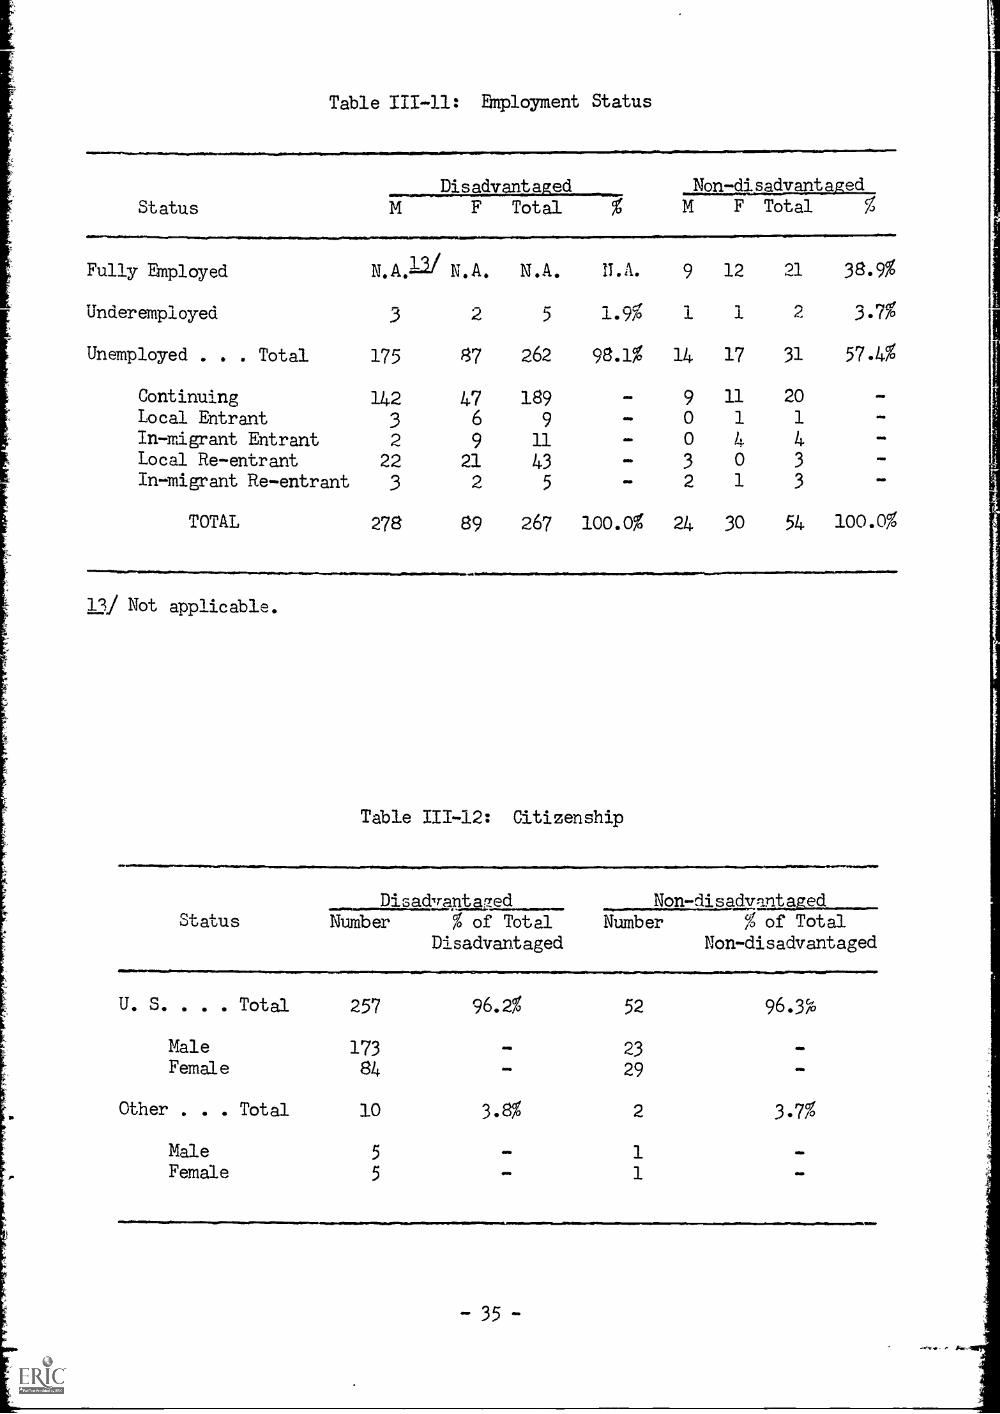
Table III-11: Employment Status
Disadvantageci Non-clisatmtcaosi_Status F Total % M F
Fully Employed
Underemployed
N.A.112/ N.A.
3 2
N.A.
5
N.A.
1.9%
9
1
12
1
Unemployed . . . Total 175 87 262 98.1% 14 17
Continuing 142 47 189 .. 9 11
Local Entrant 3 6 9 - 0 1
In-migrant Entrant 2 9 11 - 0 4Local Re-entrant 22 21 43 - 3 0
In-migrant Re-entrant 3 2 5 - 2 1
TOTAL 278 89 267 100.0% 24 30
l3,/ Not applicable.
00.
Total
21 38.9%
2 3.7%
31 57.4%
20
1
43
3
040
4004
004
0411
54 100.0%
Table III-12: Citizenship
StatusDisadvantarzed Non-disadvantaged
NuMber % of Tatal Number % of TotalDisadvantaged Non-disadvantaged
U. S. . . Total 257 96.2% 52 96.3io
Male 173 - 23Female 84 .. 29
Other . . . Total 10 3.. 2 3.7%
040,
=M.
MaleFemale
5
5
010
4/ND
11
040,
0411
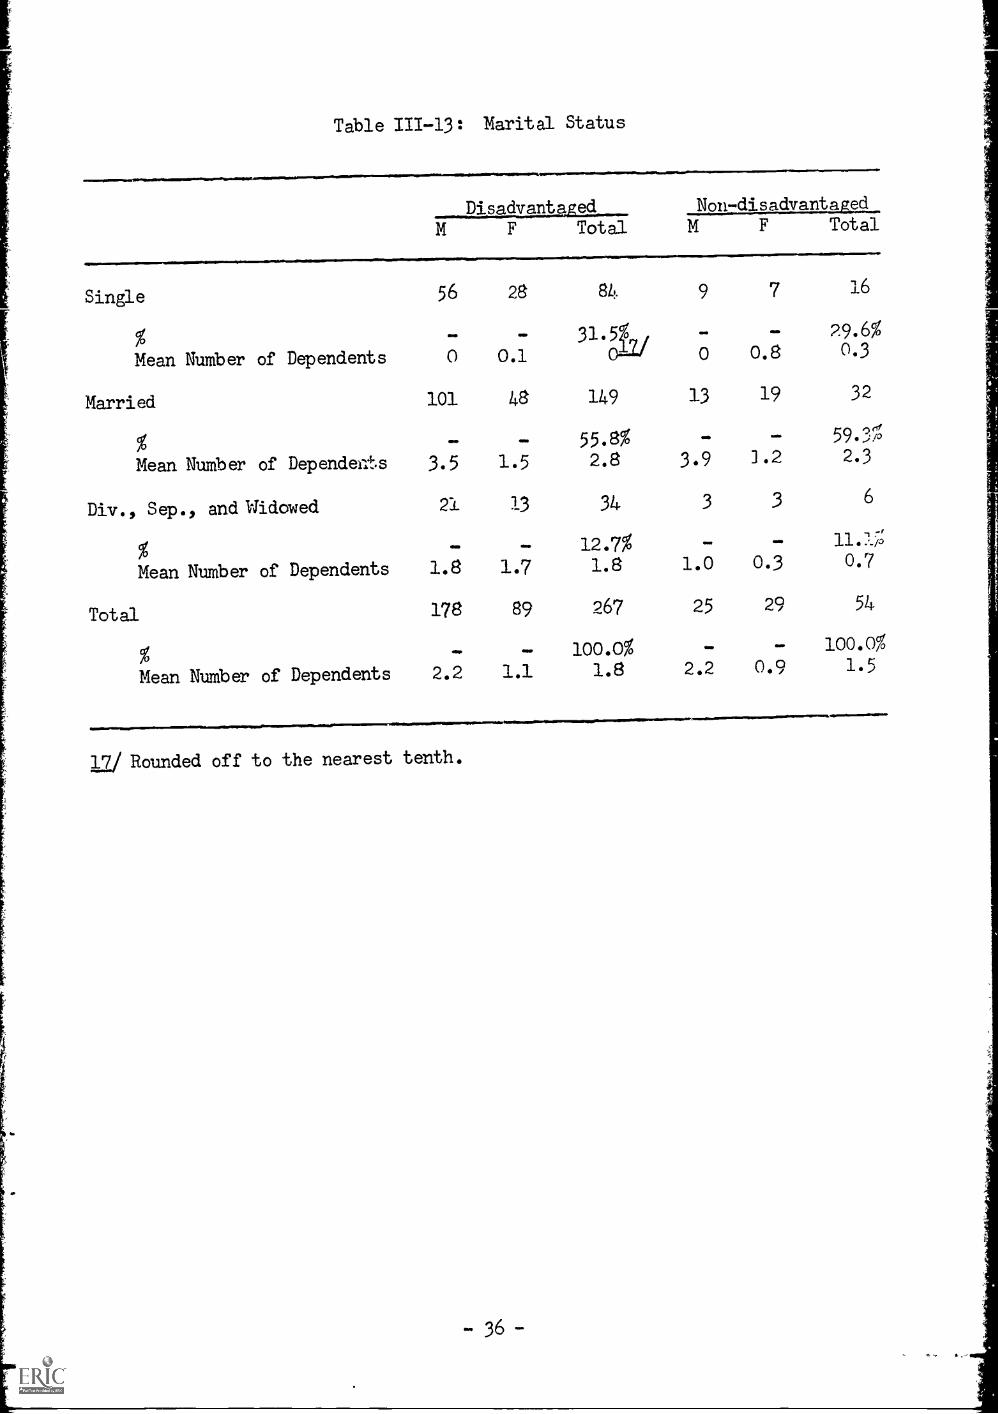
Table 111-13: Marital Status
Disadvanted Non-disadvantaged_Total M F Total
Single 56 28
rm.
Mean Nuthber of Dependents 0 0.1
Married 101 48
411M OM
Mean Nuthber of Dependents 3.5 1.5
Div., Sep., and Widowed 21 13
Mean Nuthber of Dependents 1.8 1.7
Total 178 89
.1. MON
Mean Nuthber of Dependents 2.2 1.1
12/ Rounded off to the nearest tenth.
84 9 7 16
31.5f, /_ 29.6%
0--LI 0 0.8 0.3
149 13 19 32
55.8% - _ 59.3%
2.8 3.9 1.2 2.3
34 3 3 6
12.7%1.8
267
loo.o%1.8
_ - 11.15
1.0 0.3 0.7
25 29 54
100.0%
2.2 0.9 1.5
01.111MMMIIM...... 411.111.11.-.71..
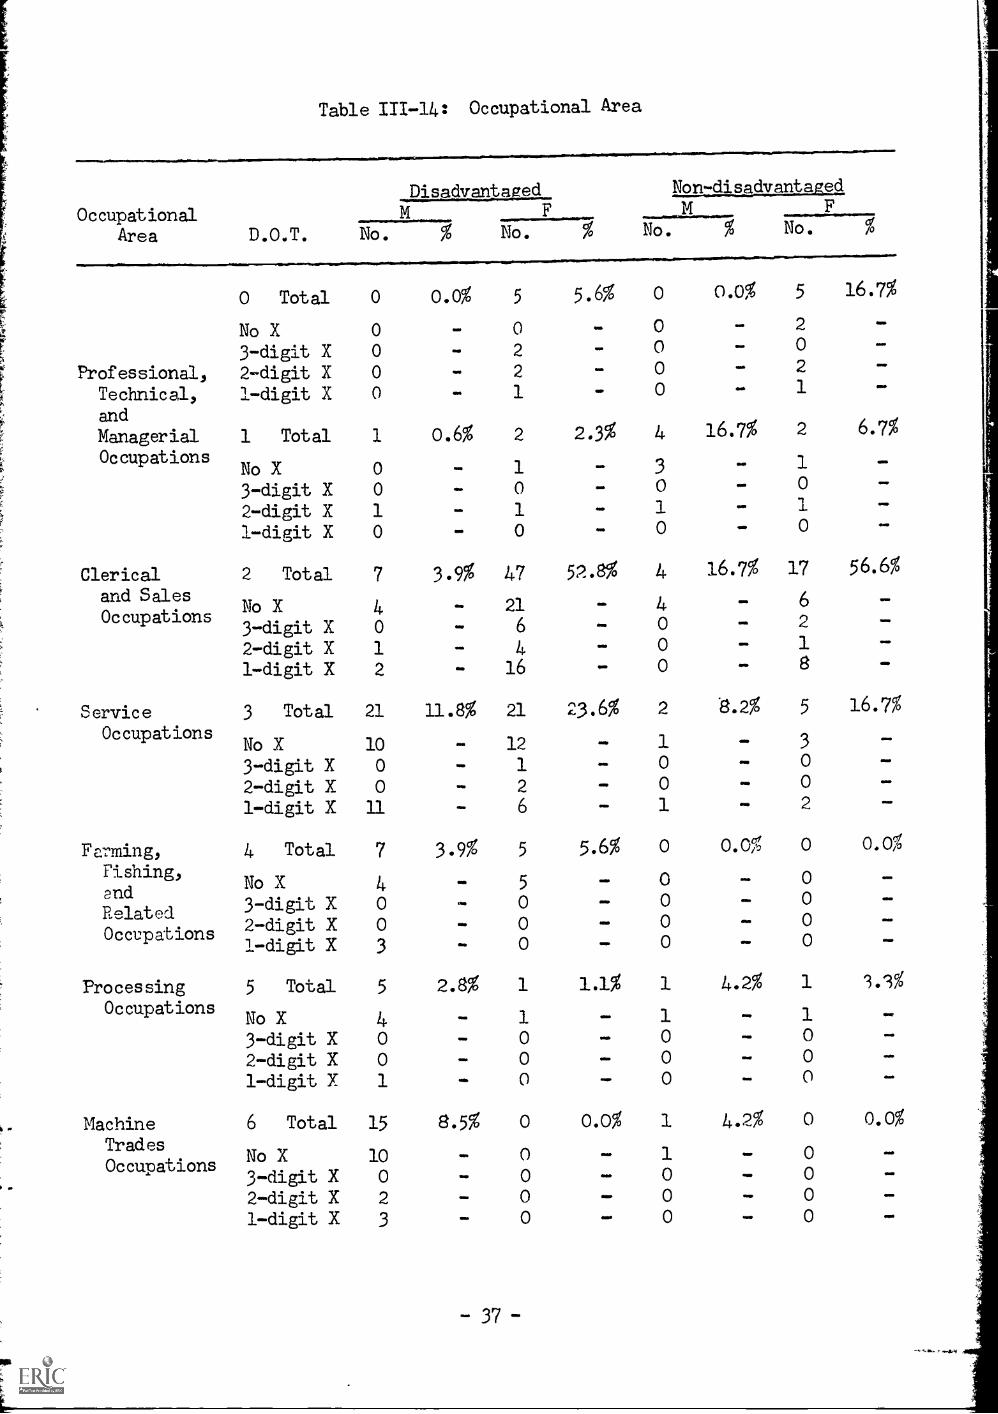
Table 111-14: Occupational Area
OccupationalArea D.O.T.
Disadvantaged
No.
Non-disadvantaged
No. No.
Professional.,
Technical,
and
ManagerialOccupations
Clericaland SalesOccupations
ServiceOccupations
Farming,Fishing,
andRelatedOccupations
ProcessingOccupations
MachineTrades
Occupations
0 Total 0 0.0% 5 5.6% 0 0.0% 5 16.7%
No X3-digit X2-digit X1-digit X
0 - 0 - 0 - 2
0 - 2 - 0 - 0
0 - 2 - 0 - 2
0 - 1 - 0 - 1
ONO
41111
IMO
1 Total 1 0.6% 2 2.3% 4 16.7% 2 6.7%
No X3-digit X2-digit X1-digit X
0 - 1 - 3 - 1
0 - 0 - 0 - 0
1 - 1 - 1 - 1
0 - 0 - 0 - 0
4111,
ama,
OVID
2 Total 7 3.9% 47 52.8% 4 16.72 17 56.6%
No X3-digit X2-digit X1-digit X
3 Total
No X3-digit X2-digit X1-digit X
4 Total
No X3-digit X2-digit X1-digit X
5 Total
No X3-digit X2-digit X 0
1-digit X 1
4 21 4 6
0 6 0 2
1 4 0 1
2 16 0 8
21 11.8% 21 23.6% 2 8.2% 5 16.7%
41
MEI
10 - 12 - 1 - 3
0 - 1 - 0 - 0
0 - 2 - 0 - 0
11 - 6 - 1 - 2
7 3.9% 5 5.6% 0 0.0% 0 0.0%
iloa
iloa
4 - 5 - 0 - 0
0 - 0 - 0 - 0
0 - 0 - 0 - 0
3 - 0 - 0 - 0
5 2.8% 1 1.1% 1 4.2% 1 3.9%
iloa
iloa
L.
0
ON.
Oft
1 41110
OMNI
0111.
1 .10
WAD
IMO
1 411.
INNS
a/.
6 Total 15 8.5% 0 0.0% 1 4.2% 0 0.0%
No X 10
3-digit X 0
2-digit X 21-digit X 3
ONO
IND
WM.
-37-
Na am ana
=la
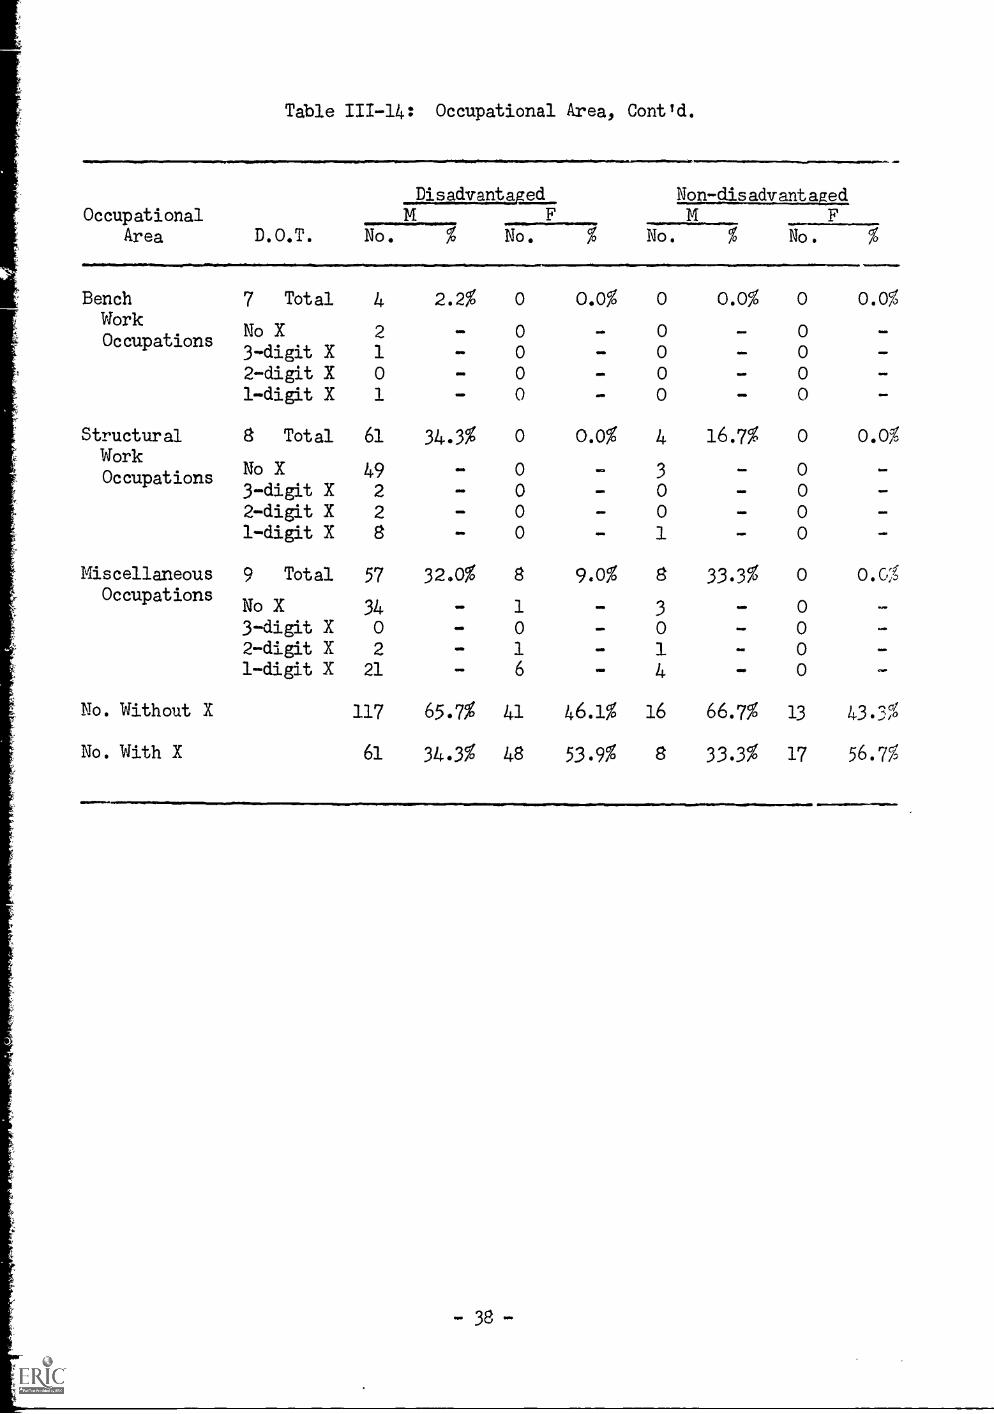
Table 111-14: Occupational Area, Cont'd.
Disadvantaged Non-disadvantagedOccupational
Area D.O.T. No. No. No. No.
11.Bench 7 Total 4 2.2% 0 0.0% 0 0.0% 0 0.0%Work
No X 2 0 0 0Occupations
3-digit X 1 - 0 - 0 - 02-digit X 0 - 0 - 0 - 0l-digit X 1 - 0 - 0 - 0
Structural 8 Total 61 34.3% 0 0.0% 4 16.7% 0 0.0%Work
OIM
AS.
OMIIP
No X 49 0 3 0OccupationsfloN,
3-digit X 2 - 0 - 0 - 0 -2-digit X 2 - 0 - 0 - 0 -
1-digit X 8 - 0 - 1 - 0 -
Miscellaneous 9 Total 57 32.0% 8 9.0% 8 33.3% 0 0.0Occupations
No X 34 - 1 - 3 - 03-digit X 0 . 0 - 0 - 0 -
2-digit X 2 - 1 - 1 - 01-digit X 21 - 6 - 4 - 0
No. Without X 117 65.7% 41 46.1% 16 66.7% 13 43.3%
ea.
Mao
No. With X 61 34.3% 48 53.9% 8 33.3% 17 56.7%
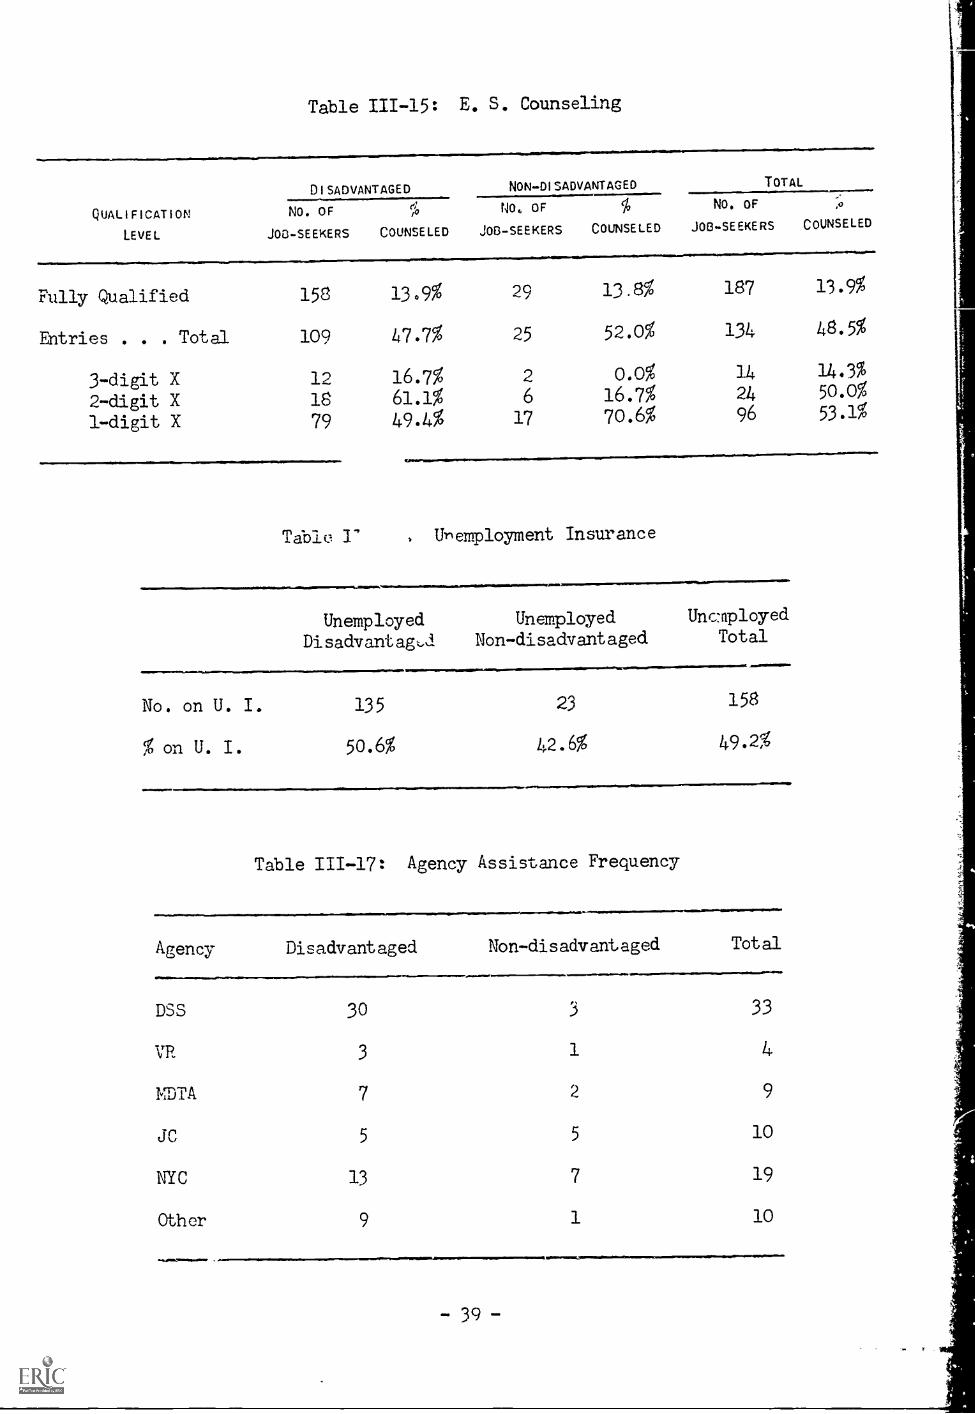
Table 111-15: E. S. Counseling
QUALIFICATION
LEVEL
DISADVANTAGED NON-DISADVANTAGED TOTAL
NO. OF
J00-SEEKERS
r;/0
COUNSELED
NO, OF
JOD-SEEKERS
%
COUNSELED
NO. OF
JOB-SEEKERS
,0
COUNSELED
Fully Qualified 158 13.9% 29 13.8% 187 13.9%
Entries . . . Total 109 47.7% 25 52.0% 134 48.5%
3-digit X 12 16.7% 2 0.0% 14 14.3%
2-digit X 18 61.1% 6 16.7% 24 50.0%
1-digit X 79 49.4% 17 70.6% 96 53.1%
Table l' , Urenployment Insurance
=.6...1.11=111110,1....)
Unemployed Unemployed Unemployed
Disadvantagt,d Non-disadvantaged Total
No. on U. I. 135 23 158
% on U. I. 50.6% 42.6% 49.2%
Table 111-17: Agency Assistance Frequency
Agency Disadvantaged Non-disadvantaged Total
DSS 30 3 33
VR 3 1 4
MDTA 7 2 9
jC 5 5 10
NYC 13 7 19
Other 9 1 10
- 39
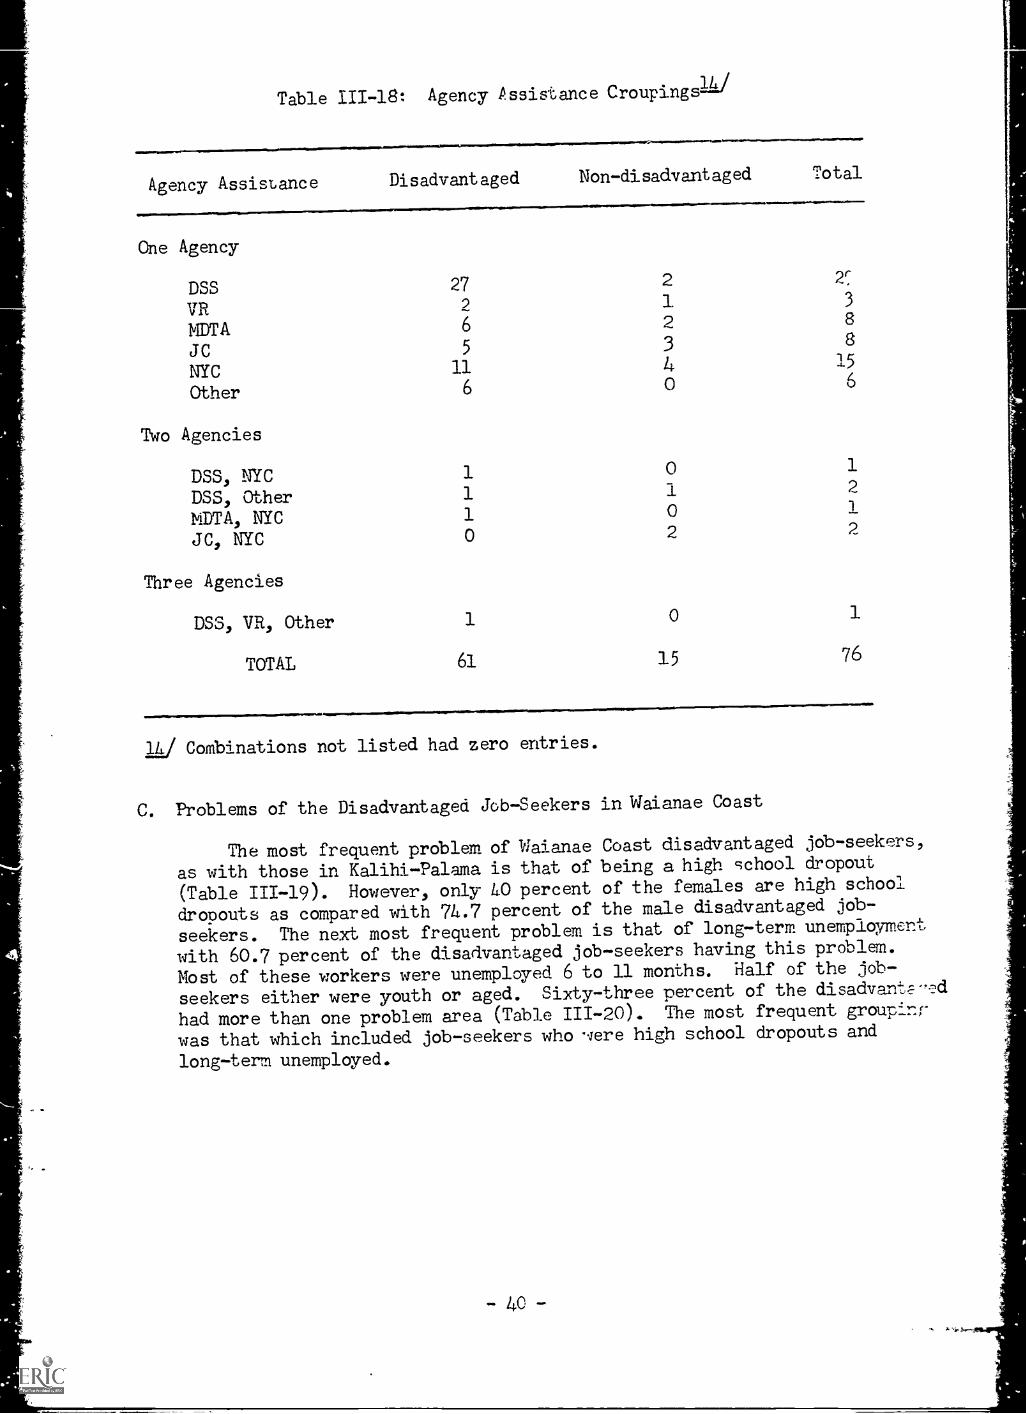
Table 111-18: Agency Pssistance Croupings112
Agency Assistance Disadvantaged Non-disadvantaged Total
One Agency
DSS 27 2 ZITO 9 1V IL
3
MDTA 6 2 8
JC 5 3 8
NYC 11 4 15
Other 6 o 6
Two Agencies
DSS, NYC 1 o 1
DSS, Other 1 1 2
MDTA, NYC 1 o 1
JC, NYC 0 2 2
Three Agencies
DSS, VR, Other 1 1
TOTAL 15 76
IN
1L/ Combinations not listed had zero entries.
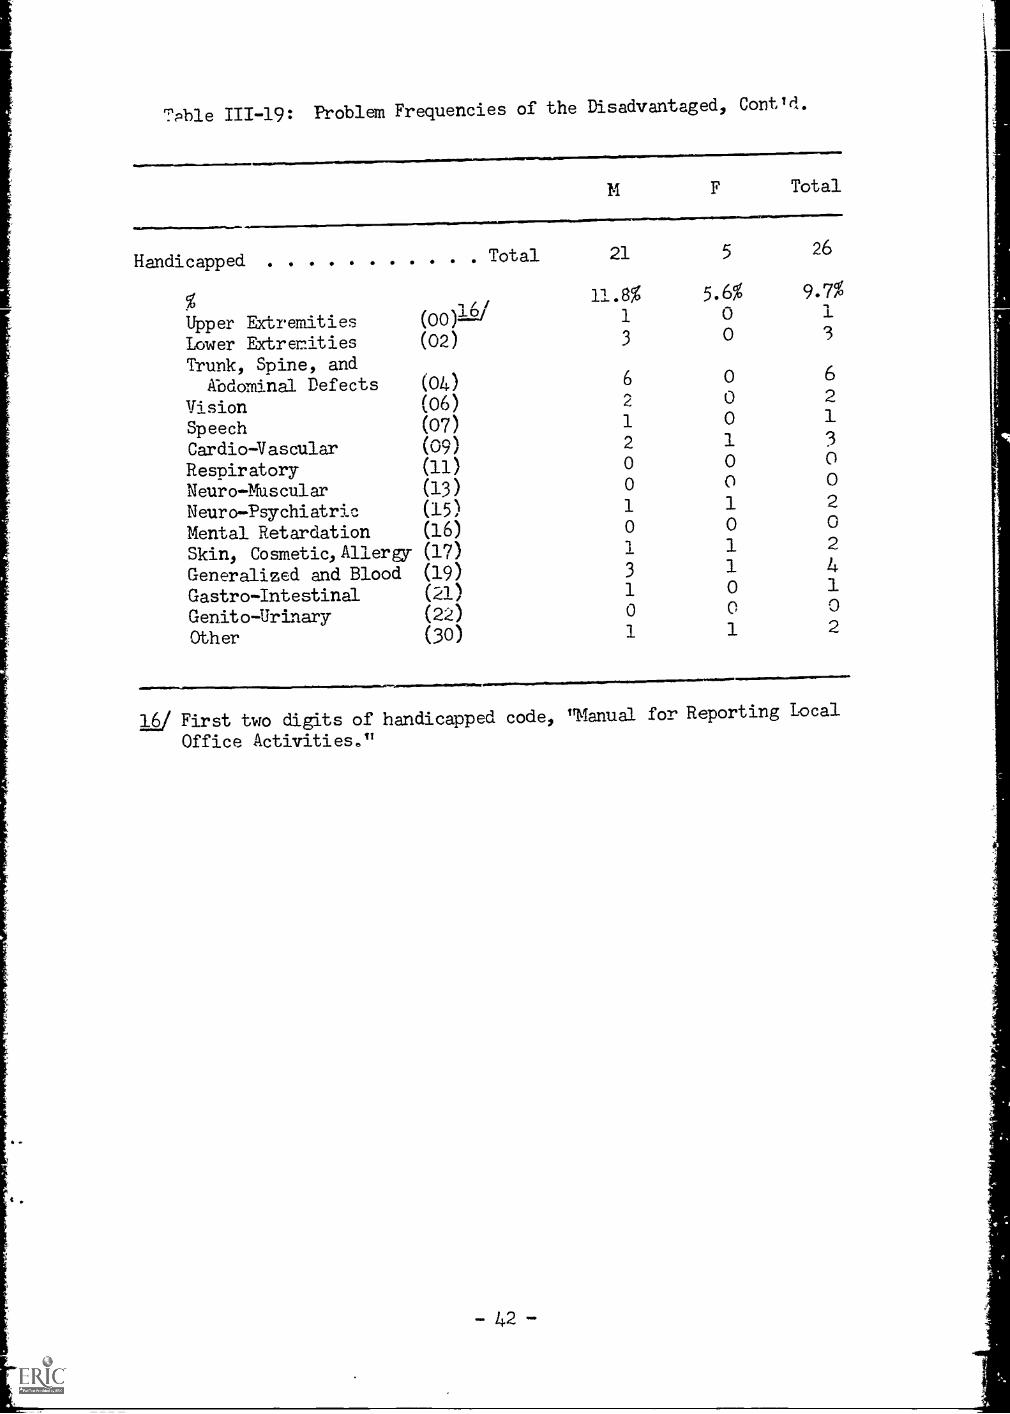
C. Problems of the Disadvantaged Job-Seekers in Wraianae Coast
The most frequent problem of Waianae Coast disadvantaged jdb-seekers,
as with those in Kalihi-Palama is that of being a high school dropout
(Table 111-19). However, only 40 percent of the females are high school
dropouts as compared with 74.7 percent of the male disadvantaged jdb-
seekers. The next most frequent problem is that of long-term unemployment
with 60.7 percent of the disadvantaged job-seekers having this problem.
Most of these workers were unemployed 6 to 11 months. Half of the job-
seekers either were youth or aged. Sixty-three percent of the disadvantE-.1,d
had more than one problem area (Table 111-20). The most frequent groupinr
was that which included job-seekers who Nere high school dropouts and
long-term unemployed.
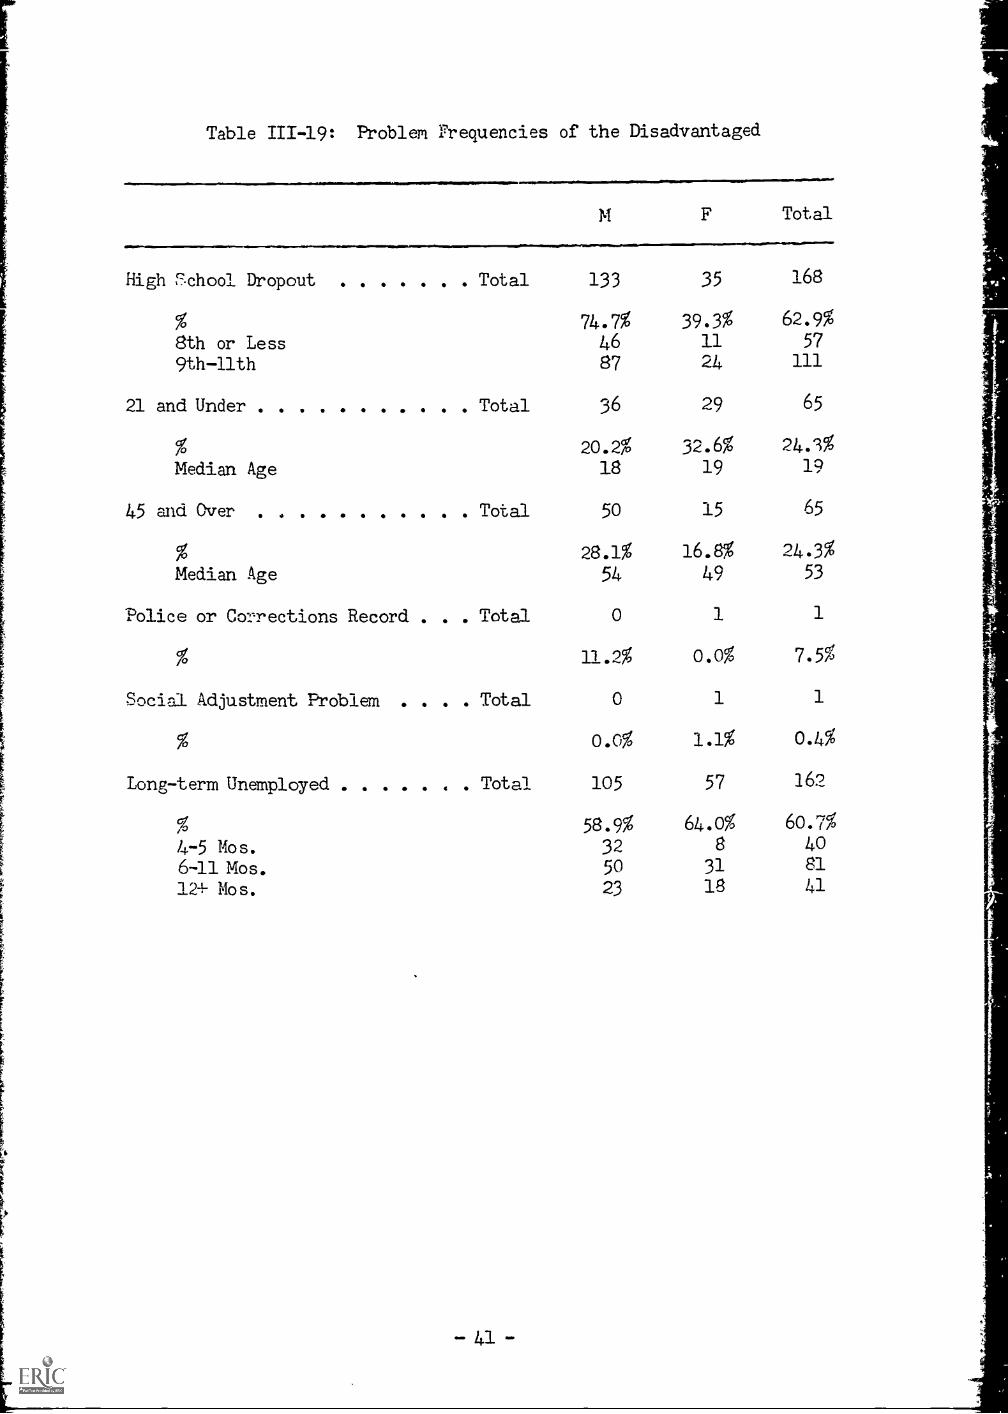
Table 111-19: Problem Frequencies of the Disadvantaged
1%1 F Total
High F.chool Dropout Total 133 35 168
62.9%57
111
65
24.3%19
65
24.3%53
1
7.5%
1
0.4%
162
%8th or Less9th-llth
21 and Under Total
747%4687
36
39.3%1124
29
% 20.2% 32.6%Median Age 18 19
45 and Over Total 50 15
% 28.1% 16 1-:
Wdian Age 54 49
Police or Corrections Record . Total 0 1
% 11.2% 0.0%
Social Adjustment Problem . . . . Total 0 1
% 0.0% 1.1%
Long-term Unemployed Total 105 57
% 58.9% 64.0% 60.7%
4-5 Mos. 32 8 40
6-11 Mos. 50 31 81
12+ Mos. 23 18 41
Tpble 111-19: Problem Frequencies of the Disadvantaged, Conti&
11 F Total
Handicapped
%
Total 21
11.8%
5
5.6%
26
9.7%
Upper Extremities (00)112/ 1 0 1
Lower Extremities (02) 3 0 3
Trunk, Spine, andAbdom inal Defects (04) 6 o 6
Vision (06) 2 0 2
Speech (07) 1 0 1
Cardio=Vascular (09) 2 1 3
Respiratory (11) 0 0 0
Neuro-Muscular (13) 0 0 0
Neuro-Psychiatric (15) 1 1 2
Mental Retardation (16) 0 0 0
Skin, Cosmetic,Allergy (17) 1 1 2
Generalized and Blood (19) 3 1 4
Gastro-Intestinal (21) 1 0 1
Genito-Urinary (22) 0 0 0
Other (30) 1 1 2
.11,11wl
16/ First two digits of handicapped code, "Manual for Reporting Local
Office Activities."
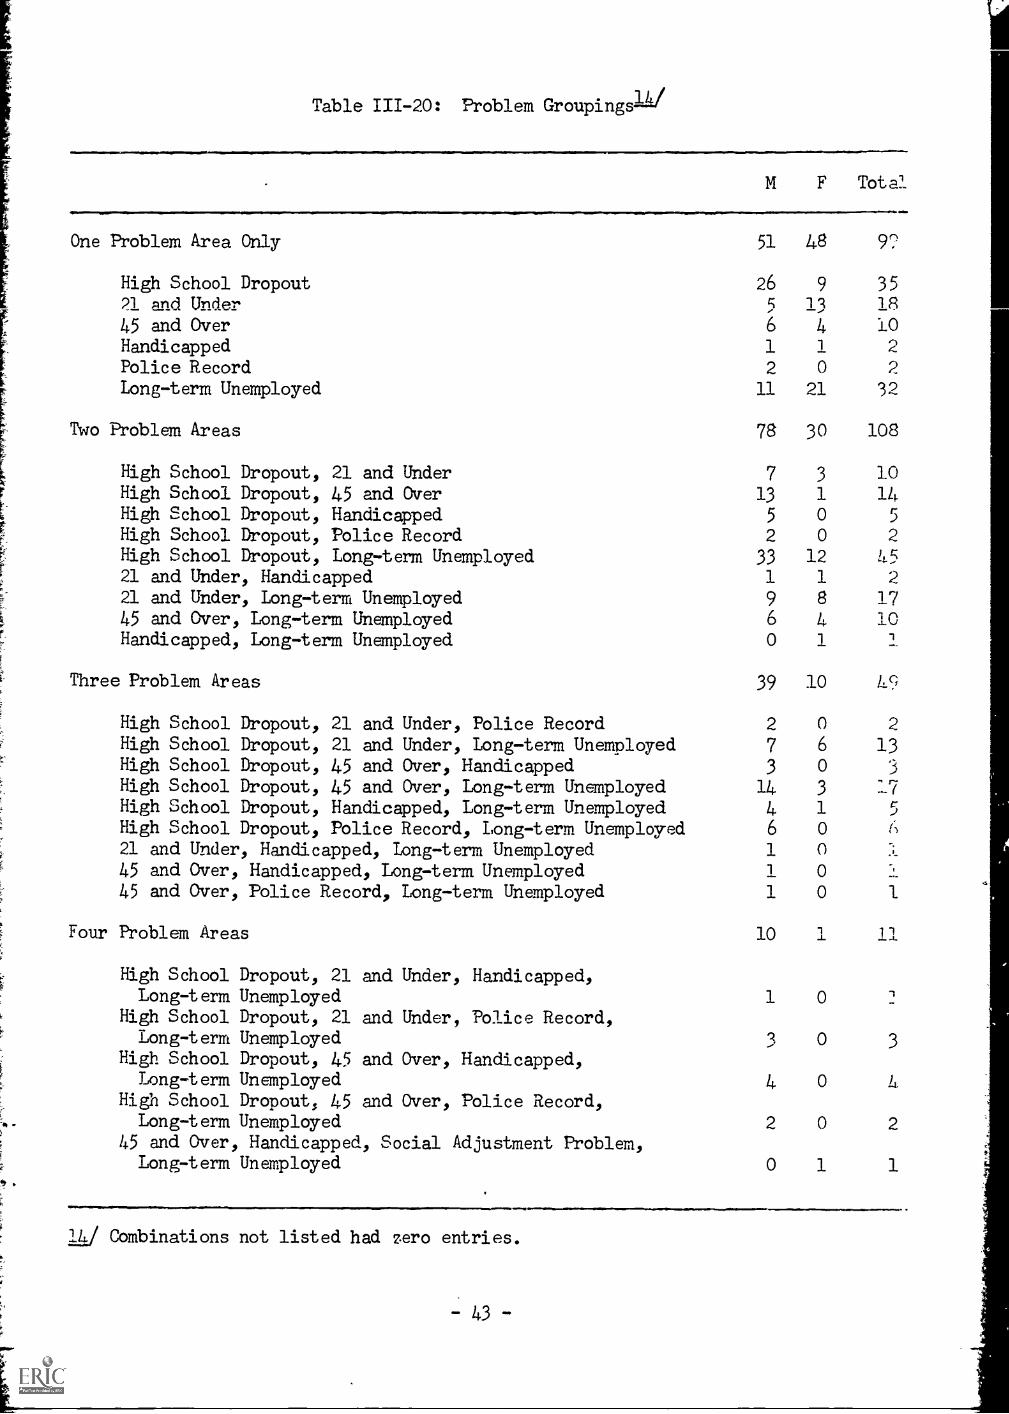
Table 111-20: Ftoblem Groupingslki
F Total
One Ptoblem Area Only
High School Dropout21 And Under45 and Over
51
26
5
6
48
913
4
9?
35is
Handicapped 1 2
Police Record 2 0 2
Long-term Unemployed 11 21 32
Two Ft6blem Areas 78 30 108
High School Dropout, 21 and Under 7 3 10High School Dropout, 45 and Over 13 1 14High School Dropout, Handicapped 5 0 5
High School Dropout, Police Record 2 0 2
High School Dropout, Long-term Unemployed 33 1221 and Under, Handicapped 1 1 2
21 and Under, Long-term Unemployed 9 8 1745 and Over, Long-term Unemployed 6 4 10Handicapped, Long-term Unemployed 0 1 1
Three Problem Areas 39 10
Four
High School Dropout, 21 and Under, Police RecordHigh School Dropout, 21 and Under, Long-term UnemployedHigh School Dropout, 45 and Over, HandicappedHigh School Dropout, 45 and Over, Long-term UnemployedHigh School Dropout, Handicapped, Long-term UnemployedHigh School Dropout, Police Record, Long-term Unemployed21 and Under, Handicapped, Lung-term Unemployed45 and Over, Handicapped, Iong-term Unemployed45 and Over, Police Record, Long-term Unemployed
Problem Areas
High School Dropout, 21Long-term
High SchoolLong-term
High SchoolLong-term
High SchoolLong-term
45 and Over,
and Under, Handicapped,UnemployedDropout, 21 and Under, Police Record,UnemployedDropout, 45 and Over, Handicapped,UnemployedDropout, 45 and Over, Police Record,UnemployedHandicapped, Social Adjustment Problem,
Long-term Unemployed
2
7
3
1446
1
1
1
10
0 2
6 130 3
3 171 5
0
0 1
0
0 1
1 1
1 0
0
4 0
2 0 2
0 1 1
1L/ Combinations not listed had zero entries.
43 -

IV. SUMMARY
IV. Summary
A. Comments on Data
This survey sought to identify the model neighborhood job-seekers. It
was discovered that model neighborhood residents who are seeking full -timc,permanent employment make up 12.6 percent of the total Oahu inventory ofthe state employment service offices. The inclusion of model nrigO)orhoodjob-seekers who are after part-time or temporary work would probablyincrease this percentage. Since the majority of the job -seetcers were
unemployed, data from this survey was used to estimate total unemploymentin the model neighborhood areas. The estimates are conservative and arebest used as lower limits rather than exact figures. Due to the smallnuMber of employed workers who register at the state employment serviceoffices, similar estimates could not be made for underemployment.
The unusual nature of the model neighborhoods is quite apparent bythe fact that over 80 percent of the model neighborhood job-seekers werecalled disadvantaged in their job hunt. This percentage is four timeslarger than that which a 1966 survey found for all Oahu. Over two-thirdsof the disadvantaged had more than one problem. About 43 percent were notfully qualified for their area of search. It is perhaps upon this group ofdisadvantaged job-seekers who are not fully qualified that most of theattention ought to be placed.
B. Follow-Up Suggestions
This survey studied the existing invemory of model neighborhood job-seekers of the state employment service on June 25, 1968. It is hoped thatits relevance extends beyond that date. Perhaps the biggest factor, otherthan seasonal change.?, which may make this survey dbsolete is the creationof CEP intake centers in Kalihi-Palama and Waianae Coast. A comparisonshould be made between the model neighborhood job-seeker inventory foundin this survey and that which exists after the intake centers have beenwell-established. A significant quantitative difference may suggest aqualitative one as well. New job-seekers who previously had been hinderedby information or transportation problems will register with the moreconveniently located state employment service. One might speculate that
the percentage who are disadvantaged for these new job-seekers would belarger than that for the job-seekers in this survey. It Is hoped that theintake centers will identify s11those job-seekers who are in the modelneighborhoods so that a meaningful comparison can be made.
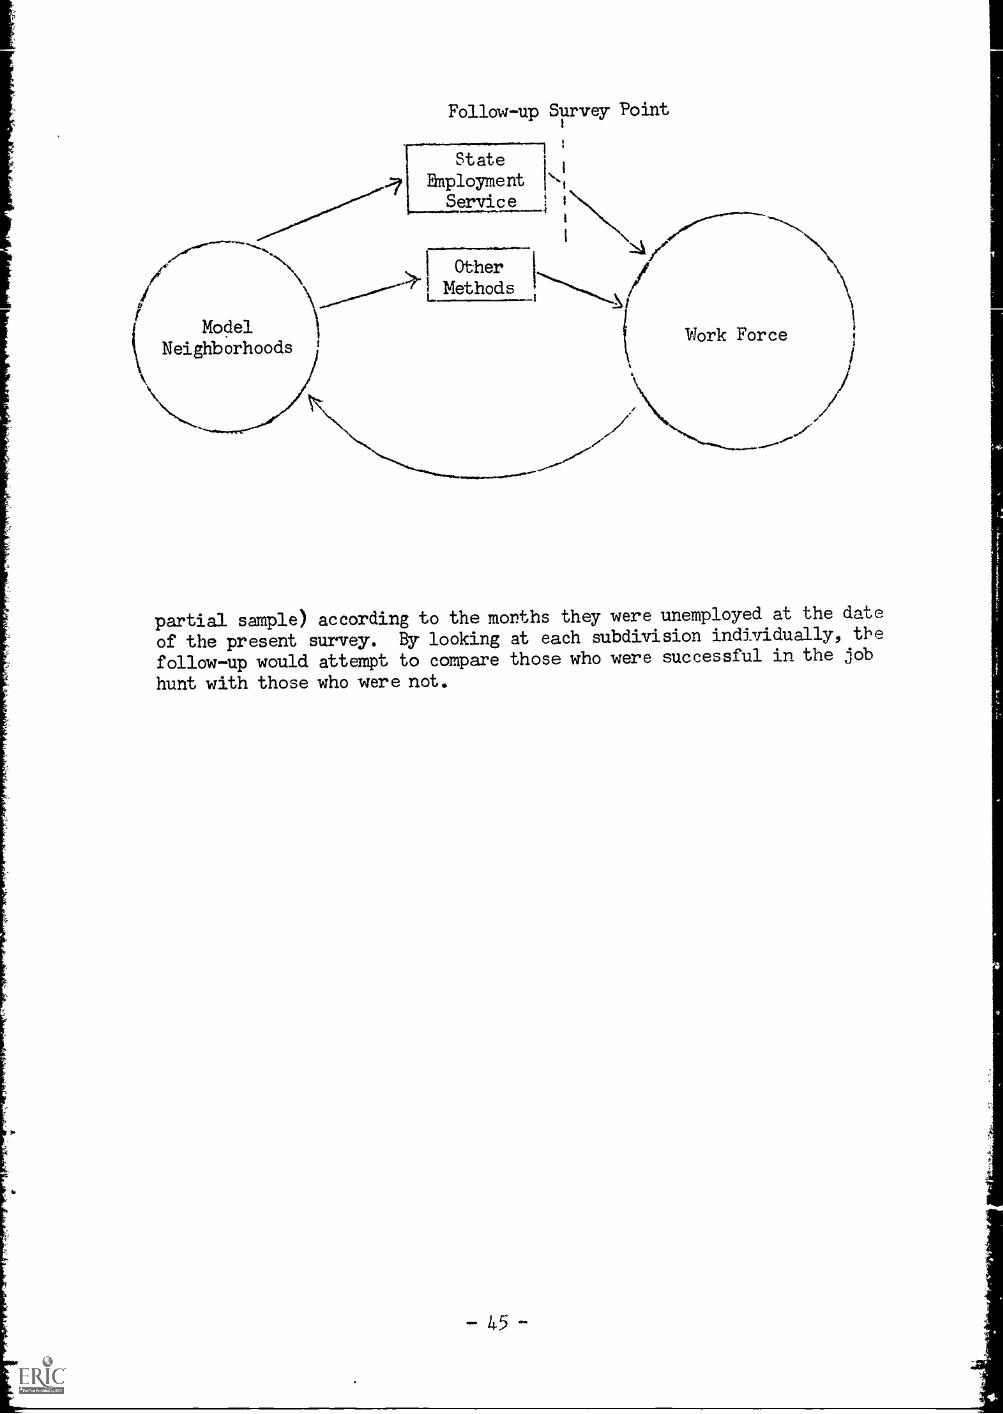
The present survey addressed itself to the question: who are themodel neighborhood job-seekers? A useful follow-up to this survey wouldask the question: who are the successful job-seekers? Such a follaw-upwould divide the job-seekers in this survey (either the whole group or a
Follow-up Survey Point
State
Employment kService
MethodsOther 1
c
ModelNeighborhoods 1
......."..
partial sample) according to the months they were unemployed at the date
of the present survey. By looking at each aubdivision individually, the
follow-up would attempt to compare those who were successful in the job
hunt with those who were not.
APPENDI.XES
APPENDIX A
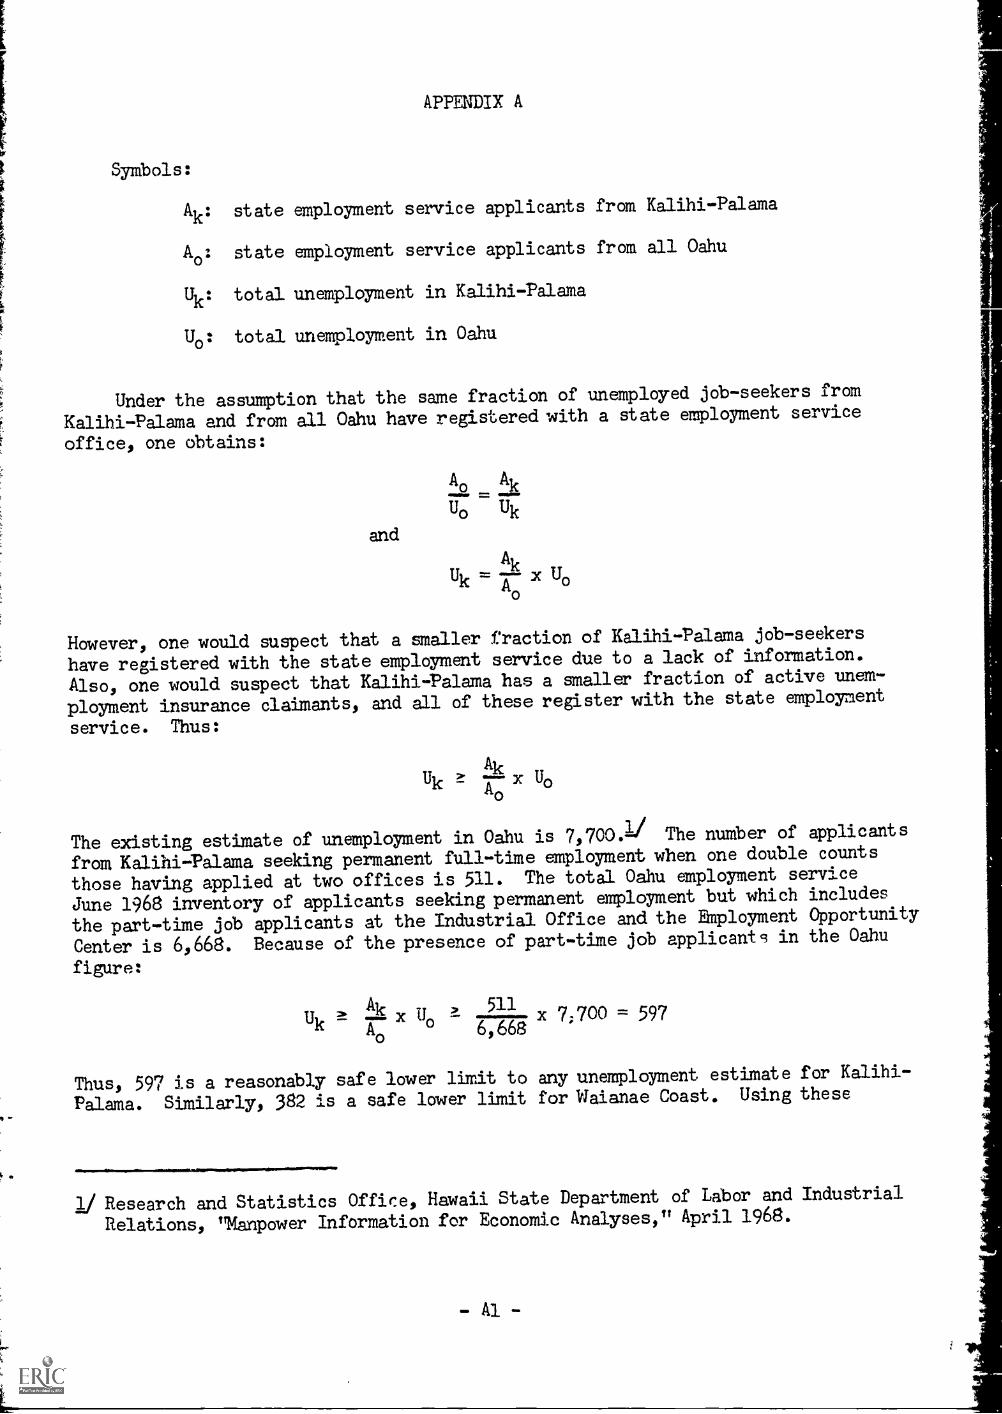
Symbols:
Ak: state employment service applicants from Kalihi-Palama
Ao: state employment service applicants from all Oahu
Uk: total unemployment in Kalihi-Palama
U0: total unemployment in Oahu
Under the assumption that the same fraction of unemployed job-seekers from
Kalihi-Palama and fram all Oahu have registered with a state employment service
office, one obtains:
and
A Ak9. -U0 Uk
AkUk = x U0
However, one would suspect that a smaller fraction of Kalihi-Palama job-seekers
have registered with the state employment service due to a lack of information.
Also, one would suspect that KalihiPalama has a smaller fraction of active unem-
ployment insurance claimants, and all of these register with the state employment
service. Thus:
UkAk
"JoAO
The existing estimate of unemploynent in Oahu is 7,700.11 The number of applicants
from Kalihi-Palama seeking permanent full-time employment when one double counts
those having applied at two offices is 511. The total Oahu anployment service
June 1968 inventory of applicants seeking permanent employment but which includes
the part-time job applicants at the Industrial Office amd the EMployment Opportunity
Center is 6,668. Because of the presence of part-time job applicants in the Oahu
figure:
U > Akk w; x U0 at .211
6,6687;700 = 597
Thus, 597 is a reasonably safe lower limit to any unemployment estimate for Kalihi-
Palama. Similarly, 382 is a safe lower limit for Waianae Coast. Using these
1/ Research and Statistics Office, Hawaii State Department of Labor and Industrial
Relations, 'Manpower Information for Economic Analyses," April 1968.
- Al -
estimates, 83.9 percent for KalihiPalama and 84.0 percent for Waianae Coast are-are lowec limits for the percentage of the unemployed jobseekers who haveregistered ac, the state employment service.
APPENDIX B
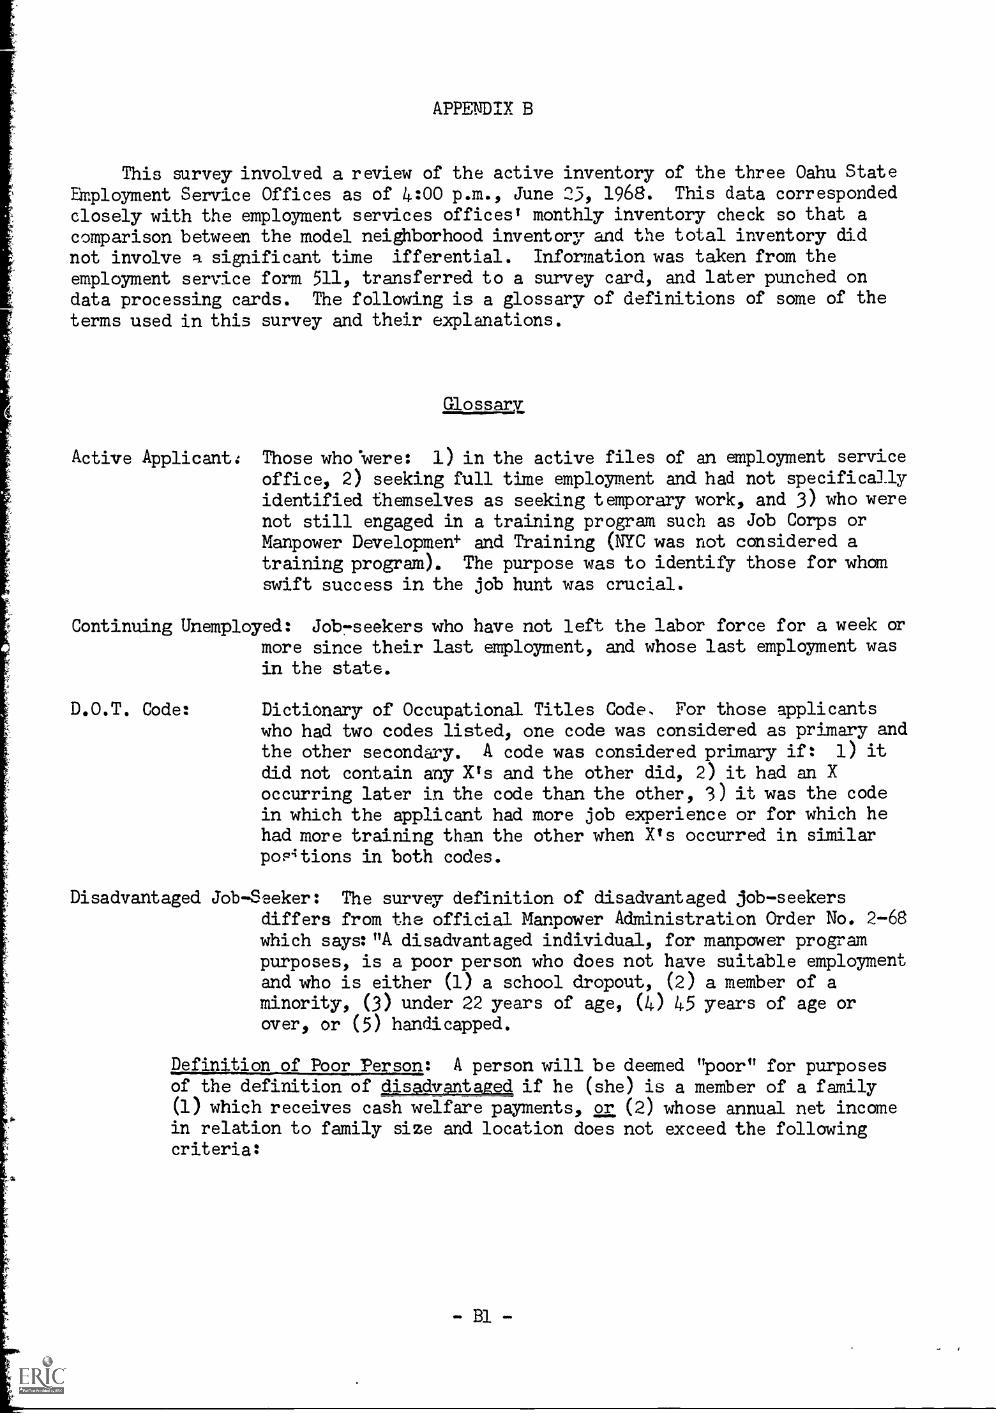
This survey involved a review of the active inventory of the three Oahu StateEmployment Service Offices as of 4:00 p.m., June 25, 1968. This data correspondedclosely with the employment services offices' monthly inventory check so that acomparison between the model neighborhood inventory and the total inventory didnot involve q significant time ifferential. Information was taken from theemployment service form 511, transferred to a survey card, and later punched ondata processing cards. The following is a glossary of definitions of some of theterms used in this survey and their explanations.
Glossary
Active Applicant: Those who.were: 1) in the active files of an employment serviceoffice, 2) seeking Pull time employment and had not specificallyidentified themselves as seeking temporary work, and 3) who werenot still engaged in a training program such as Job Corps orManpower Developme& and Training (NYC was not considered atraining program). The purpose was to identify those for whamswift success in the job hunt was crucial.
Continuing Unemployed: Job7seekers who have not left the labor force for a week ormore since their last employment, and whose last amployment wasin the state.
D.O.T. Code: Dictionary of Occupational Titles Code, For those applicantswho had two codes listed, one code was considered as primary andthe other secondary. A code was considered primary if: 1) it
did not contain any Xls and the other did, 2) it had an Xoccurring later in the code than the other, 3) it was the codein which the applicant had more job experience or for which hehad more training than the other when Ps occurred in similarpos4tions in both codes.
Disadvantaged Job-Seeker: The survey definition of disadvantaged job-seekersdiffers from the official Manpower Administration Order No. 2-68which says:"A disadvantaged individual, for manpower programpurposes, is a poor person who does not have suitable employmentand who is either (1) a school dropout, (2) a member of aminority, (3) under 22 years of age, (4) 45 years of age orover, or (5) handicapped.
Definition of Poor Person: A person will be deemed 'poor" for purposesof the definition of ailsggluptaged if he (she) is a member of a family(1) which receives cash welfare payments, or (2) whose annual net incamein relation to family size and location does not exceed the followingcriteria:
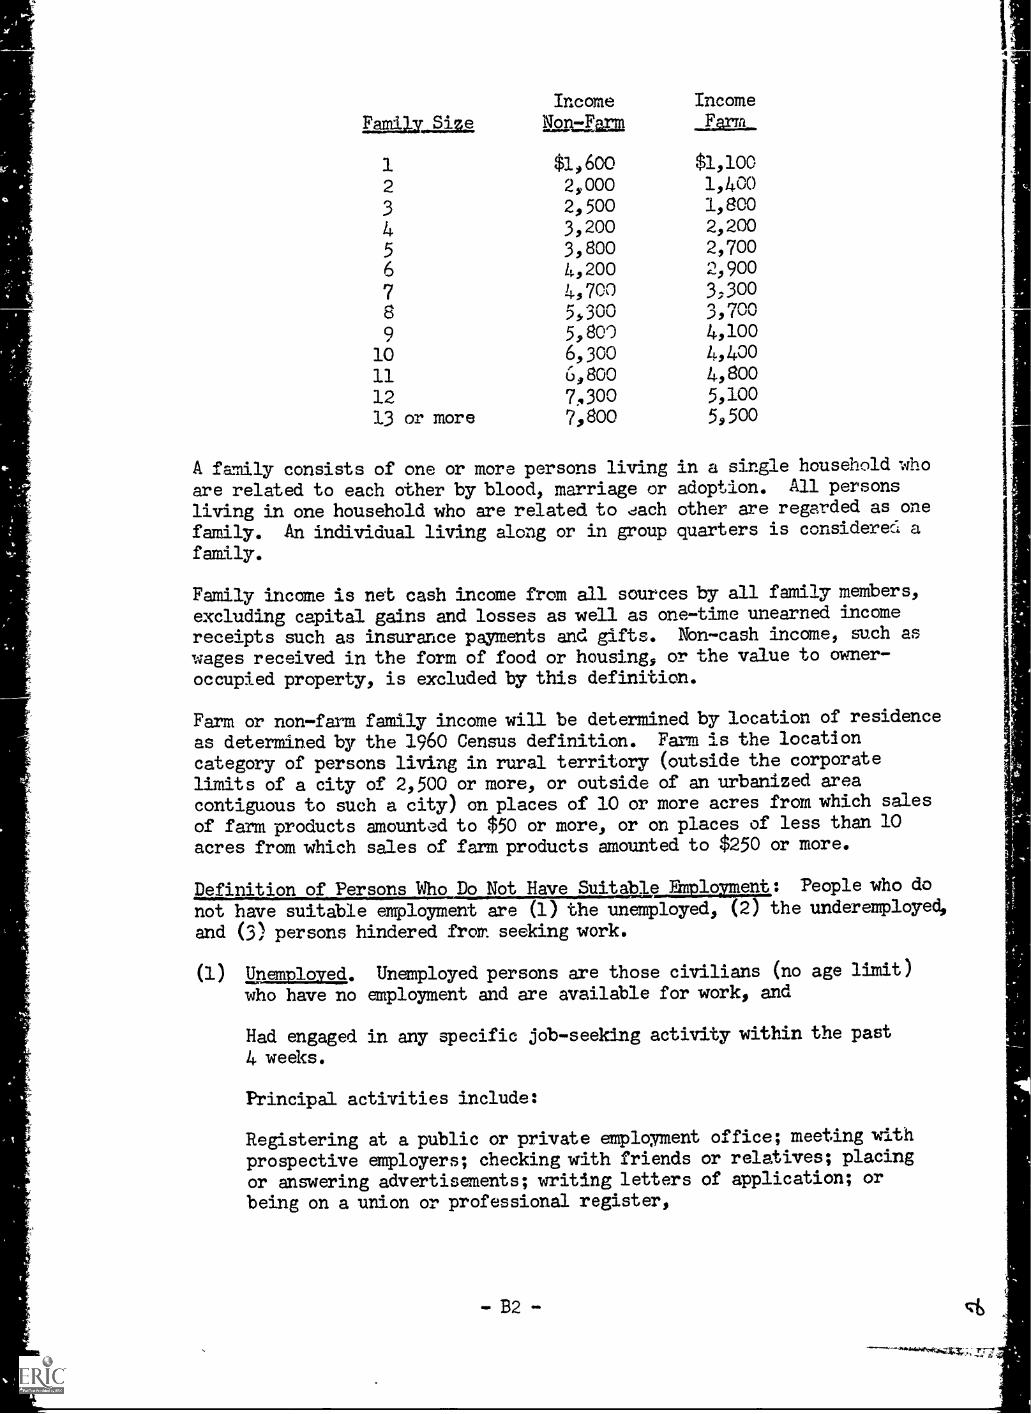
Income IncameEmily Size 110=Earm ...Eara_
1 $1,600 $1,100
2 2000, 1,400
3 20500 1,800
4 3,200 2,200
5 3,800 2,700
6 4,200 2,900
7 4,700 3,300
8 5000 3,700
9 5,800 4,10010 6,300 4,40011 6,800 4,80012 7,300 5,100
13 or more 7,800 5,500
A family consists of one or more persons living in a single household whoare related to each other by blood, marriage or adoption. All persons
living in one household who are related to clach other are regarded as onefamily. An individual living along or in group quarters is considered a
family.
Family incane is net cash income from all sources by all family members,excluding capital gains and losses as well as one-time unearned incomereceipts such as insurance payments and gifts. Von-cash income, such as
wages received in the form of food or housing, or the value to owner-
occupied property, is excluded by this definition.
Farm or non-farm family income will be determined by location of residence
as determined by the 1960 Census definition. Farm is the location
category of persons living in rural territory (outside the corporate
limits of a city of 2,500 or more, or outside of an urbanized areacontiguous to such a city) on places of 10 or more acres from which sales
of farm products amounted to $50 or more, or on places of less than 10
acres from which sales of farm products amounted to $250 or more.
Definition of Persons Who Do Not Have Suitable EhDlovment: People who do
not have suitable employment are (1) the unemployed, (2) the underemployed,
and (3) persons hindered from seeking work.
(1) unmallyag. Unemployed persons are those civilians (no age limit)
who have no employment and are available for work, and
Had engaged in any specific job-seeking activity within the past
4 weeks.
Principal activities include:
Registering at a public or prtvate employment office; meting withprospective employers; checking with friends or relatives; placing
or answering advertisements; writing letters of application; or
being on a union or professional register,
-B2-
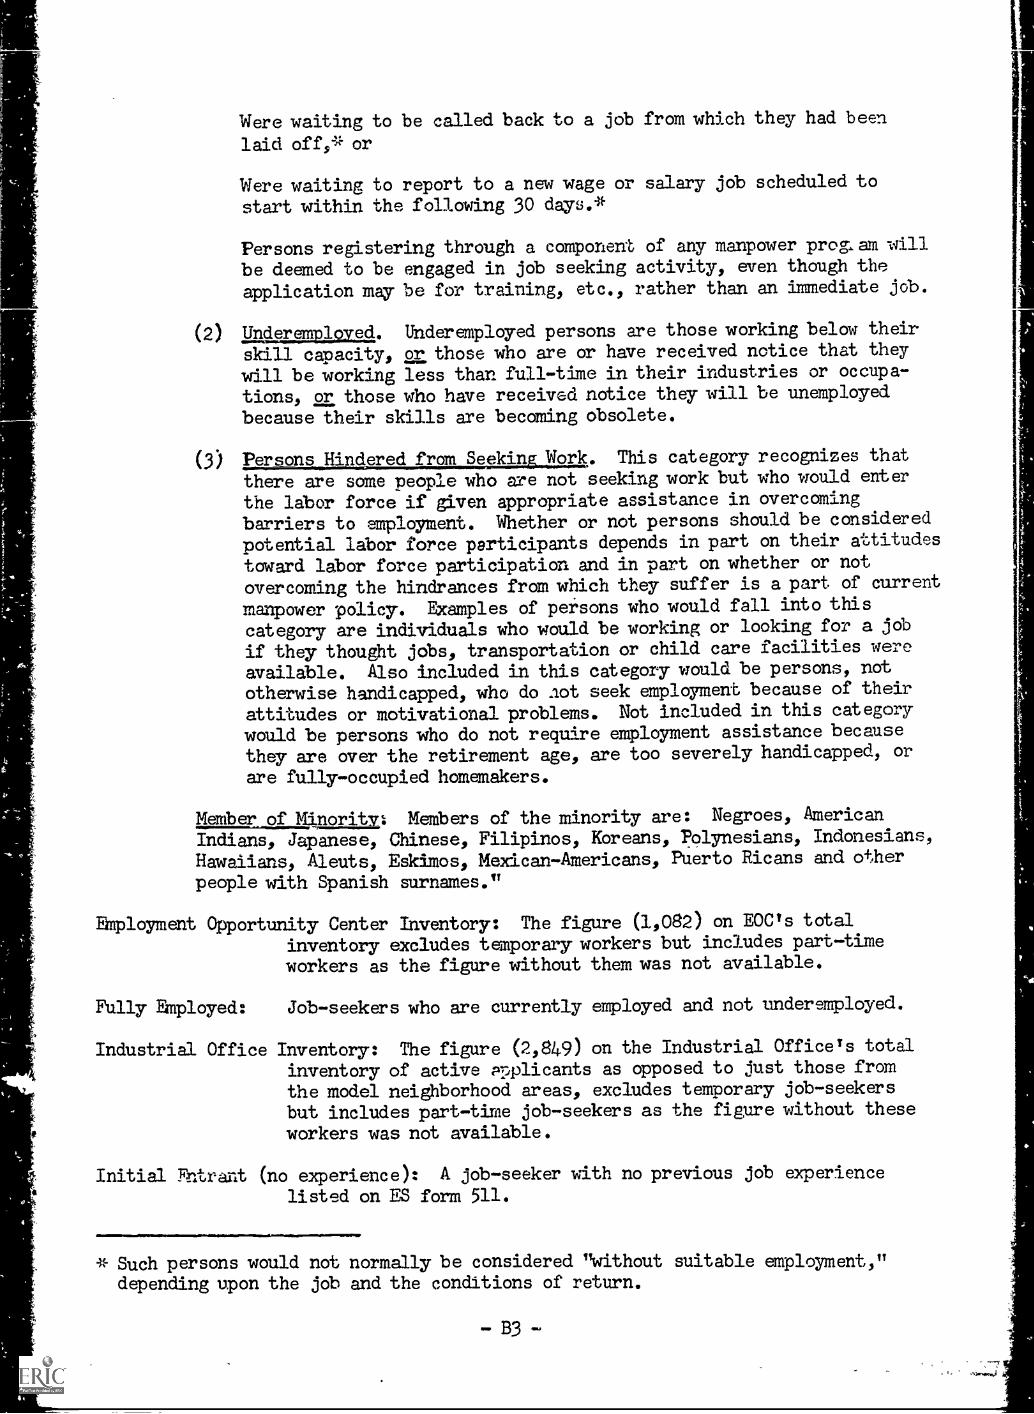
Were waiting to be called back to a job from which they had been
laid off,* or
Were waiting to report to a new wage or salary j6b scheduled to
start within the following 30 days.*
Persons registering through a component of any manpower pro& am will
be deemed to be engaged in job seeking activity, even though the
application may be for training, etc., rather than an immediate job.
(2) Un4mmalaa4. Underemployed persons are those working below their
skill capacity, or those who are or have received notice that they
will be working less than full-time in their industries or occupa-tions, or those who have received notice they will be unemployed
because their skills are becoming obsolete.
(3) Persons Hindered fram Seeking Work. This category recognizes that
there are same people who are not seeking work but who would enter
the labor force if given appropriate assistance in overcoming
berriers to employment. Whether or not persons should be considered
potential labor force participants depends in part on their attitudes
toward labor force participation and in part on whether or not
overcoming the hindrances from which they suffer is a part of current
mianpower policy. Examples of persons who would fall into this
category are individuals who mpuld be working or looking for a job
if they thought jobs, transportation or child care facilities were
available. Also included in this category would be persons, not
otherwise handicapped, who do aot seek employment because of their
attitudes or motivational problems. Not included in this category
wpuld be persons mho do not require employment assistance because
they are over the retirement age, are too severely handicapped, or
are fully-occupied homemakers.
Member of Minority:- Members of the minority are: Negroes, American
Indians, Japanese, Chinese, Filipinos, Koreans, Polynesians, Indonesians,Hawaiians, Aleuts, Eskimos, Merican-Americans, Puerto Ricans and otherpeople with Spanish surnames."
Employment Opportunity Center Inventory: The figure (1,082) on EOCTs total
inventory excludes temporary workers but includes part-time
workers as the figure without them was not available.
Fully Employed: Job-seekers who are currently employed and not underemployed.
Industrial Office Inventory: The figure (2,849) on the Industrial OfficeTs totalinventory of active applicants as opposed to just those from
the model neighborhood areas, excludes temporary job-seekersbut includes part-time job-seekers as the figpre without these
workers was not available.
Initial Entrant (no experience): A job-seeker uith no previous job experience
listed on ES form 511.
1111.=111.....
* Such persons would not normally be considered "without suitable employment,"depending upon the job and the conditions of return.
-B3-
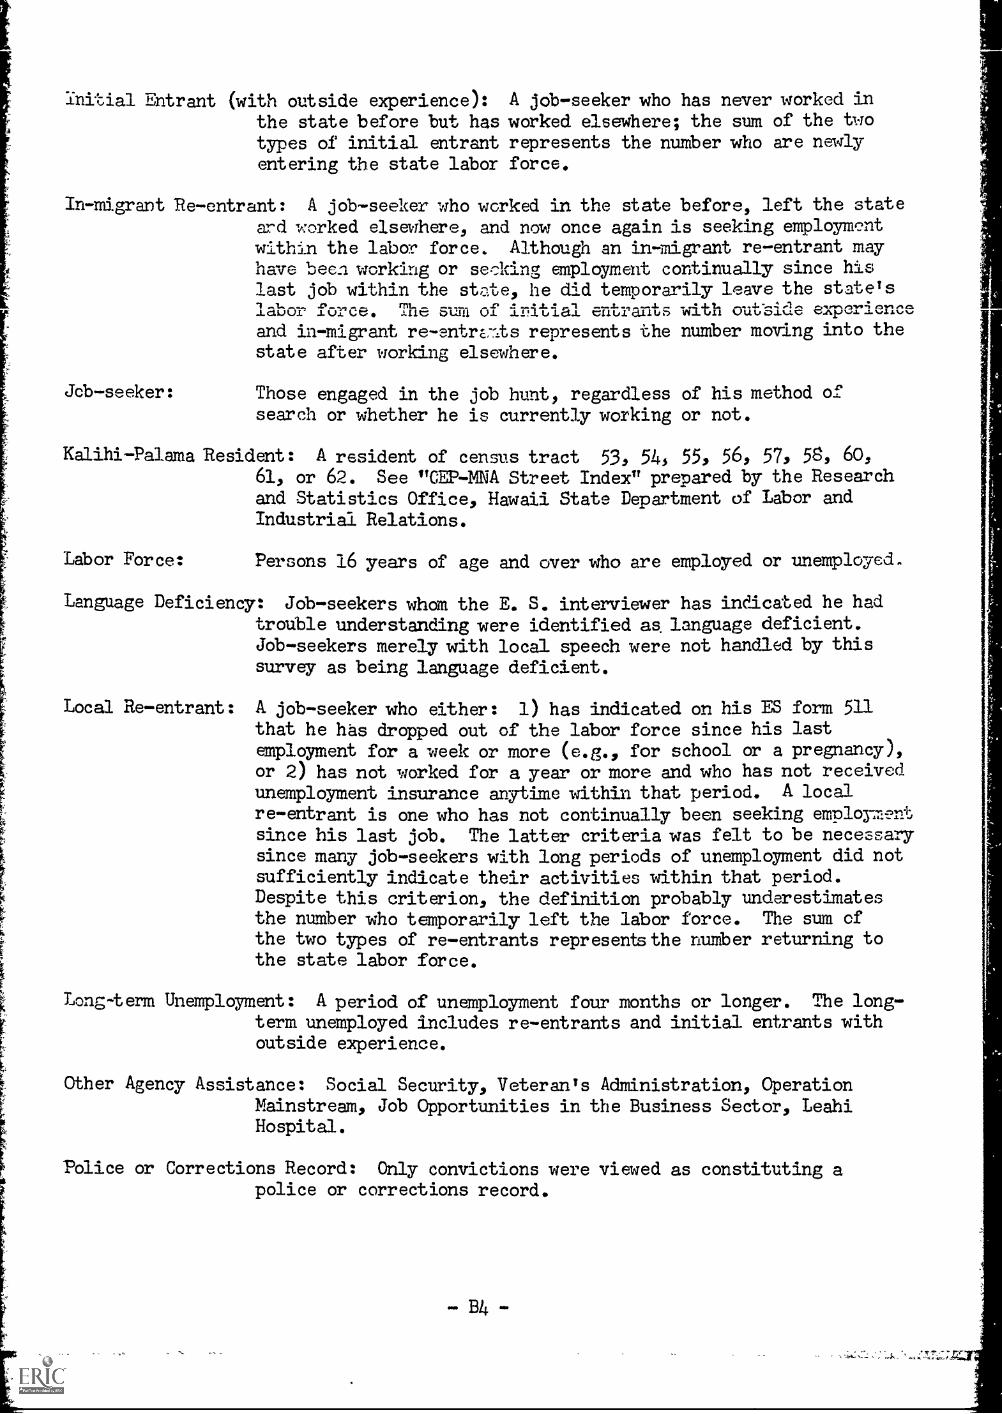
Initial Entrant (with outside experience): A job-seeker who has never worked inthe state before but has worked elsewhere, the sum of the twotypes of initial entrant represents the number mho are newlyentering the state labor force.
In-migrant Re-entrant: A job-seeker who worked in the state before, left the stateard uorked elsewhere, and now once again is seeking employmentwithin the labor force. Although an in-migrant re-entrant mayhave been working or seeking eplayment continually since hislast job within the state, he did temporarily leave the state'slabor force. The SUM of iritial entrants with out'side experienceand in-migrant re-entrE.-As represents the number moving into thestate after working elsewhere.
Jcb-seeker:
Kalihi-Palama
Those engaged in the job hunt, regardless of his method ofsearch or whether he is currently working or not.
Resident: A resident of census tract 53, 541 551 561 571 58, 60,61, or 62. See "CEP-MNA Street Index" prepared by the Researchand Statistics Office, Hawaii State Department of Ldbor andIndustrial Relations,
Labor Force: Persons 16 years of age and over uho are employed or unemployed.
Language Deficiency: Job-seekers whom the E. S. interviewer has indicated he hadtrouble understanding were identified as language deficient.Job-seekers merely with local speech were not handled by thissurvey as being language deficient.
Local Re-entrant: A job-seeker who either: 1) has indicated on his ES form 511that he has dropped out of the labor force since his lastemployment for a week or more (e.g., for school or a pregnancy),or 2) has not worked for a year or more and who has not receivedunemployment insurance anytime within that period. A local
re-entrant is one who has not continually been seeking employmentsince his last job. The latter criteria was felt to be necessarysince many jdb-seekers with long periods of unemployment did notsufficiently indicate their activities within that period.Despite this criterion, the definition probably underestimatesthe number uho temporarily left the ldbor force. The sum ofthe two types of re-entrants representsthe number returning tothe state labor force.
Long-term Unemployment: A period of unemployment four months or longer. The long-term unemployed includes re-entrants and initial entrants withoutside experience.
Other Agency Assistance: Social Security, Veteran's Administration, OperationMainstream, Job Opportunities in the Business Sector, LeahiHospital.
Police or Corrections Record: Only convictions were viewed as constituting apolice or corrections record.
-B4-
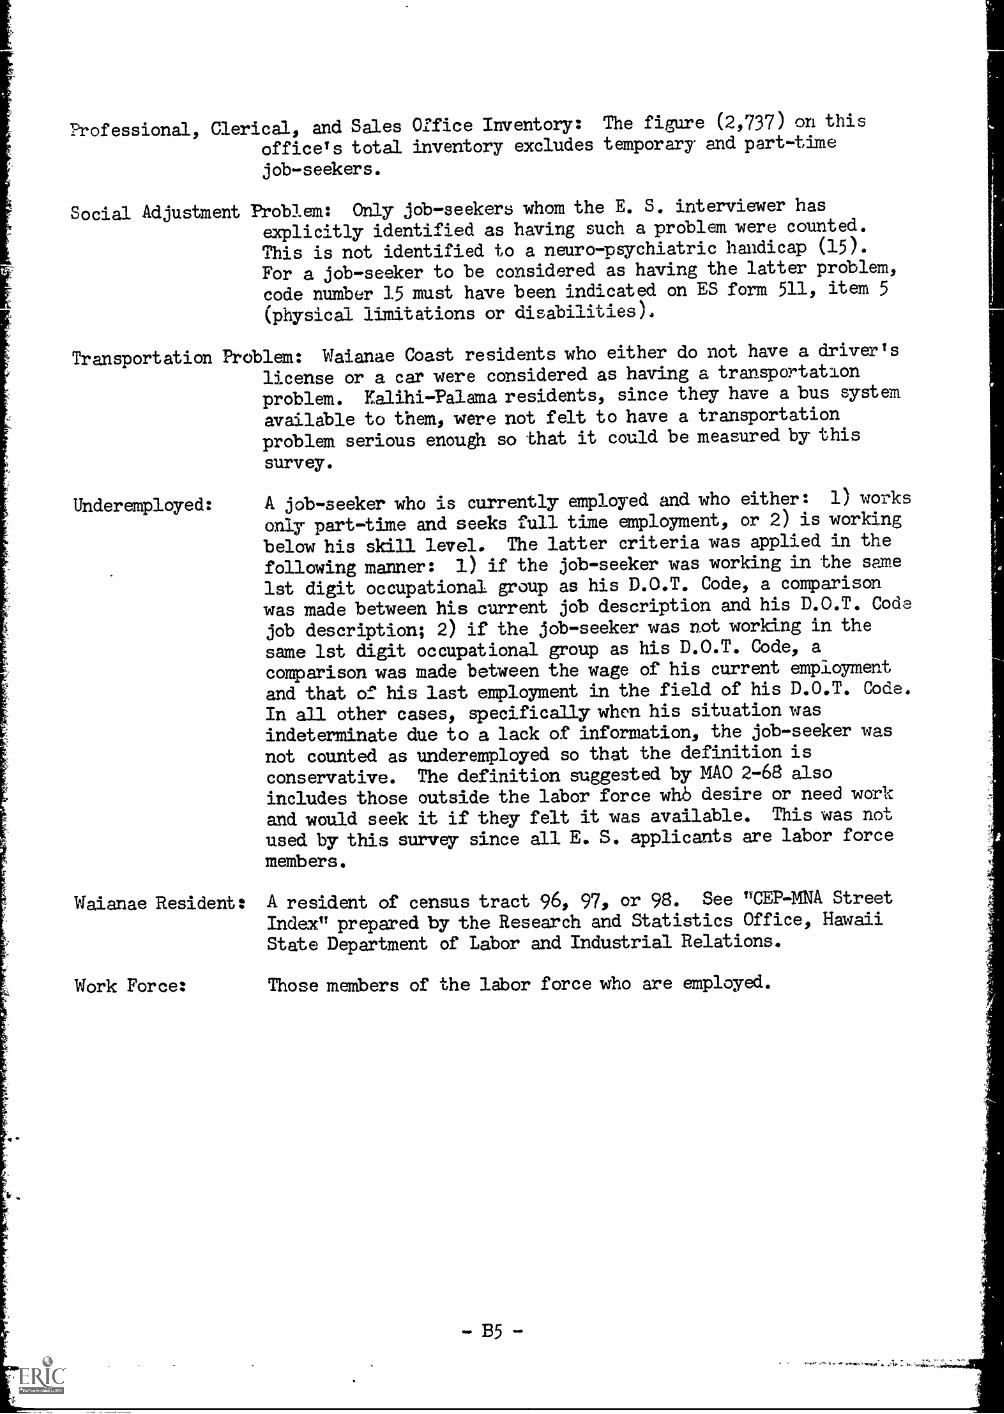
Professional, Clerical, and Sales Office Inventory: The figure (2,737) on this
officeTs total inventory excludes temporary and part-time
job-seekers.
Social Adjustment Problem: Only job-seekers whom the E. S. interviewer has
explicitly identified as having such a problem were counted.
This is not identified to a neuro-psychiatric handicap (15).
For a job-seeker to be considered as having the latter problem,
code nudber 15 must have been indicated on ES form 511, item 5
(physical limitatians or disabilities).
Transportation Problem: Waianae Coast residents who either do not have a driverTs
license or a car were considered as having a transportation
problem. Kalihi-Palama residents, since they have a bus system
available to them, were not felt to have a transportation
problem serious enough so that it could be measured by this
survey.
Underemployed: A job-seeker who is currently employed and who either: 1) works
only part-time and seeks full time employment, or 2) is working
below his skill level. The latter criteria was applied in the
following manner: 1) if the job-seeker was working in bhe same
1st digit occupational group as his D.O.T. Code, a comparison
was made between his current job description and his D.O.T. Code
job description; 2) if the job-seeker was not working in the
same 1st digit occupational group as his D.O.T. Code, a
comparison was made between the wage of his current employment
and that of his last employment in the field of his D.O.T. Code.
In all other cases, specifically when his situation wasindeterminate due to a lack of information, the job-seeker wasnot caanted as underemployed so that the definition is
conservative. The definition suggested by MAO 2-68 also
includes those autside the labor force whb desire or need wtrk
and would seek it if they felt it was available. This was not
used by this survey since all E. S. applicants are labor force
members.
Waianae Resident: A resident of census tract 96, 97, or 98. See "CEP-MNA Street
Index" prepared by the Research and Statistics Office, Hawaii
State Department of Labor and Industrial Relations.
Work Force: Those members of the labor fcrce who are employed.
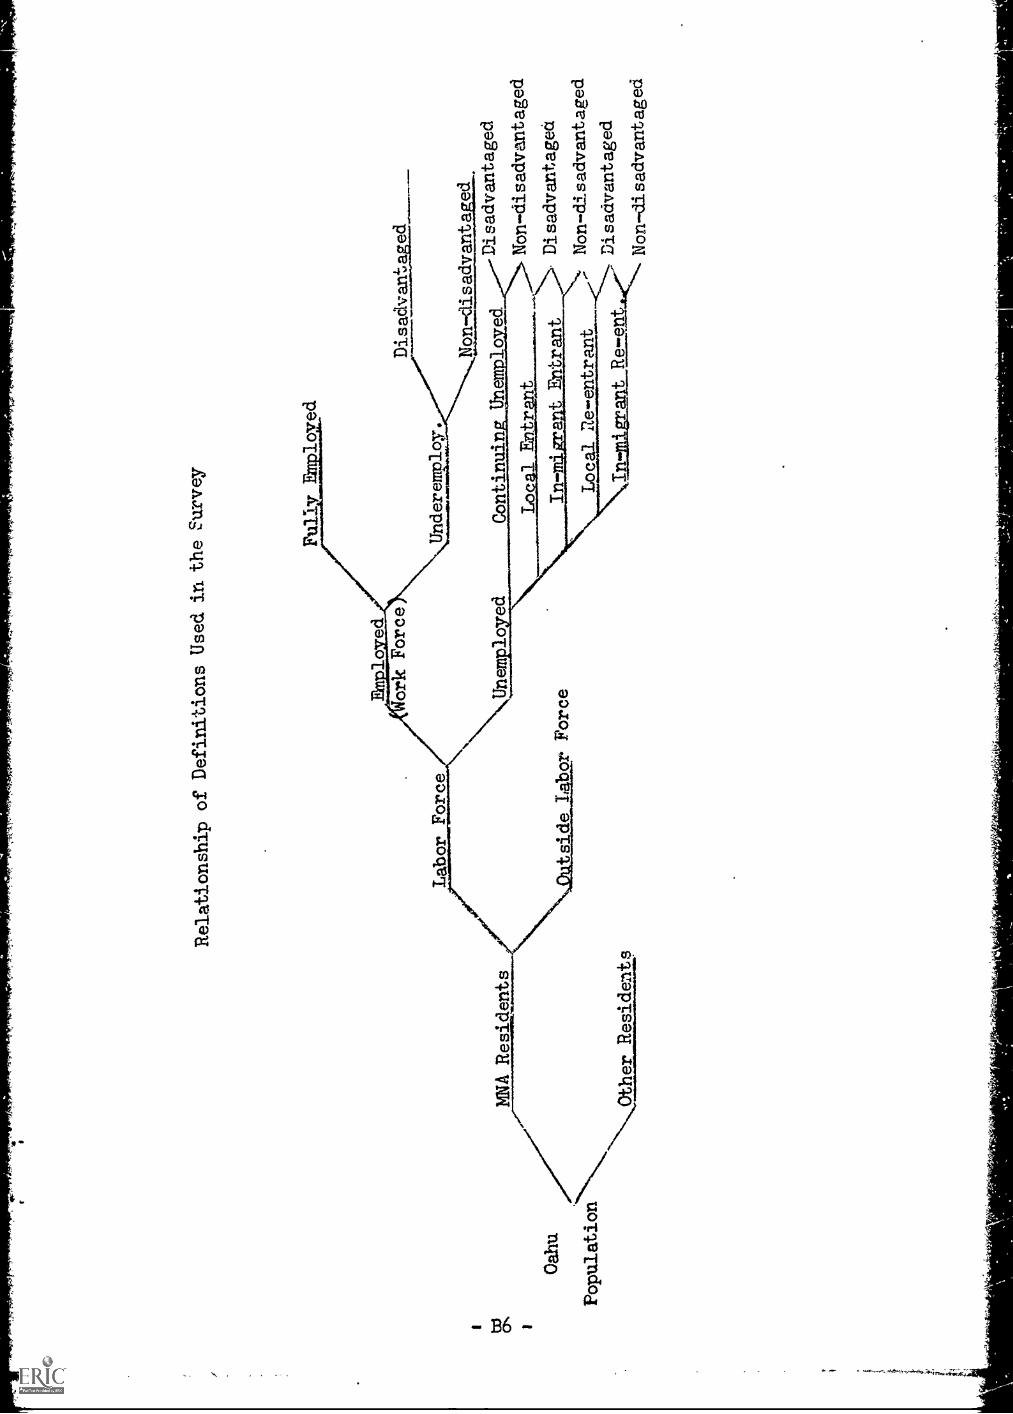
Oahu
Population
Cither Residents
MNA Residents
Relationship of Definitions
Used in the Survey
Eth 1
ed
ork Force
Fully
lo ed
Labor Force
Underemploy.
Unem lo ed
Disadyat;a04
Non-disadvantaged
Continuin
pomployell
Loc
pIFt
rit
In-
a t Entrant
\LWIsilig.14.122r Force
Local Re-entrant
In-migrant Re-ept
Disadvantaged
Non-disadvantaged
Disadvantagea
Non-disadvantaged
Disadvantaged
Non-disadvantaged
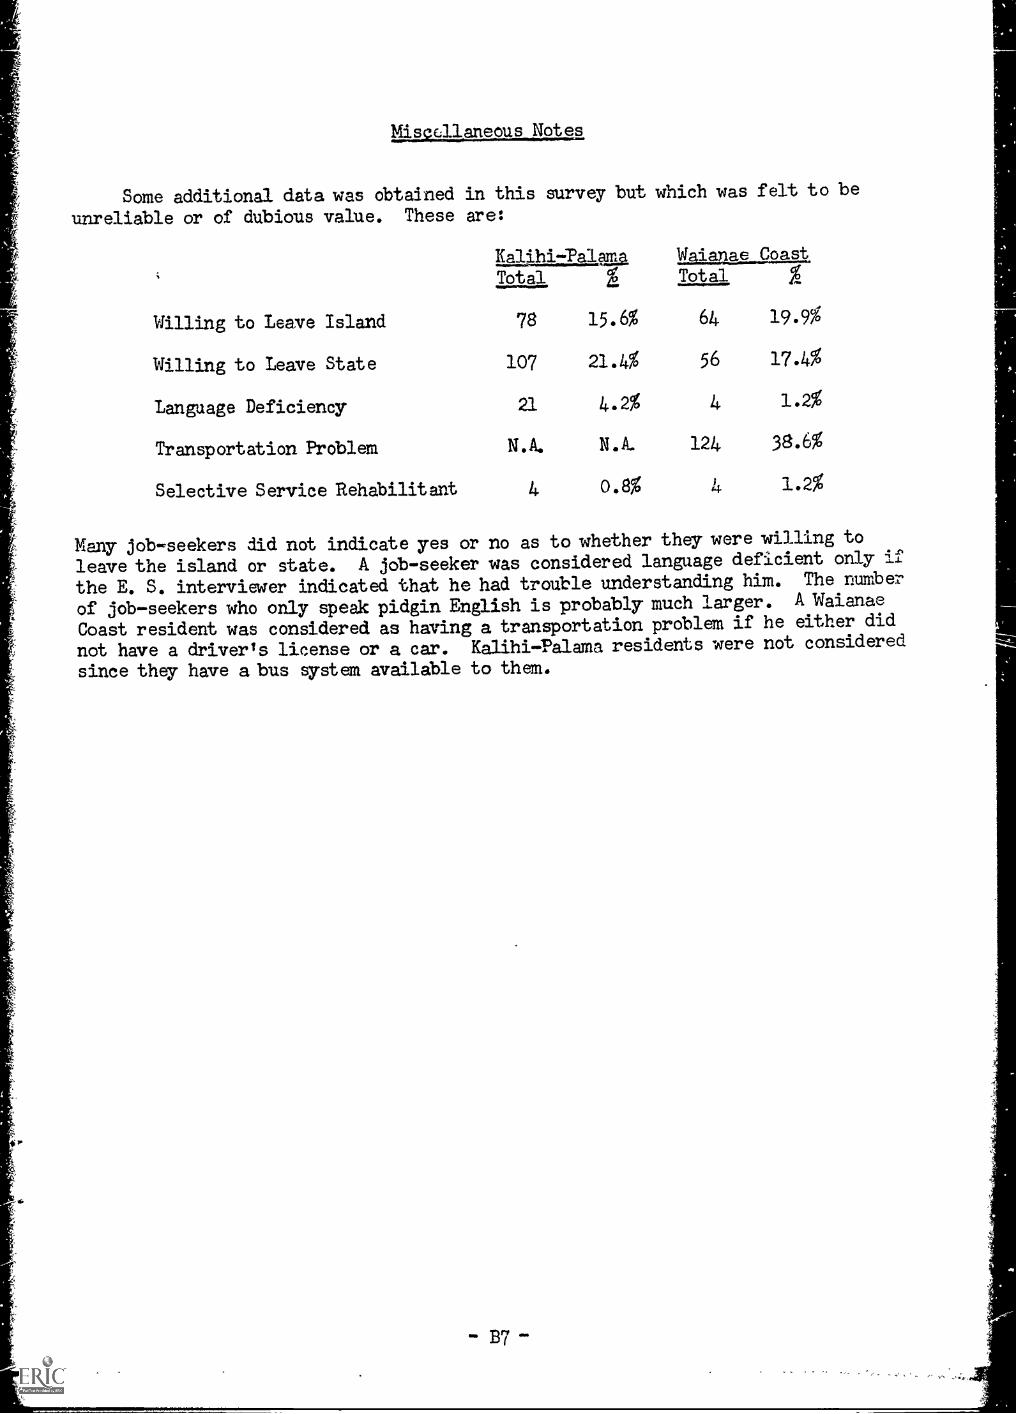
NiEgalmmulelm
Same additional data was obtained in this survey but which was felt to be
unreliable or of dubious value. These are:
Kalihi-Palajna walanat_gaat.Total g
Willing to Leave Island 78 15.6%
Willing to Leave State 107 21.4%
Language Deficiency 21 4.2%
Transportation Problem N.A. N.A. 124 38.6%
Selective Service Rehabilitant 4 0.8% 4 1.2%
Total %.
64 19.9%
56 17.4%
4 1.2%
Many job-seekers did not indicate yes or no as to whether they were willing to
leave the island or state. A job-seeker was considered language deficient only if
the E. S. interviewer indicated that he had trouble understanding him. The number
of job-seekers who only speak pidgin English is probably- much larger. A Waianae
Coast resident was considered as having a transportation problem if he either did
not have a driverts license or a car. Kalihi-Palmna residents were not considered
since they have alms system available to them.
-Br
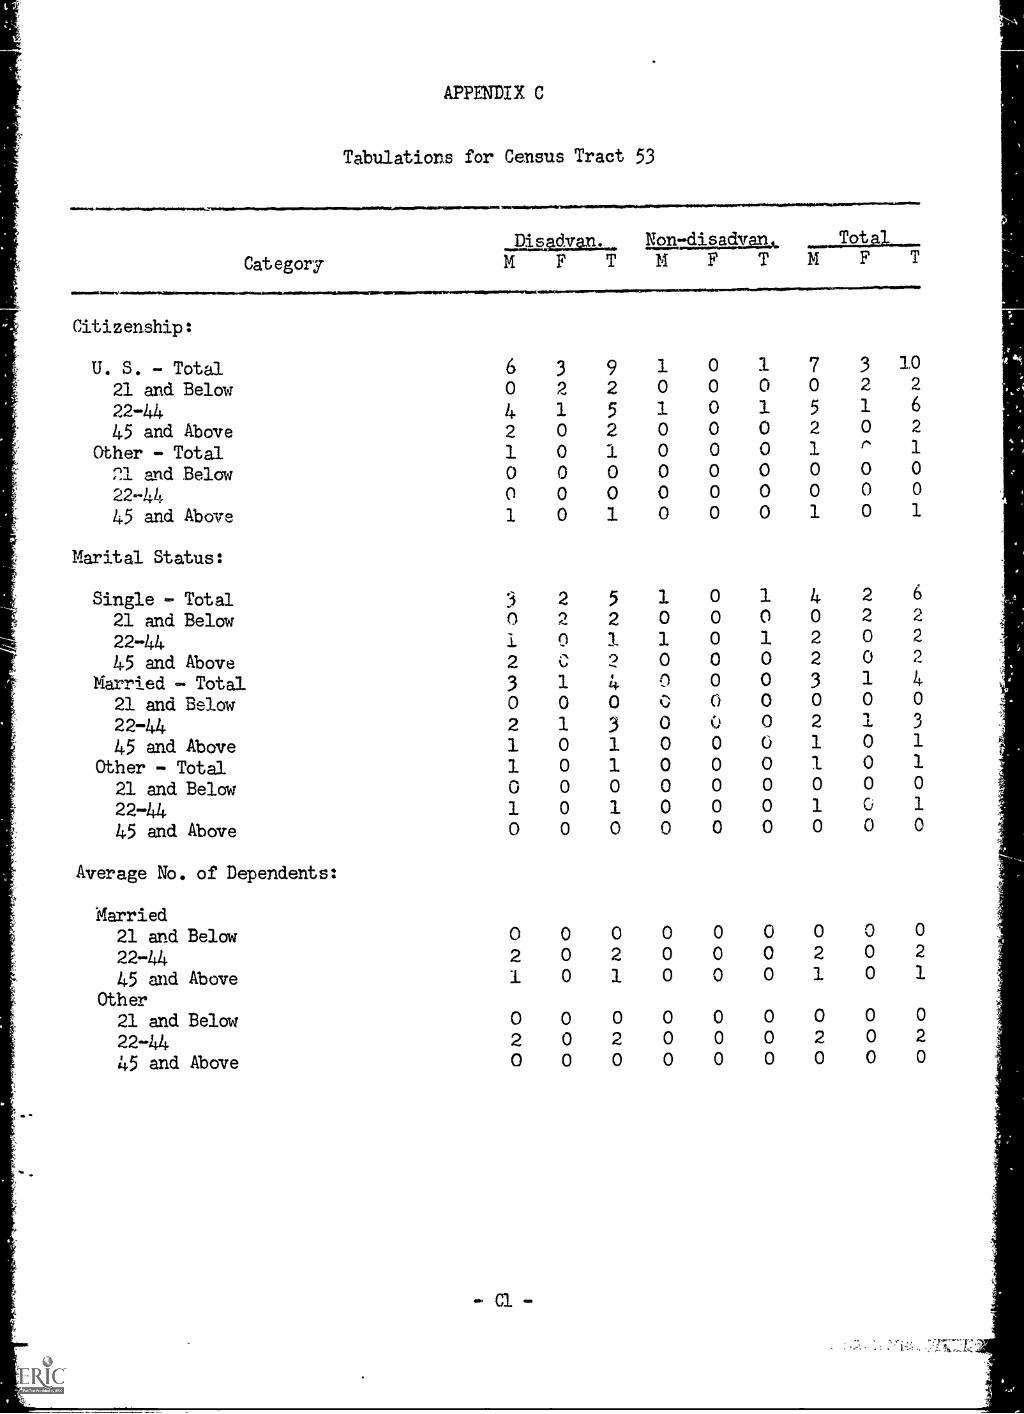
APPENDIX C
Tabulatiors for Census Tract 53
Category
Kon-Ais_asim.MF T 14F TTotal
M F T
Citizenship:
U. S. - Total21 and Below22-4445 and Above
Other - Total21 and Below22-44
45 and Above
Marital Status:
6 3 90 2 2
4 1 5
9 0 2
1 0 1
o 0 00 0 01 0 1
Single - Total 3 2 5
0 121 and Below 2 2
22-44 1
45 and Above 2Married - Total 3
21 and Below22-4445 and Above
Other - Total21 and Below22-44
45 and Above
Average No. of Dependents:
Married21 and Below22-44
45 and AboveOther21 and Below22-4445 and Above
Win
0211010
021
O
20
Cl
C .)
1 40 01 30 10 10 0
0 10 0
0 0
0 2
0 1
0 0
0 2
0 0
1 0 1
0 0 0
1 0 10 0 00 0 00 0 00 0 00 0 0
1 0 10 0 0
1 0 10 0 0
0 0 00 0 0
0 0 90 0 00 0 00 0 0
0 0 0
0 0 0
0 0 0
0 0 0
0 0 0
0 0 0
0 0 0
0 0 0
7 3 10
0 2 2
5 1 6
2 0 2
1 1
0 0 0
0 0 0
1 0 1
4 2 6
2 0 2
0 2 2
2 0 2
3 1 4
0 0 02 1 3
1 0 11 0 10 0 01 0 10 0 0
0 0 02 0 21 0 1
0 0 02 0 20 0 0
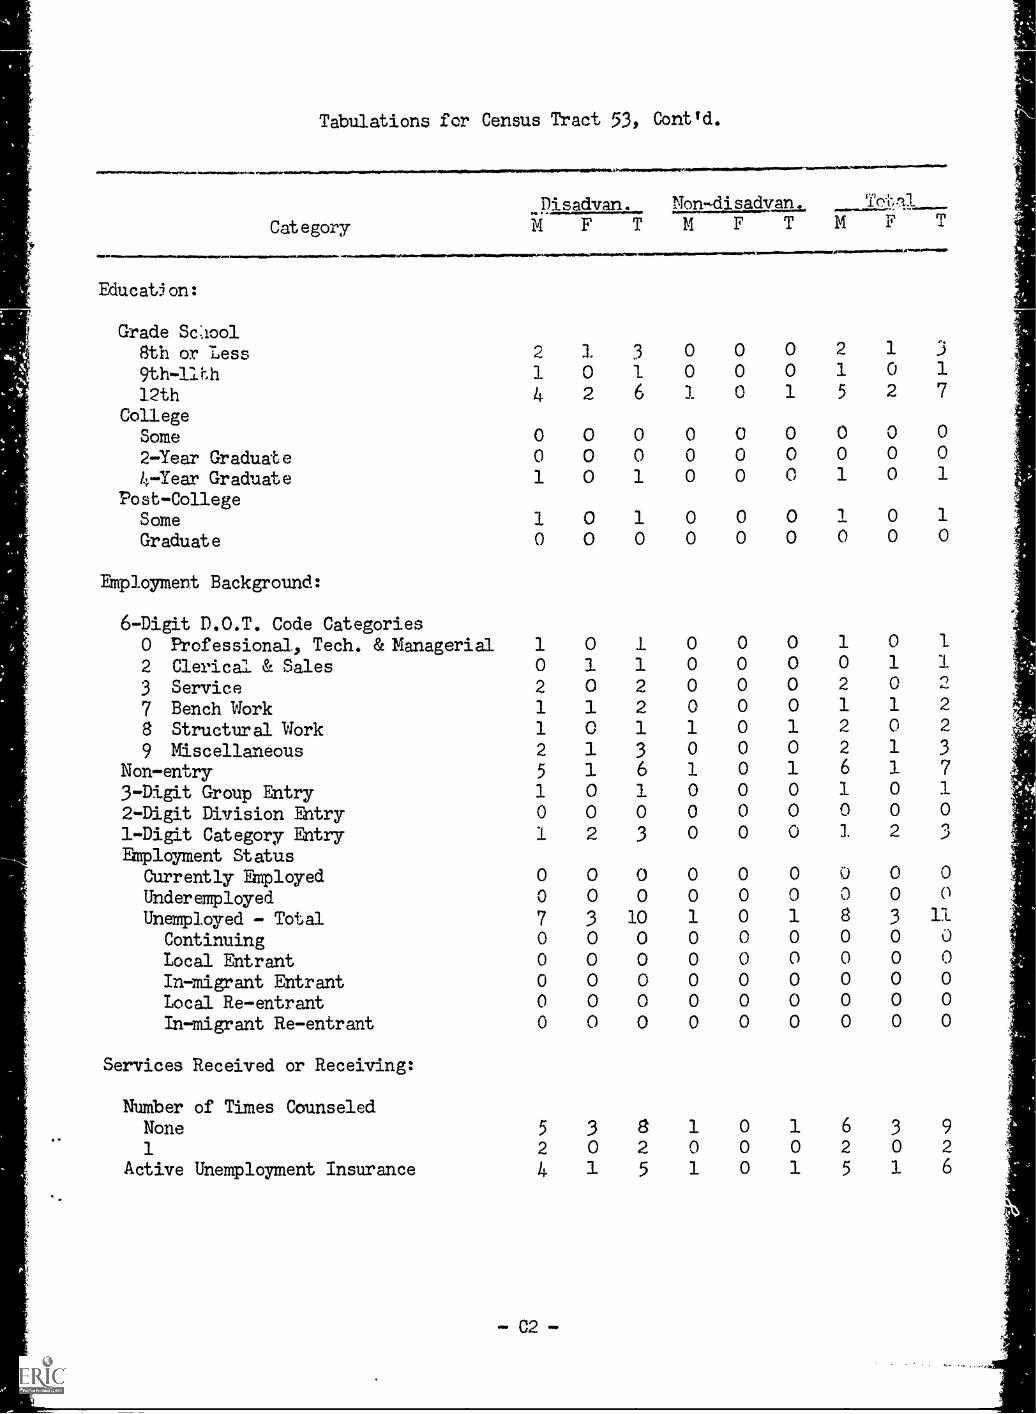
Tabulations for Census Tract 53, Cont'd.
Category
Disadvan. Non-disadvm,. To'c,f11
F T M F T
71...INV.1.,10111111.0.104101....Ill......
Educatjon:
Grade Sc:Aool
8th or Less 2 1 3 0 0 0 2 1 3
1 0 1 0 0 0 1 0 1
12th 4 2 6 1 0 1 5 2 7
CollegeSome 0 0 0 0 0 0 0 0 0
2-Year Graduate 0 0 0 0 0 0 0 0 0
4-Year Graduate 1 0 1 0 0 0 1 0 1
Post-CollegeSome 1 0 1 0 0 0 1 0 1
Graduate 0 0 0 0 0 0 0 0
Employment Background:
6-Digit D.O.T. Code Categories0 Professional, Tech. &Managerial 1 0 i 0 0 0 1 0 1
2 Clerical & Sales 0 1 1 0 0 0 0 1 1
3 Service 2 0 2 0 0 0 2 0 n
7 Bench Work 1 1 2 0 0 0 1 1 2
8 Structural Work 1 0 1 1 0 1 2 0 2
9 Miscellaneous 2 1 3 0 0 0 2 1 3
Non-entry 5 1 6 1 0 1 6 1 7
3-Digit Group Entry 1 0 1 0 0 0 1 0 1
2-Digit Division Entry 0 0 0 0 0 0 0 0 0
1-Digit Category Entry 1 2 3 0 0 0 1 2 3
EMployment StatusCurrently Employed 0 0 0 0 0 0 0 0 0
Underemployed 0 0 0 0 0 0 0 0 0
Unemployed - Total 7 3 10 1 0 1 8 3 11
Continuing 0 0 0 0 0 0 0 0 0
Local Entrant 0 0 0 0 0 0 0 0 0
In-migrant Entrant 0 0 0 0 0 0 0 0 0
Local Re-entrant 0 0 0 0 0 0 0 0 0
In-migrant Re-entrant 0 0 0 0 0 0 0 0 0
Services Received or Receiving:
NuMber of Times CounseledNone 5 3 8 1 0 1 6 3 9
1 2 0 2 0 0 0 2 0 2
Active Unemployment Insurance 4 1 5 1 0 1 5 1 6
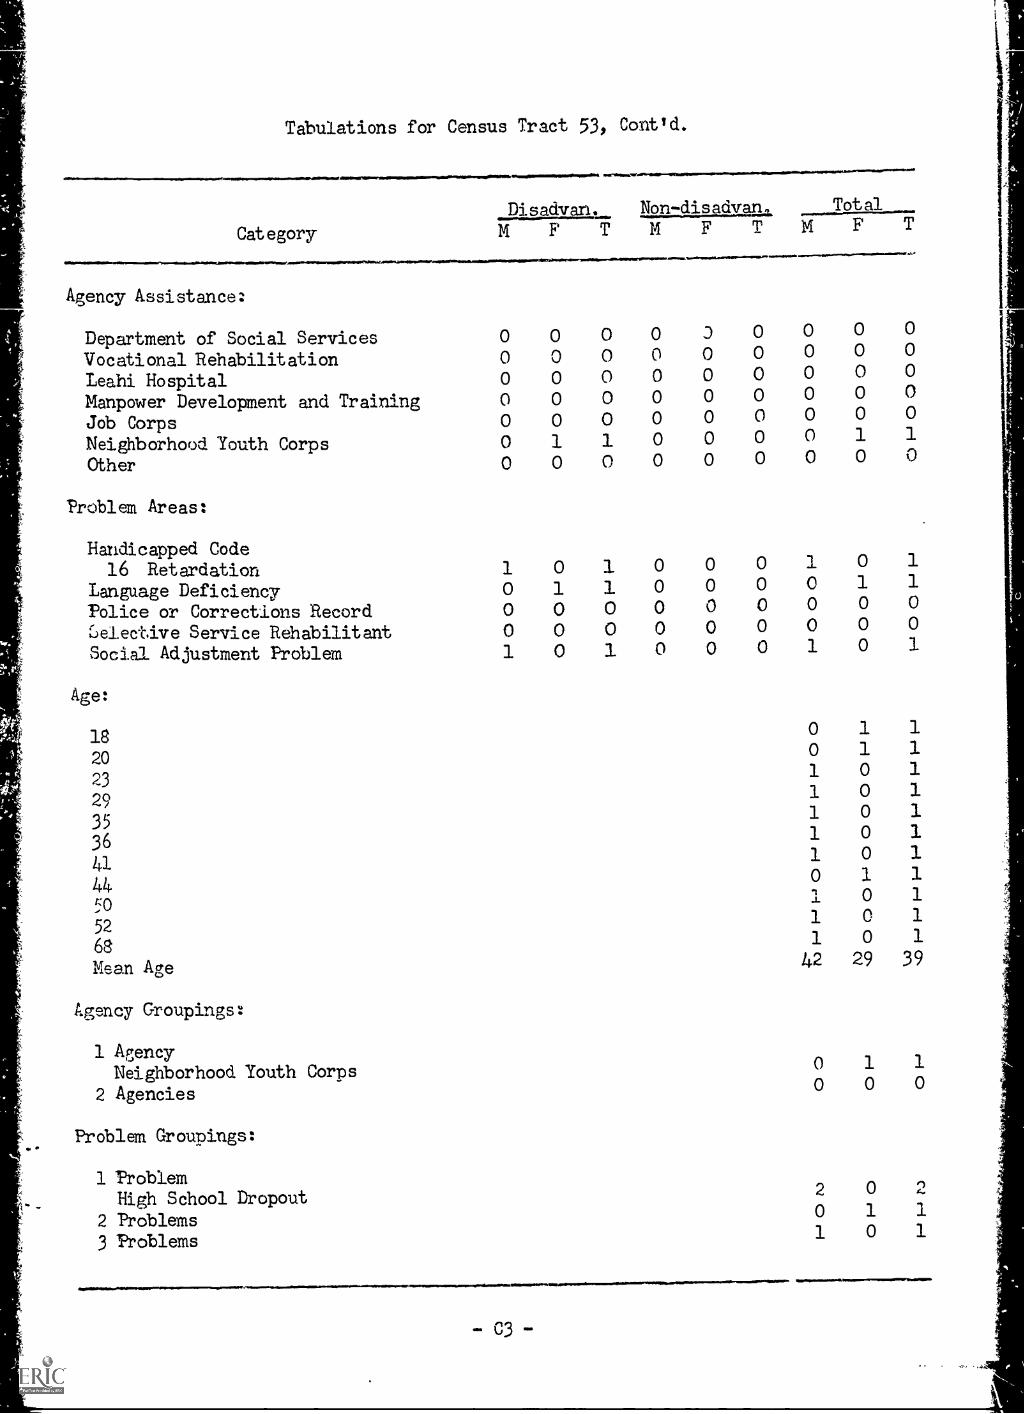
Tabulations for Census Tract 53, Contld.
Category
Disadvant.MFTMFTMFT...=lraM~P.J.laen..Mr
Agency Assistance:
Department of Social Services 0 0 0 0 3 0 0 0 0
Vocational Rehabilitation 0 0 0 0 0 0 0 0 0
Ieahi Hospital 0 0 0 0 0 0 0 0 0
Manpower Development and Training 0 0 0 0 0 0 0 0 0
Job Corps 0 0 0 0 0 0 0 0 0
Neighborhood Youth Corps 0 1 1 0 0 0 0 1 1
Cther 0 0 0 0 0 0 0 0 0
Problem Areas:
Handicapped Code16 Retardation 1 0 1 0 0 0 1 0 1
Language Deficiency 0 1 1 0 0 0 0 1 1
Police or Corrections Record 0 0 0 0 0 0 0 0 0
Lelect,ive Service Rehabilitant 0 0 0 0 0 0 0 0 0
Social Adjustment Problem 1 0 1 0 0 0 1 0 1
Age:
18 0 1 1
200 1 1
231 0 1
291 0 1
351 0 1
361 0 1
411 0 1
440 1 1
500 1
521 0 1
681 0 1
Mean Age 42 29 39
Agency Groupings:
1 AgencyNeighborhood Youth Corps
0 1 1
2 Agencies0 0 0
Pr oblem Groupings:
1 ProblemHigh School Dropout
2 0
2 Problams0 1 1
3 Problems1 0 1
=sm. w,..w....NTINwwww.M..-C3-
11.0.11111.111
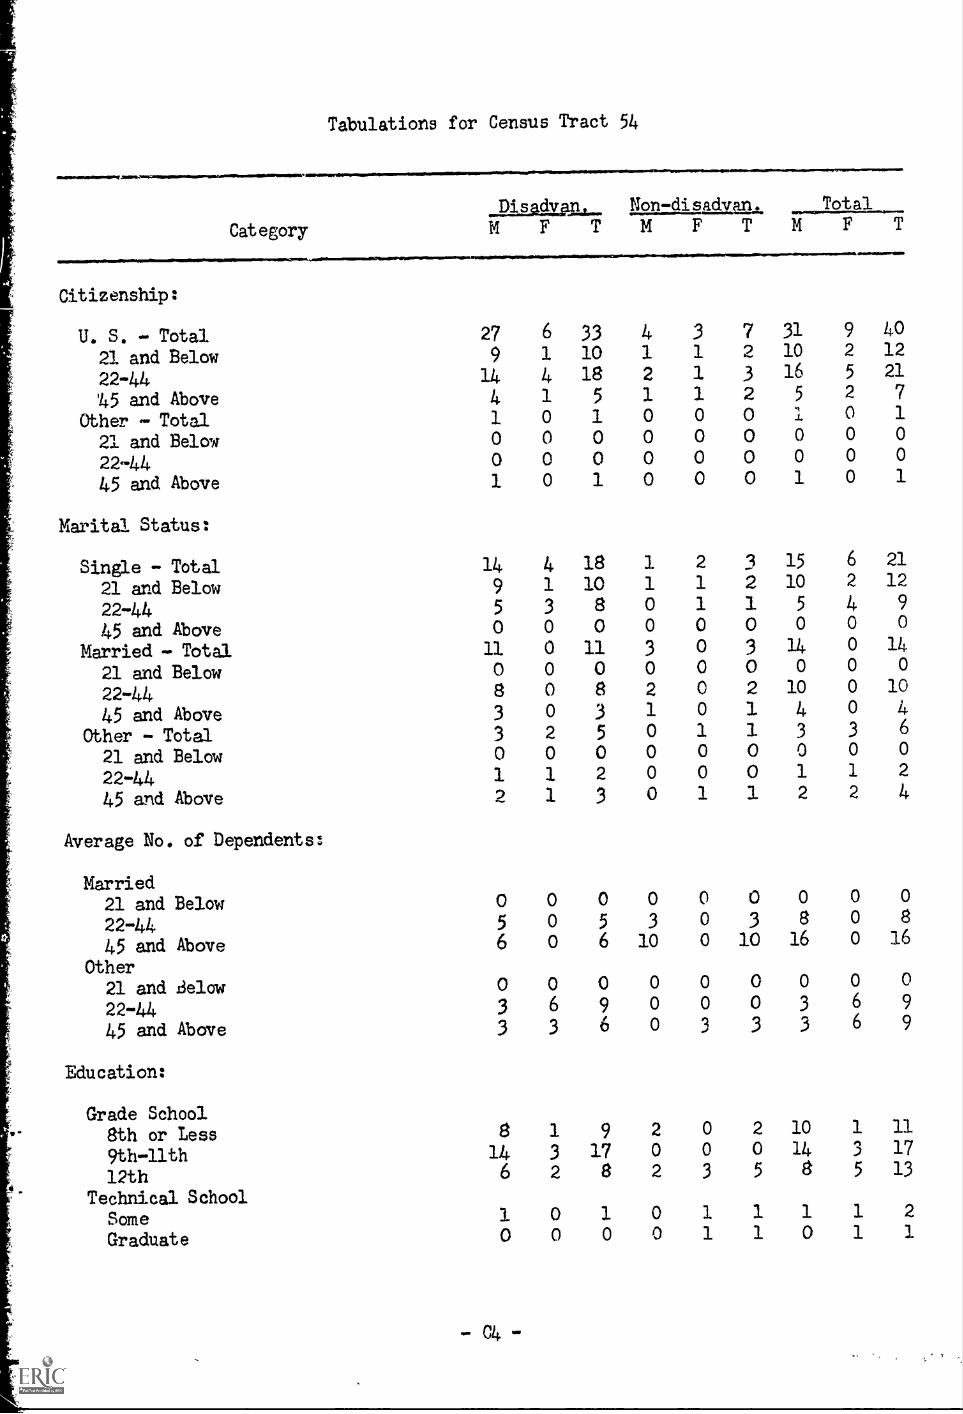
Tabulations for Census Tract 54
......rolmailrry
_pisadma,_ Non-disadvan. Total
Category MFTMFTMFTCitizenship:
U. S. - Total 27
21 and Below 9
22-44 14
45 and Above 4
Other - Total 1
21 and Below 0
22-44 0
45 and Above 1
Marital Status:
Single - Total 14
21 and Below 9
22-44 5
45 and Above 0
Married - Total 11
21 and Below 0
22-44 8
45 and Above 3
Other - Total 3
21 and Below 0
22-44 1
45 and Above 2
Average No. of Dependents:
Married21 and Below 0
22-44 5
45 and Above 6
Other21 and ,3elow 0
22-44 3
45 and Above 3
Education:
6 33 4 3 7 31 9 40
1 10 1 1 2 10 2 12
4 18 2 1 3 16 5 21
1 5 1 1 2 5 2 7
0 1 0 0 0 1 0 1
0 0 0 0 0 0 0 0
0 0 0 0 0 0 0 0
0 1 0 0 0 1 0 1
4 18 1
1 10 1
3 8 0
0 0 0
0 11 3
0 0 0
0 8 2
0 3 1
2 5 0
0 0 0
1 2 0
1 3 0
0 0 0
0 5 3
0 6 10
0 0 0
6 9 0
3 6 0
Grade School8th or Less 8 1 9 2
9th-llth 14 3 17 0
12th 6 2 8 2
Technical SchoolSome 1 0 1 0
Graduate 0 0 0 0
- 04 -
2 1 15 6 21
1 2 10 2 12
1 1 5 4 9
0 0 0 0 0
0 3 14 0 14
0 0 0 0 0
0 2 10 0 10
0 1 4 0 4
1 1 3 3 6
0 0 0 0 0
0 0 1 1 2
1 1 2 2 4
0 0 0 0 0
0 3 8 0 8
0 10 16 0 16
0 0 0 0 0
0 0 3 6 9
3 3 3 6 9
0 2 10 1 11
0 0 14 3 173 5 8 5 13
1 1 1 1 2
1 1 0 1 1
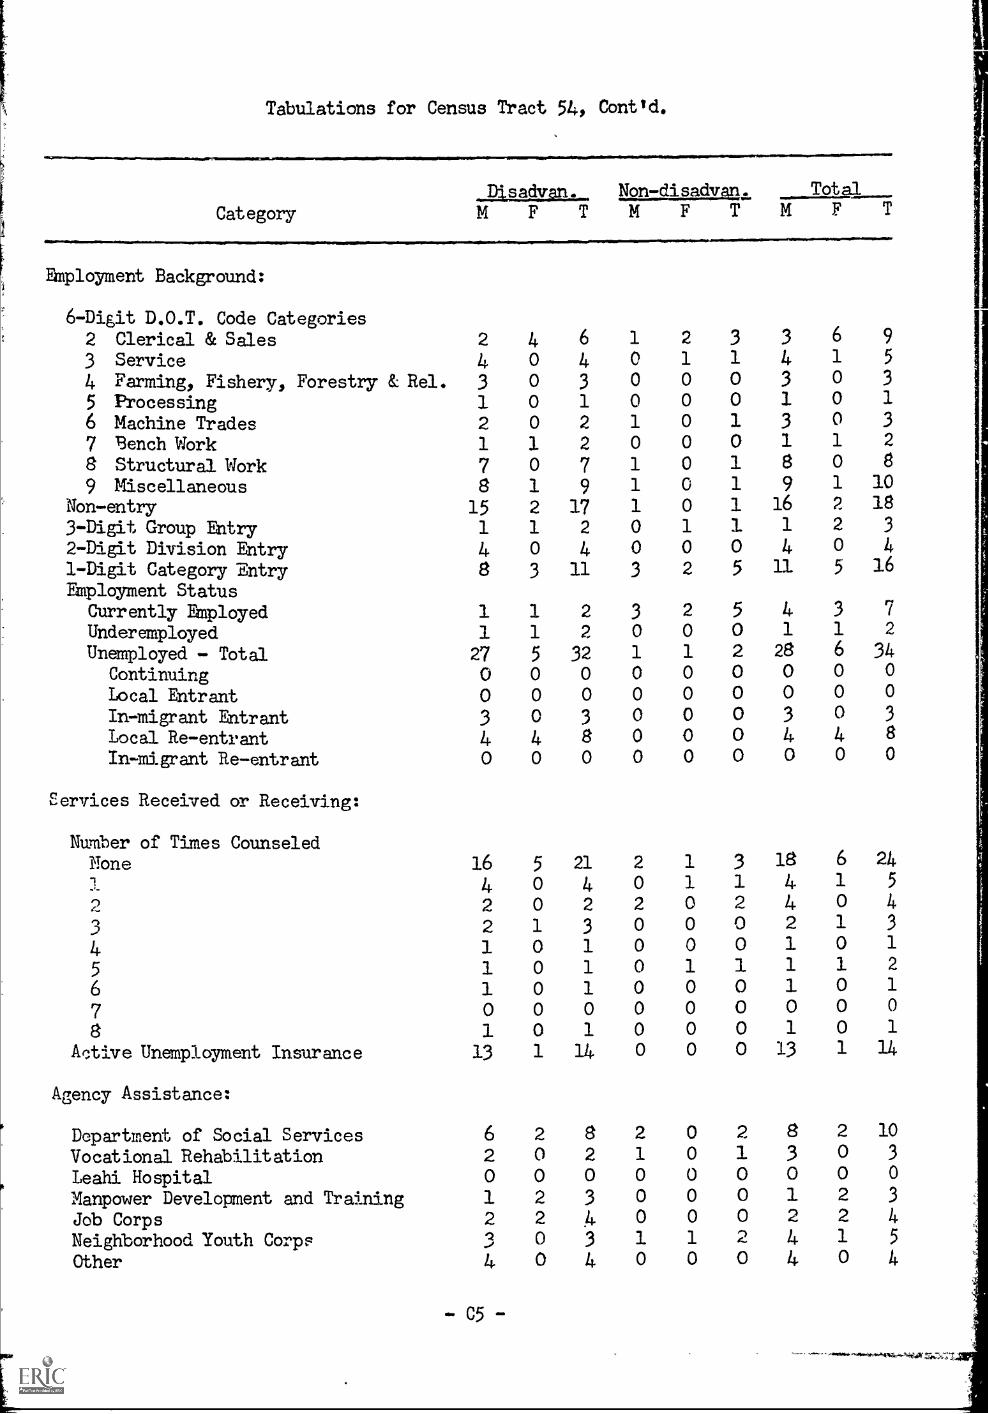
Tabulations for Census Tract 54, Cont'd.
Category
-111.Wwwr
_Pisadvan. Non-disadvan. TotalMFTMFTMFTVINO.1111MI.
Employment Background:
6-Digit D.O.T. Code Categories2 Clerical & Sales 2 4 6 1 2 3 33 Service 4 0 4 0 1 1 4
4 Farming, Fishery, Forestry & Rel.5 Processing
31010001010 3 0 0 0 3
6 Machine Trades 2 0 2 1 0 1 3
7 Bench Work 1 1 2 0 0 0 1
8 Structural Work 7 0 7 1 0 1 8
9 Miscellaneous 8 1 9 1 0 1 9
Non-entry 15 2 17 1 0 1 16
3-Digit Group Entry 1 1 2 0 1 1 1
2-Digit Division Entry 4 0 4 0 0 0 4
1-Digit Category "Entry 8 3 11 3 2 5 11
'Employment Status
Currently Employed 1 1 2 3 2 5 4Underemployed 1 1 2 0 0 0 1
Unemployed - Total 27 5 32 1 1 2 28
Continuing 0 0 0 0 0 0 0
Local Entrant 0 0 0 0 0 0 0
In-migrant Entrant 3 0 3 0 0 0 3
Local Re-entrant 4 4 8 0 0 0 ii.
In-migrant Re-entrant 0 0 0 0 0 0 0
Services Received or Receiving:
Number of Times CounseledHone 16 5 21 2 1 3 181- 4 0 4 0 1 1 42 2 0 2 2 0 2 4
3 2 1 3 0 0 0 2
4 1 0 1 0 0 0 1
5 1 0 1 0 1 1 1
6 1 0 1 0 0 0 1
7 0 0 0 0 0 0 0
8 1 0 1 0 0 0 1
ArAive Unemployment Insurance 13 1 14 0 0 0 13
Agency Assistance:
Department of Social ServicesVocational RehabilitationLeahi HospitalManpower Development and TrainingJob CorpsNeighborhood Youth CorpsOther
62012-2.,
4
2002
20
0
8203
.4
3
4
21
0
0010
00
0
00
1
0
21000,_-)
0
83
01244
-05-
6 9
1 5
0 3
0 3
1 2
0 8
1 102 182 3
0 45 16
3 7
1 2
6 340 0
0 0
0 3
4 8
0 0
6 24
1 5
0 41 3
0 1
1 2
0 1
0 0
0 1
1 14
2 10
0 3
0 0
2 3
2 4
1 5
0 4
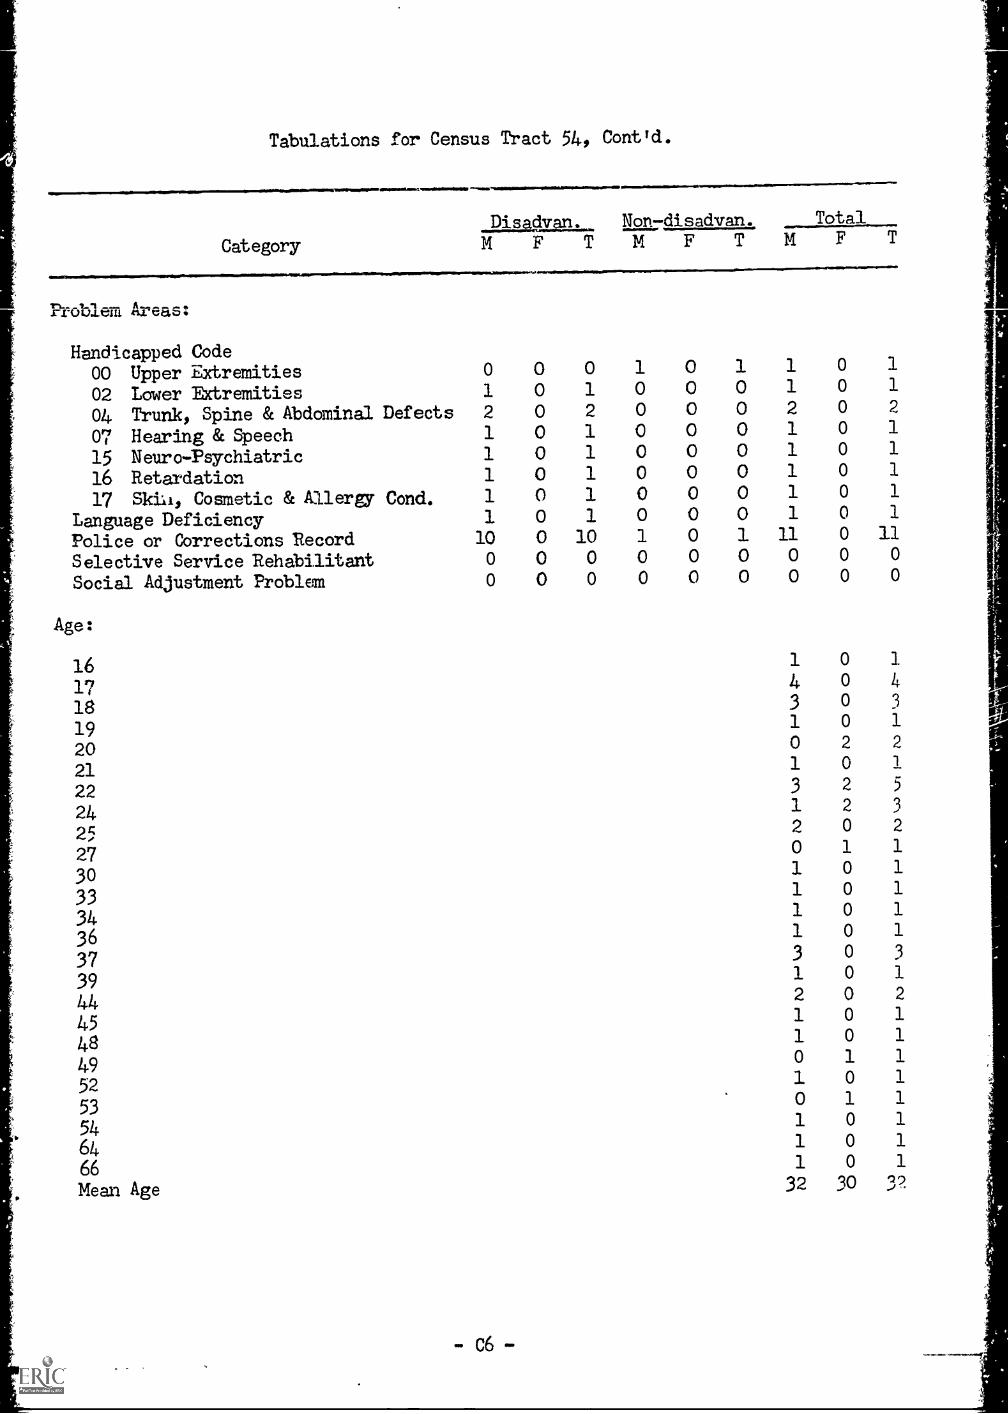
Tabulations far Census Tract 54, Contld.
0.011.011...1.
_pwayan,_ Non-disadvan. Total
Category MFTMFTMFTrrouimu
Handicapped Code00 Upper Extremities 0 0 0 1 0 1 1
02 Lower lbctremities 1 0 1 0 0 0 1
04 Trunk, Spine & Abdominal Defects 2 0 2 0 0 0 2
07 Hearing & Speech 1 0 1 0 0 0 1
15 Neuro-Psychiatric 1 0 1 0 0 0 1
16 Retardation 1 0 1 0 0 0 1
17 Skili, Cosmetic & Allergy Cond. 1 0 1 0 0 0 1
Language Deficiency 1 0 1 0 0 0 1
Police or Corrections Record 10 0 10 1 0 1 11
Selective Service Rehabilitant 0 0 0 0 0 0 0
Social Adjustment Problem 0 0 0 0 0 0 0
Age:
0 1
0 1
0 2
0 1
0 1
0 1
0 1
0 1
0 110 0
0 0
16 1 0 1
17 4 0 4
18 3 0 3
19 1 o 1
20 0 2 2
21 1 0 1
22 3 2 5
24 1 2 3
25 2 0 2
27 0 1 1
30 1 0 1
331 0 1
34 1 0 1
36 1 0 1
373 0 3
391 0 1
44 2 0 2
451 0 1
48 1 0 1
490 1 1
52 1 0 1
530 1 1
541 0 1
64 1 0 1
66 1 0 1
Mean Age 32 30 32
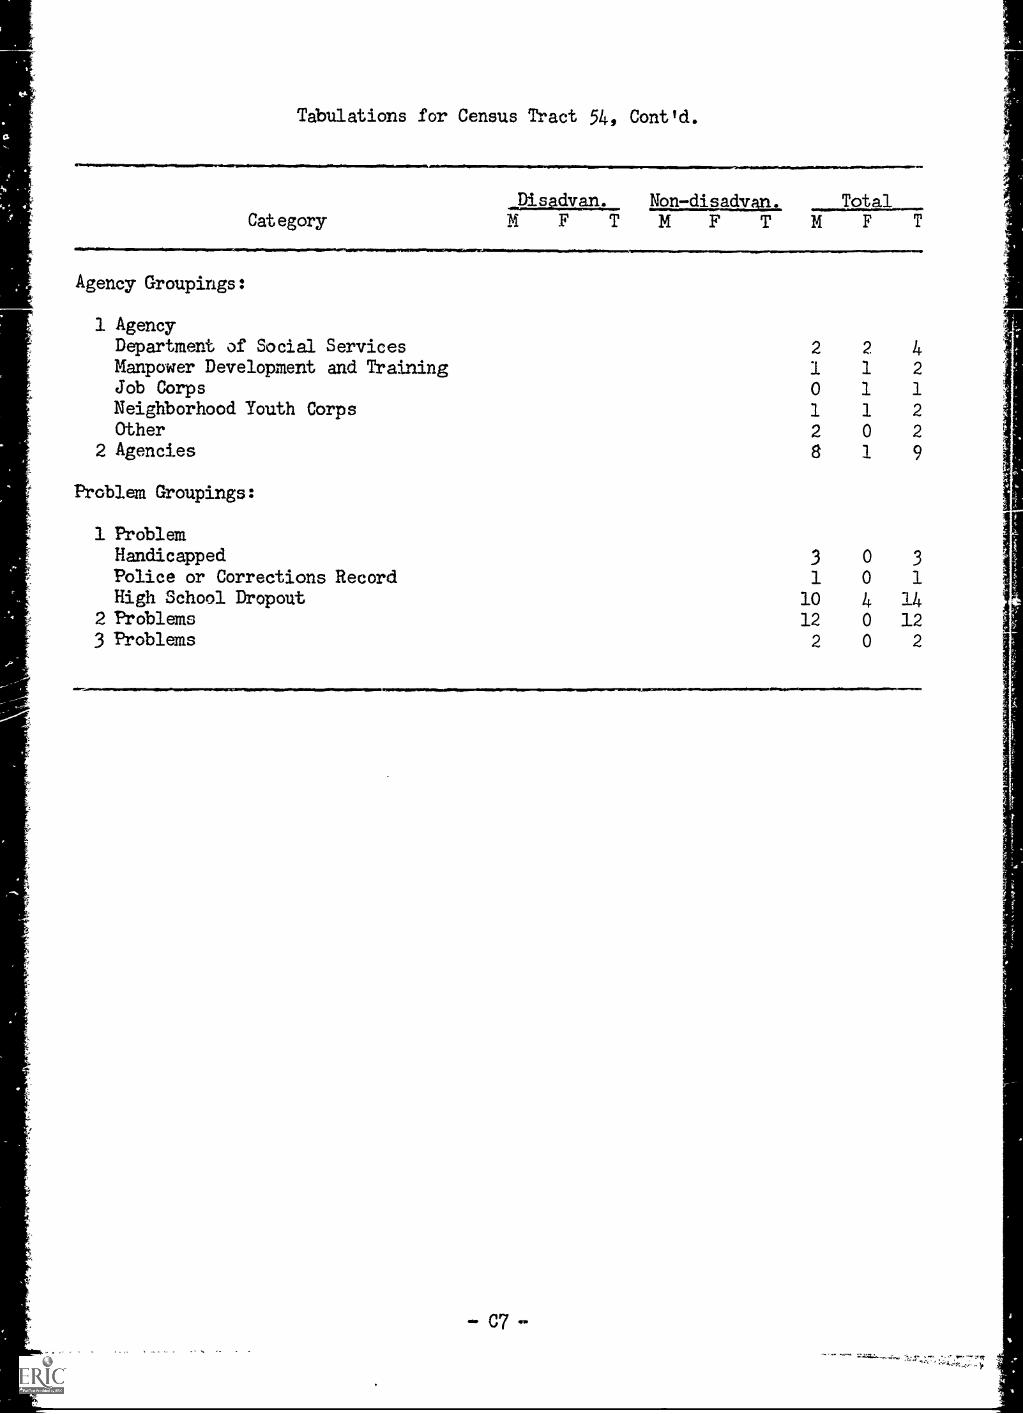
Tabulations for Census Tract 54, Cont'd.
CategoryNondisadvan. TotalMFTMFTMFT
Agency Groupings:
1 AgencyDepartmint of Social Services 2 2 4Manpower Development and Training 1 1 2
Job Corps 0 1 1
Neighborhood Youth Corps 1 1 2Other 2 0 2
2 Agencies 8 1 9
Problem Groupings:
1 ProblemHandicapped 3 0 3
Police or Corrections Record 1 0 1High School Dropout 10 4 14
2 Problems 12 0 123 Problems 2 0 2
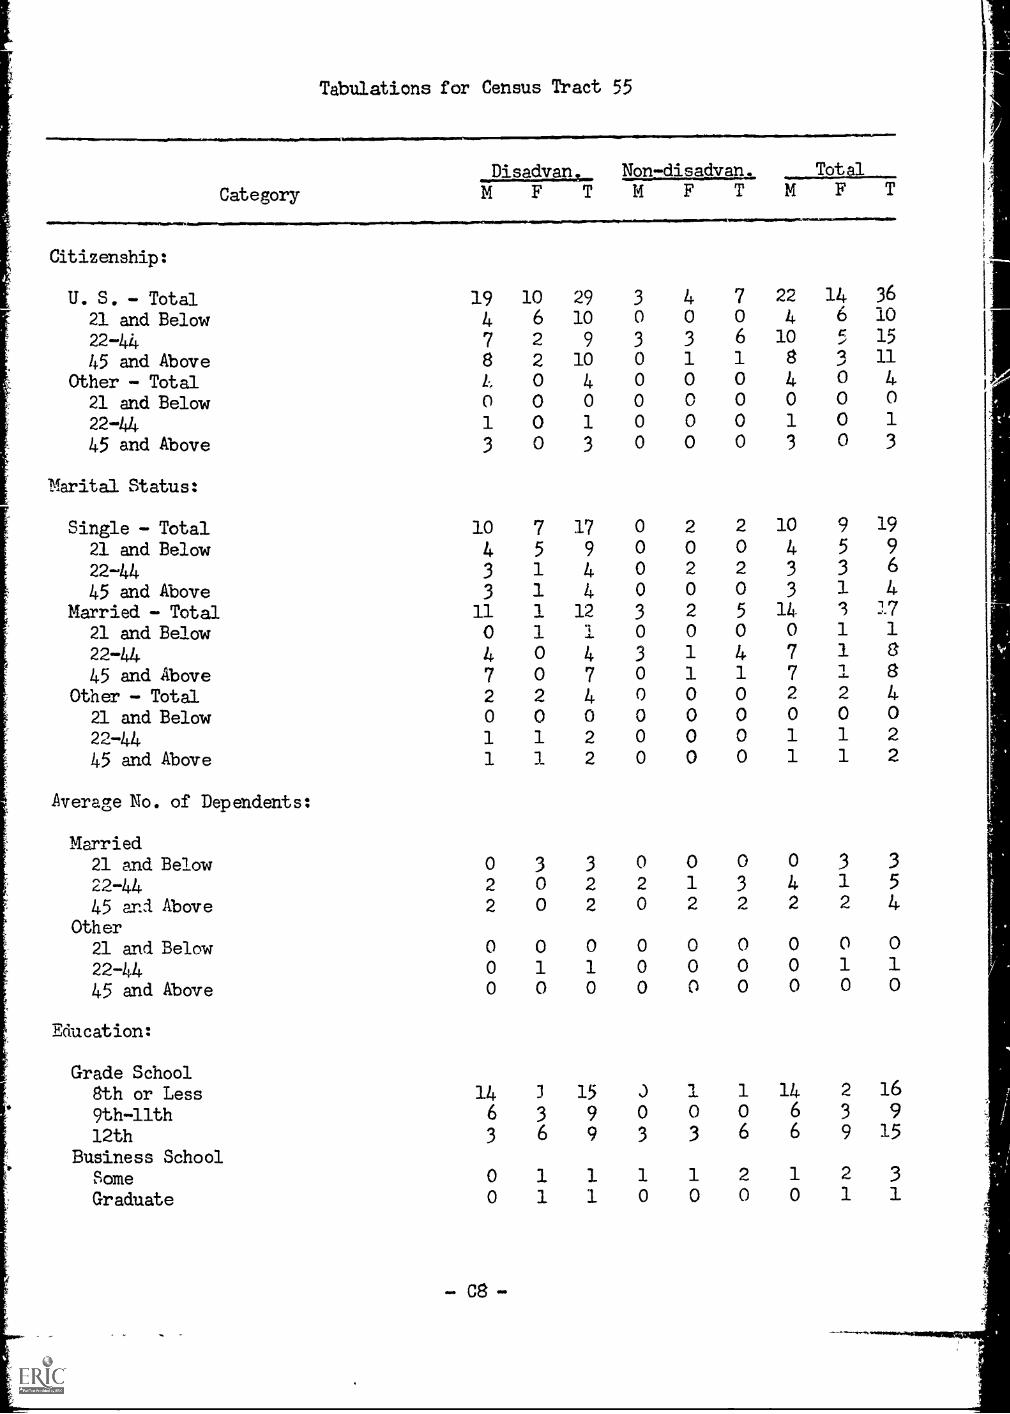
Tabulations for Census Tract 55
JINMEINI
Category
Citizenship:
U. S. - Total21 and Below22-44
45 and AboveOther - Total21 and Belaw22-44
45 and Above
Marital Status:
Single - Total21 and Belaw22-44
45 and AbuveMarried - Total
21 and Belaw22-44
45 and AboveOther - Total
21 and Belaw22-44
45 and Above
Average No. of Dependents:
Disadvan. Non-disadvan. Total
M F T M F
19 10 29 3 4
4 6 10 0 0
7 2 9 3 3
8 2 10 0 1
L., 0 4 0 00 0 0 0 0
1 0 1 0 0
3 0 3 0 0
7 220 46 101 80 40 0
0 1
0 3
10 7 17 0 2 2
4 5 9 0 0 03 1 4 0 2 2
3 1 4 0 0 0
11 1 12 3 2 5
0 1 1 0 0 0
4 0 4 3 1 47 0 7 0 1 12 2 4 0 0 00 0 0 0 0 01 1 2 0 0 0
1 1 2 0 0 0
Married21 and Belaw 0 3 3 0 0 0
22-44 2 0 2 2 1 3
45 and gbave 2 0 2 0 2 2
Other21 and Belaw 0 0 0 0 0 0
22-44 0 1 1 0 0 0
45 and Above 0 0 0 0 0 0
Education:
14 36
6 10c 15
1 11
0 40 00 10 3
10 9
4 5
3 3
3 114 10 1
7 17 12 20 01 11 1
0 3
4 12 2
0 0
0 10 0
19
96
4171884022
3
5
4
010
Grade School8th or Less 14 3 15 J 1. 1 14 2 16
9thllth 6 3 9 0 0 0 6 3 9
12th 3 6 9 3 3 6 6 9 15
Business SchoolSome 0 1 1 1 1 2 1 2 3
Graduate 0 1 1 0 0 0 0 1 1
-C8-
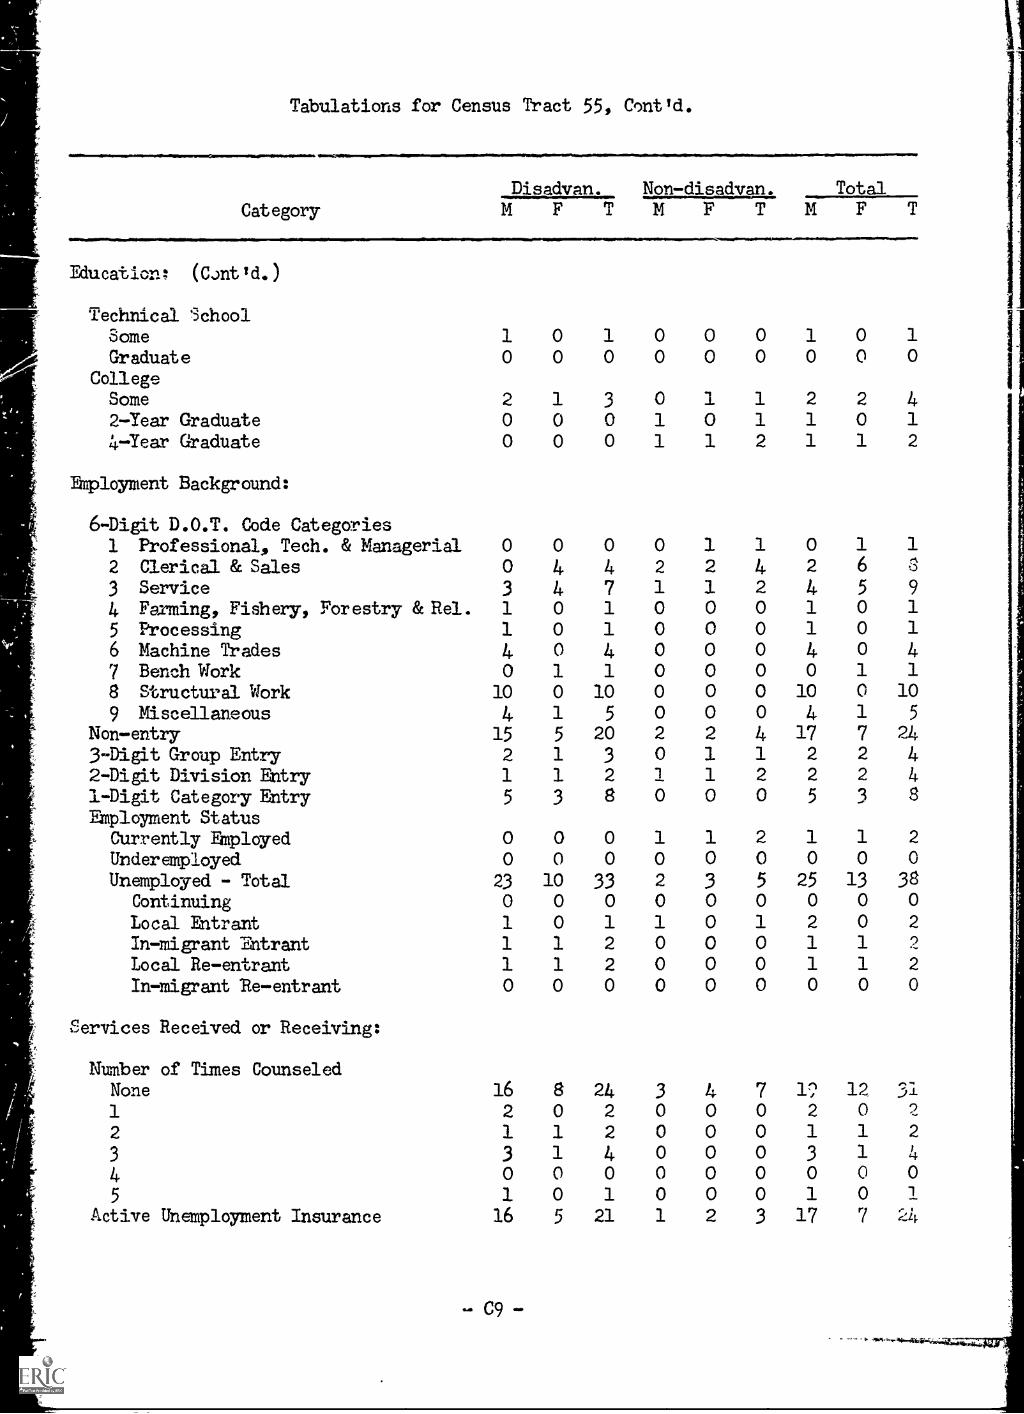
Tabulations for Census Tract 55, Contld.
...M.11111111104/11111.1111*
Category
Disadvan. Non-disadvan. TotalMFTMFTMFTEducation: (Cant d.
Technical SchoolSome 1 0 1 0 0 0 1 0 1
Graduate 0 0 0 0 0 0 0 0 0
CollegeSome 2 1 3 0 1 1 2 2 42-Year Graduate 0 0 0 1 0 1 1 0 1
4-Year Graduate 0 0 0 1 1 2 1 1 2
Eznployment Background:
6-Digit D.O.T. Code Categories1 Professional, Tech. & Managerial 0 0 0 0 1 1 0 1 1
2 Clerical &Sales 0 4 4 2 2 4 2 6 0
3 Service 3 4 7 1 1 2 4 5 9
4 Farming, Fishery, Forestry 8cRel. 1 0 1 0 0 0 1 0 1
5 Processing 1 0 1 0 0 0 1 0 1
6 Machine Trades 4 0 4 0 0 0 4 0 47 Bench Work 0 1 1 0 0 0 0 1 1
8 Structural Work 10 0 10 0 0 0 10 0 109 Miscellaneous 4 1 5 0 0 0 4 1 5
Non-entry 15 5 20 2 2 4 17 7 243-Digit Group Entry 2 1 3 0 1 1 2 2 42-Digit Division Entry 1 1 2 1 1 2 2 2 4
1-Digit Category Entry 5 3 8 0 0 0 5 3 8
Ehployment StatusCurrently Emplqyed 0 0 0 1 1 2 1 1 2
Underemployed 0 0 0 0 0 0 0 0 0
Unemployed - Total 23 10 33 2 3 5 25 13 38Continuing 0 0 0 0 0 0 0 0 0
Local Entrant 1 0 1 1 0 1 2 0 2
In-migrant Entrant 1 1 2 0 0 0 1 1 ?
Local Re-entrant 1 1 2 0 0 0 1 1 2
In-migrant 1U-entrant 0 0 0 0 0 0 0 0 0
Services Received or Receiving:
NuMber of Times CounseledNone 16 8 24 3 4 7 1;' 12 31
1 2 0 2 0 0 0 2 0 2
2 1 1 2 0 0 0 1 1 2
3 3 1 4 0 0 0 3 1 44 0 0 0 0 0 0 0 0 0
5 1 0 1 0 0 0 1 0
Active Unemplqyment Insurance 16 5 21 1 2 3 17 7 24
-C9-
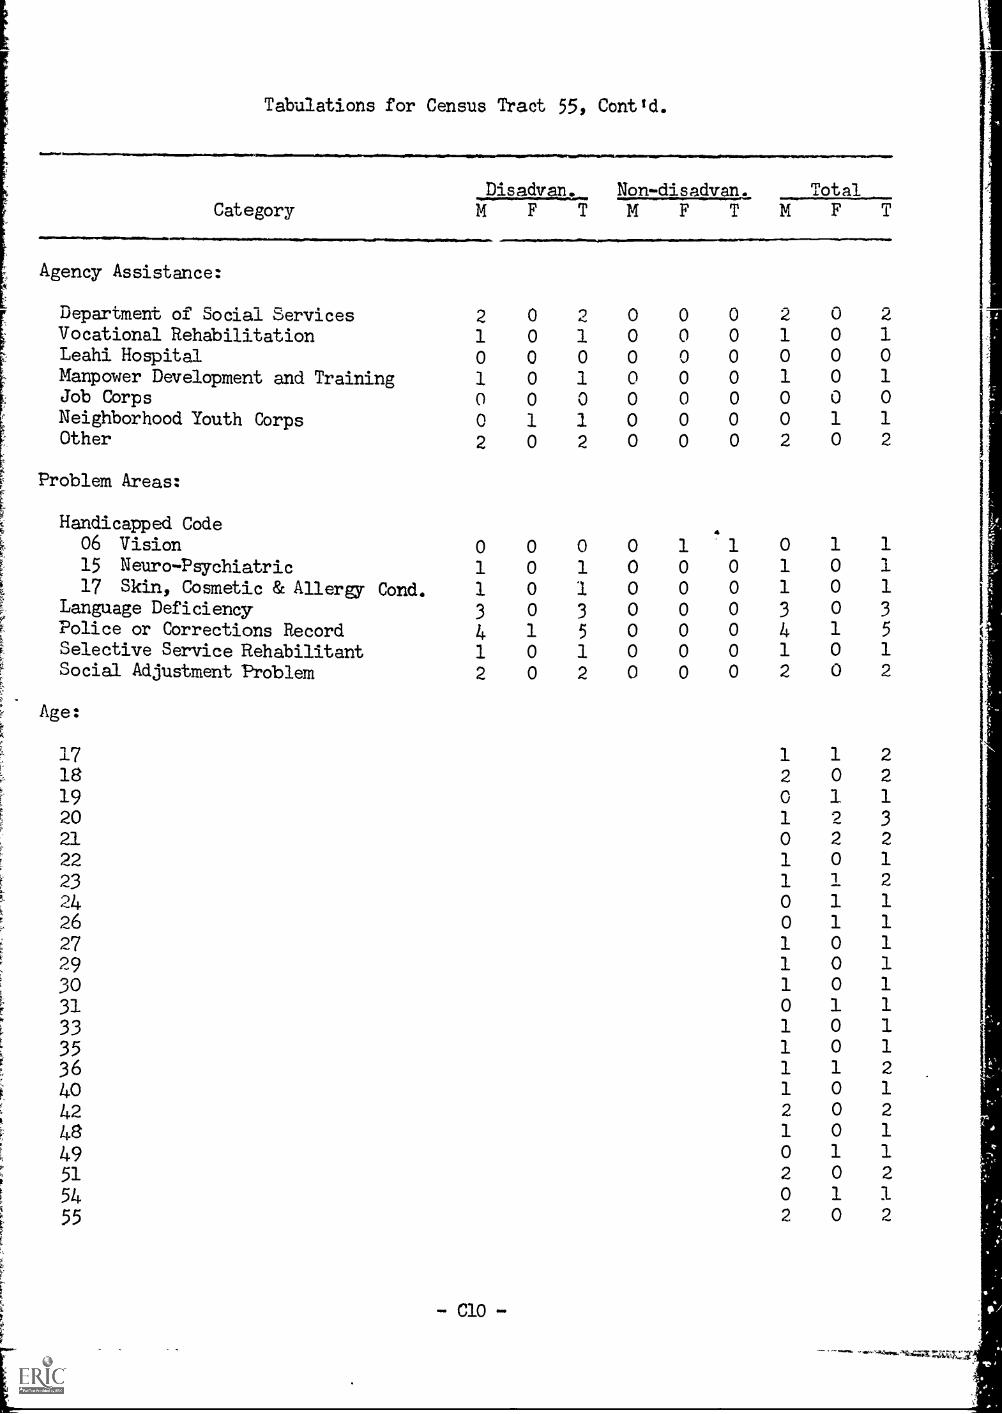
Tabulations for Census Tract 55, Contld.
4M.0. ......--.....----
CategoryDisadvan. Non-disadvan. TotalMFTMFTMF
Agency Assistance:
Department of Social Services 2 0 2 0 0 0 2 0 2
Vocational Rehabilitation 1 0 1 0 0 0 1 0 1Leahi Hospital 0 0 0 0 0 0 0 0 0
Manpower Development and Training 1 0 1 0 0 0 1 0 1
Job Corps 0 0 0 0 0 0 0 0 0
Neighborhood Youth Corps 0 1 1 0 0 0 0 1 1Other 2 0 2 0 0 0 2 0 2
Problem Areas:
Handicapped Code06 Vision 0 0 0 0 1 1 0 1 1
15 Neuro -Psychiatric 1 0 1 0 0 0 1 0 117 Skin, Cosmetic & Allergy Cond. 1 0 1 0 0 0 1 0 1
Language Deficiency 3 0 3 0 0 0 3 0 3
Police or Corrections Record 4 1 5 0 0 0 4 1 5
Selective Service Rehabilitant 1 0 1 0 0 0 1 0 1Social Adjustment Problem 2 0 2 0 0 0 2 0 2
Age:
1718192021222324262729303133353640424849515455
1 1 22 0 20 1 11 9 30 2 21 0 11 1 2
0 1 10 1 11 0 11 0 11 0 10 1 11 0 11 0 11 1 21 0 12 0 21 0 10 1 12 0 20 1 12 0 2
,
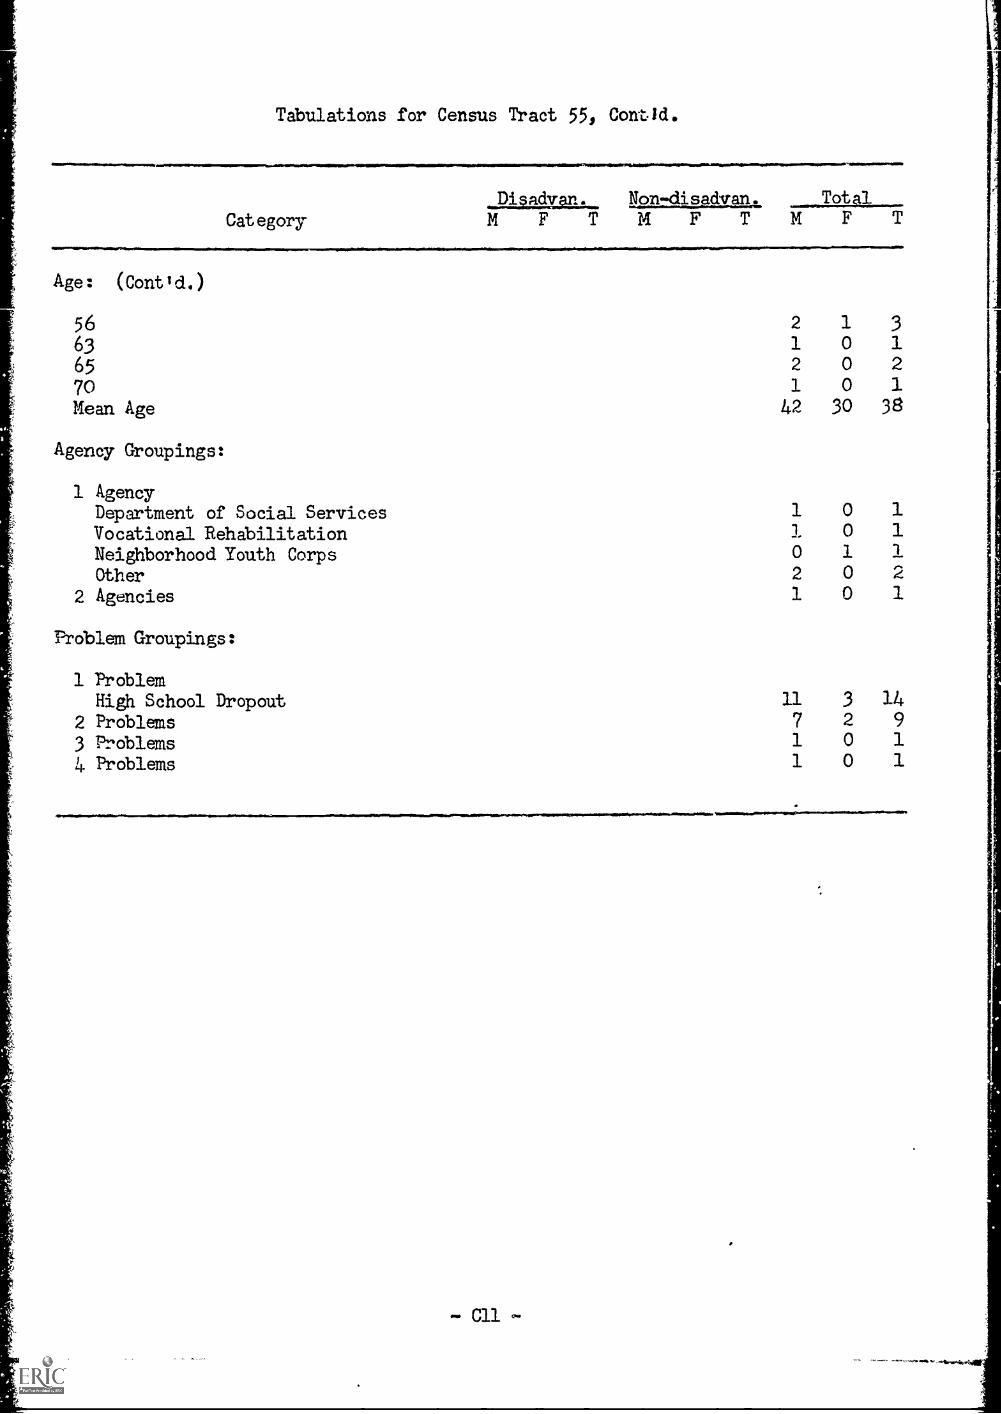
Tabulations for Census Tract 55, Contid.
Non-disadvan. Total
Category MFT/4FTMFTAge: (Contld.)
56 2
63 1
65 2
70 1
Mean Age 42 30 38
1 30 10 20 I
Agency Groupings:
1 AgencyDepartment of Social Services 1 0 1
Vocational Rehabilitation 1 0 1
Neighborhood Youth Corps 0 1 1
Other 2 0 2
2 Agencies 1 0 1
Problem Groupings:
1 ProblemHigh School Dropout 11 3 14
2 Problems 7 2 9
3 Problems 1 0 1
4 Problems 1 0 1
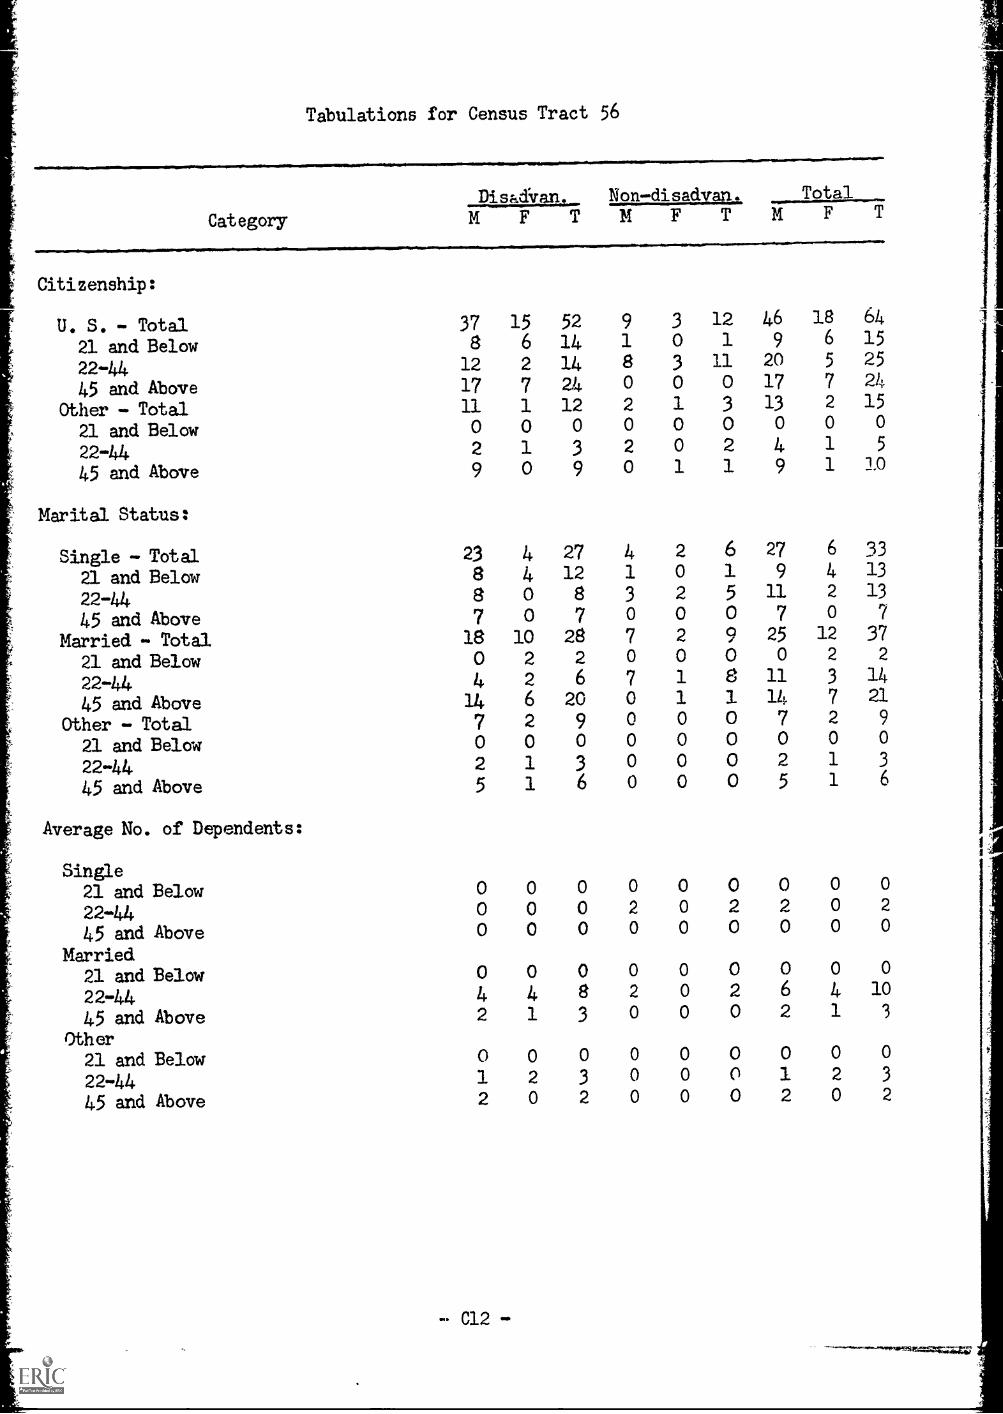
Tabulations for Census Tract 56
Category
Disad'van. Non-disadvaa. TotalMFTMFTMFTCitizenship:
U. S. - Total 37 15 52 9 3 12 46 18 64
21 and Below 8 6 14 1 0 1 9 6 15
22-44 12 2 14 8 3 11 20 5 25
45 and Above 17 7 24 0 0 0 17 7 24
Other - Total 11 1 12 2 1 3 13 2 15
21 and Below 0 0 0 0 0 0 0 0 0
22-44 2 1 3 2 0 2 4 1 5
45 and Above 9 0 9 0 1 1 9 1 10
Marital Status:
Single - Total 23 4 27 4 2 6 27 6 33
21 and Below 8 4 12 1 0 1 9 4 13
22-44 8 0 8 3 2 5 11 2 13
45 and Above 7 0 7 0 0 0 7 0 7
Married - Total 18 10 28 7 2 9 25 12 37
21 and Below 0 2 2 0 0 0 0 2 2
22-44 4 2 6 7 1 8 11 3 14
45 and Above 14 6 20 0 1 14 7 21
Other - Total 7 2 9 0 0 0 7 2 9
21 and Below 0 0 0 0 0 0 0 0 0
22-44 2 1 3 0 0 0 2 1 3
45 and Above 5 1 6 0 0 0 5 1 6
Average NO. of Dependents:
Single21 and Below 0 0 0 0 0 0 0 0 0
22-44 0 0 0 2 0 2 2 0 2
45 and Above 0 0 0 0 0 0 0 0 0
Married21 and Below 0 0 0 0 0 0 0 0 0
22-44 4 4 8 2 0 2 6 4 10
45 and Above 2 1 3 0 0 0 2 1 3
Other21 and Below 0 0 0 0 0 0 0 0 0
22-44 1 2 3 0 0 0 1 2 3
45 and Above 2 0 2 0 0 0 2 0 2
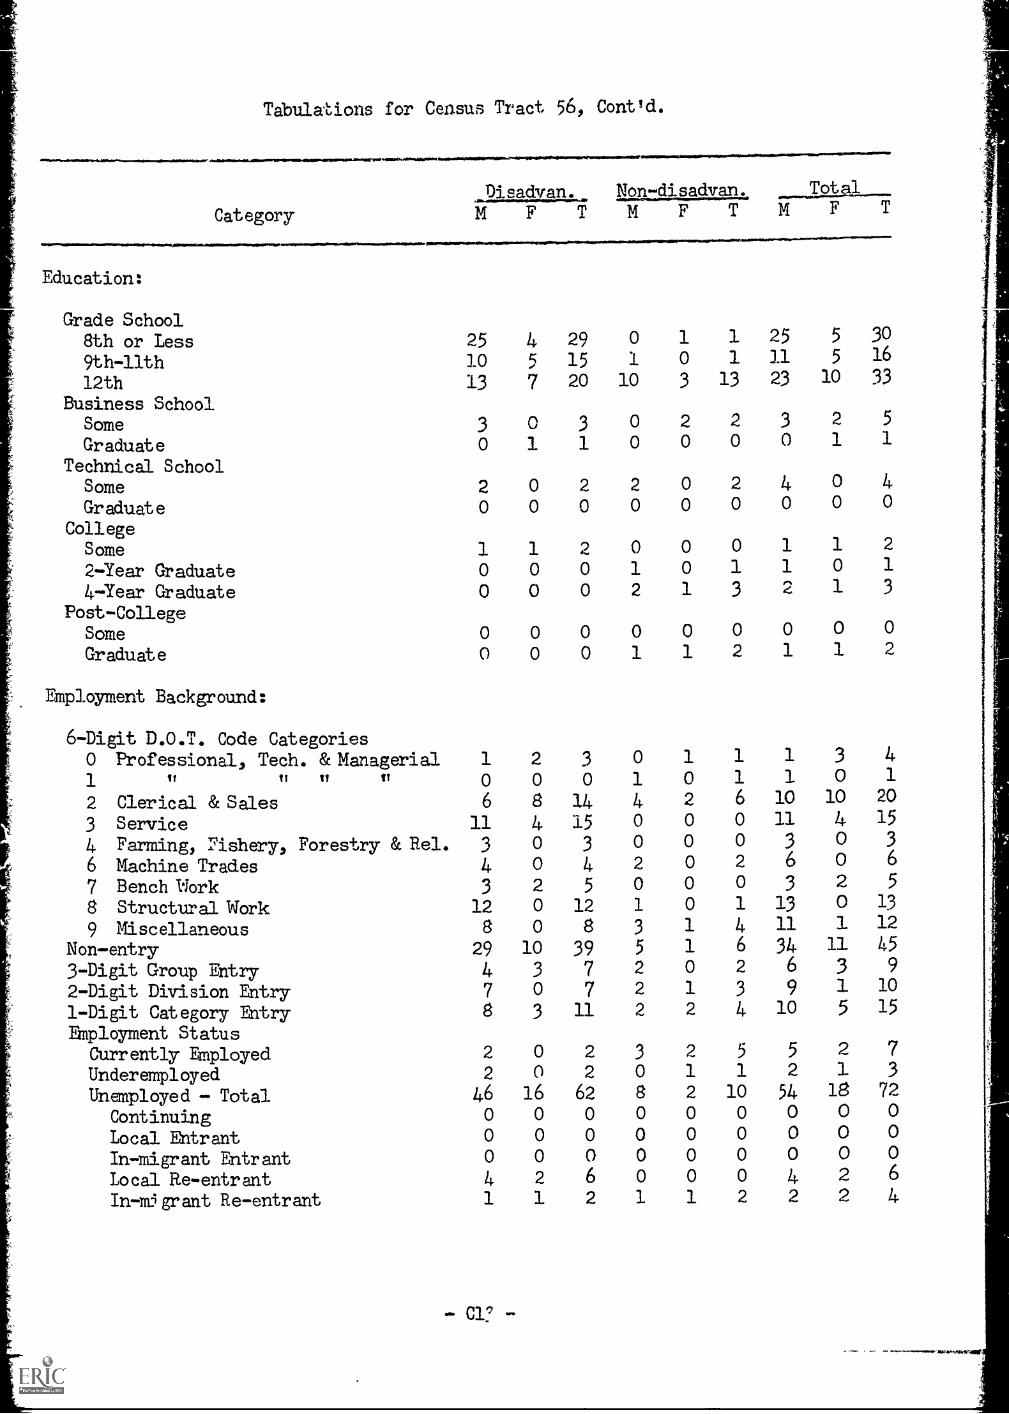
Tabulations for Ceasus Tract 56, Contld.
Category
Education:
Disadvan. Non-disadvan. TotalMFT MFTMFT
Grade School8th or Less 25 4 29 0 1 1 25 5 30
9th-11th 10 5 15 1 0 1 11 5 16
12th 13 7 20 10 3 13 23 10 33
Business SchoolSome 3 0 3 0 2 2 3 2 5
Graduate 0 1 1 0 0 0 0 1 1
Technical SchoolSome 2 0 2 2 0 2 4 0 4
Graduate 0 0 0 0 0 0 0 0 0
CollegeSome 1 1 2 0 0 0 1 1 2
2-Year Graduate 0 0 0 1 0 1 1 0 1
4-;Year Graduate 0 0 0 2 1 3 2 1 3
Post-CollegeSome 0 0 0 0 0 0 0 0 0
Graduate 0 0 0 1 1 2 1 1 2
Employment Background:
6-Digit D.O.T. Code Categories0 Professional, Tech. &Managerial 1 2 3 0 1 1 1 3 4
1 If II It t1 0 0 0 1 0 1 1 0 1
2 Clerical & Sales 6 8 14 4 2 6 10 10 20
3 Service 11 4 15 0 0 0 11 4 15
4 Farming, .Fishery, Forestry & Rel. 3 0 3 0 0 0 3 0 3
6 Machine Trades 4 0 4 2 0 2 6 0 6
7 Bench Work 3 2 5 0 0 0 3 2 5
8 Structural Work 12 0 12 1 0 1 13 0 13
9 Miscellaneous 8 0 8 3 1 4 11 1 12
Non-entry 29 10 39 5 1 6 34 11 45
3-Digit Group Entry 4 3 7 2 0 2 6 3 9
2-Digit Division Entry 7 0 7 2 1 3 9 1 10
1-Digit Category Entry 8 3 11 2 2 4 10 5 15
Employmnt StatusCurrently Employed 2 0 2 3 2 5 5 2 7
Underemployed 2 0 2 0 1 1 2 1 3
Unemployed - Total 46 16 62 8 2 10 54 18 72
Continuing 0 0 0 0 0 0 0 0 0
Local Ehtrant 0 0 0 0 0 0 0 0 0
In-migrant Entrant 0 0 0 0 0 0 0 0 0
Local Re-entrant 4 2 6 0 0 0 4 2 6
In-mjgrant Re-entrant 1 1 2 1 1 2 2 2 4
Cl? Sr.
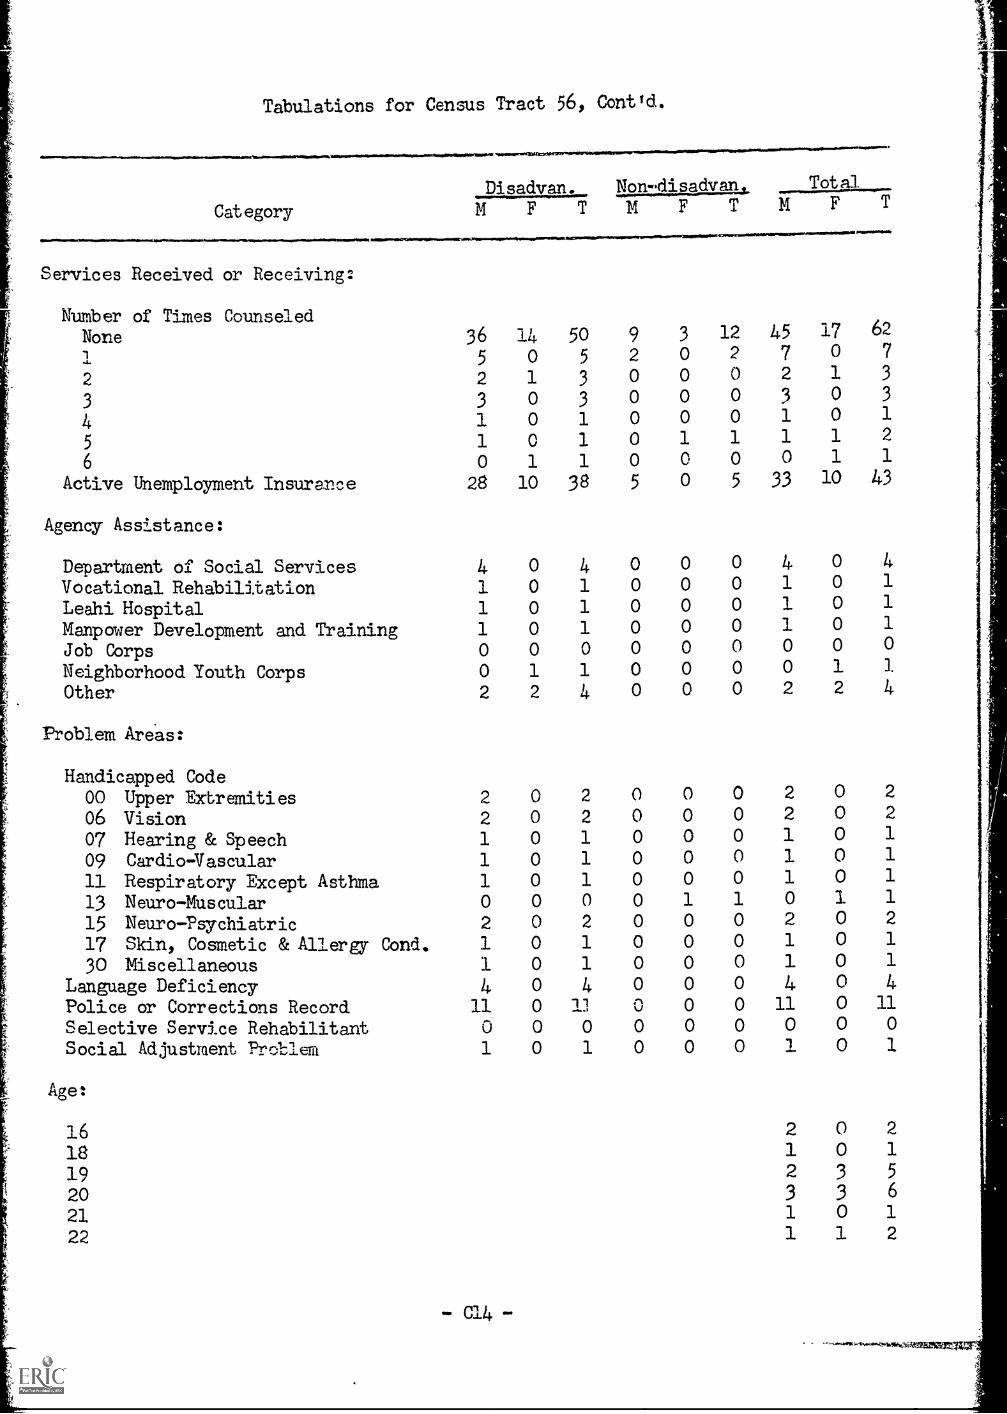
Tabulations for Census Tract 56, Cont'd.
Category
N.ralwr..........=wearmorlAw.1
Services Received or Receiving:
NuMber ofNone
2
3
4
6
Active Unemployment Insurance
Times Counseled
Disadvan.M F T
Non-disactan_i_ TotalNF T 14F T
Awas01 11
36 14 50 9 3 12 45 17 62
5 0 5 2 0 2 7 0 7
2 1 3 0 0 0 2 1 3
3 0 3 0 0 0 3 0 3
1 0 1 0 0 0 1 0 1
1 0 1 0 1 1 1 1 2
0 1 1 0 0 0 0 1 1
28 10 38 5 0 5 33 10 43
Agency Assistance:
Departnent of Social Services 4 0 4 0 0 0 4 0 4
Vocational Rehabilitation 1 0 1 0 0 0 1 0 1
Leahi Hospital 1 0 1 0 0 0 1 0 1
Manpower Development and Training 1 0 1 0 0 0 1 0 1
Job Corps 0 0 0 0 0 0 0 0 0
Neighborhood Youth Corps 0 1 1 0 0 0 0 1 1
Other 2 2 4 0 0 0 2 2 4
Problem Areas:
Handicapped Code00 Upper Extremities 2 0 2 0 0 0 2 0 2
06 Vision 2 0 2 0 0 0 2 0 2
07 Hearing & Speech 1 0 1 0 0 0 1 0 1
09 Cardio-Vascular 1 0 1 0 0 0 1 0 1
11 Respiratory Except Asthma 1 0 1 0 0 0 1 0 1
13 Neuro-Muscular 0 0 0 0 1 1 0 1 1
15 Neuro-Psychiatric 2 0 2 0 0 0 2 0 2
17 Skin, Cosmstic & Allergy Cond. 1 0 1 0 0 0 1 0 1
30 Niscellaneous 1 0 1 0 0 0 1 0 1
Language Deficiency 4. 0 4 0 0 0 4 0 4
Police or Corrections Record 11 0 1] u 0 0 11 0 11
Selective Service Rehabilitant 0 0 0 0 0 0 0 0 0
Social Adjustment Preciem 1 0 1 0 0 0 1 0 1
Age:
16 2 0 2
18 1 0 1
19 2 3 5
20 3 3 6
21 1 0 1
22 1 1 2
-C14-
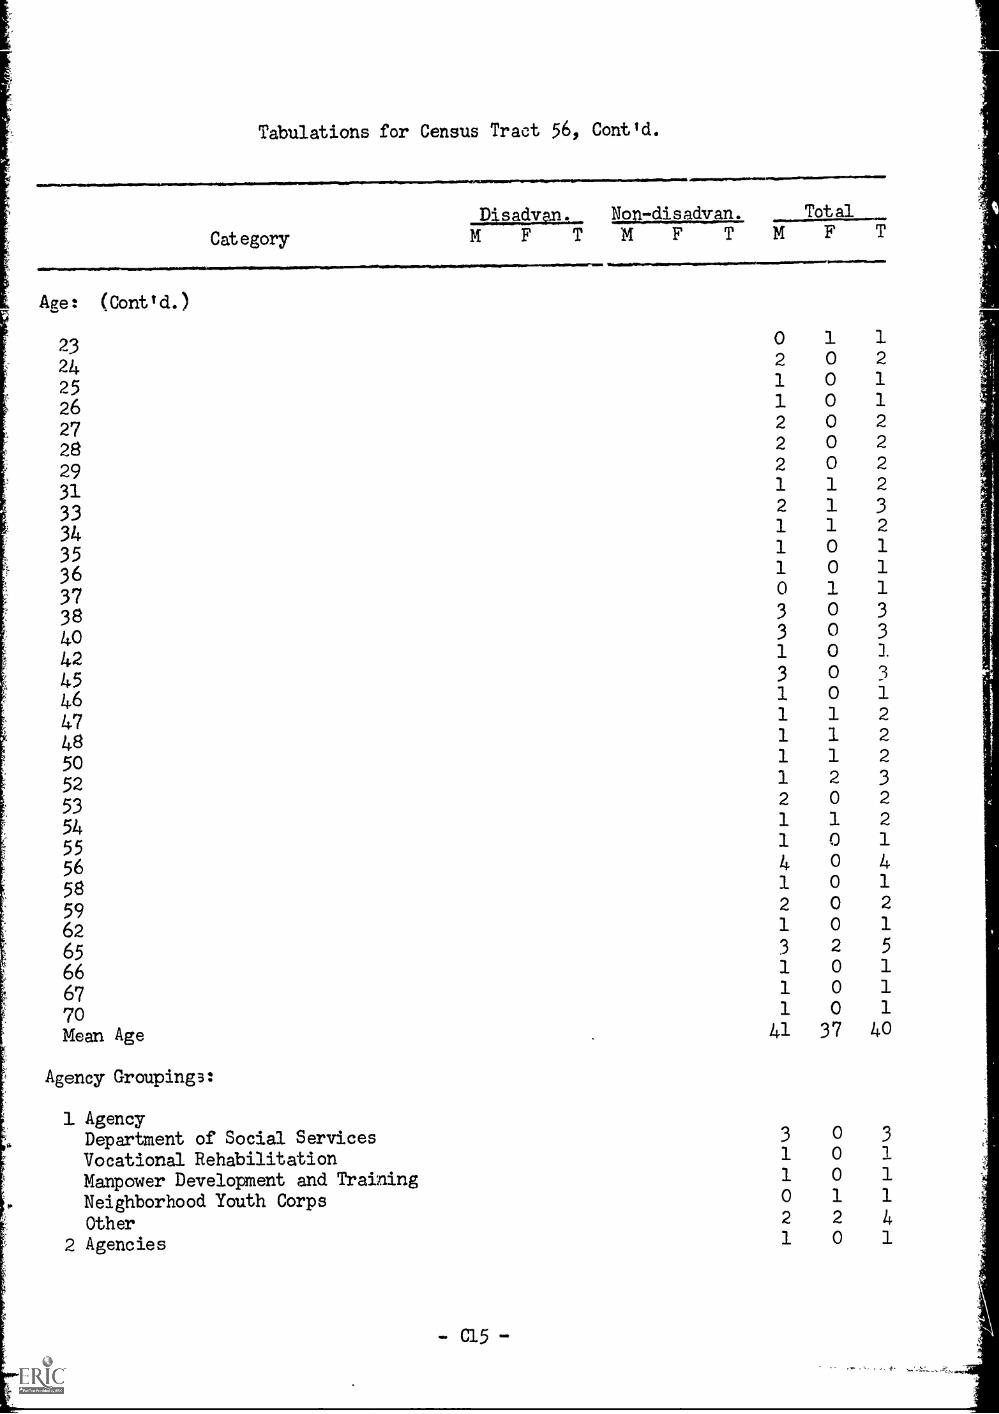
Tabulations for Census Tract 56, Contld.
Disadvp. Non-disadvan. Total
Category MFTMFTMFAee : ( Contld. )
23
24252627282931
3334353637384.0
424546
485052
53545556
58
596265666770Mean Age
Agency Groupings:
0 1 12 0 2
1 0 1
1 0 1
2 0 2
2 0 2
2 0 2
1 1 2
2 1 3
1 1 2
1 0 1
1 0 10 1 1
3 0 3
3 0 3
1 0 J.
3 0 3
1 0 1
1 1 2
1 1 2
1 1 2
1 2 3
2 0 2
1 1 2
1 0 1
4 0 41 0 1
2 0 2
1 0 1
3 2 5
1 0 1
1 0 1
1 0 1
41 37 40
1 AgencyDepartment of Social Services 3 0 3
Vocational Rehabilitation 1 0 1
Manpower Development and Training 1 0 1
Neighborhood Youth Corps 0 1 1
Other 2 2 4
2 Agencies 1 0 1
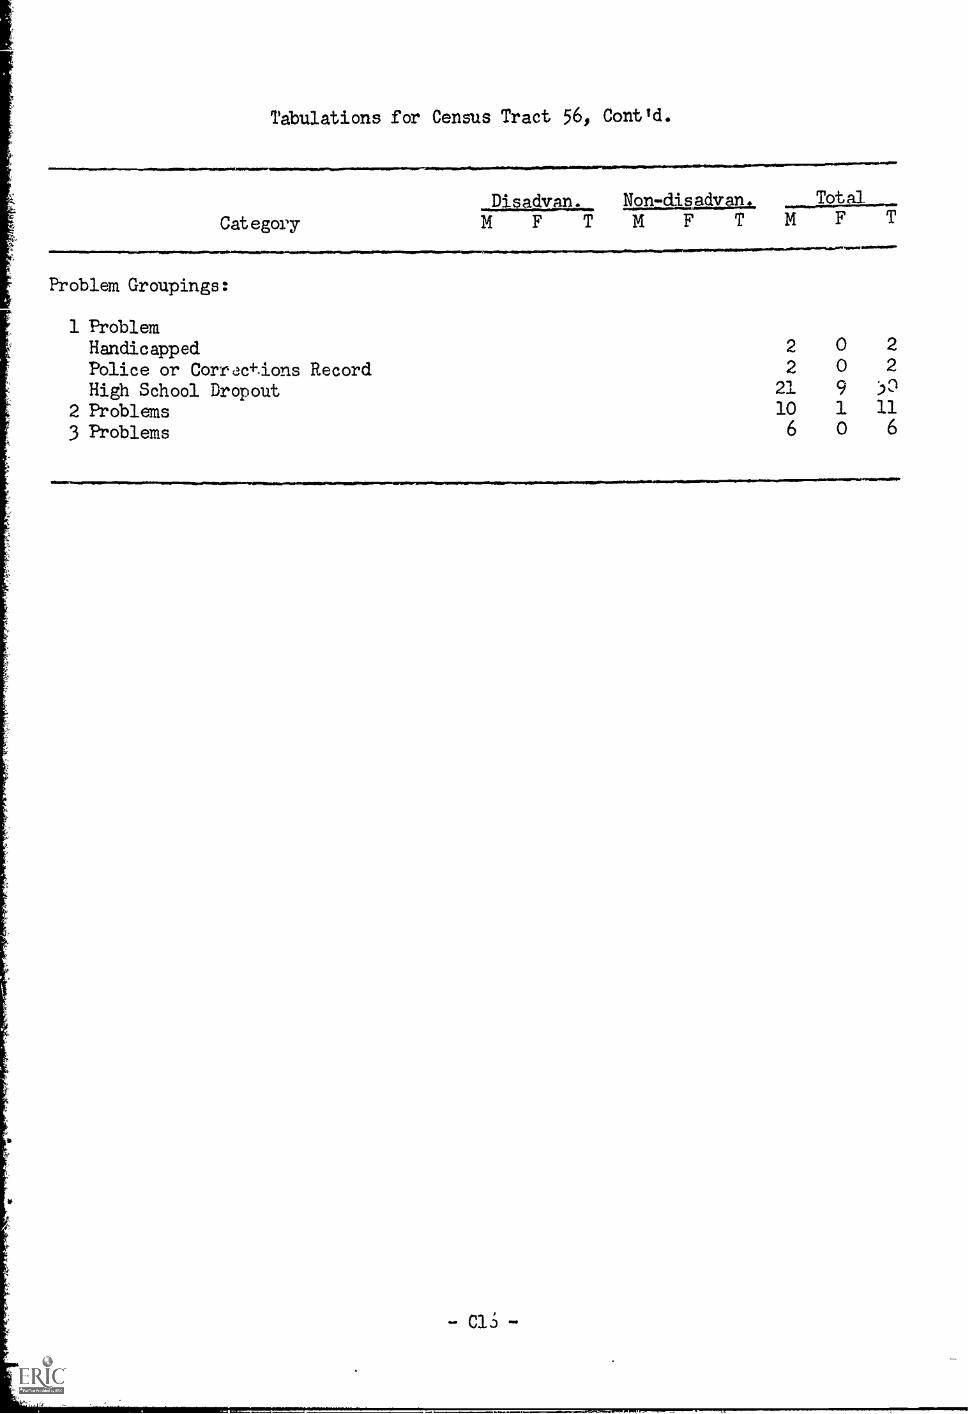
Tabulations for Census Tract 56, Contld.
Category
,a..owsw
Disadvan. Non-disadvan TotalMFTMFTMFTProblen Groupings:
1 ProblemHandicapped 2 0 2
Police or Corrdc+dons Record 2 0 2
High School Dropout 21 9 30
2 Problems 10 1 11
3 Problems 6 0 6
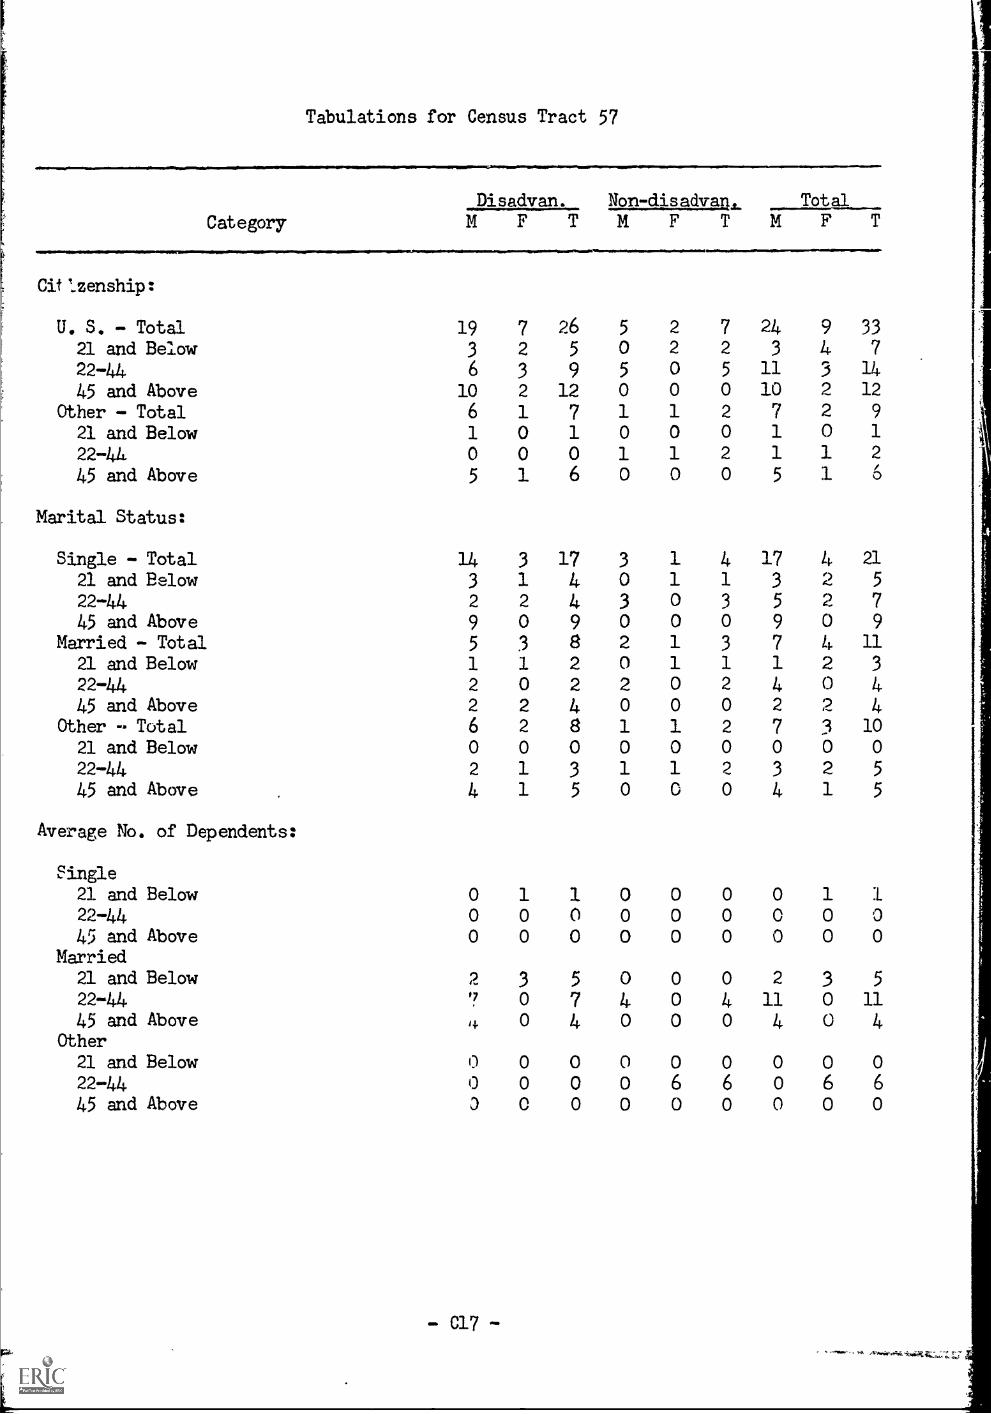
Tabulations for Census Tract 57
Category
Disadvan. Non-disadvan, TotalMFTMFTMFTCitIzenship:
U. S. - Total 19 7 26 5 2 7 24 9 33
21 and Belaw 3 2 5 0 2 2 3 4 7
22-44 6 3 9 5 0 5 11 3 14
45 and Above 10 2 12 0 0 0 10 2 12
Other - Total 6 1 7 1 1 2 7 2 9
21 and Below 1 0 1 0 0 0 1 0 1
22-44 0 0 0 1 1 2 1 1 2
45 and Above 5 1 6 0 0 0 5 1 0
Marital Status:
Single - Total 14 3 17 3 1 4 17 4 21
21 and Below 3 1 4 0 1 1 3 0i_ 5
22-44 2 2 4 3 0 3 5 0,_ 7
45 and Above 9 0 9 0 0 0 9 0 9
Married - Total 5 3 8 2 1 3 7 4 11
21 and Below 1 1 2 0 1 1 1 2 3
22-44 2 0 2 2 0 2 4 0 445 and Above 2 2 4 0 0 0 2 2 4
Other - Total 6 2 8 1 1 2 7 3 10
21 and Below 0 0 0 0 0 0 0 0 0
22-44 2 1 3 1 1 2 3 2 5
45 and Above 4 1 5 0 0 0 4 1 5
Average No. of Dependents:
Single21 and Below 0 1 1 0 0 0 0 1 122-44 0 0 0 0 0 0 0 0 045 and Above 0 0 0 0 0 0 0 0 0
Married21 and Belaw 2 3 5 0 0 0 2 3 5
22-44 '7 0 7 4 0 4 11 0 11
45 and Above 4 0 4 0 0 0 4 0 4Other
21 and Below 0 0 0 0 0 0 0 0 022-44 0 0 0 0 6 6 0 6 6
45 and Abave 0 0 0 0 0 0 0 0 0
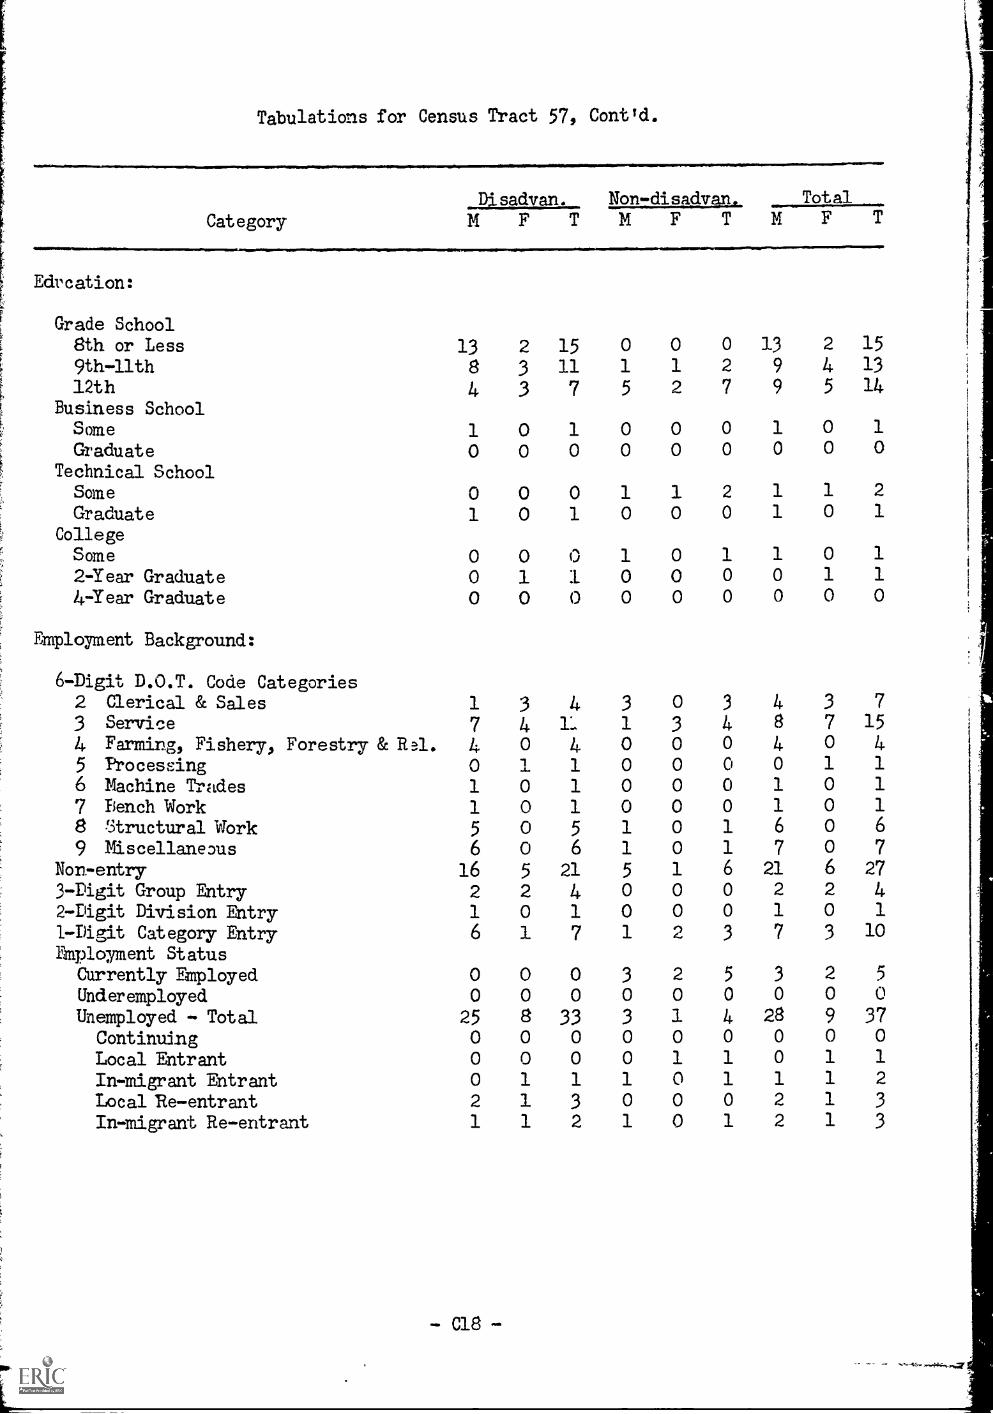
Tabulations for Census Tract 57, Conflict.
CategoryDisadvan. Non-disadvgn_. TotalMFTMFT 14 F T
Education:
Grade School8th or Less 13 2 15 0 0 0 13 2 15
9th-llth 8 3 11 1 1 2 9 4 13
12th 4 3 7 5 2 7 9 5 14Business SchoolSame 1 0 1 0 0 0 1 0 1
Graduate 0 0 0 0 0 0 0 0 0
Technical SchoolSane 0 0 0 1 1 2 1 1 2
Graduate 1 0 1 0 0 0 1 0 1
CollegeSame 0 0 0 1 0 1 1 0 1
2-Year Graduate 0 1 1 0 0 0 0 1 1
4-Year Graduate 0 0 0 0 0 0 0 0 0
Employment Background:
6-Digit D.O.T. Code Categories2 Clerical & Sales 1 3 4 3 0 3 4 3 73 Service 7 4 11. 1 3 4 8 7 15
4 Farming, Fishery, Forestry & Ral. 4 0 4 0 0 0 4 0 45 Processing 0 1 1 0 0 0 0 1 1
6 Machine Trades 1 0 1 0 0 0 1 0 1
7 Bench Work 1 0 1 0 0 0 1 0 1
8 (3tructural Nbrk 5 0 5 1 o 1 6 0 6
9 Miscellaneous 6 0 6 1 o 1 7 o 7
Nor-entry 16 5 21 5 1 6 21 6 27
3-Digit Group Entry 2 2 4 0 0 0 2 2 42-agit Division Entry1-Digit Category Entry
1
6
01
17
01
0n,..
0
3
17
03
110
Employment StatusCurrently Employed 0 0 0 3 2 5 3 2 5
Underemployed 0 0 0 0 0 0 0 0 0
Unemployed - Total 25 8 33 3 1 4 28 9 37
Continuing 0 0 0 0 0 0 0 0 0
Local Entrant 0 0 0 0 1 1 0 1 1
In-migrant Entrant 0 1 1 1 0 1 1 1 2
Local Re-entrant 2 1 3 0 o 0 2 1 3
In-omigrmt Re-entrant 1 1 2 1 0 1 2 1 3
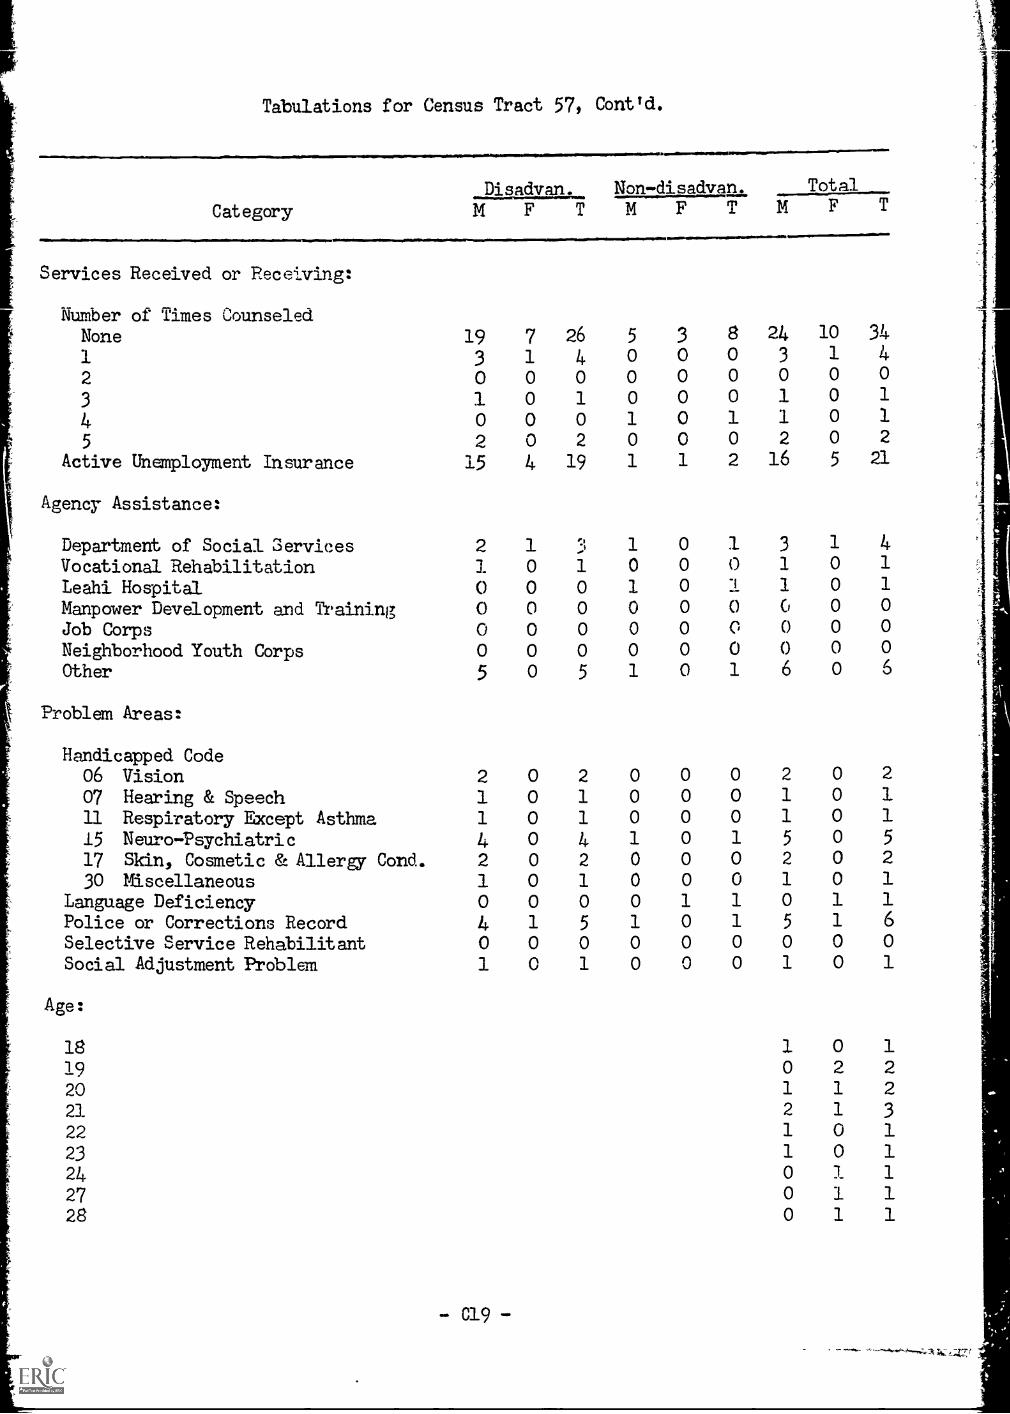
Tabulations for Census Tract 57, Contld.
Category
Disadvan. Non-disadvan. Total
M F T M F T
Services Received or Receiving:
Number of Times CounseledNane 19 7 26 5 3 8 24 10 34
1 3 1 4 0 0 0 3 1 4
2 0 0 0 0 0 0 0 0 0
3 1 0 1 0 0 0 1 0 1
4 0 0 0 1 0 1 1 0 1
5 2 0 2 0 0 0 2 0 2
Active Unemployment Insurance 15 4 19 1 1 2 16 5 21
Agency Assistance:
Department of Social Services 2 1I,% 1 0 1 3 1 4
Vocational Rehabilitation 1 0 1 0 0 0 1 0 1
Leahi Hospital 0 0 0 1 0 1 1 0 1
Manpower Development and Training 0 0 0 0 0 0 0 0 0
Job Corps 0 0 0 0 0 0 0 0 0
Neighborhood Youth Corps 0 0 0 0 0 0 0 0 0
Other 5 0 5 1 0 1 6 0 6
Problem Areas:
Handicapped Code06 Vision 2 0 2 0 0 0 2 0 2
07 Hearing & Speech 1 0 1 0 0 0 1 0 1
11 Respiratory Except Asthma 1 0 1 0 0 0 1 0 1
15 Neuro-Psychiatric 4 0 4 1 0 1 5 0 5
17 Skin, Cosmetic & Allergy Conk% 2 0 2 0 0 0 2 0 2
30 Miscellaneous 1 0 1 0 0 0 1 0 1
Language Deficiency 0 0 0 0 1 1 0 1 1
Police or Corrections Record 4 1 5 1 0 1 5 1 6
Selective Service Rehabilitant 0 0 0 0 0 0 0 0 0
Social Adjustment Ptioblem 1 0 1 0 0 0 1 0 1
Age:
18 1 0 1
19 0 2 2
20 1 1 2
21 2 1 3
22 1 0 1
23 1 0 1
24 0 1 1
27 0 1 1
28 0 1 1
-C19-
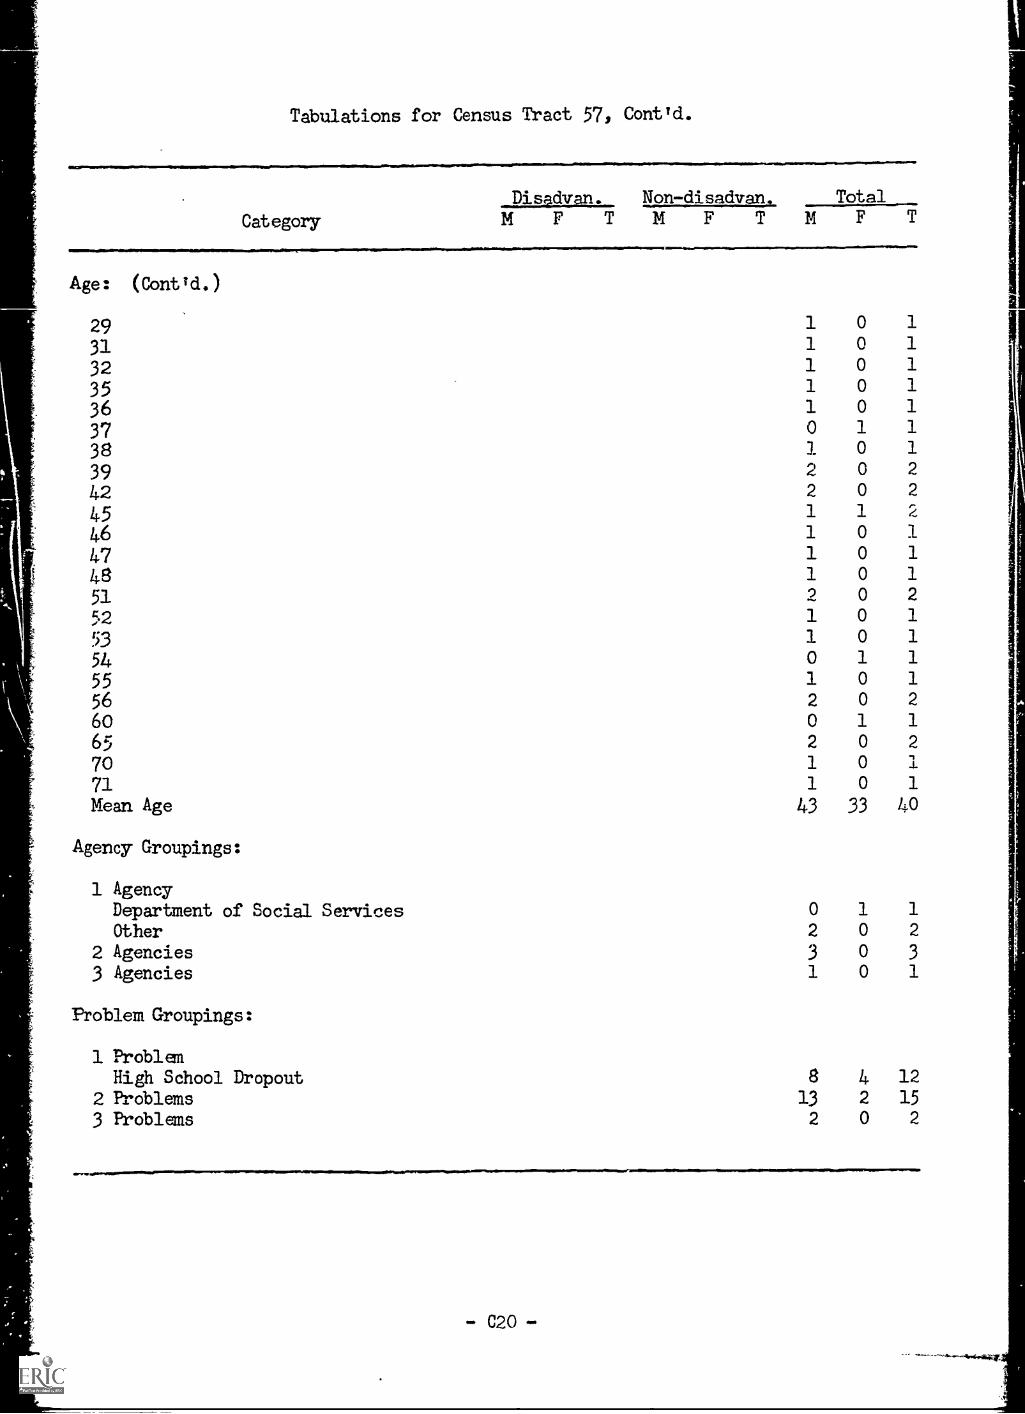
Tabulations for Census Tract 57, Cont'd.
Category
Disadvan. Non-disadvan. TotalMFTMFT N F T
Ase: (Contid.)
293132
35363738
3942454647485152
53
54555660657071Mean Age 43 33 40
1 0 1
1 0 1
1 0 1
1 0 1
1 0 1
0 1 1
1 0 1
2 0 2
2 0 2
1 1 2
1 0 1
1 0 1
1 0 1
9 0 2
1 0 1
1 0 1
0 1 1
1 0 1
2 0 2
0 1 1
2 0 2
1 0 1
1 0 I
Agency Groupings:
1 AgencyDepartment of Social ServicesOther
2 Agencies3 Agencies
Problem Groupings:
1 ProblemHigh School Dropout
2 Problems3 Problems
0 1 1
2 0 2
3 0 3
1 0 1
8 4 1213 2 15
2 0 2
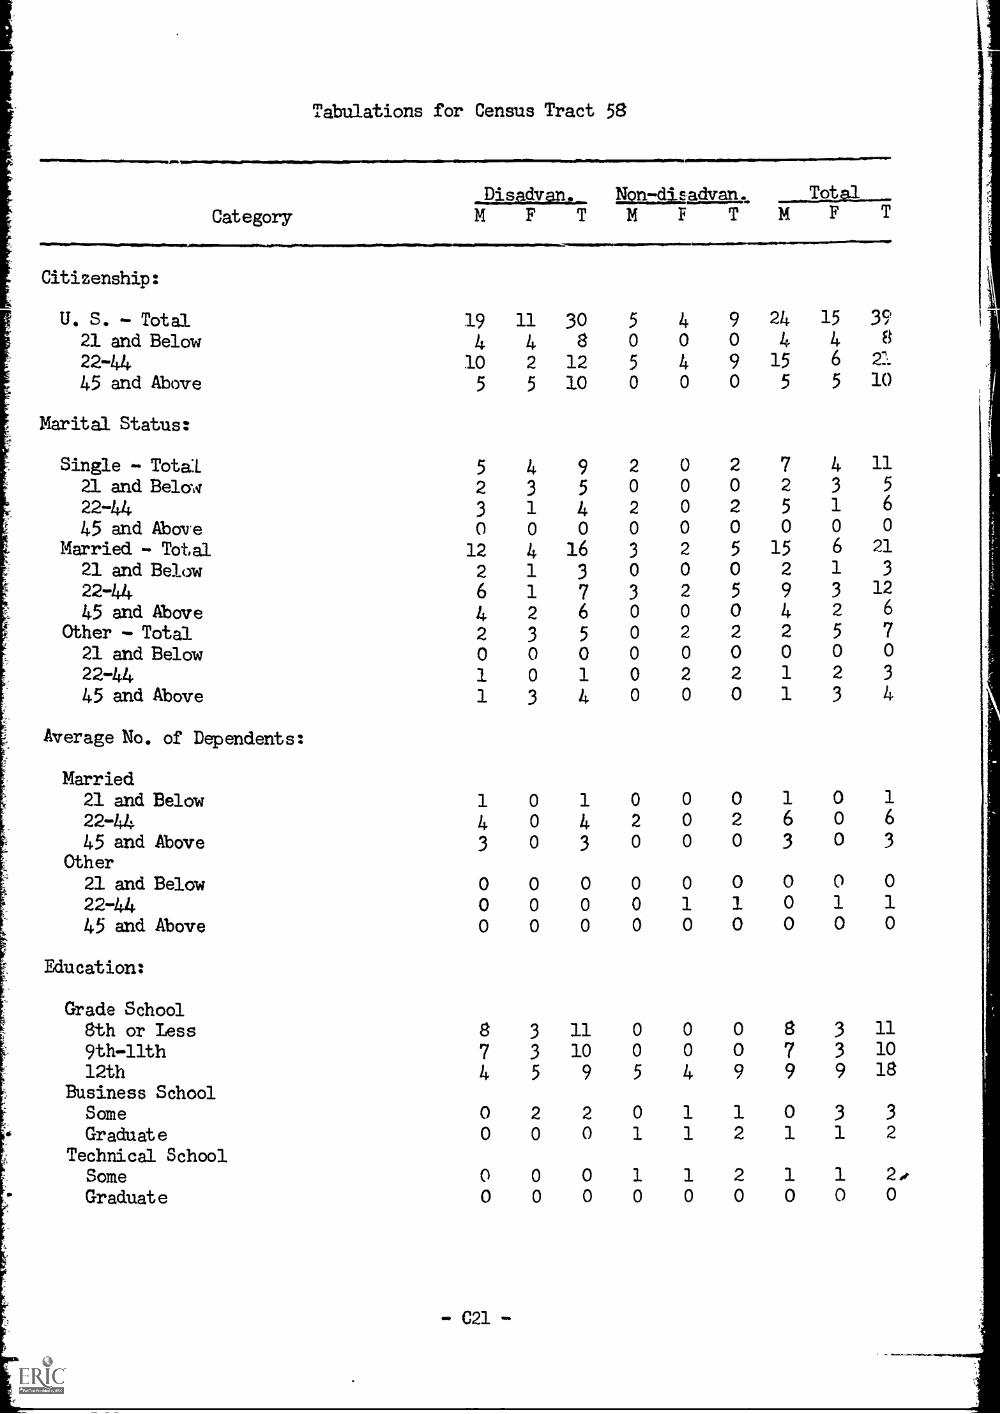
Tabulations for Census Tract 58
Category
Disadvan. Non-disadvan.MFTMF T M
Citizenship:
U. S. - Total 19 11 30 5 4 9 2421 and Below 4 4 8 0 0 0 422-44 10 2 12 5 4 9 15
45 and Abave 5 5 10 0 0 0 5
Marital Status:
Single - Total 5 4 9 2 0 2 7
21 and Below 2 3 5 0 0 0 222-44 3 1 4 2 0 2 5
45 and Above 0 0 0 0 0 0 0
Married - Total 12 4 16 3 2 5 15
21 and Belaw 2 1 3 0 0 0 2
22-44 6 1 7 3 2 5 9
45 and Above 4 2 6 0 0 0 4Other - Total 2 3 5 0 2 2 2
21 and Below 0 0 0 0 0 0 0
22-44 1 0 1 0 2 2 1
45 and Above 1 3 4 0 0 0 1
Average No. of Dependents:
Married21 and Below 1 0 1 0 0 0 1
22-44 4 0 4 2 0 2 6
45 and Above 3 0 3 0 0 0 3
Other
21 and Below 0 0 0 0 0 0 022-44 0 0 0 0 1 1 0
45 and Above 0 0 0 0 0 0 0
Education:
Grade School8th or Iess 8 3 11 0 0 0 89th-llth 7 3 10 0 0 0 7
12th 4 5 9 5 4 9 9Business School
Some 0 2 2 0 1 1 0Graduate 0 0 0 1 1 2 1
Technical SchoolSome 0 0 0 1 1 2 1
Graduate 0 0 0 0 0 0 0
-C21-
TotalF T
15
46
5
398
2110
4 11
3 5
1 6
0 0
6 211 3
3 12
2 6
5 70 0
2 3
3 4
0 1
0 6
0 3
0 0
1 10 0
3 11
3 10
9 18
3 3
1 2
1 2,.0 0

Tabulations for Census Tract 58, Contld.
Category
111.......01
Disadvqn.
Education: (Contld.)
4Non-disadvan.M F
sen... ge.
TotalF T
CollegeSame 1 1 2 1 0 1 2 1
2-Year Graduate 0 0 0 0 0 0 0 0 0
4-Year Graduate 0 0 0 1 0 1 1 0 1
Employment Background:
6-Digit D.O.T. Code CategoriesI Professional, Tech. &Managerial2 Clerical & Sales3 Service
4 Farming, Fishery, Forestry & Rel.8 Structural Work9 Miscellaneous
Non-entry3-Digit Group Entry2-Digit Division Entry1-Digit Category EntryEmployment Status
Currently EmployedUndereriployed
Unemployed - TotalContinuingLocal Entrant
In-migrant EntrantLocal Re-entrantIn-migrant Re-entrant
Services Received or Receiving:
Number of Times CuunseledNane1
2
3456
7
8
Active Unemployment Insurance
0 1 1 1 0 1 1 1 2
2 4 6 3 3 6 5 7 12
5 3 8 0 1 1 5 4 9
1 0 1 0 0 0 1 0 1
5 0 5 0 0 0 5 0 5
6 3 9 1 0 1 7 3 10
12 6 18 3 3 6 15 9 24
1 0 1 2 0 2 3 0 3
3 2 5 0 1 1 3 3 6
3 3 6 0 0 0 3 3 6
1 0 1 1 1 2 2 1 3
1 0 1 0 0 0 1 0 1
18 11 29 4 3 7 22 14 36
0 0 0 0 0 0 0 0 0
0 2 2 0 0 0 0 2 2
0 0 0 0 0 0 0 0 0
3 1 4 1 0 1 4 1 5
0 0 0 0 0 0 0 0 0
13 11 24 5 2 7 18 13 31
2 0 2 0 0 0 2 0 2
2 0 2 0 0 0 2 0 2
0 0 0 0 1 1 0 1 1
1 0 1 0 0 0 1 0 1
1 0 1 0 0 0 1 0 1
0 0 0 0 0 0 0 0 0
0 0 0 0 0 0 0 0 0
0 0 0 0 1 1 0 1 1
7 6 13 4 1 5 11 7 18
- C22 -
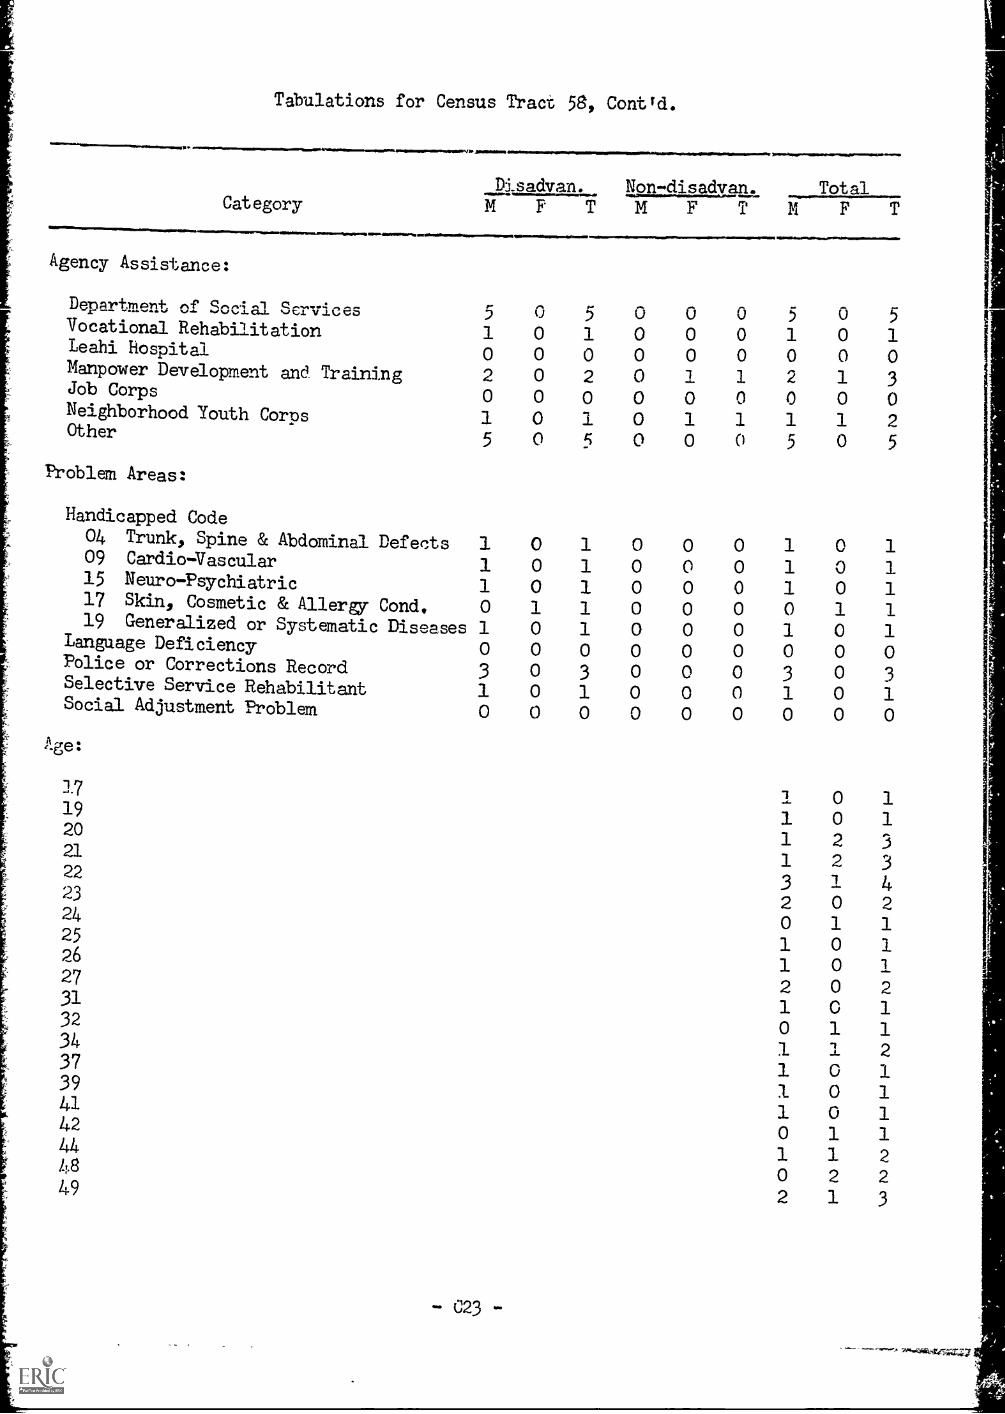
Tdbulations for Census Tract 58, Conttd.
aMmaxemaN. Aftmo
Disadvan. Non-disadvan. TotalCategory MFTMFTMFTam 11111.1/11=11111.1=111M1.
Agency Assistance:
Delonl--EmPnt of goci-1 Services 5 0 5Vocational Rehabilitation 1 0 1Leahi hospital 0 0 0Manpower Development and Training 2 0 2Job Corps 0 0 0Neighborhood Youth Corps 1 0 1
0 00 00 00 1
0 00 1
0 5 0 5
0 1 0 10 0 0 01 2 1 30 0 0 01 1 1 2
Other5 o 5 o o 0 5 o 5
Problen Areas:
Handicapped Code04 Trunk, Spine & Abdominal Defects 1 0 109 Cardio-Vascular 1 0 115 Neuro -Psychiatric 1 0 117 Skin, Cosmetic & Allergy Cond, 0 1 119 Generalized or Systematic Diseases 1 0 1
Language Deficiency 0 0 0Police or Corrections Record 3 0 3Selective Service Rehabilitant 1 0 1Social Adjustment Problem. 0 0 0
Age:
0 0 0 1
0 0 0 10 0 0 10 0 0 00 0 0 10 0 0 0o o o 30 0 0 10 0 0 0
17
19 120 121 122
323 224 025 126 127 231 132 034 137 139 141 142 044 148
049 2
- C23 -
0 1
0 10 11 10 10 00 3
0 10 0
0 10 12 32 31 40 21 10 10 1
0 20 11 1
1 20 10 1
0 11 11 2
2 2
1 3
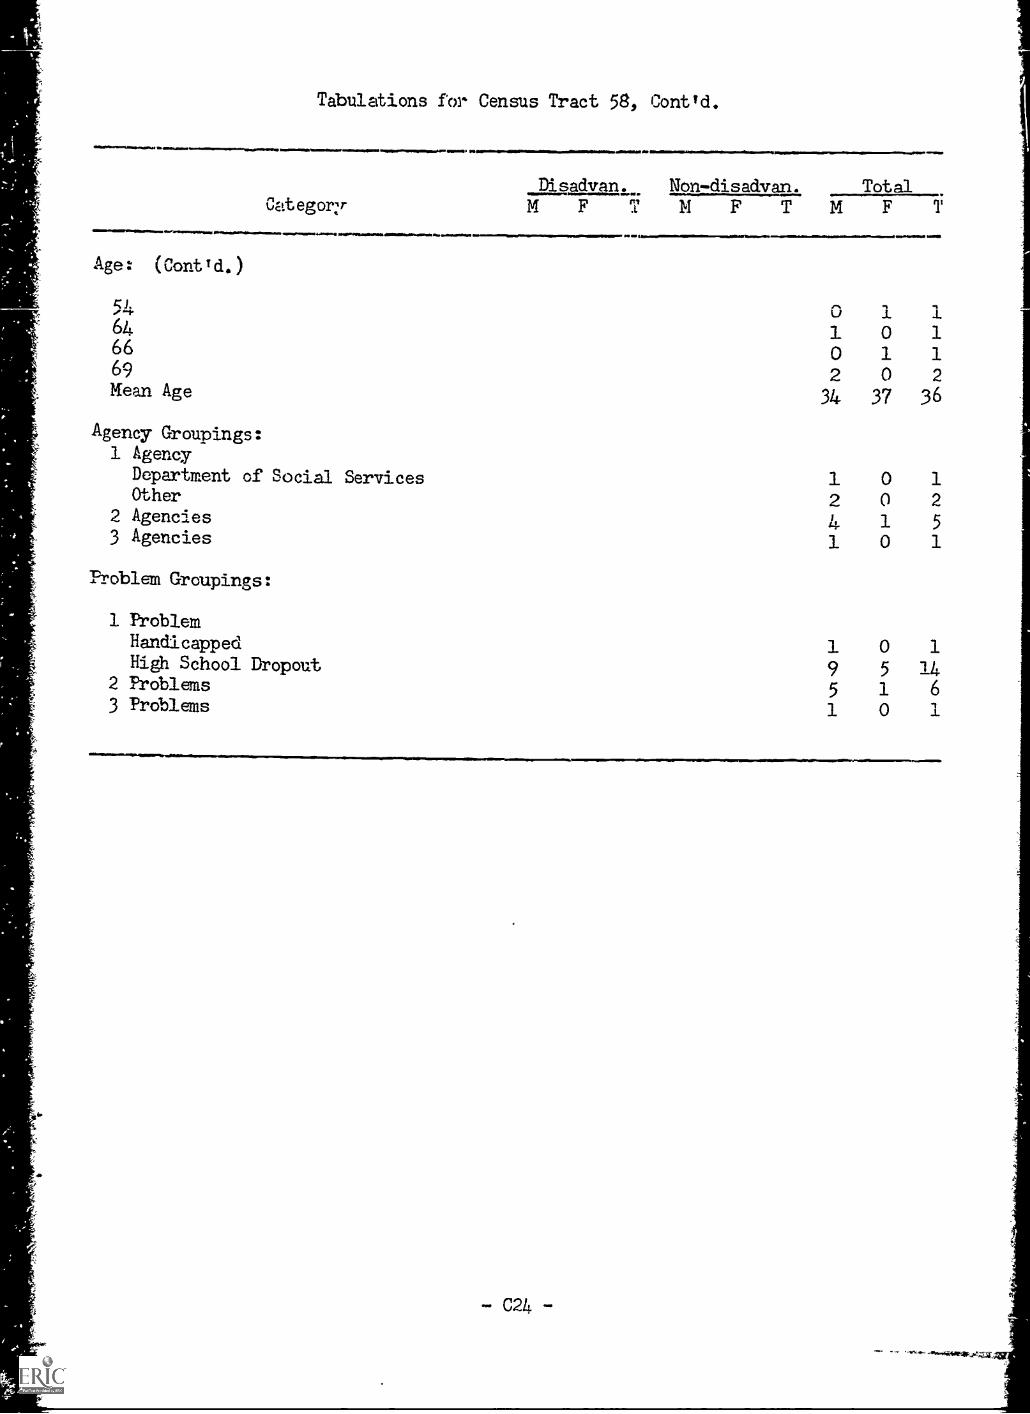
Tabulations for Census Tract 58, Contld.
1011111111111=1=1Widim
Cat ego/7107.11111M110 44.0.o...s
Age: (Cont'd.)
54646669Mean Age
Agency Groupings:1 Agency
Department of Social ServicesOther
2 Agencies3 Agencies
Problem Groupings:
1 ProblemHandicappedHigh School Dropout
2 Problems3 Problems
11.11V
Disadvan Non-disadvan. TotalM F T N F TMFT
0 1 11 0 1
0 1 12 0 2
34 37 36
1 0 12 0 2
4 1 5
1 0 1
1 0 19 5 145 1 6
1 0 1
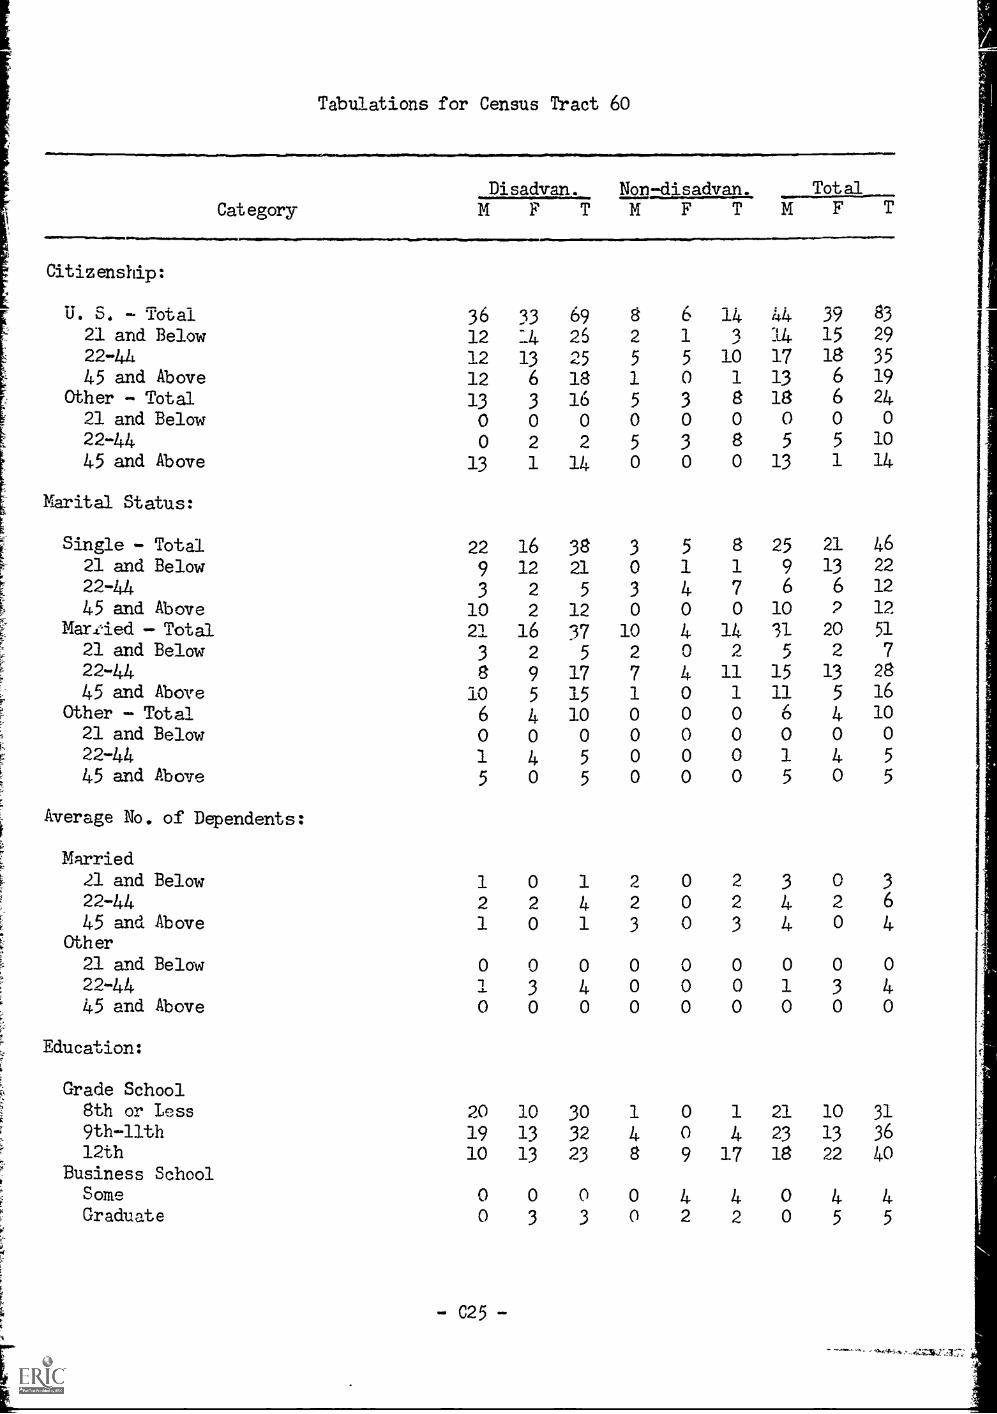
Tabulations for Census Tract 60
Disadvan. Non-disadvan. Total
Category MFTMFTMF
r,
Citizenship:
U. S. - Total 3621 and Below 1222-44 1245 and Above 12
Other - Total 1321 and Below 022-44 045 and Above 13
Marital Status:
Single - Total21 and Belma22-44
45 and Above- Total
21 and Below22-4445 and Above
Other - Total21 and Belaw22-44
45 and Above
Average No. of Dependents:
Married21 and Below22-4445 and Above
Other
21 and Below22-4445 and Above
Education:
Grade School8th or Less9th-llth12th
Business SchoolSome
Graduate
33 69 8 6 1414 25 2 1 3
13 25 5 5 10
6 18 1 0 1
3 16 5 3 80 0 0 0 0
2 2 5 3 81 14 0 0 0
441417
13180
5
13
39 83
15 29
18 35
6 19
6 240 0
5 10
1 14
22 16 38 3 5 8 25 21 46
9 12 21 0 1 1 9 13 22
3 2 5 3 4 7 6 6 12
10 2 12 0 0 0 10 2 12
21 16 37 10 4 14 11 20 51
3 2 5 2 0 2 5 2 7
8 9 17 7 4 11 15 13 28
10 5 15 1 0 1 11 5 16
6 4 10 0 0 0 6 4 10
0 0 0 0 0 0 0 0 0
1 4 5 0 0 0 1 4 5
5 0 5 0 0 0 5 0 5
1 0
2 2
1 0
0 0
1 3
0 0
20 1019 1310 13
0 0
0 3
-C25-
1 2 0 2 3 0
4 2 0 2 4 2
1 3 0 3 4 0
0 0 0 0 0 0
4 0 0 0 1 30 0 0 0 0 0
30 1 0 1 21 10
32 4 0 4 23 13
23 8 9 17 18 22
0 0 4 4 0 43 0 2 2 0 5
3
6
4
0
40
31
36
40
45
-
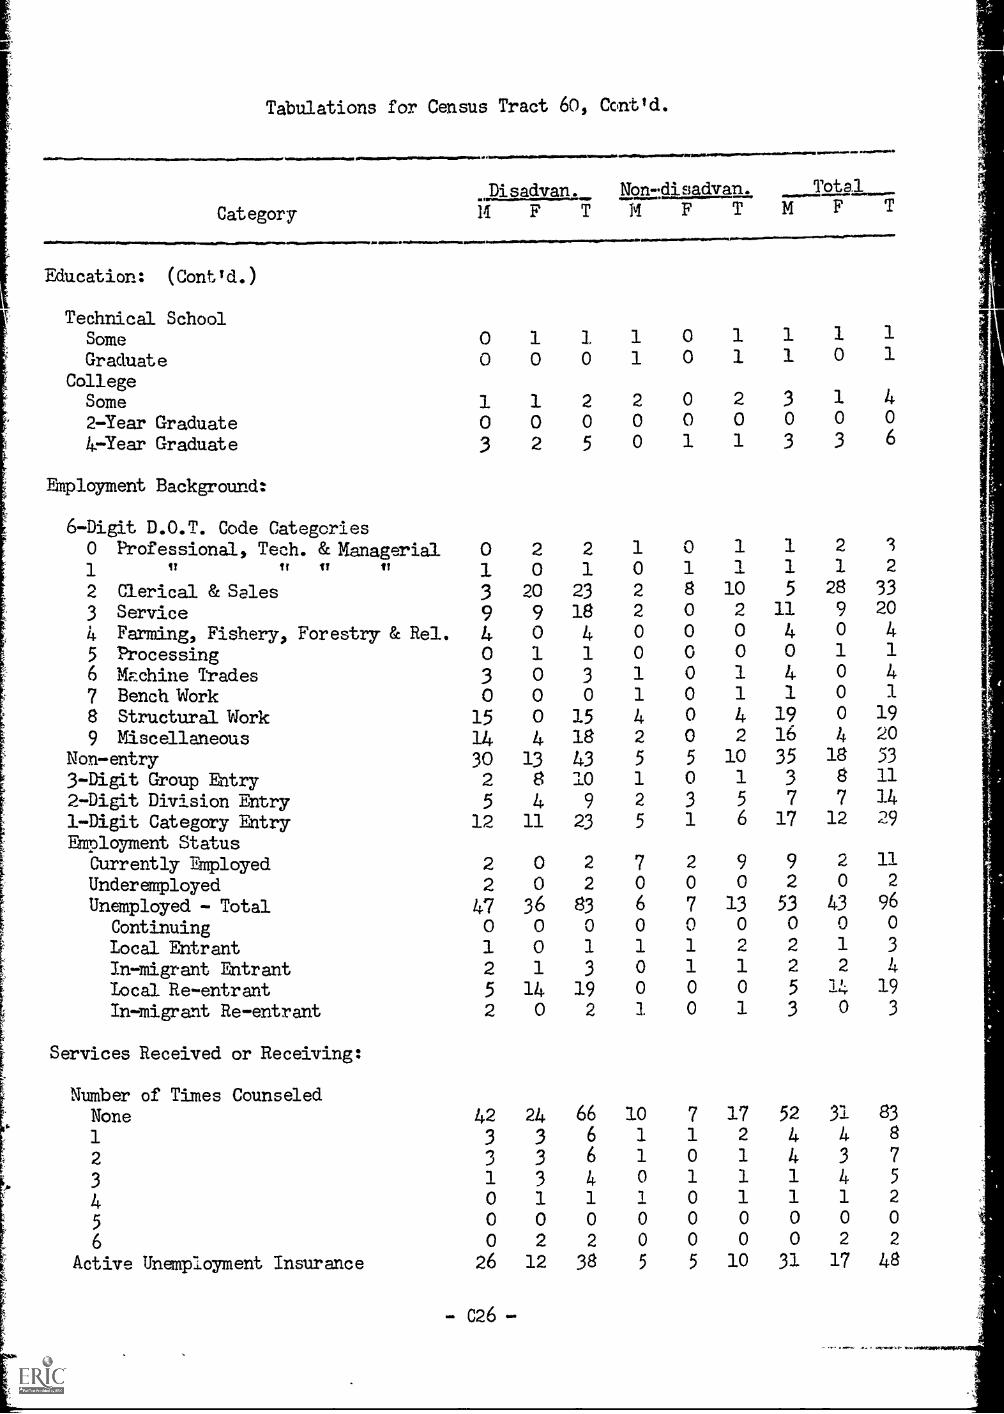
Tabulations for Census Tract 60, Cont td.
ear
Category
Education: (Cont Td.)
Disadvan. Non-;disadvan. Total
14
4111 4.11.......1.10*
Technical SchoolSame 0Graduate 0
CollegeSome 12-Year Graduate 04-Year Graduate 3
Employment Background:
6-Digit D.O.T. Code Categories0 Professional, Tech. &Managrial 01 11 11 11 11 12 Clerical &Sales 33 Service 94 Farming, Fishery, Forestry & Rel. 45 Processing 06 Machine Trades 37 Bench Work 08 Structural Work 159 Miscellaneaus 14
Non-entry 303-Digit Group Ehtry 22-Digit Division Entry 51Digit Category Entry 12Employment Status
Currently Employed 2Underemployed 2Unemployed - Total 47
Continuing 0Local Entrant 1In-migrant Entrant 2local Re-entrant 5
In-migrant Re-entrant 2
Services Received or Receiving:
NuMber of Times CounseledNone 421 3
2 .>.7
3 1
4 0
5 0
6 0
Active Unemployment Insurance 26
-C26-
1 1 1 0 1 1
0 0 1 0 1 1
1 2 2 0 2 3
0 0 0 0 0 0
2 5 0 1 1 3
F T 14 F TMFT
2 2 1 0 1 1
0 1 0 1 1 1
20 23 2 8 10 5
9 18 2 0 2 11
0 4 0 0 0 41 1 0 0 0 00 3 1 0 1 40 0 1 0 1 1
0 15 4 0 4 19
4 18 2 0 2 16
13 43 5 5 10 35
8 10 1 0 1 3
4 9 2 3 5 7
11 23 5 1 6 17
0 2 7 2 9 9
0 2 0 0 0 2
36 83 6 7 13 53
0 0 0 0 0 0
0 1 1 1 n4. 2
1 3 0 1 1 2
14 19 0 0 0 5
0 2 1 0 1 3
24 66 10 7 17 52
3 6 1 1 2 43 6 1 0 1 43 4 0 1 1 1
1 1 1 0 1 1
0 0 0 0 0 0
2 2 0 0 0 0
12 38 5 5 10 31
1 1
0 1
1 40 0
3 6
2 3
1 2
28 339 20
0 41 1
0 40 1
0 194 20
18 538 11
7 1412 29
2 110 2
43 96
31 83
4 8
3 7
4 5
1 2
0 0
2 2
17 48
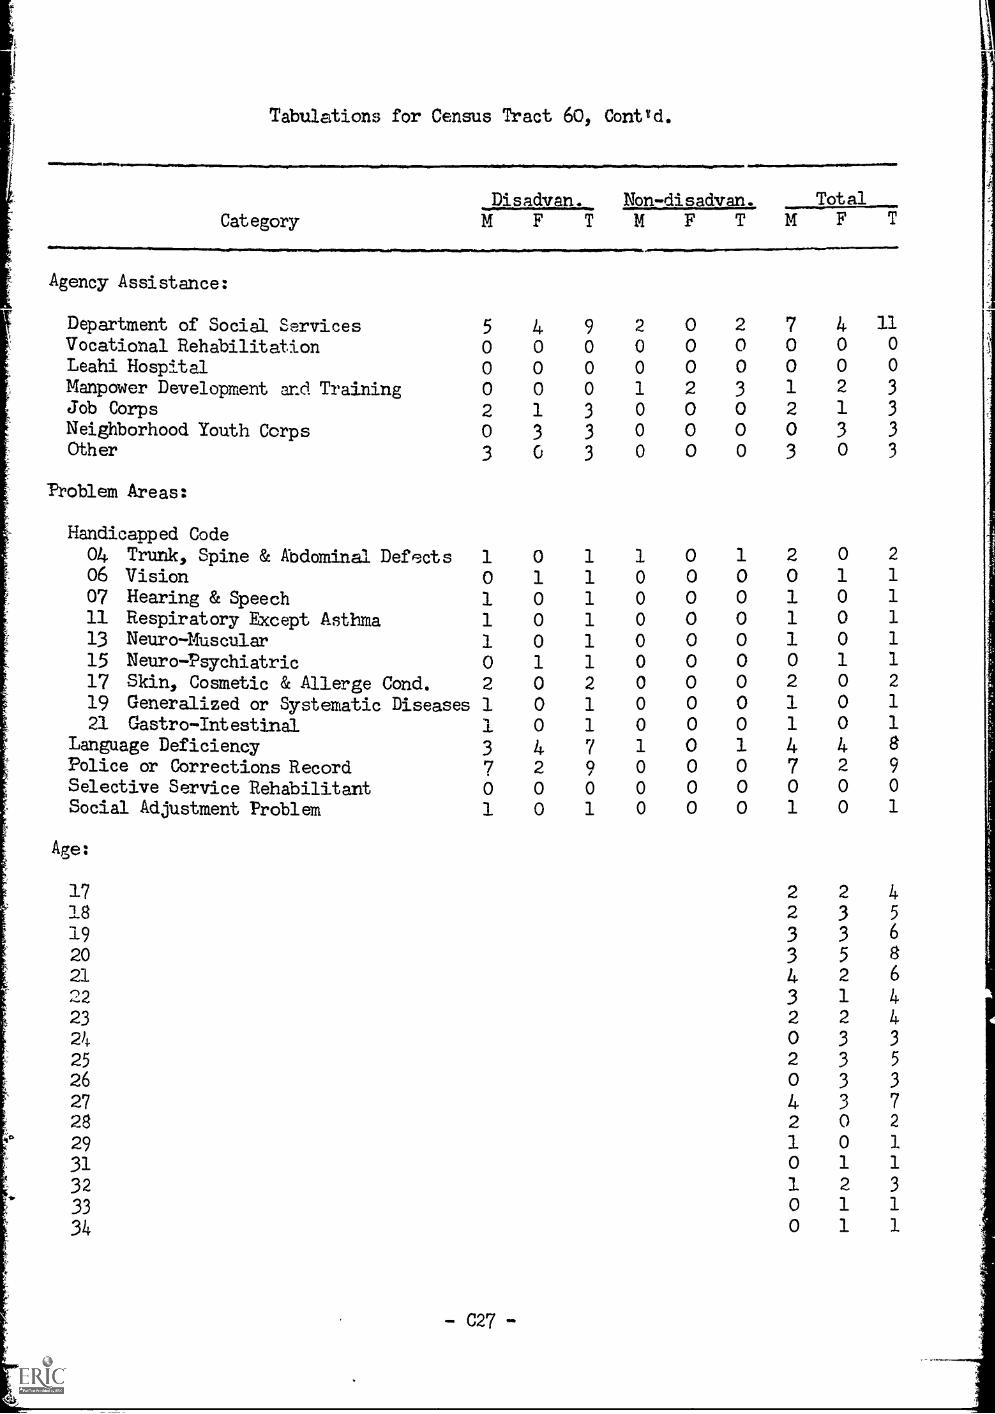
Tabulations for Census Tract 60, ContYd.
.111
CategoryDisadvan. Non-disadvan. TotalM F TMFTMFT
Agenoy Assistance:
Department of Social Services 5 4 9
Vocational Rehabilitation 0 0 0
Leahi Hospital 0 0 0
Manpower Development and Training 0 0 0
Job Corps 2 1 3
Neighborhood Youth Corps 0 3 3
Other 3 0 3
Problem Areas:
Handicapped Code04 Trunk, Spine & Abdominal Defects 1 0 1
06 Vision 0 1 107 Hearing & Speech 1 0 1
11 Respiratory Except Asthma 1 0 1
13 Neuro-Muscular 1 0 115 Neuro-Psychiatric 0 1 1
17 Skin, Cosmetic & Allerge Cond. 2 0 2
19 Generalized or Systematic Diseases 1 0 121 Gastro-Intestinal 1 0 1
Language Deficiency 3 4 7
Police or Corrections Record 7 2 9
Selective Service Rehabilitant 0 0 0
Social Adjustment Problem 1 0 1
Age:
2 00 00 01 20 00 00 0
1 00 00 00 00 00 00 00 00 01 00 00 00 0
2 7 4 11
0 0 0 0
0 0 0 0
3 1 2 3
0 2 1 3
0 0 3 3
0 3 0 3
1 2 0 2
0 0 1 1
0 1 0 1
0 1 0 1
0 1 0 1
0 0 1 1
0 2 0 2
0 1 0 1
0 1 0 1
1 4 4 80 7 2 9
0 0 0 0
0 1 0 1
17 2 2 4
18 2 3 5
19 3 3 6
20 3 5 8
21 4 2 6
22 3 1 4
23 2 2 4
24 0 3 3
25 2 3 5
26 0 3 3
27 4 0> 7
28 2 0 2
29 1 0 1
31 0 1 1
32 1 2 3
33 0 1 1
34 0 1 1
-C27-
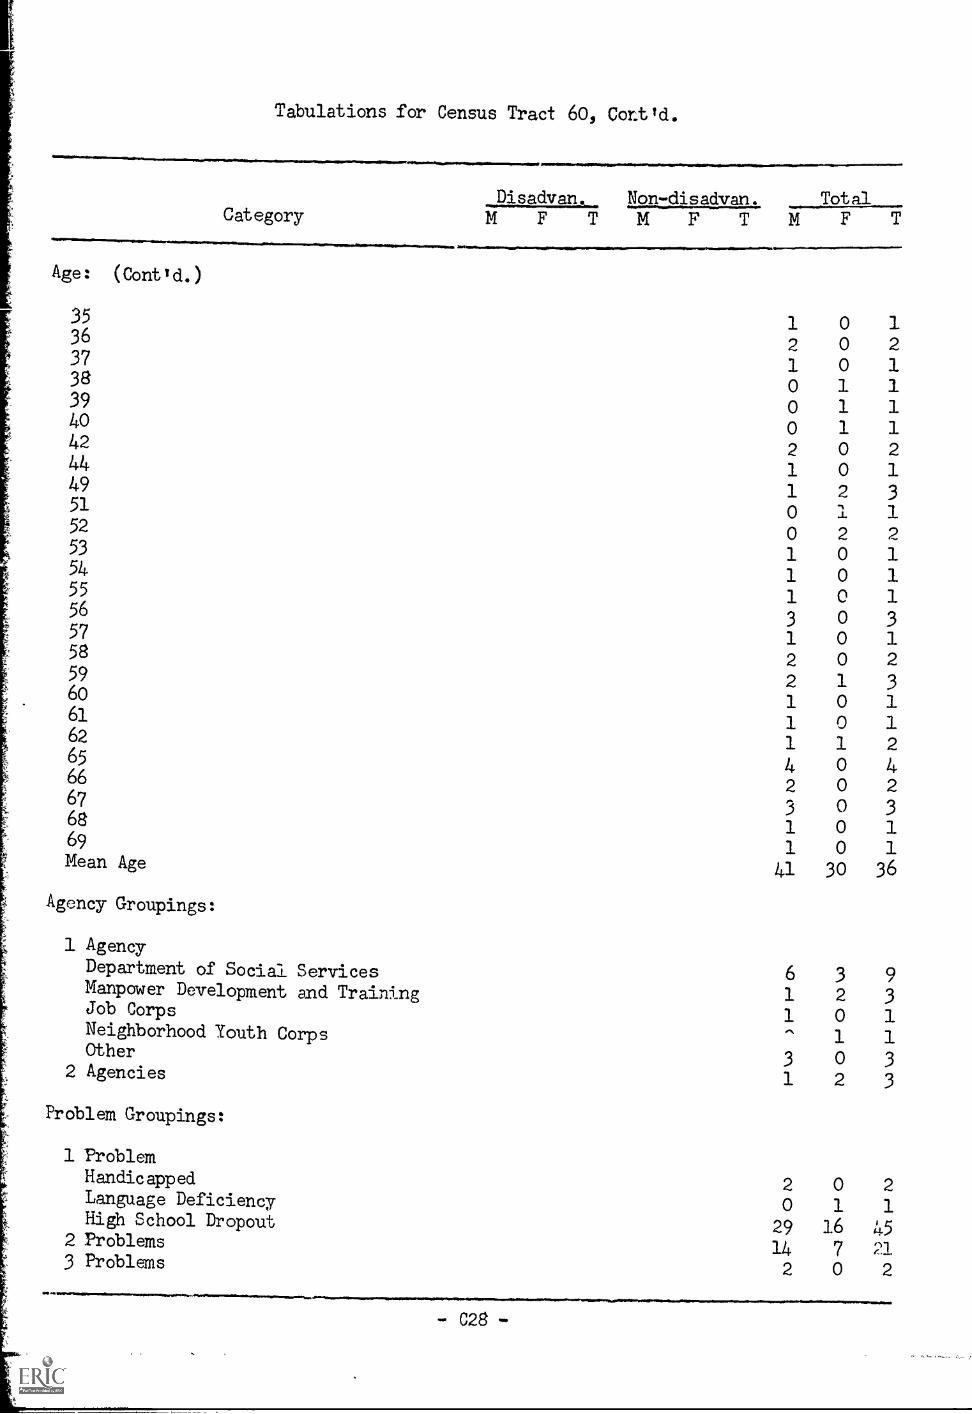
Tabulations for Census Tract 60, CoLt'd.
Disadvan Eatsliaatall,Category MFTMFT Total
F T
Age: (Cont'd.)
35 1 0 136 2 0 237 1 0 138 0 1 139 0 1 140 0 1 142 2 0 244 1 0 149 1 2 351 0 152 0 2 253 1 0 154 1 0 155 1 0 156
3 0 357 1 0 158 2 0 25960
2 10
31
61 1 0 162 1 1 265 4 0 466 2 0 267 3 0 368 1 0 169 1 0 1Mean Age
41 30 36
Agency Groupings:
1 Agency
Department of Social ServicesManpower Development and TrainingJob Corps
Neighborhood Youth CorpsOther
2 Agencies
611
3
1
32
0102
93113
3
Problem Groupings:
1 ProblemHandicapped 2 0 2Language Deficiency 0 1 1Higb School Dropout 29 16 45
2 Problems14 7 21
3 Problems 2 0 2111
-C28-
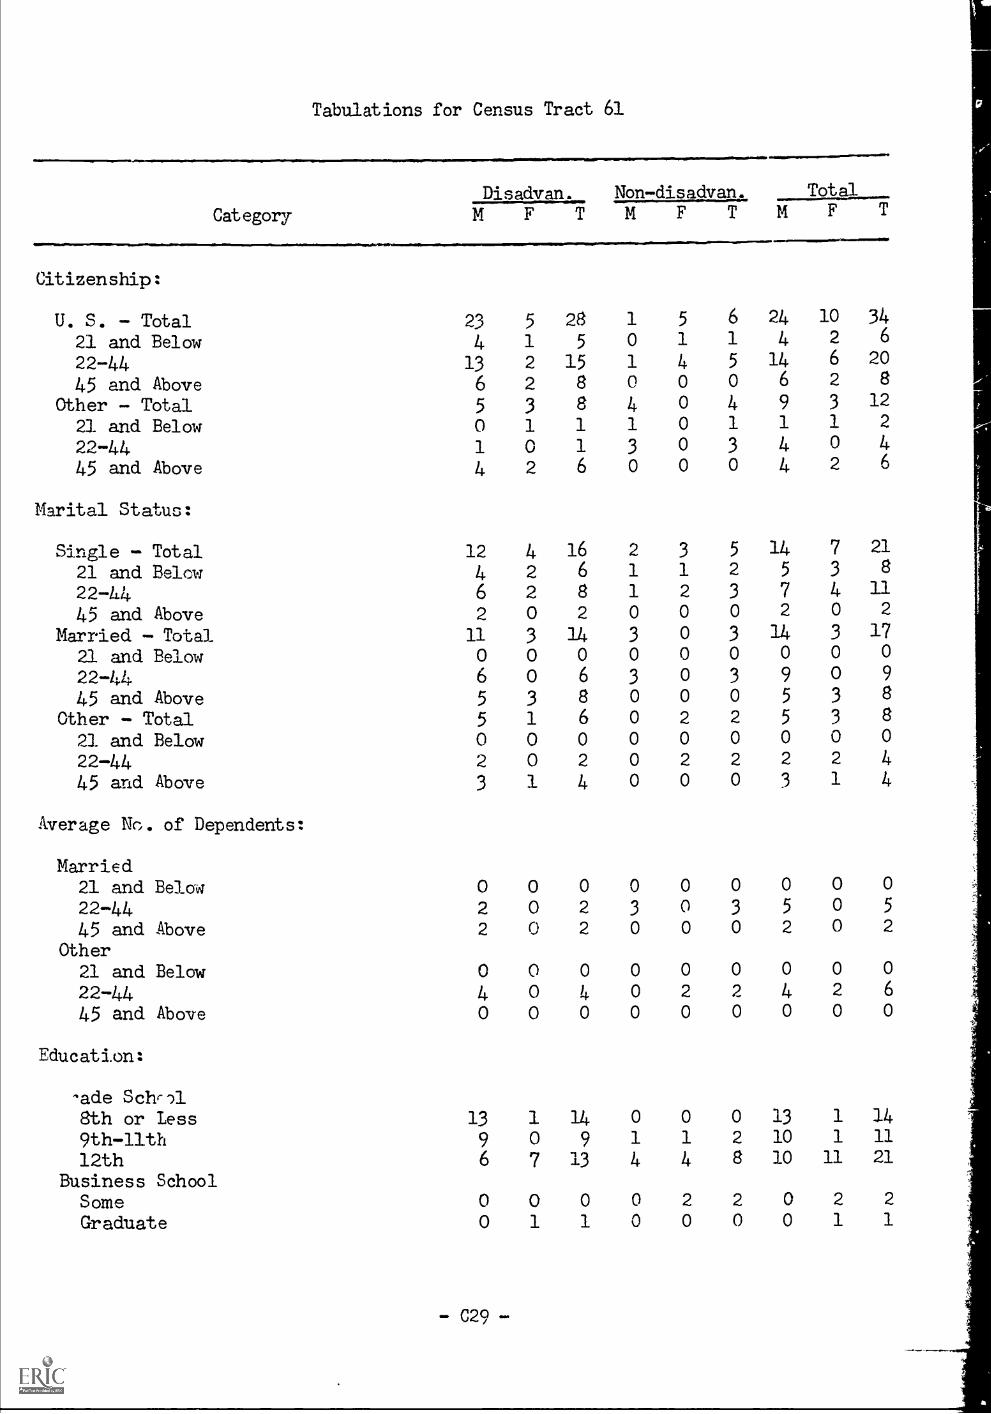
Tabulations for Census Tract 61
Category
Disadvan. Non disadvan. TotalF T
Citizenship:
U. S. Total 23 5 28 1 5 6 24 10 34
21 and Below 4 1 5 0 1 1 4 2 6
22-44 13 2 15 1 4 5 14 6 20
45 and Above 6 2 8 0 0 0 6 2 8
Other Total 5 3 8 4 0 4 9 3 12
21 and Below 0 1 1 1 0 1 1 1 2
22-44 1 0 1 3 0 3 4 0 4
45 and Above 4 2 6 0 0 0 4 2 6
Marital Status:
Single Total 12 4 16 2 3 5 14 7 21
21 and Below 4 2 6 1 1 2 5 3 8
224.4 6 2 8 1 2 3 7 4 11
45 and Above 2 0 2 0 0 0 2 0 2
Married Total 11 3 14 3 0 3 14 3 17
21 and Below 0 0 0 0 0 0 0 0 0
22-44 6 0 6 3 0 3 9 0 9
45 and Above 5 3 8 0 0 0 5 3 8
Other Total 5 1 6 0 2 2 5 3 8
21 and Below 0 0 0 0 0 0 0 0 0
22-44 2 0 2 0 2 2 2 2 4
45 and Above 3 1 4 0 0 0 3 1 4
Average No. of Dependents:
Married21 and Below 0 0 0 0 0 0 0 0 0
22-44 2 0 2 3 0 3 5 0 5
45 and Above 2 0 2 0 0 0 2 0 2
Other21 and Below 0 0 0 0 0 0 0 0 0
22-44 4 0 4 0 2 2 4 2 6
45 and Above 0 0 0 0 0 0 0 0 0
Education:
-ade Schr-)1
8th or Less 13 1 14 0 0 0 13 1 14
9thllth 9 0 9 1 1 2 10 1 11
12th 6 7 13 4 4 8 10 11 21
Business SdhoolSome 0 0 0 0 2 2 0 2 2
Graduate 0 1 1 0 0 0 0 1 1
-C29-
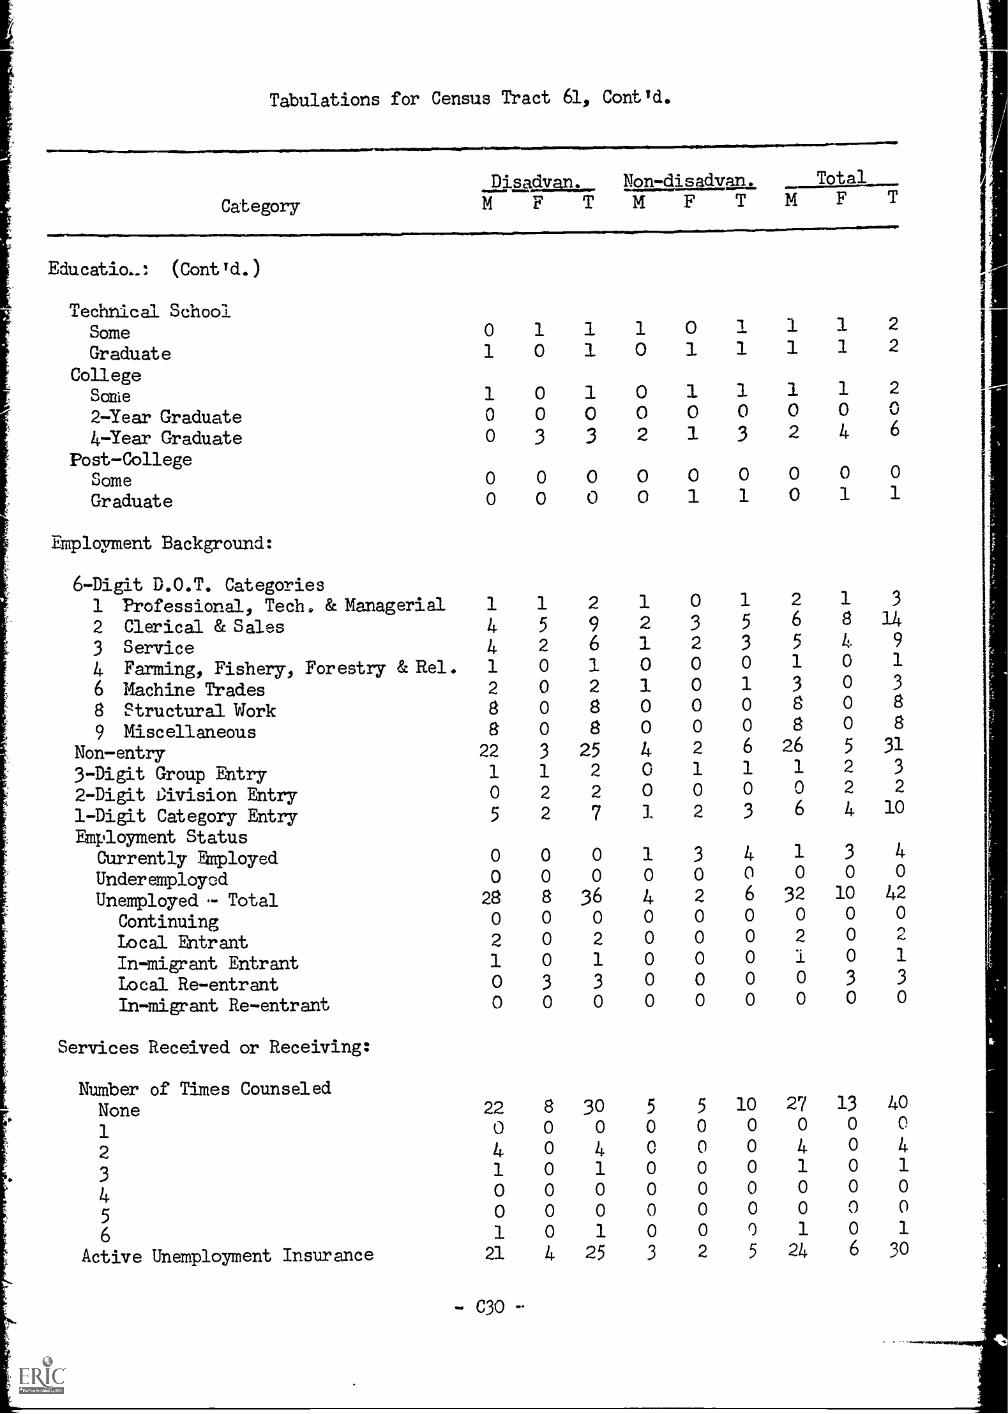
Tdbulations for Census Tract 61, Cont'd.
Category
Disadvan. Non-disadvan. TotalMFTMFTMFTEducatio..: (Cont'd.)
Technical School2Same 0 1 1 1 0 1 1 12Graduate 1 0 1 0 1 1 1 1
College2Same 1 0 1 0 1 1 1 10
2-Year Graduate 0 0 0 0 0 0 0 064-Year Graduate 0 3 3 2 1 3 2 4
Post-CollegeSameGraduate
0
0
0
000
00
01
01
00
01
0
1
Employment Background:
6-Digit D.O.T. Categories1 Professional, Tech. & Managerial2 Clerical &Sales3 Service
4 Farming, Fishery, Forestry &Rel.6 Machine Trades8 Structural Work9 Miscellaneous
Non-entry3-Digit Group Entry2-Digit Division Entry1-Digit Category EntryEmployment Status
Currently EmployedUnderenploycdUnemployed - Total
ContinuingLocal EntrantIn-migrant EntrantLocal Re-entrantIn-migrant Re-entrant
Services Received or Receiving:
Nutter of Times CounseledNone1
2
3
45
6
Active Unemployment Insurance
1 1 2
4 5 9
4 2 61 0 1
2 0 2
8 0 8
8 0 8
22 3 25
1 1 2
0 2 2
5 2 7
0 0 0
0 0 0
28 8 360 0 0
2 0 2
1 0 1
0 3 3
0 0 0
22 8 300 0 0
4 0 4
1 0 1
0 0 0
0 0 0
1 01021 4 25
- C30 --
1 0 1 2 1 3
2 3 5 6 8 14
1 2 3 5 4 9
0 0 0 1 0 1
1 0 1 3 0 3
0 0 0 8 0 8
0 0 0 8 0 8
4 2 6 26 5 31
0 1 1 1 2 3
0 0 0 0 2 2
1 2 3 6 4 10
1 3 4 1 3 4
0 0 0 0 0 0
4 2 6 32 10 42
0
0
0
0
0
0
0
2
0
0
0,4
0 0 0 l 0 1
0 0 0 0 3 3
0 0 0 0 0 0
5 5 10 27 13 40
0 0 0 0 0 0
0 0 0 4 0 40 0 0 1 0 1
0 0 0 0 0 0
0 0 0 0 0 0001013 2 5 24 6 30
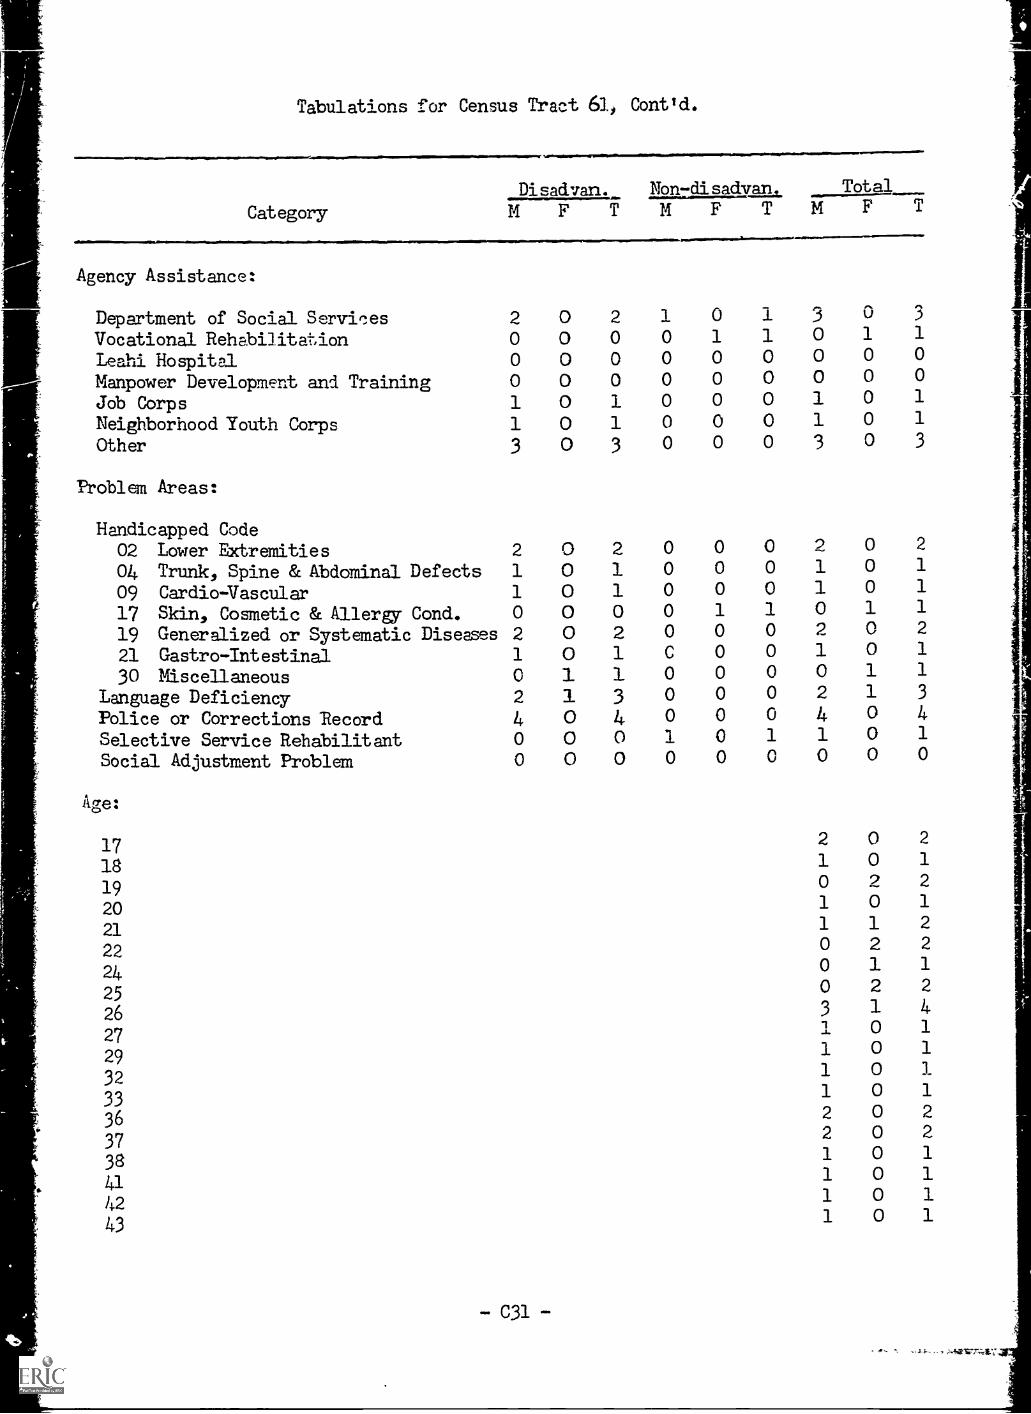
Tabulations -P or Census Tract 61$ Cont d.
Categor-y
Disadvan. Non-disadvan, Total
M F T M F T m F T
Agency Assistance:
Department of Social Servir:es 2 0 2 1 0 1 3 0 3
Vocational Rehabilitation 0 o o o 1 1 0 1 1
Leahi Hospital 0o000000Manpower Development and Training 0 0 0 0 0 0 0 0 0
Job Corps 1 0 1 0 0 0 1 0 1
Neighborhood Youth Carps 1 0 1 0 0 0 1 0 1
Cther 3 0 3 0 0 0 3 0 3
Problem Areas:
Handicapped Code02 Lower Extremities 2 0 2 0 0 0 9 0 2
04 Trunk, Spine &Abdominal Defects 1 0 1 0 0 0 1 0 1
09 Cardio=Vascular 1 0 1 0 0 0 1 0 1
17 Skin, Cosmetic & Allergy Cond. 0 0 0 0 1 1 0 1 1
19 Generalized or Systematic Diseases 2 0 2 0 0 0 2 0 2
21 Gastro-Intestinal 1 0 1 C 0 0 1 0 1
30 Miscellaneous 0 1 1 0 0 0 0 1 1
Language Deficiency 2 1 3 o 0 0 2 1 3
Police or Corrections /ecord 4 0 4. 0 0 0 4 0 4
Selective Service Rehabilitant 0 0 0 1 0 1 1 0 1
Social Adjustment Problem 0 0 0 0 0 0 0 0 0
Age:
17 2 0 2
18 1 0 1
19 0 2 2
20 1 0 1
21 1 1 2
22 0 2 2
240 1 1
25
26
27
29
32
0
3
1
1
21000
2
41
1
1
331 0 1
36 2 0 2
372 0 2
381 o 1
411 o 1
421 o 1
431 o 1
-C31-
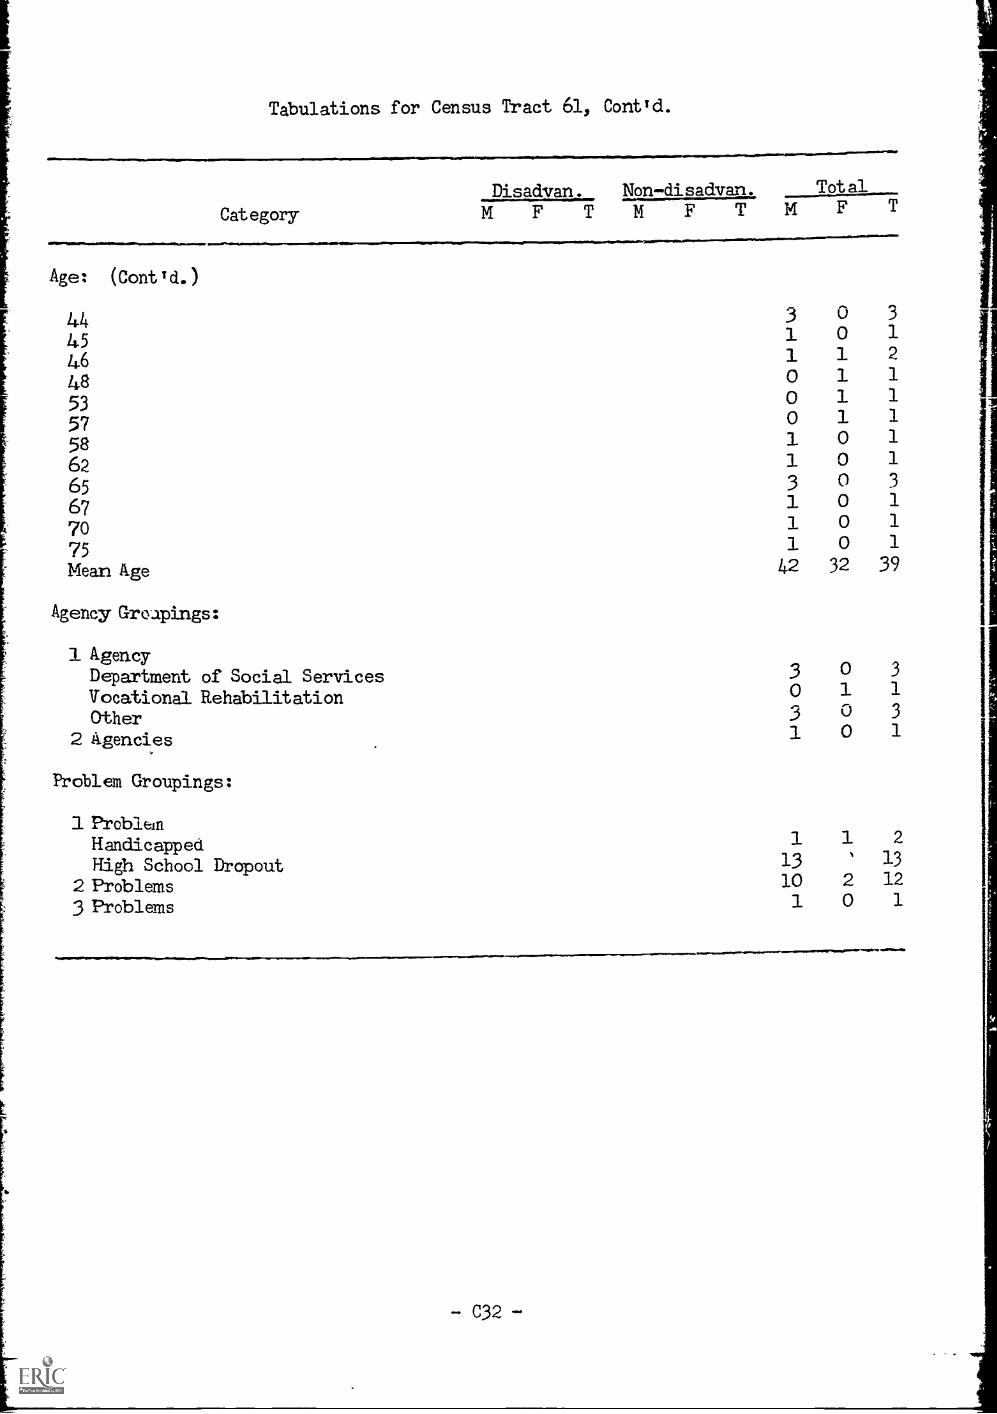
Tabulations for Census Tract 61, Cont'd.
Disadvan. Nondisadvan. TotalCategory MFTMFTMFT
Age: (Cont'd.)
444546485357586265677075Mean Age
Agency Groapings:
311000113111
42
001111000000
32
312111113111
39
1 AgencyDepartment of Social ServicesVocational RehabilitationOther
2 Agencies
Problem Groupings:
1 ProblemHandicappedHigh School Dropout
2 Problems3 Problems
3 0 30 1 1
3 0 31 0 1
1 1 213 ' 1310 2 121 0 1
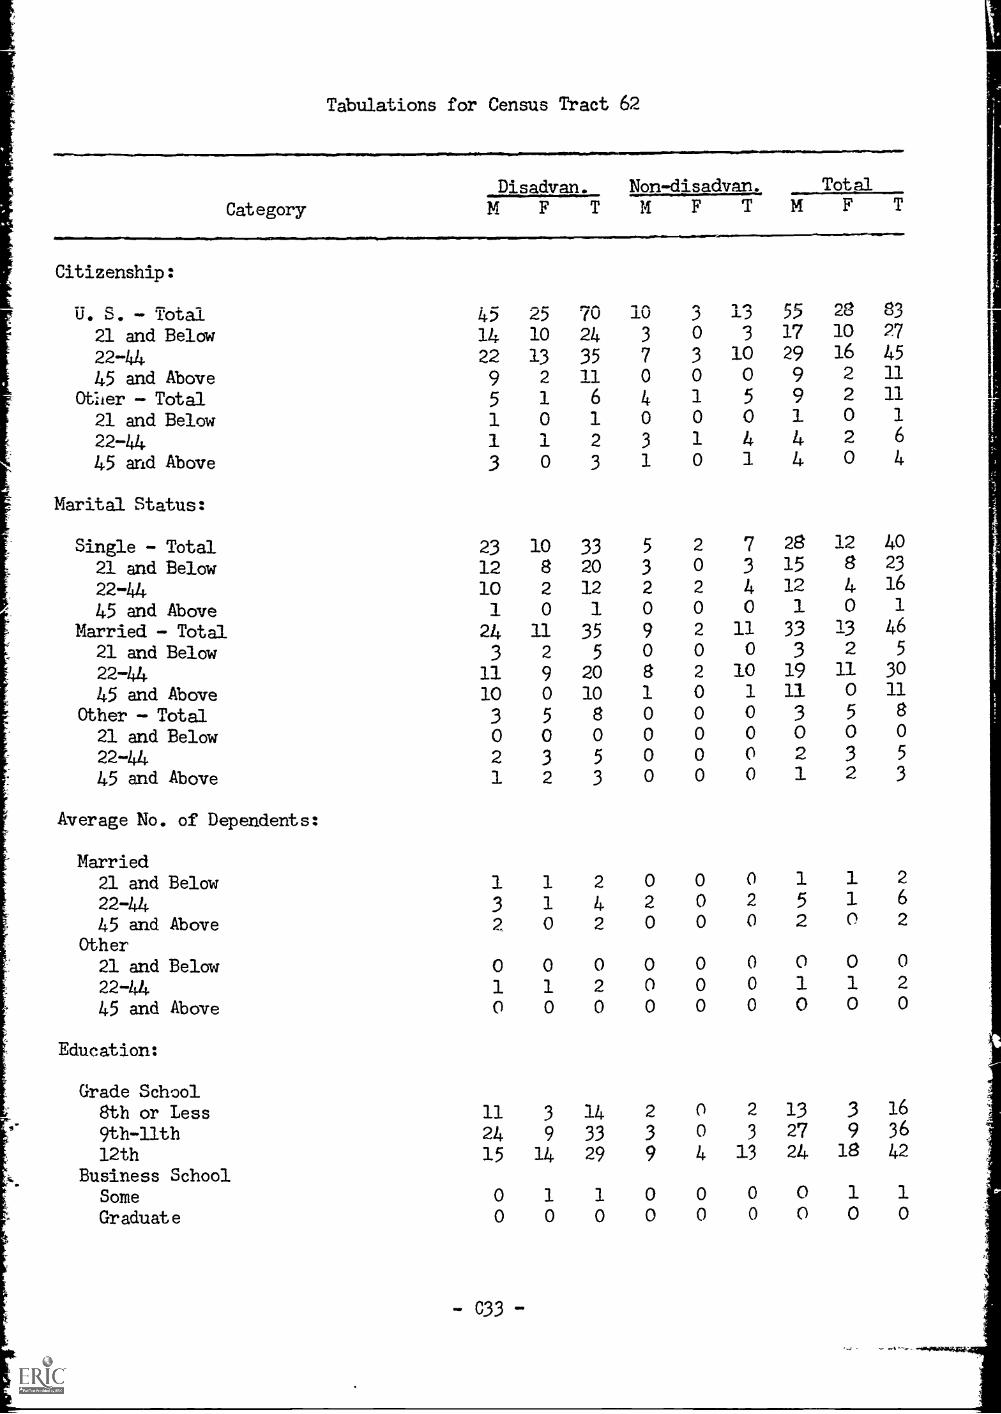
Tabulations for Census Tract 62
Category
Citizenship:
U. S. - Total21 and Below22-4445 and Above
Other - Total21 aad Below22-4445 and Above
Marital Status:
Single - Total21 and Below22-44
45 and AboveMarried - Total
21 and Below22-4445 and Above
Other - Total21 and Below22-44
45 and Above
Average No. of Dependents:
Married21 and Below22-4445 and Above
Other
21 and Below22-44
45 and Above
Education:
Grade School8th or Less9th-llth12th
Business SchoolSome
Graduate
Disadvan. Non-disadvan. Total
T MF TMF
45 25 70 10 3 13 55
14 10 24 3 0 3 17
22 13 35 7 3 10 29
9 2 11 0 0 0 9
5 1 6 4 1 5 9
1 0 1 0 0 0 1
1 1 2 3 1 4 43 0 3 1 0 1 4
23 10 33 5 2 7 28
12 8 20 3 0 3 15
10 2 12 2 2 4 12
1 0 1 0 0 0 1
24 11 35 9 2 11 33
3 2 5 0 0 0 3
11 9 20 8 2 10 19
10 0 10 1 0 1 11
3 5 8 0 0 0 3
0 0 0 0 0 0 0
2 3 5 0 0 0 2
1 2 3 0 0 0 1
1 1 2 0 0 0 1
3 1 4 2 0 2 5
2 0 2 0 0 0 2
0 0 0 0 0 0 0
1 1 2 0 0 0 1
0 0 0 0 0 0 0
11 3 14 2 0 2 13
24 9 33 3 0 3 27
15 14 29 9 4 13 24
0 1 1 0 0 0 00 0 0 0 0 0 0
-C33-
ncfGO u,en
10 27
16 452 11
2 11
0 1
2 6
0 4
12 40
8 23
4 16
0 1
13 462 5
11 30
0 11
5 8
0 0
3 5
2 3
1 2
1 6
0 2
0 0
1 2
0 0
3 16
9 3618 42
1 1
0 0
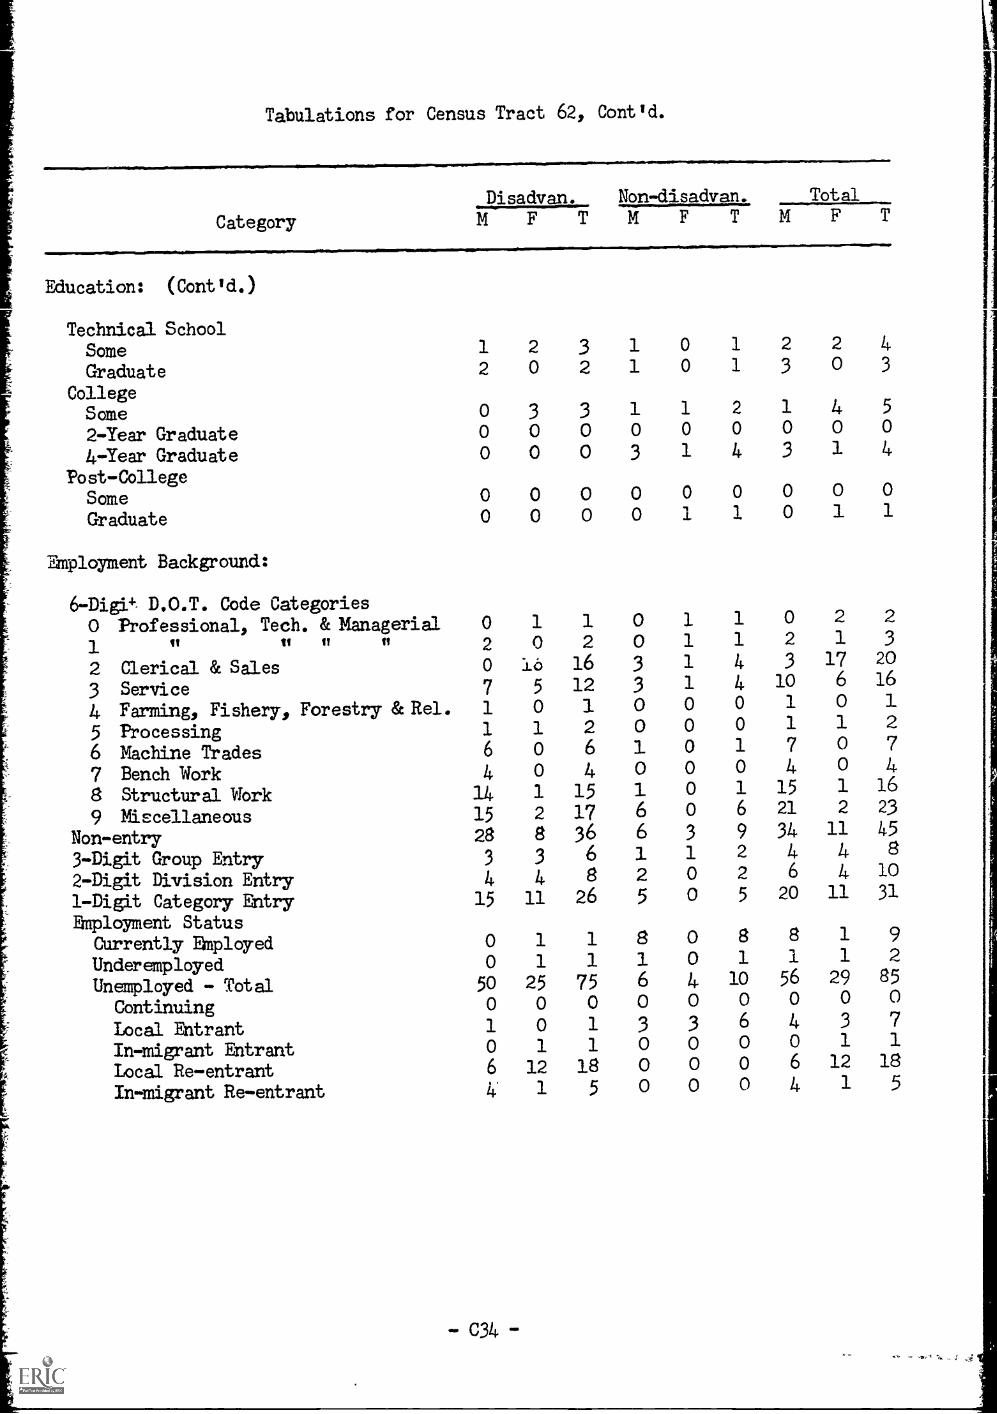
Tabulations for Census Tract 62, Contld.
Category
Disadvan. Non-disadvan.
M F T M F T
Education: (Cont Id. )
Technical SchoolSome 1 2 3 1 0 1
Graduate 2 0 2 1 0 1
CollegeSome 0 3 3 1 1 2
2-Year Graduate 0 0 0 0 0 0
4-Year Graduate 0 0 0 3 1 4
Post-CollegeSame 0 0 0 0 0 0
Graduate 0 0 o 0 1 1
Enrployment Background:
Total
M F T
2 2 43 0 3
1 4 5
0 0 0
3 1 4
0 o o0 1 1
6-Digi.4. D.O.T. Code Categories
0 Professional, Tech. & Managerial 0 1 1 0 1 1 0 2 2
1 it It 11 It 2 0 2 0 1 1 2 1 3
2 Clerical & Sales 0 16 16 3 1 4 3 17 20
3 Service 7 5 12 3 1 4 10 6 16
4 Farming, Fishery, Forestry 81:Rel. 1 0 1 0 0 0 1 0 1
5 Processing 1 1 2 0 0 0 1 1 2
6 Machine Trades 6 0 6 1 0 1 7 0 7
7 Bench Work 4 0 4 0 0 0 4 0 4
8 Structural Work 14 1 15 1 0 1 15 1 16
9 Miscellaneous 15 2 17 6 0 6 21 2 23
Non-entry 28 8 36 6 3 9 34 11 45
3-Digit Group Entry 3 3 6 1 1 2 4 4 8
2-Digit Division Entry 4 4 8 2 0 2 6 4 10
1-Dig# Category Entry 15 11 26 5 0 5 20 11 31
EMploTment StatusCurrently Ehployed 0 1 1 8 o 8 8 1 9
Underemployed 0 1 1 1 0 1 1 1 2
Unemployed - Total 50 25 75 6 4 10 56 29 85
Continuing 0 0 0 0 0 0 0 0 0
Local Entrant 1 0 1 3 3 6 4 3 7
In-migrant Entrant 0 1 1 0 0 0 0 1 1
Local Re-entrant 6 12 18 0 0 0 6 12 18
In-migrant Re-entrant 4 1 5 0 0 0 4 1 5
--c34-
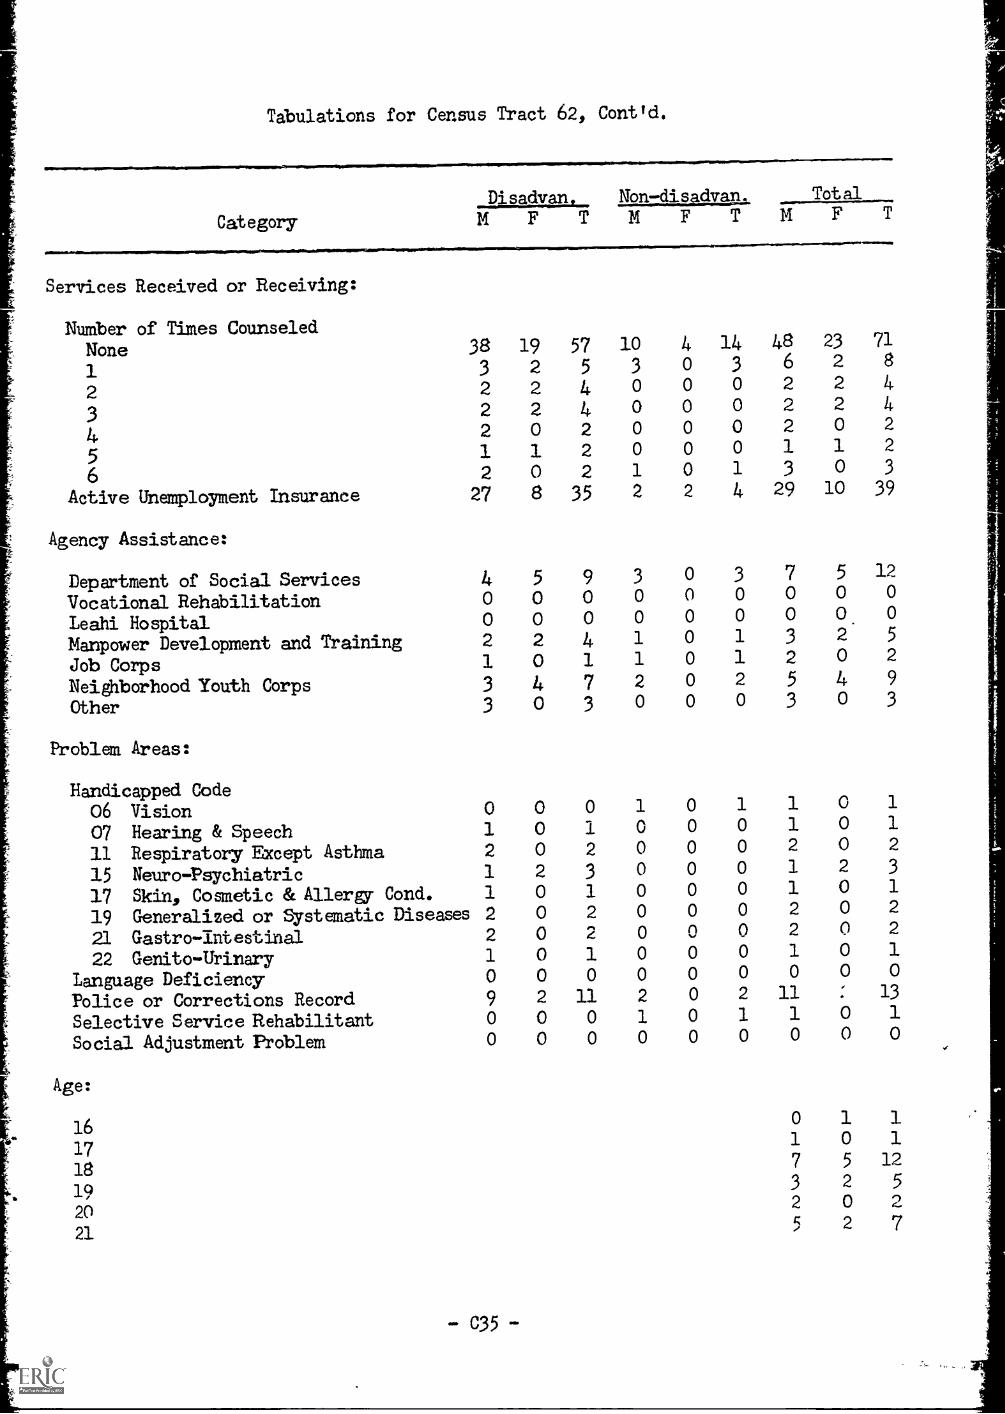
Tabulations for Census Tract 62, Contld.
Non-disadvan. Total
Category MFTMFTMFTServices Received or Receiving:
Nunber of Times CounseledNone 38 19 57 10 4 14 48
1 3 2 5 3 0 3 6
2 2 2 4 0 0
3 2 2 4 0 0
4 2 0 2 0 0
5 1 1 2 0 0
6 2 0 2 1 0
Active UnemplcTment Insurance 27 8 35 2 2
Agency Assistance:
Department of Social ServicesVocatianal RehabilitationLeahi HospitalManpower Development and TrainingJdb CorpsNeighborhood Youth CorpsOther
Problan Areas:
Handicapped Code06 Visioncq Hearing & Speed)
11 Respiratory Except Asthma15 Neuro-Psychiatric17 Skin, Cosnetic & Allergy Cond.
19 Generalized or Systematic Diseases
21 Gastro-Intestinal22 Genito-Urinary
language DeficiencyPolice or Corrections RecordSelective Service RehabilitantSocial Adjustment Problem
Age:
4 5 9 3
0 0 0 0
0 0 0 0
2 2 4 1
1 0 1 1
3 4 7 2
3 0 3 0
0 0 0 1
1 0 1 0
2 0 2 0
1 2 3 0
1 0 1 0
2 0 2 0
2 0 2 0
1 0 1 0
0 0 0 0
9 2 11 2
0 0 0 1
0 0 0 0
0 2
0 2
0 20 11 3
4 29
23 71
2 8
2 4
2 40 2
1 2
0 3
10 39
0 3 7 5 12
0 0 0 0 0
0 0 0 O. 0
0 1 3 2 5
0 1 2 0 2
0 2 5 4 9
0 0 3 0 3
0
0
0
0
0
0
0
0
0
0
0
0
1 10 1
0 2
0 1
0 10 2
0 2
0 1
0 0
2 111 1
0 0
160
171
18 7
193
202
215
-C35-
0 1
0 1
0 2
2 3
0 1
0 2
0 2
0 1
0 0
: 13
0 1
0 0
1 10 1
5 12
2 5
0 2
2 7
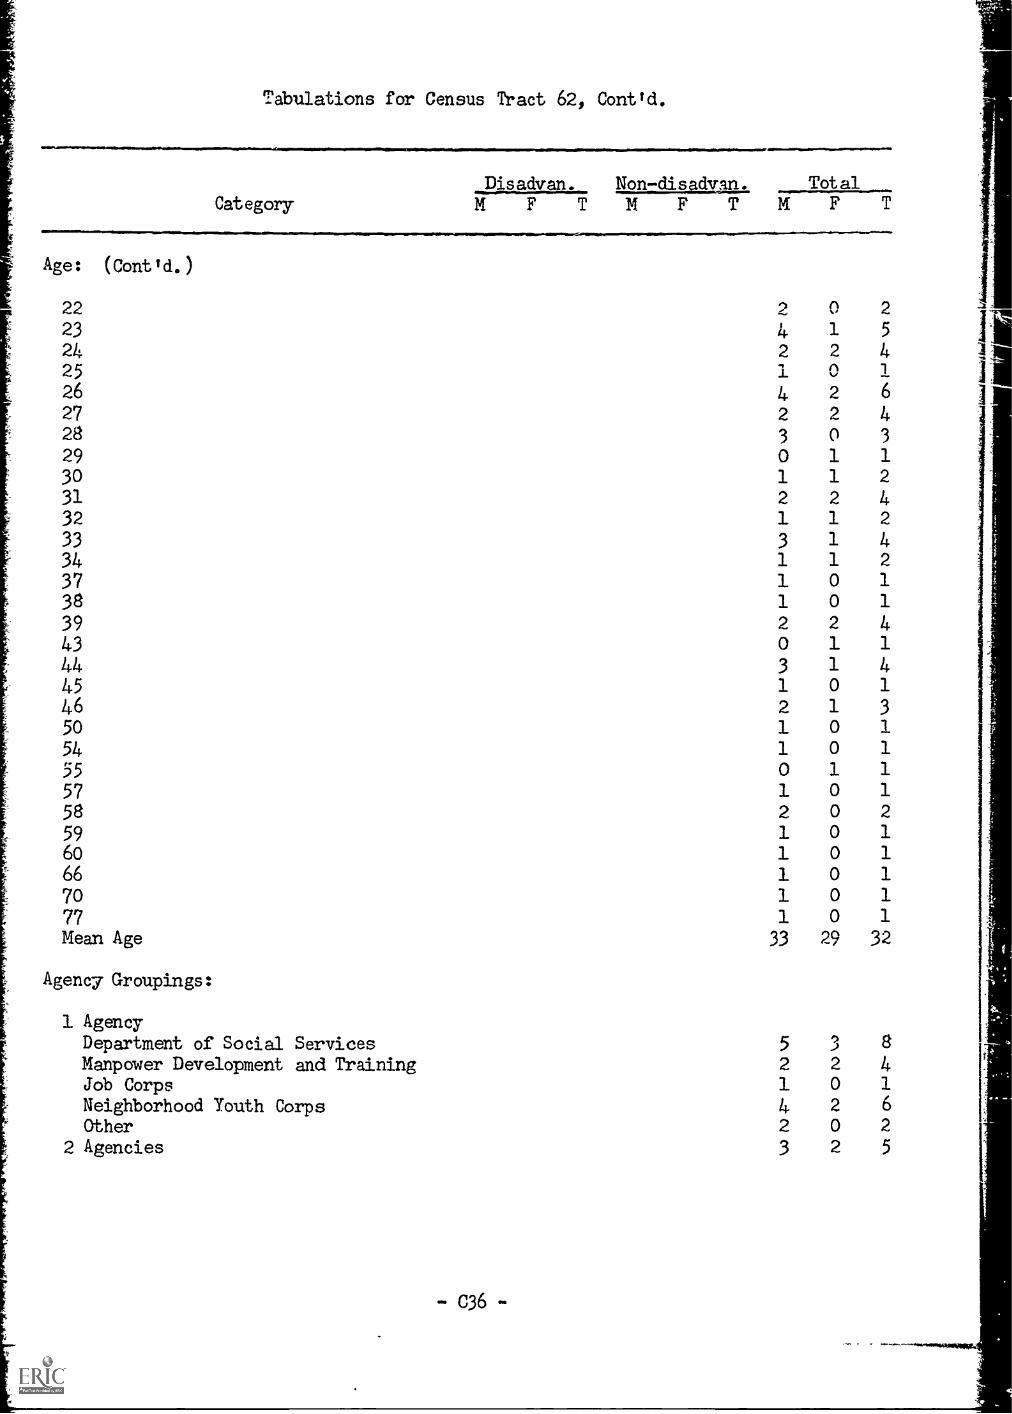
Tabulations for Census Tract 621 Cont'd.
Disadvan. Non-cas calyan. Tot al
Category M F T 14F TMF T
Age: (Cont'd.)
22 2 0 2
23 4. 1 5
24 2 2 425 1 1
26 4 2 6
27 2 2 428 3 0 3
29 0 1 1
30 1 1 2
31 2 2 432 1 1 2
33 3 1 4
34 1 1 2
37 1 o 1
38 1 o 1
39 2 2 4
43 0 1 1
44 3 1 4
45 1 o 1
46 2 1 3
50 1 o
54 1 o 1
55 o 1 1
57 1 o 1
58 2 0 2
59 1 o 1
60 1 o 1
66 1 o 1
70 1 o 1
77 1 o 1
Mean Age 33 29 32
Agency Groupings:
1 AgencyDepartment of Social Services 5 3 8
Manpower Development and Training 2 2 4Job Corps 1 0 1
Neighborhood Youth Corps 4 2 6
Other 2 0 2
2 Agencies 3 2 5
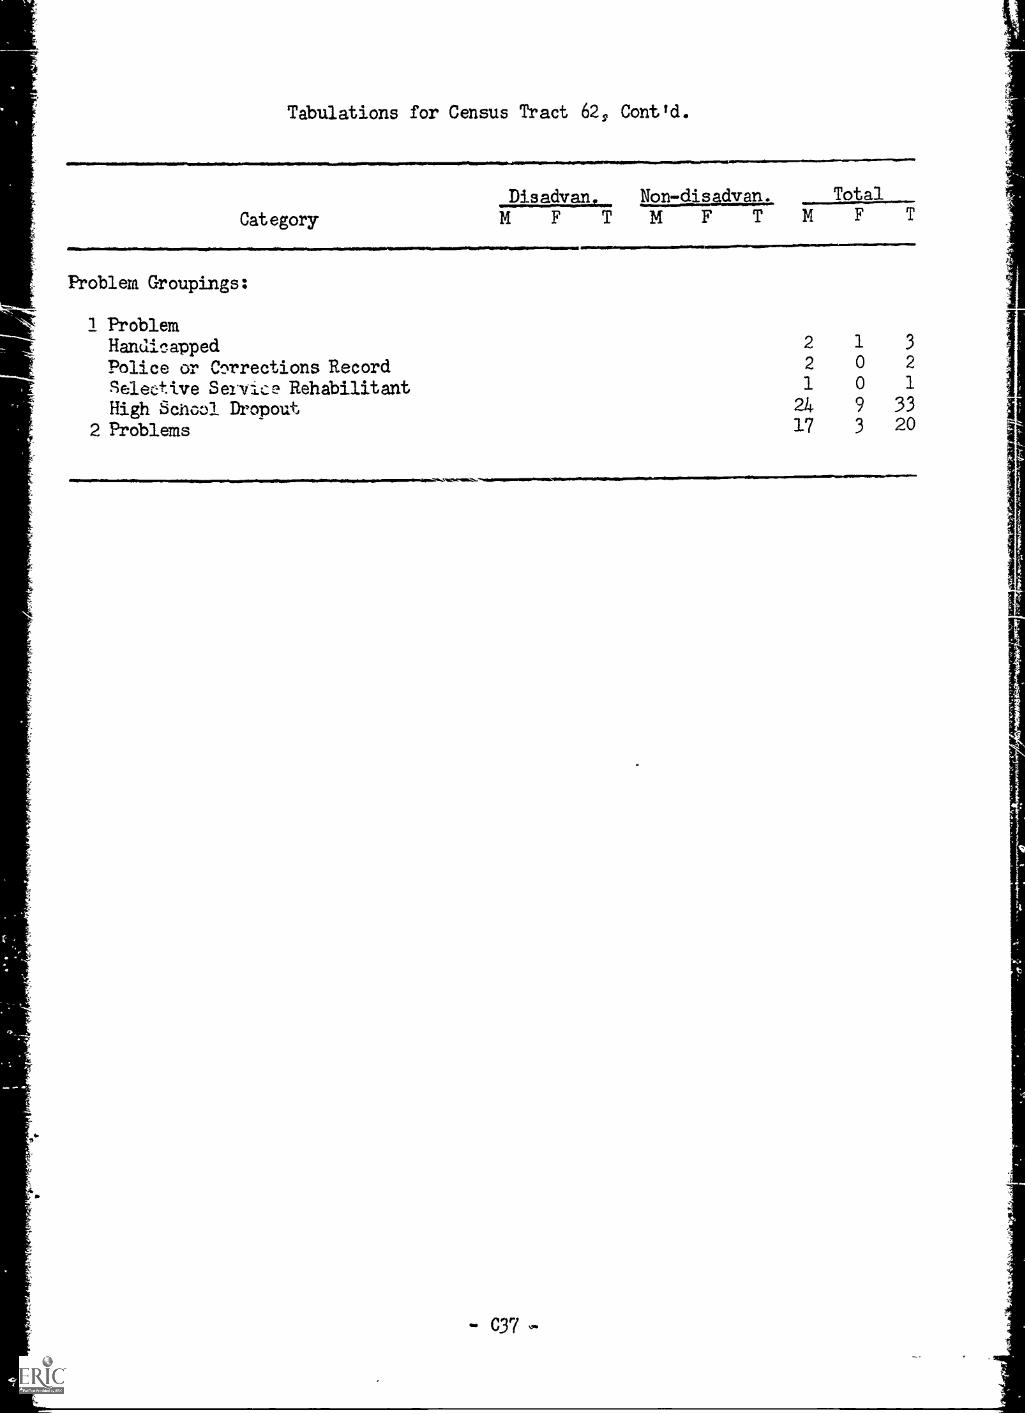
Tabulations for Census Tract 62s, Contfd.
CategoryDiA-adKanm-- Eg=ii1Mtiallu TotalMF TMF T
Problem Groupings:
1 ProblemHandicapped 2 1
Police or Ctirections Record 2 0
Selez;tive Seivice Rehabilitant 1 0
High Sancta Dropout 24 9
2 Problems 17 3
3
2
1
3320
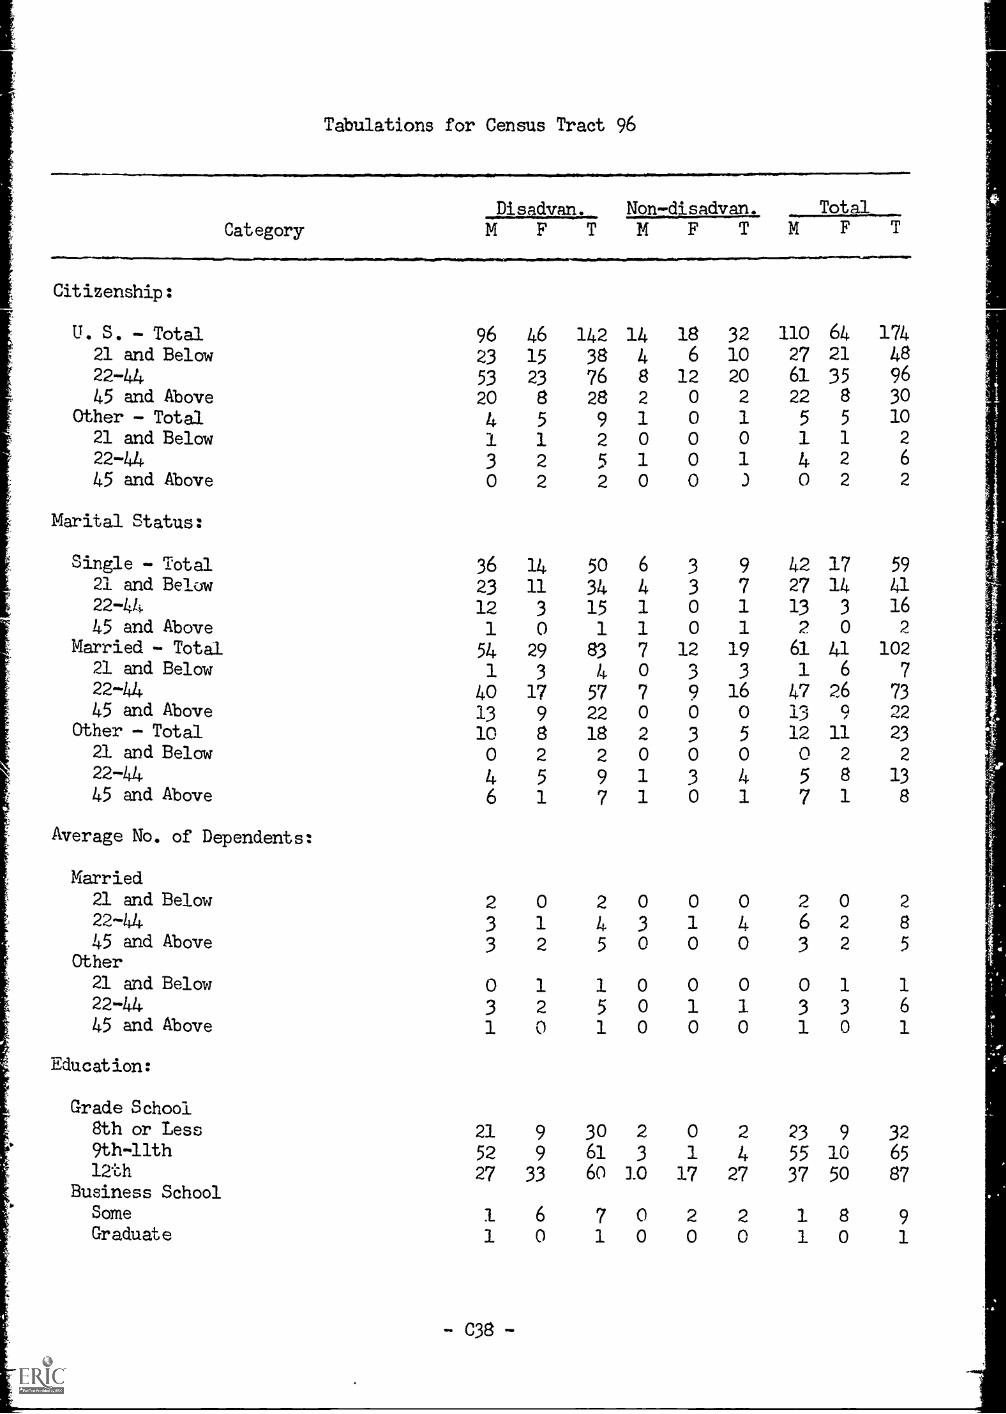
Category
Tabulations for Census Tract 96
Disadvan. Non-disadvan. TotalMFTMFT M F T
Citizenship:
U. S. - Total21 and Below
9623
4615
14238
144
186
3210
11027
6421
17448
22-4445 and Above
Other - Total
5320
4
2385
7628
9
82
1
120
0
202
1
6122
5
358
5
9630
1021 and Below22-44
45 and Above
13
0
1
2
2
2
5
2
0
10
000
0
1
)
140
1
2
2
2
6
2
Marital Status:
Single - Total 36 14 50 6 3 9 42 17 5921 and Below 23 11 34 4 3 7 27 14 41
22-44 12 3 15 1 0 1 13 3 1645 and Above 1 0 1 1 0 1 2 0 2
Married - Total 54 29 83 7 12 19 61 41 10221 and Below 1 3 4 0 3 3 1 6 722-44 40 17 57 7 9 16 47 26 7345 and Above 13 9 22 0 0 0 13 9 22
Other - Total 10 8 18 2 3 5 12 11 2321 and Below 0 2 2 0 0 0 0 2 2
22-44 4 5 9 1 3 4 5 8 1345 and Above 6 1 7 1 0 1 7 1 8
Average No. of Dependents:
Married21 and Below 2 0 2 0 0 0 2 0 2
22-44 3 1 4 3 1 4 6 2 845 and Above 3 2 5 0 0 0 3 2 5
Other21 and Below 0 1 1 0 0 0 0 1 122-44 3 2 5 0 1 1 3 3 6
45 and Above 1 0 1 0 0 0 1 0 1
Education:
Grade School8th or Less 21 9 30 2 0 2 23 9 329th-llth 52 9 61 3 1 4 55 10 6512th 27 33 60 10 17 27 37 50 87
Business SchoolSame 1 6 7 0 2 2 1 8 9Graauate 1 0 1 0 0 0 1 0 1
-C38-
1
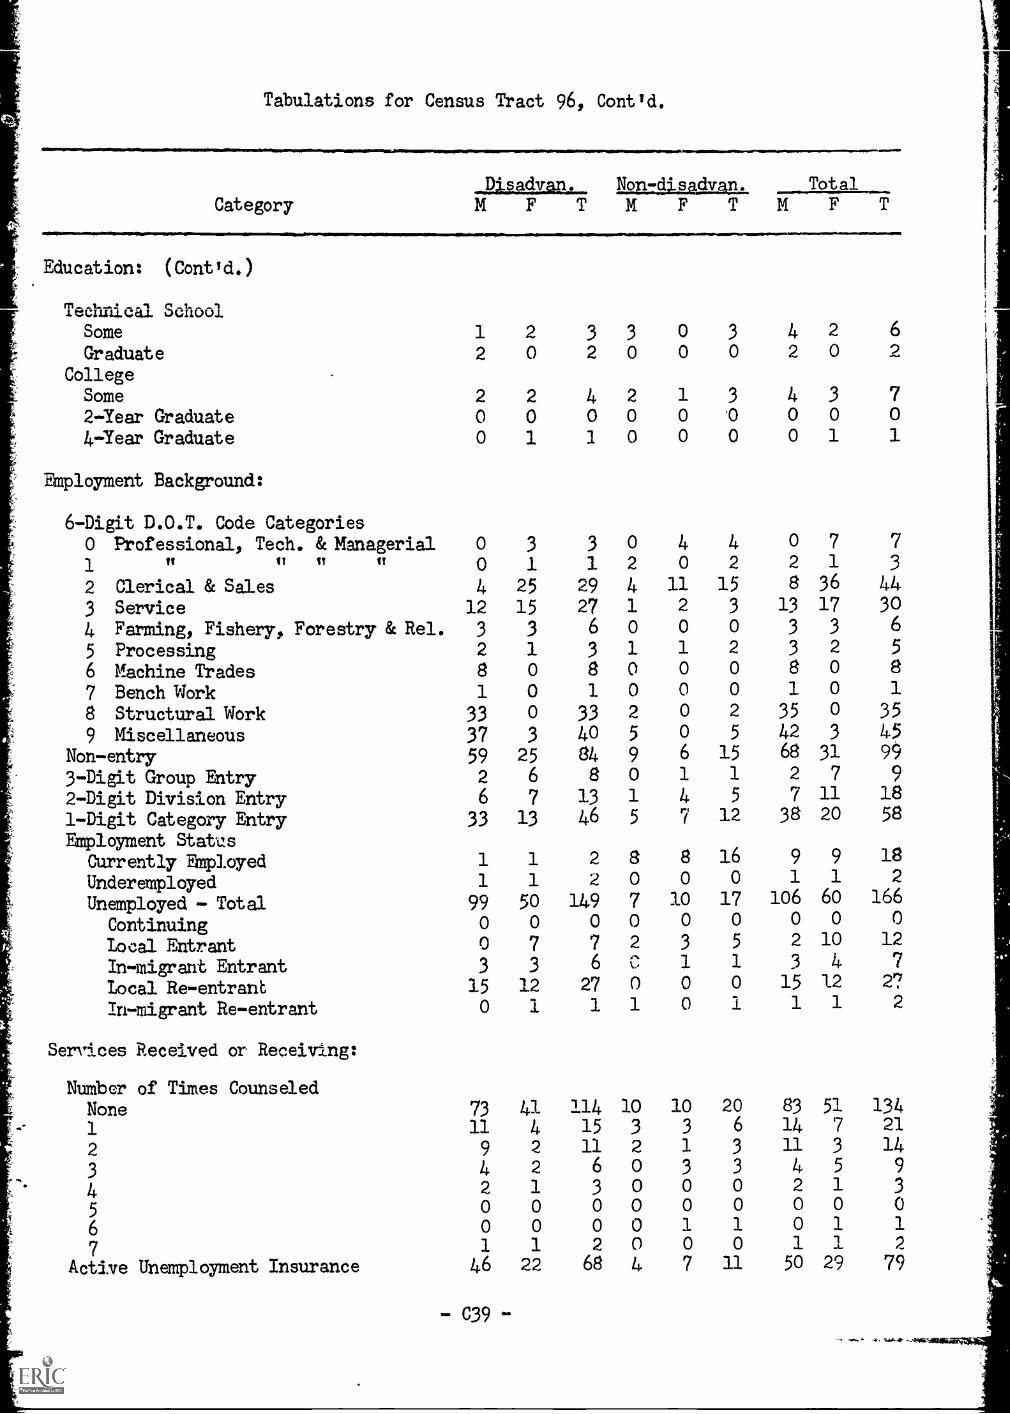
Tabulations for Census Tract 96, Cont'd,
CategoryDj..sadvan. EmazgagiatIL TotalMFTMFTMFT
Education: (Cont
QUILCKLI.
Some 1 2 3 3 0 3 4 2 6
Graduate 2 0 2 0 0 0 2 0 2
CollegeSome 2 2 4 2 1 3 4 3 7
2-Year Graduate 0 0 0 0 0 .0 0 0 0
4.-Iear Graduate 0 1 2 0 0 0 0 1 1
Employment Background:
6-Digit D.O.T. Code Categories0 Professional, Tech. &Managerial 0 3 3 0 4 4 0 7 7
1 n fl It ty 0 1 1 2 0 2 2 1 3
2 Clerical & Sales 4 25 29 4 11 15 8 36 44
3 Service 12 15 27 1 2 3 13 17 30
4 Farming, Fishery, Forestry & Rel. 3 3 6 0 0 0 3 3 6
5 Processing 2 1 3 1 1 2 3 2 5
6 Machine Trades 8 0 8 0 0 0 8 0 8
7 Bench Work 1 0 1 0 0 0 1 0 1
8 Structural Work 33 0 33 2 0 2 35 0 35
9 Miscellaneous 37 3 40 5 0 5 42 3 45
Non-entry 59 25 84 9 6 15 68 31 99
3-Digit Group Entry 2 6 8 0 1 1 2 7 9
2-Digit Division Entry 6 7 13 1 4 5 7 11 18
1-Digit Category Entry 33 13 46 5 7 12 38 20 58
Employment StatasCurrently Employed 1 1 2 8 8 16 9 9 18
Underemployed 1 1 2 0 0 0 1 1 2
Unemployed - Total 99 50 149 7 10 17 106 60 166
Continuing 0 0 0 0 0 0 0 0 0
local Entrant 0 7 7 2 3 5 2 10 12
In-migrant Entrant 3 3 6 C 1 1 3 4 7
Local Re-entrant 15 12 27 0 0 0 15 12 27
In-migrant Re-entrant 0 1 1 1 0 1 1 1 2
Services Received or Receiving:
NuMber of Times CounseledNone 73 41 114 10 10 20 83 51 1341 11 4 15 3 3 6 14 7 21
2 9 2 11 2 1 3 11 3 14
3 4 2 6 0 3 3 4 5 9
4 2 1 3 0 0 0 2 1 3
5 0 0 0 0 0 0 0 0 0
6 0 0 0 0 1 1 0 1 1
7 1 1 2 0 0 0 1 1 2
Active Unemployment Insurance 46 22 68 4 7 11 50 29 79
-C39-
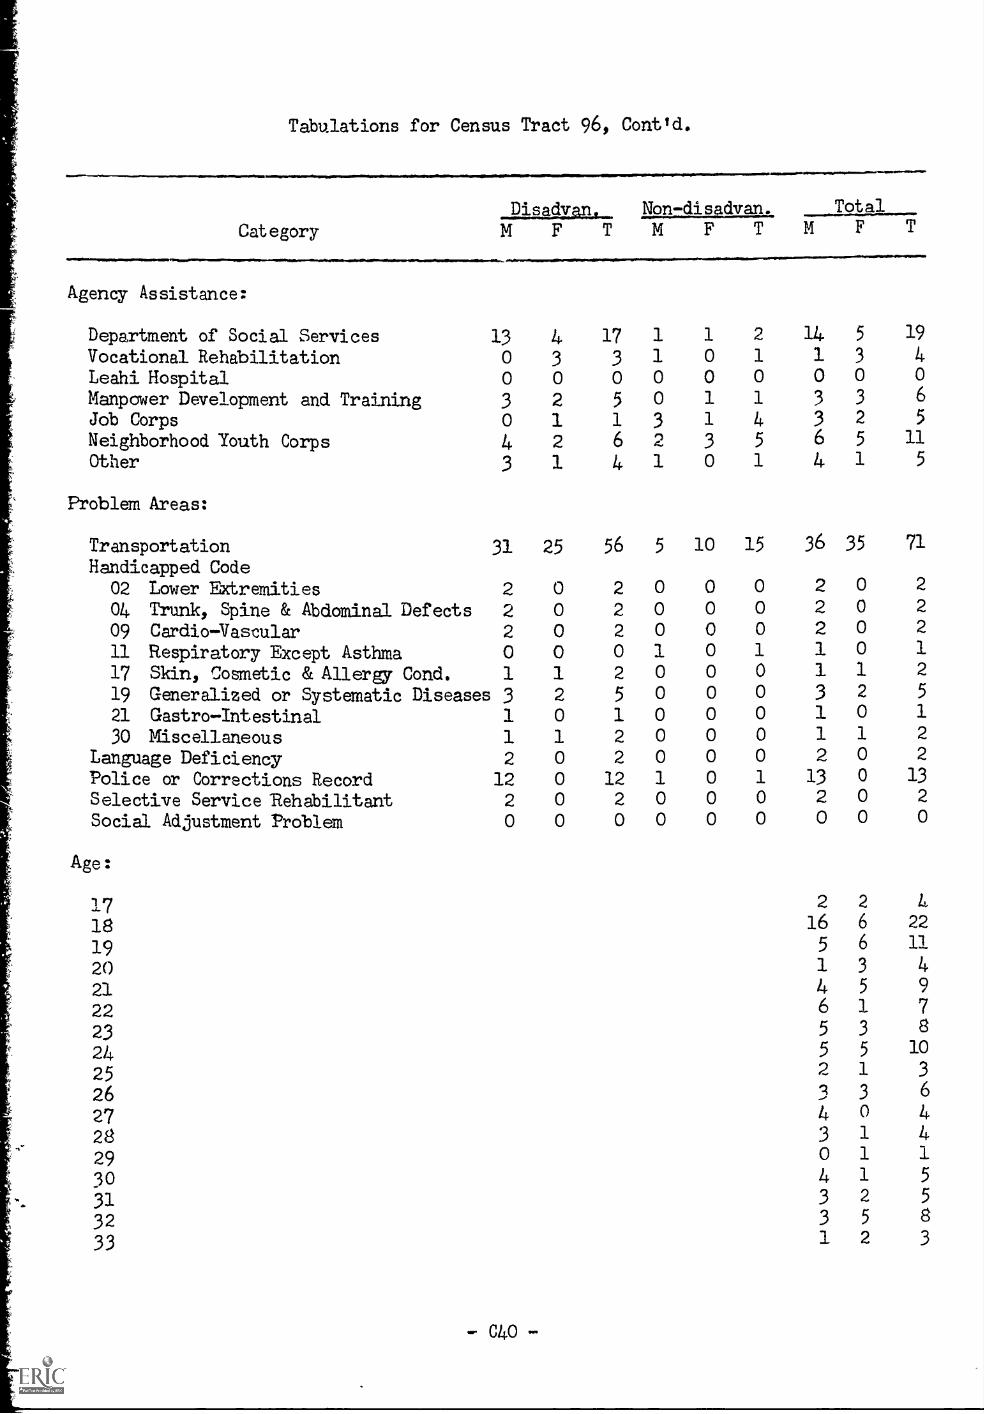
Tabulations for Census Tract 96, Cont'd.
........
Category
1111.11111111111.11111.
Disadvan. nol=cli§Altalaz, TotalMFTMFTMFToft/
Agency Assistance:
Department of Social Services 13 4 17
Vocational Rehdbilitation 0 3 3
Leahi Hospital 0 0 0
Manpower Development and Training 3 2 5
Job Corps 0 1 1
Neighborhood Youth Corps 4 2 6Other 3 1 4
Ptoblem Areas:
Transportation 31 25 56
Handicapped Code02 Lower Extremities 2 0 2
04 Trunk, Spine & Abdominal Defects 2 0 2
09 Cardio-Vascular 2 0 2
11 Respiratory Except Asthma 0 0 0
17 Skin, Cosmetic & Allergy Cond. 1 1 2
19 Generalized or Systematic Diseases 3 2 5
21 Gastro-Intestinal 1 0 1
30 Miscellaneous 1 1 2
Language Deficienay 2 0 2
Police or Corrections Record 12 0 12
Selective Service IUhabilitant 2 0 2
Social Adjustment Problem 0 0 0
Age:
17181920212223
2425
26272829303132
33
-C40-
1 1 2 14
1 0 1 10 0 0 00 1 1 3
3 1 4 3n,.. 3 5 6
1 0 1 4
5 10 15 36
0 0 0 2
0 0 0 2
0 0 0 2
1 0 1 1
0 0 0 10 0 0 3
0 0 0 1
0 0 0 1
0 0 0 2
1 0 1 13
0 0 0 2
0 0 0 0
5 19
3 40 0
3 6
2 5
5 11
1 5
35 71
0 2
0 2
0 2
0 1
1 2
2 5
0 1
1 2
0 2
0 13
0 2
0 0
2 2 L16 6 22
5 6 11
1 3 4
4 5 96 1 75 3 85 5 10
2 1 3
3 3 6
4 0 43 1 40 1 1
4 1 5
3 2 5
3 5 8
1 2 3
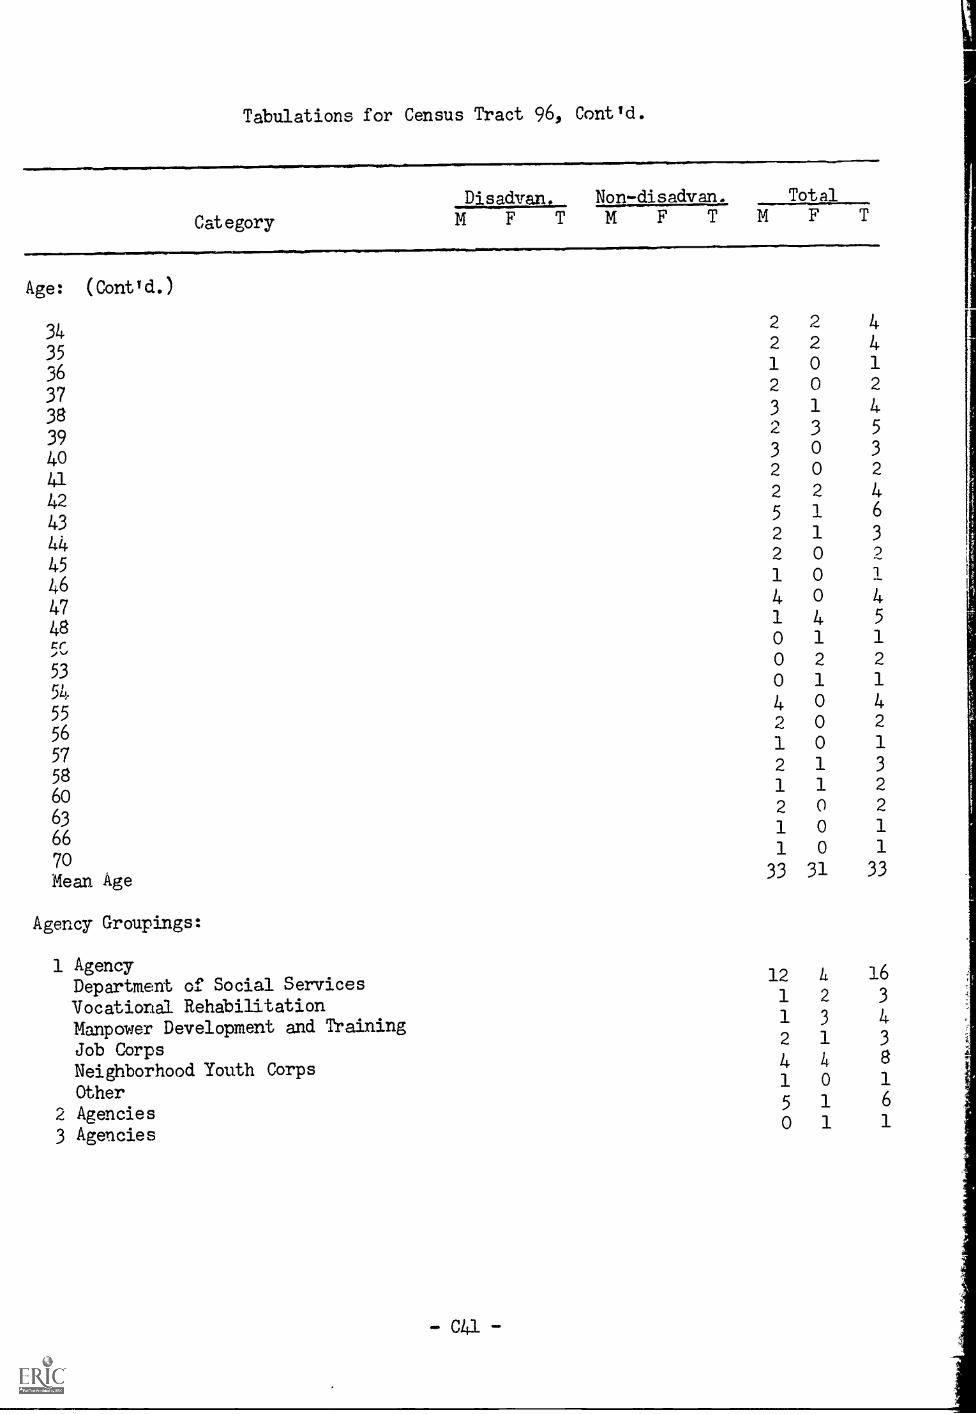
Tabulations for Census Tract 96, Contld.
Disadvan Non-disadvan. Total
Category MFTMFTMFTAge: ( Cont d. )
342 2 4
352 2 4
361 0 1
372 0 2
383 1 4
393 5
403 0 3
412 0 2
422 2 4
435 1 6
442 1 3
452 0 2
461 0 1
474 0 4
481 4 5
5C0 1 1
530 2 2
540 1 1
554 0 4
562 0 2
571 0 1
582 1 3
601 1 2
632 0 2
661 0 1
701 0 1
Mean Age 33 31 33
Agency Groupings:
1 AgencyDepartment of Social Services
12 h 16
Vocational Rehabilitation1 2 3
Manpower Development and Training1 3 4
Job Corps2 1 3
Neighborhood Youth Corps4 4 8
Other1 0 1
2 Agencies5 1 6
3 Agencies0 1 1
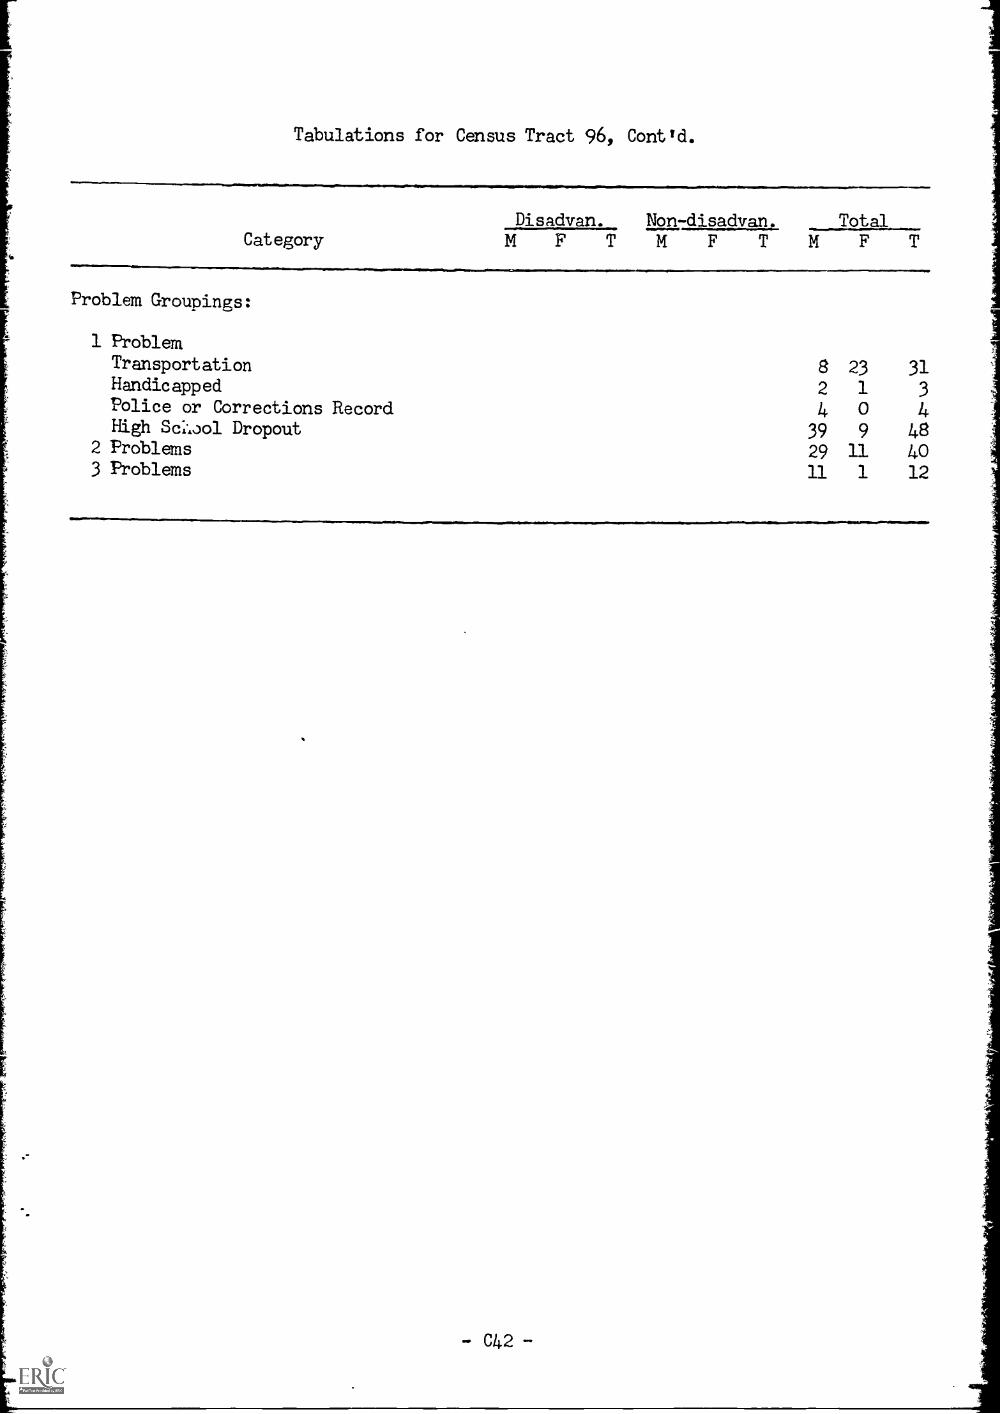
Tabulations for Census Tract 96, Cont'd.
CategoryDisadvan. Non-disadvan. TotalM F T M F T M F T
Problem GroupinRs:
1 Problem
Transportation 8 23 31Handicapped 2 1 3Police or Corrections Record 4 0 4High Scl.,00l Dropout 39 9 48
2 Problems 29 11 403 Problems 11 1 12
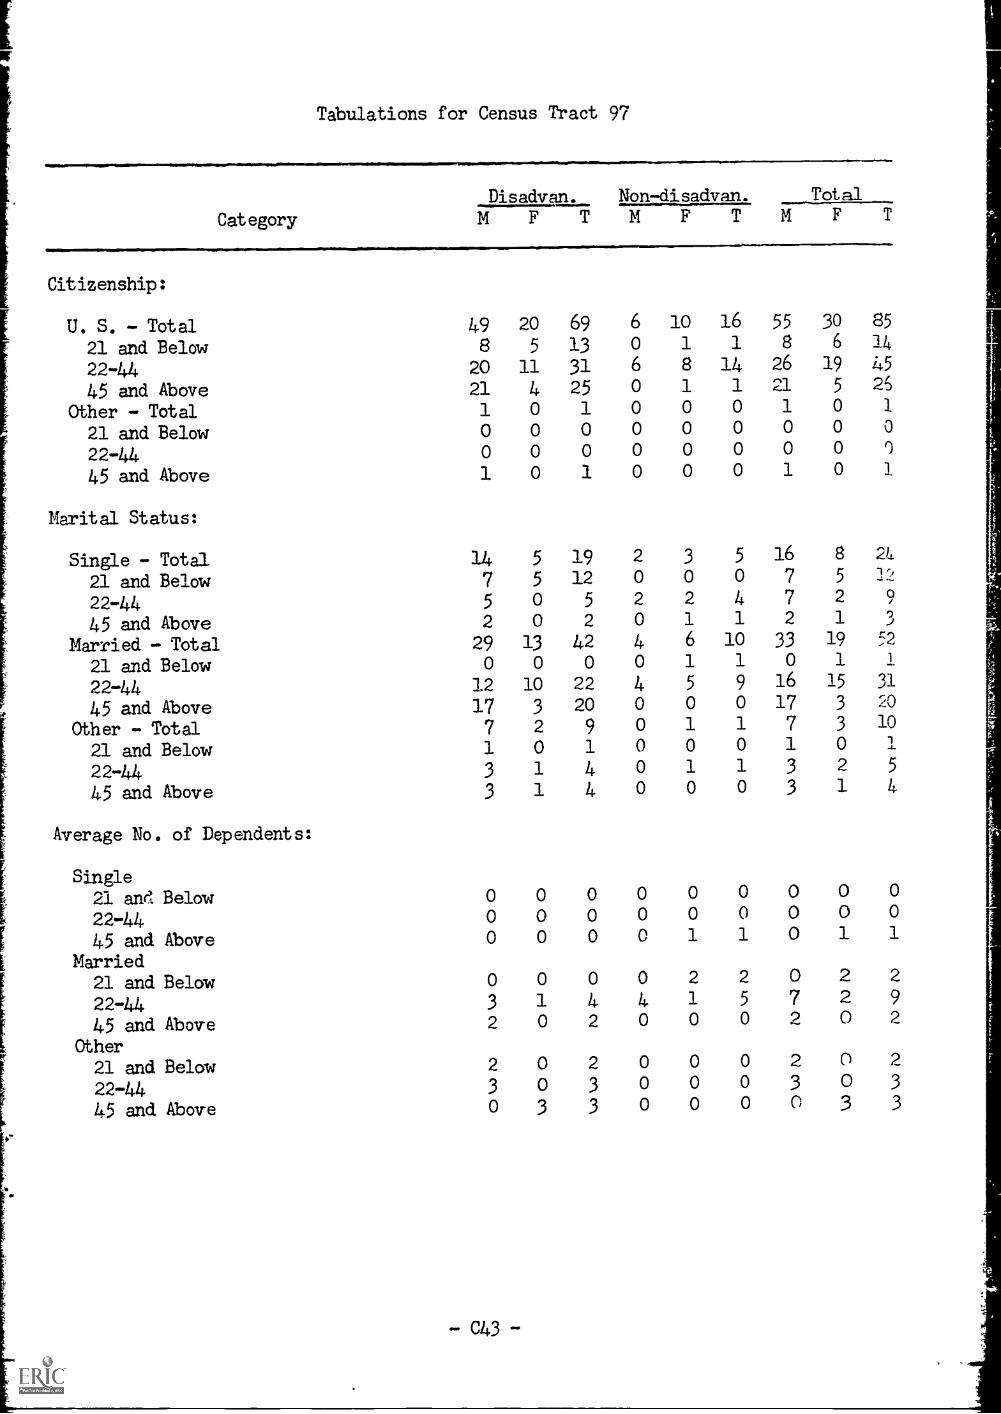
Tabulations for Census Tract 97
Category
Disadvan. Non-disadvan. Total
20 69
5 13
11 314 250 1
0 0
0 0
0 1
MFTMFTMFTCitizenship:
U. S. - Total 4921 and Below 8
22-44 20
45 and Above 21
Other - Total 1
21 and Below 0
22-44 0
45 and Above 1
Marital Status:
Single - Total 14
21 and Below 7
22-44 5
45 and Above 2
Married - Total 29
21 and Below 0
22-44 12
45 and Above 17Other - Total 7
21 and Below 1
22-44 3
45 and Above 3
Average No. of Dependents:
Single
21 ane. Below
22-4445 and Above
Married21 and Belaw22-44
45 and AboveOther21 and Belaw22-4445 and Above
5 195 120 5
0 2
13 420 0
10 223 202 9
0 1
1 4
1 4
0 0 0
0 0 0
0 0 0
0 0 0
3 1 4
2 0 2
2 0 2
3 0 30 3 3
-C43-
6 10 16 55 30 85
0 1 1 8 6 24
6 8 14 26 19 45
0 1 1 21 5 25
0 0 0 1 0 1
0 0 0 0 0 0
0 0 0 0 0 0
0 0 0 1 0 1
2 3 5 16 8
0 0 0 7 5 12
2 2 4 7 2 9
0 1 1 2 1 0
4 6 10 33 19 52
0 1 1 0 1 1
4 5 9 16 15 31
0 0 0 17 3 20
0 1 1 7 3 10
0 0 0 1 0 1
0 1 1 3 2 5
0 0 0 3 1 4
0 0 0 0 0 0
0 0 0 0 0 0
0 1 1 0 1 1
0 2 2 0 2 2
4 1 5 7 2 9
0 0 0 2 0 2
0 0 0 2 0 2
0 0 0 3 0 3
0 0 0 0 3 3
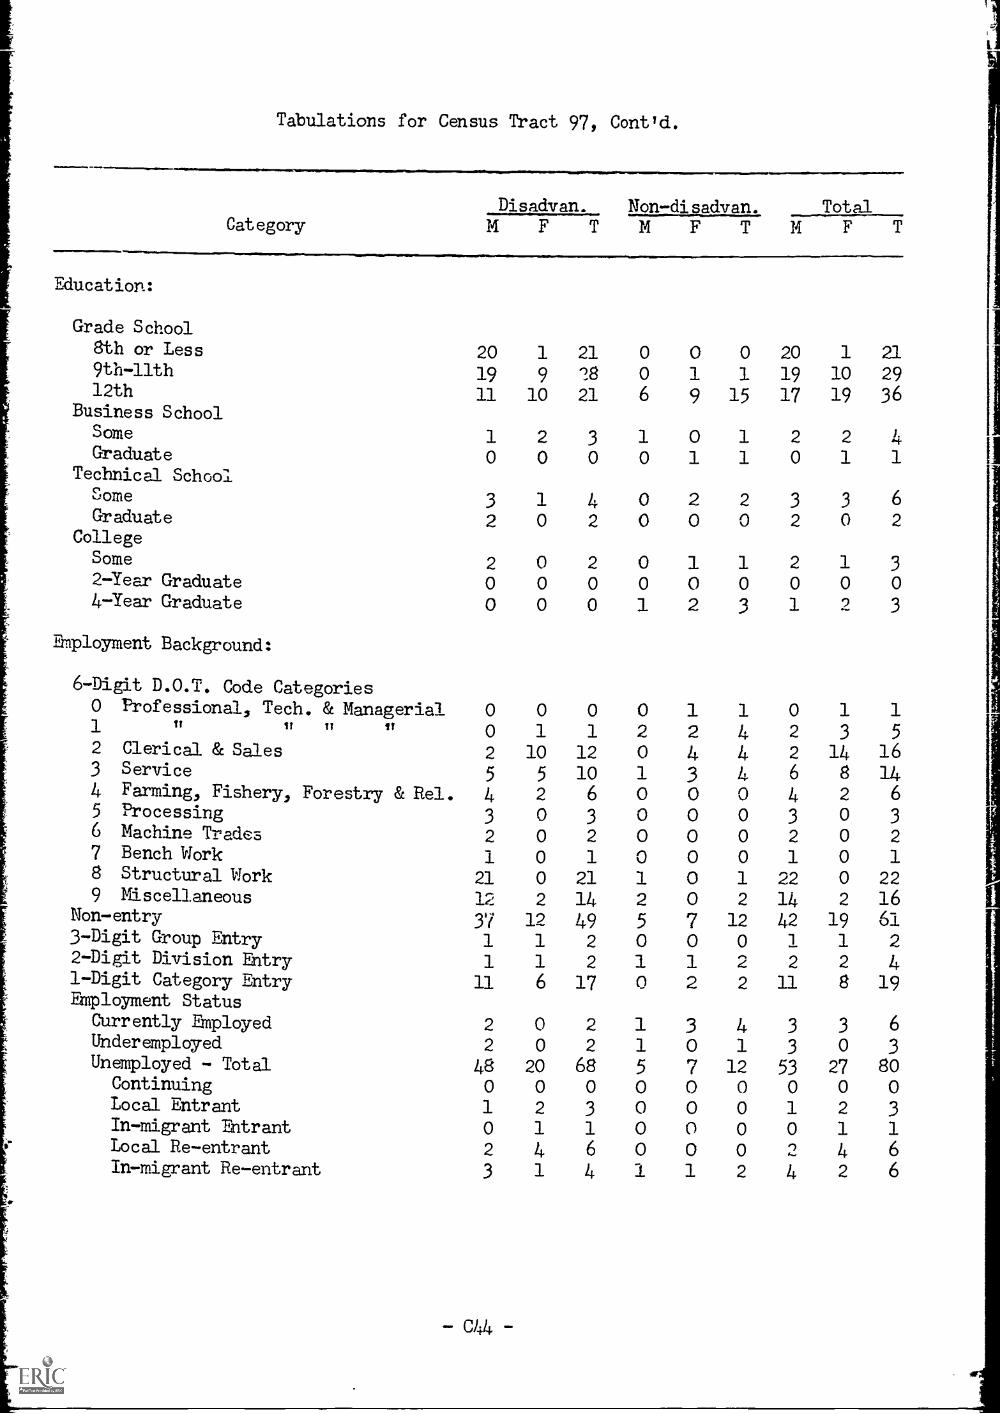
Tabulations for Census Tract 97, Cont'd.
Total
20 1 21
19 10 2917 19 36
Disadvan. Non -disadvan.Category PIFTMFT14FT
Education:
Grade School8th or Less 20 1 21 0 0 09th-llth 19 9 28 0 1 112th 11 10 21 6 9 15
Business SchoolSome 1 2 3 1 0 1Graduate 0 0 0 0 1 1
Technical SchoolSome 3 1 4 0 2 2Graduate 2 0 2 0 0 0
CollegeSome 2 0 2 0 1 12-Year Graduate oo000o00o4-Year Graduate o o o 1 2
Employment Background:
6-Digit D.O.T. Code Categories0 Professional, Tech. & Managerial 0 0 0 0 1 11 li if II v 0 1 1 2 2 42 Clerical & Sales 2 10 12 0 4 43 Service
5 5 10 1 3 L.
4 Farming, Fishery, Forestry & Rel. 4 2 6 0 0 05 Processing 3 0 3 0 0 o6 Machine Trades 2 0 2 0 0 07 Bench Work 1 0 1 0 0 08 Structural Work 21 0 21 1 0 19 Miscellaneous 12 2 14 2 0 2
Non-entry 37 19 49 5 7 123-Digit Group Entry 1 1 2 0 0 02-Digit Division Entry 1 1 2 1 1 21-Digit Category Entry 11 6 17 0 2 2Employment Status
Currently Employed 2 0 2 1 3 4Underemployed 2 0 2 1 0 1Unemployed - Total 48 20 68 5 7 12
Continuing 0 0 0 0 0 0Local Entrant 1 2 3 0 0 oIn-migrant Entrant 0 1 1 0 0 0Local Re-entrant 2 4 6 0 0 0In-migrant Re-entrant 3 1 4 1 1 2
- c44
20
3
2
2
21
30
1
1
62
3
1 9 3
0 1 1
2 3 5
2 14 166 8 144 2 6
3 0 3
2 0 2
1 0 1
22 0 2214 2 1642 19 611 1 2
2 2 411 8 19
3 3 63 0 3
53 27 800 0 01 2 30 1 1
2 4 64 2 6
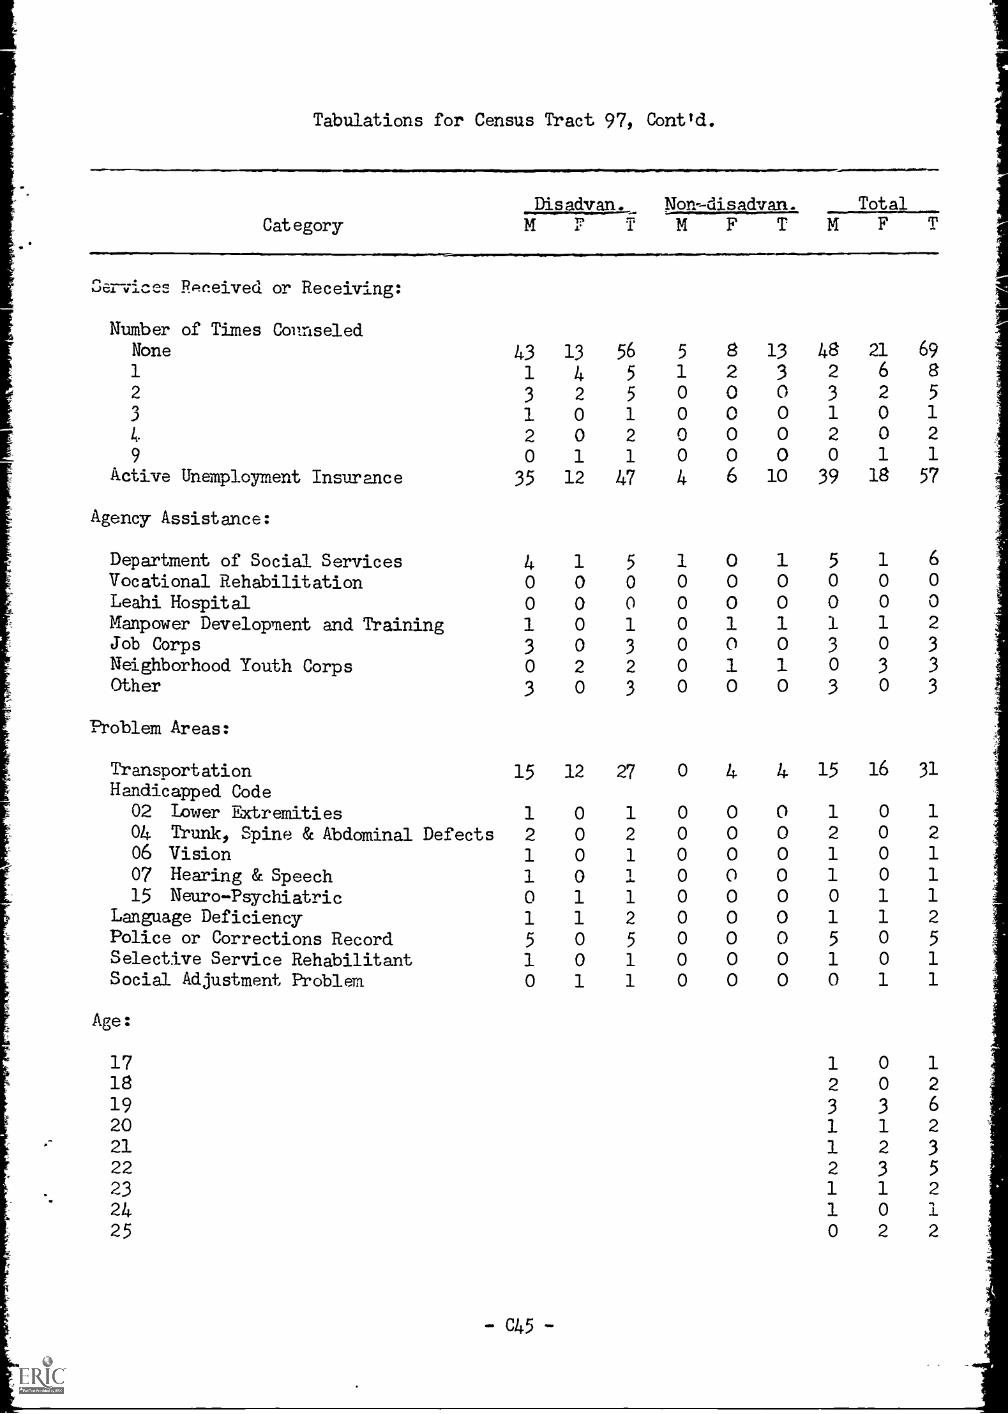
Tabulations for Census Tract 971 Contld.
CategoryDisadvan. Non-disadvan. Total
m r T MFTMFTRRneived or Receiving:
NuMber of Times CounseledNone 43 13 56 5 8 13 481 1 4 5 1 2 3 2
2 3 2 5 0 0 0 3
3 1 0 1 0 0 0 1
4. 2 0 2 0 0 0 2
9 0 1 1 0 0 0 0
Active Unemployment Insurance 35 12 47 4 6 10 39
Agency Assistance:
Department of Social Services 4 1 5 1 0 1 5
Vocational Rehabilitation 0 0 0 0 0 0 0
Ledhi Hospital 0 0 0 0 0 0 0Manpower Development and Training 1 0 1 0 1 1 1
Job Corps 3 0 3 0 0 0 3
Neighborhood Youth Corps 0 2 2 0 1 1 0Other 3 0 3 0 0 0 3
Problem Areas:
Transportation 15 12 27 0 4 4 15
Handicapped Code02 Lower Extremities 1 0 1 0 0 0 1
04 Trunk, Spine & Abdominal Defects 2 0 2 0 0 0 206 Vision 1 0 1 0 0 0 1
07 Hearing & Speech 1 0 1 0 0 0 1
15 Neuro-Psychiatric 0 1 1 0 0 0 0
Language Deficiency 1 1 2 0 0 0 1
Police or Corrections Record 5 0 5 0 0 0 5
Selective Service Rehabilitant 1 0 1 0 0 0 1
Social Adjustment Problem 0 1 1 0 0 0 0
Age:
17 1
18 219 3
20 121 122 223 1
24 125 0
-c45-
21 69
6 82 5
0 1
0 2
1 1
18 57
1 60 0
0 01 20 3
3 3
0 3
16 31
0 1
0 2
0 1
0 1
1 1
1 20 5
0 1
1 1
0 1
0 2
3 6
1 2
2 3
3 5
1 2
0 1
2 2
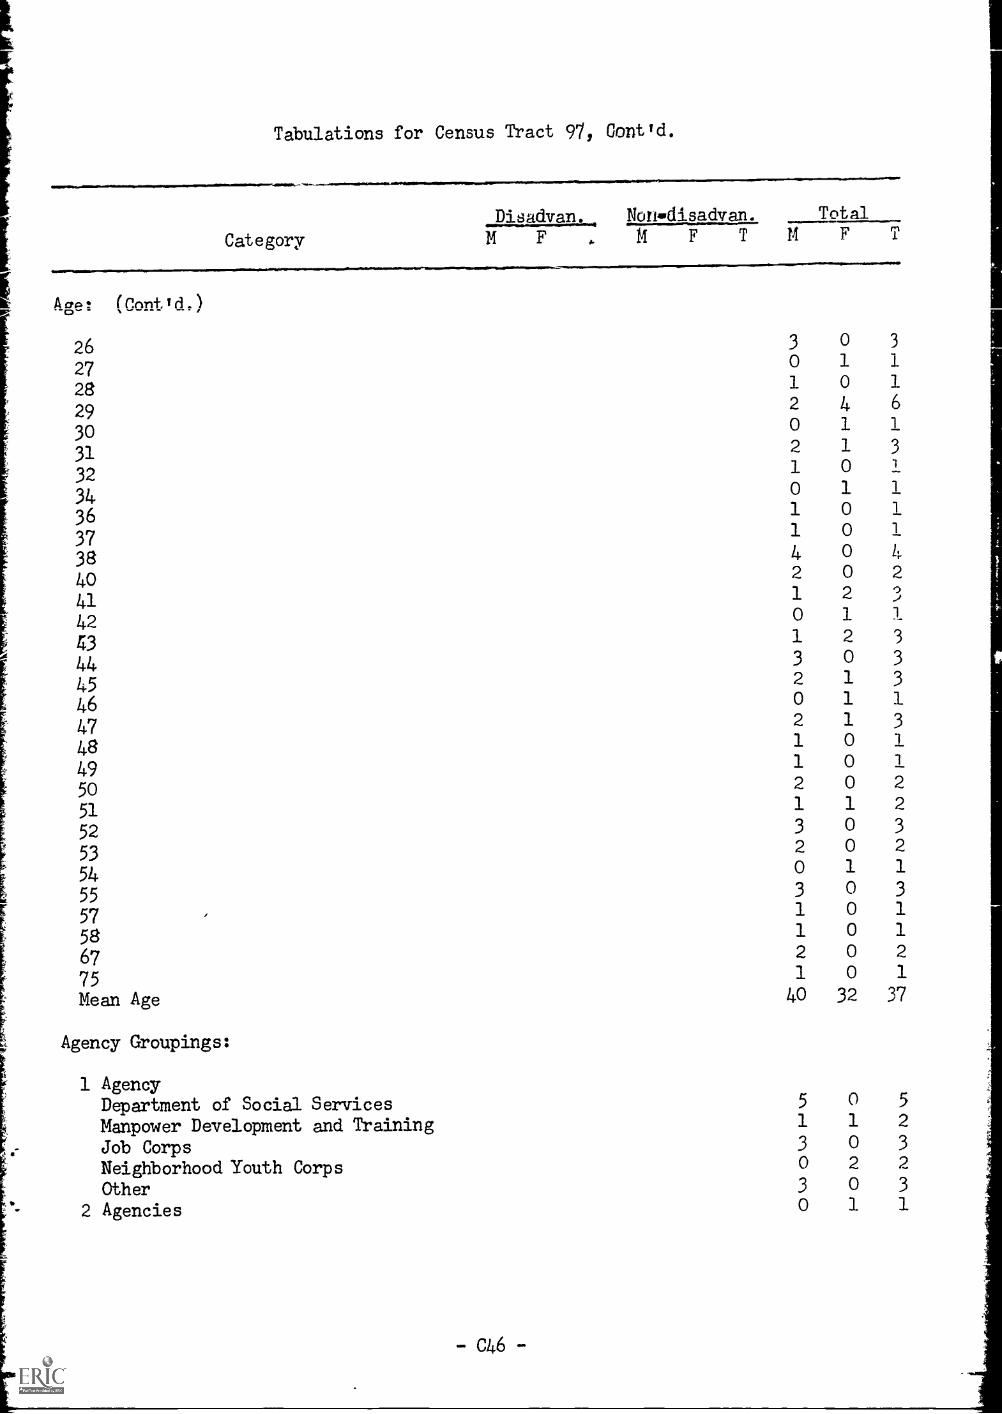
Tabulations for Census Tract 97, Cont'd..Di8advan. Nonwdisadvan. Total
Category M F MFTMFTAg..! (enptIci,)
26 3 0 3
27 0 1 1
28 1 0 1
29 2 4 6
30 0 1 1
31 2 1 3
32 1 0
340 1 1
36 1 0 1
371 0 1
38 4 0 4
40 2 0 2
411 2 0
42 0 1 1
43 1 2 3
44 3 0 3
45 2 1 3
46 0 1 1
47 2 1 3
48 1 0 1
49 1 0 1
50 2 0 2
51 1 1 2
52 3 0 3
532 0 2
540 1 1
553 0 3
57 1 0 1
58 1 0 1
67 2 0 2
75 1 0 1
Mean Age 40 32 37
Agency Groupings:
1 AgencyDepartment of Social Services 5 0 5
Manpower Development and Training 1 1 2
Job Corps 3 0 3
Neighborhood Youth Corps 0 2 2
Other 3 0 3
2 Agencies 0 1 1
-C46-
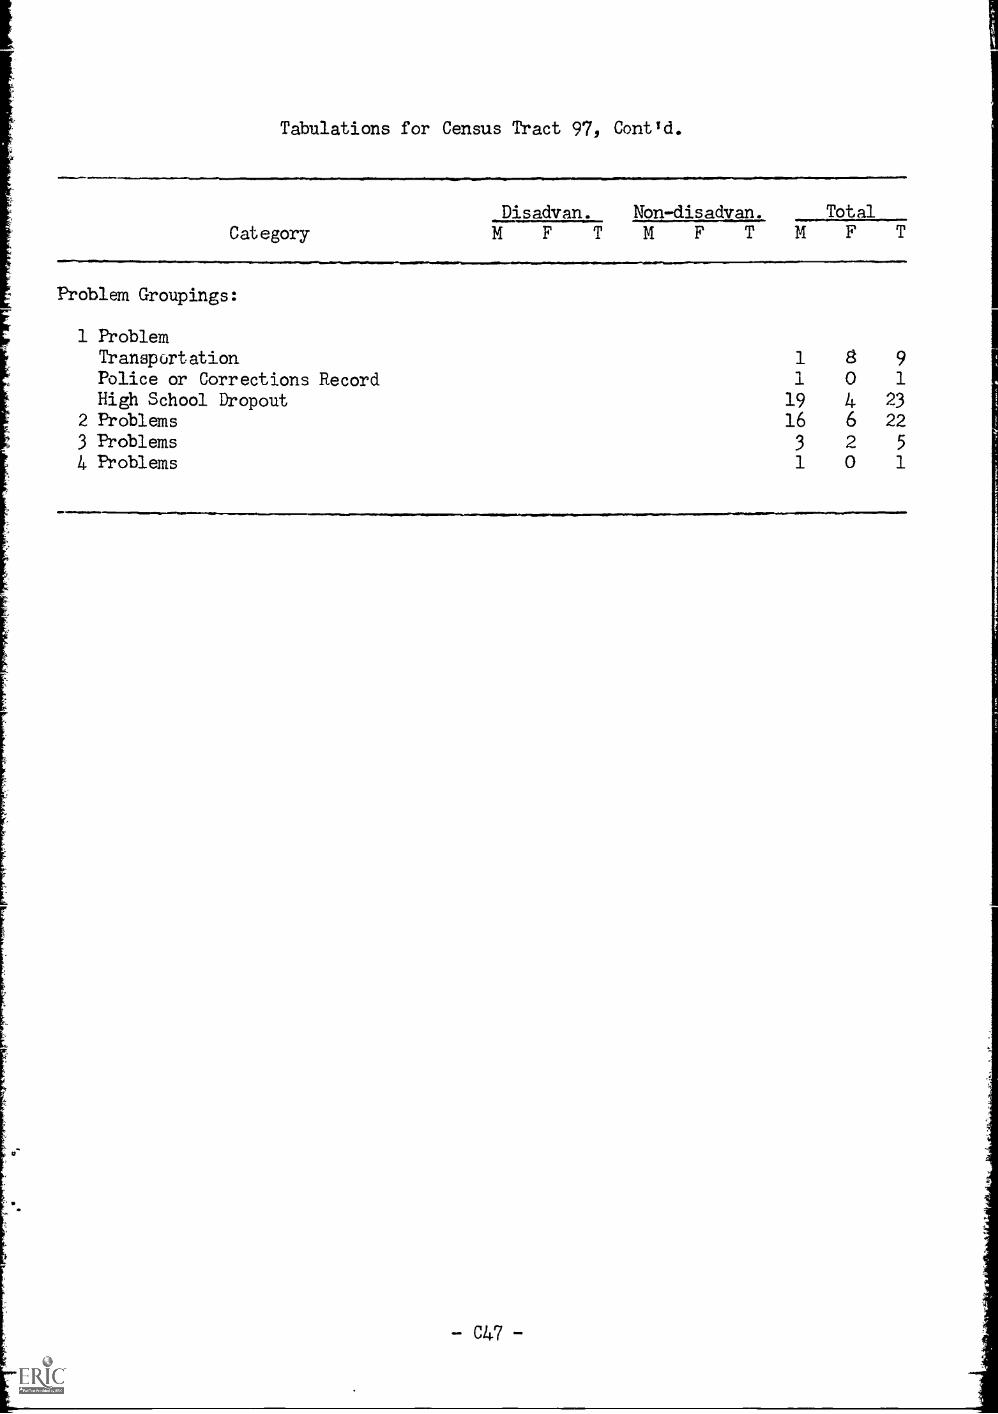
Tabulations for Census Tract 97, Contld.
Disadvan. Non -disadvan. Total
Category M F T M F TMFTProblem Groupings:
1 ProblemTransportation 1 8 9
Police or Corrections Record 1 0 1
High School Dropout 19 4 23
2 Problems 16 6 223 Problems 3 2 5
4 Problems 1 0 1
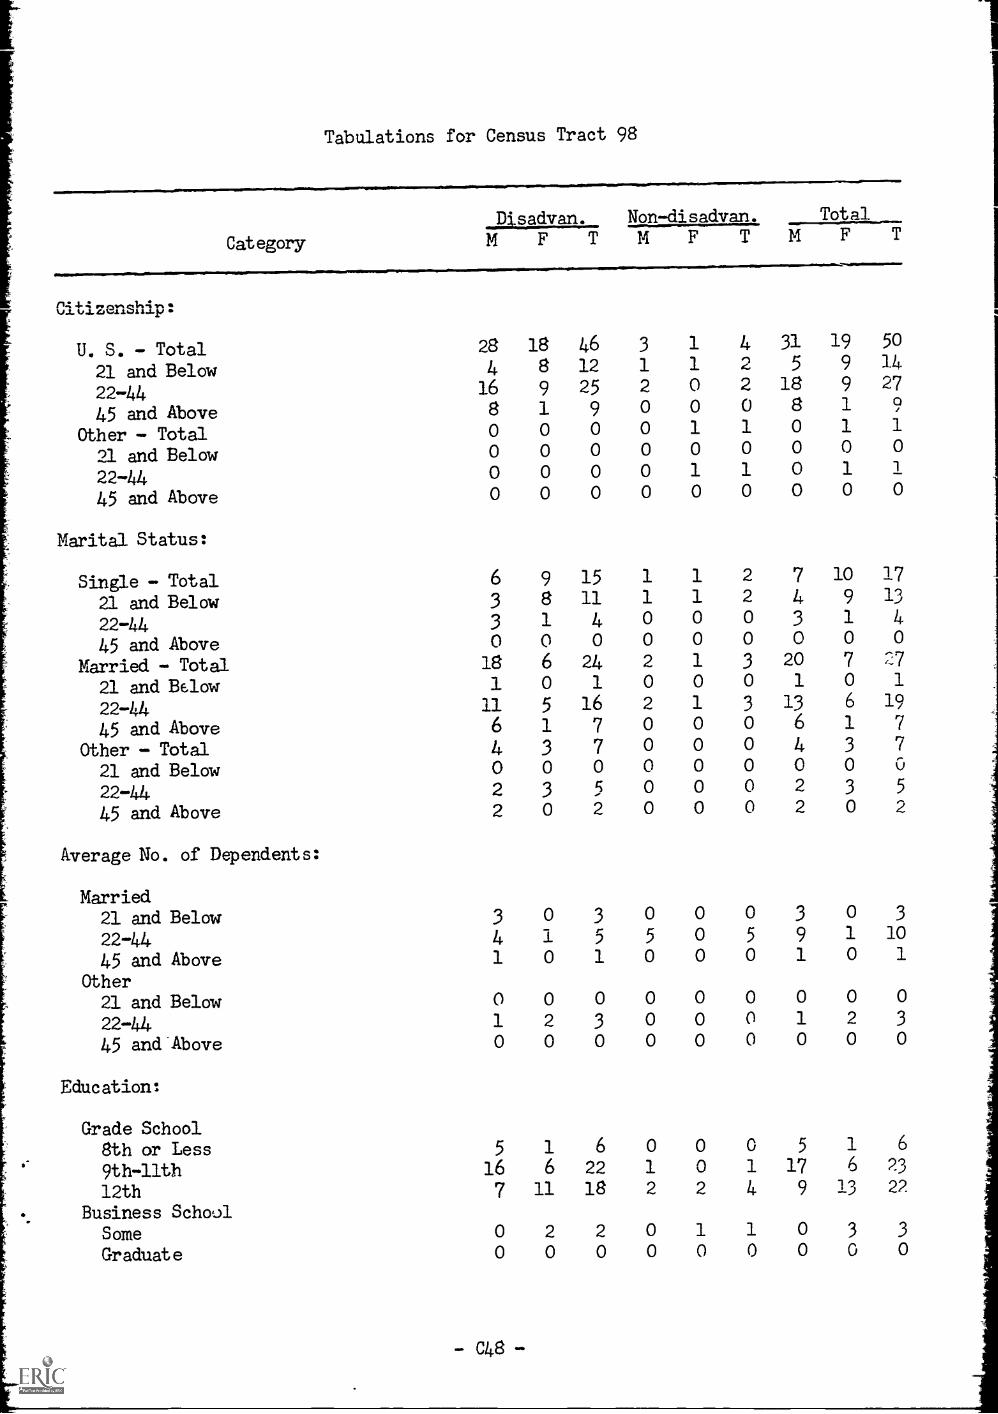
Tabulations for Census Tract 98
Disadvan. Non-disadvan. Total
Category
n44-4"0,1,4,.
U. S. - Total21 and Below22-44
45 and AboveOther - Total21 and Below22-4445 and Above
Marital Status:
Single - Total21 and Belaw22-44
45 and AboveMarried - Total
21 and Below22-4445 and Above
Other - Total21 and Below22-44
45 and Above
Average No. of Dependents:
28 18 46
4 8 12
16 9 25
8 1 9
0 0 0
0 0 0
0 0 0
0 0 0
6 9
3 83 1
0 018 6
1 0
11 5
6 1
4 30 0
2 3
2 0
151140
241
167
70
5
2
Married21 and Belaw 3 0 3
22-44 4 1 5
45 and Above 1 0 1
Other21 and Below 0 0 0
22-44 1 2 3
45 and Above 0 0 0
Education:
Grade School8th or Less9th-llth12th
Business SchoolSome
Graduate
5 1 6
16 6 22
7 11 18
0 2 2
0 0 0
MFTMFTIA
3 1 41 1 2
2 0 2
0 0 0
0 1 10 0 0
0 1 1
0 0 0
1 1 2
1 1 2
0 0 0
0 0 0
2 1 3
0 0 0
2 1 3
0 0 0
0 0 00 0 0
0 0 0
0 0 0
0 0 0
5 0 5
0 0 0
0 0 0
0 0 0
0 0 0
0 0 0
1 0 1
2 2 4
0 1 1
0 0 0
F
31 19 50
5 9 1418 9 27
8 1 9
0 1 1
0 0 0
0 1 1
0 0 0
7 10 17
4 9 13
3 1 4
0 0 0
20 7 27
1 0 1
13 6 19
6 1 7
4 3 7
0 0 0
2 3 5
2 0 2
3 0 3
9 1 10
1 0 1
0 0 0
1 2 3
0 0 0
5 1
17 6
9 13
6
23
22
0 3 3
0 0 0
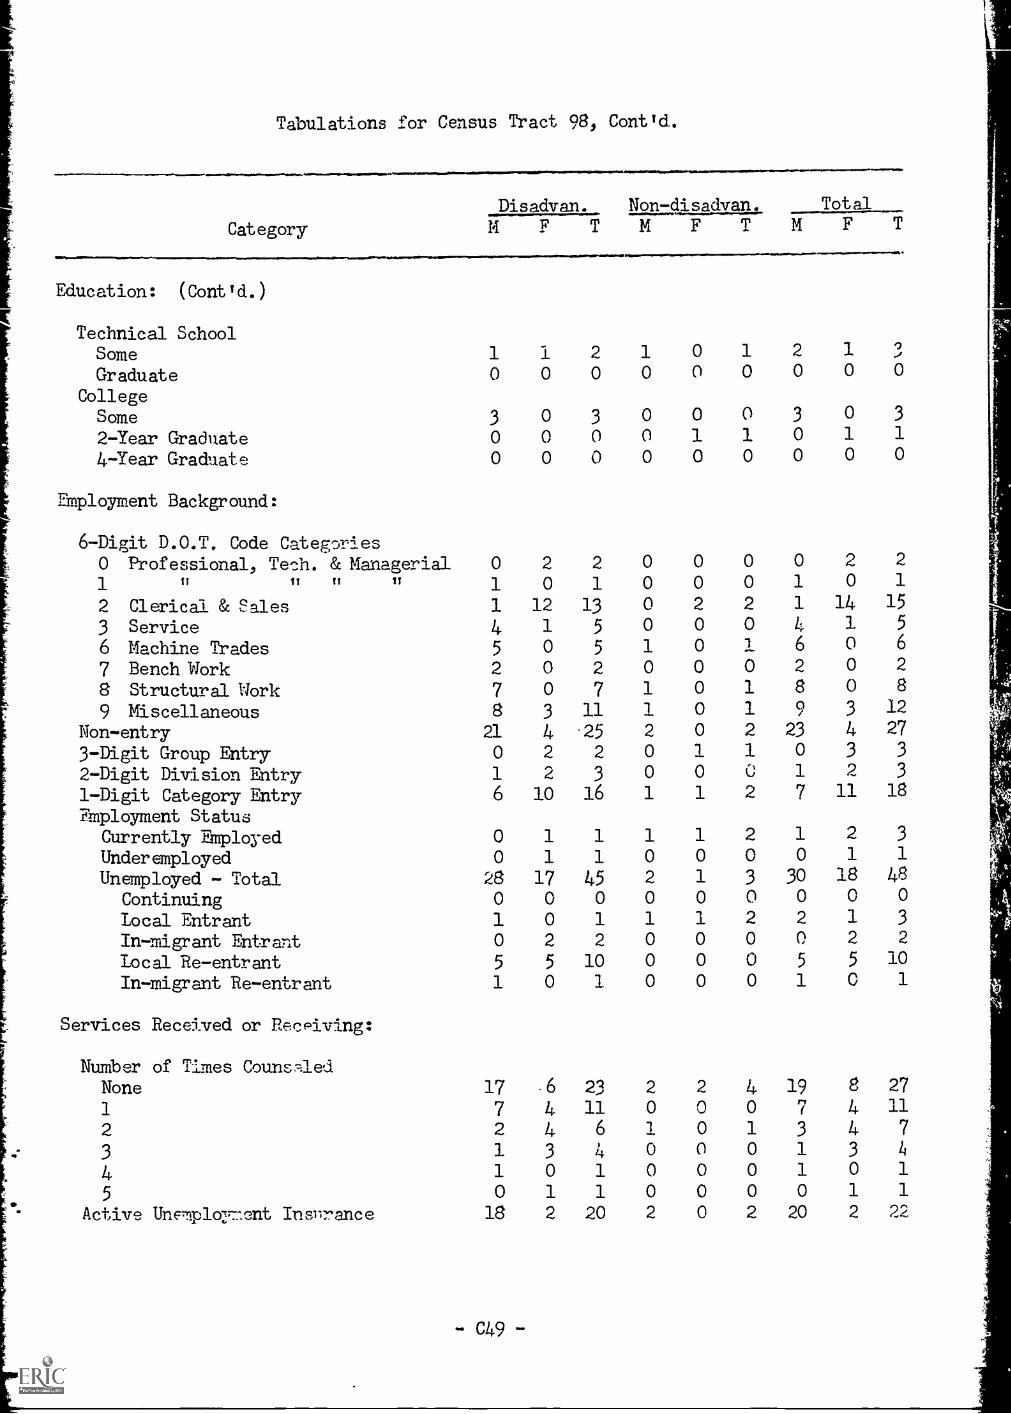
Tabulations for Census Tract 98, Contld.
Category
40.1!1111111.Maelloa
Disadvan. Non-disadvan. TotalMFTMFT N F T
Education: (Contld.)
Technical SchoolSome 1 1 2 1 0 1 2 1
Graduate 0 0 0 0 0 0 0 0 0
CollegeSome 3 0 3 0 0 0 3 0 3
2-Year Graduate 0 0 0 0 1 1 0 1 1
4-Year Graduate 0 0 0 0 0 0 0 0 0
Employment Background:
6-Digit D.O.T. Code Categories0 Professional, Tech. & Managerial 0 2 2 0 0 0 0 2 2
1 II 11 TT TT 1 0 1 0 0 0 1 0 1
2 Clerical & Sales 1 12 13 0 2 2 1 14 15
3 Service 4 1 5 0 0 0 4 1 5
6 Machine Trades 5 0 5 1 0 1 6 0 6
7 Bench lgork 2 0 2 0 0 0 2 0 2
8 Structural Uork 7 0 7 1 0 1 8 0 8
9 Miscellaneous 8 3 11 1 0 1 .o 3 12
Non-entry 21 4 25 2 0 2 23 4 27
3-Digit Group Entry 0 2 2 0 1 1 0 3 3
2-Digit Division Entry 1 2 3 0 0 0 1 2 3
1-Digit Category Entry 6 10 16 1 1 2 7 11 18
Employment StatusCurrently Employed 0 1 1 1 1 2 1 2 3
Underemployed 0 1 1 0 0 0 0 1 1
Unemployed - Total 28 17 45 2 1 3 30 18 48
Continuing 0 0 0 0 0 0 0 0 0
Local Entrant 1 0 1 1 1 2 2 1 3
In-migrant Entrant 0 2 2 0 0 0 0 2 2
Local Re-entrant 5 5 10 0 0 0 5 5 10
In-migrant Re-entrant 1 0 1 0 0 0 1 0 1
Services Received or RecPiving:
NuMber of TLmes CgunsledNone 17 6 23 2 2 4 19 8 27
1 7 4 11 0 0 0 7 4 11
2 2 4 6 1 0 1 3 4 7
3 1 3 4 0 0 0 1 3 h
4 1 0 1 0 0 0 1 0 1
5 0 1 1 0 0 0 0 1 1
Active Unemploynt Insilrance 18 2 20 2 0 2 20 2 22
-C49-
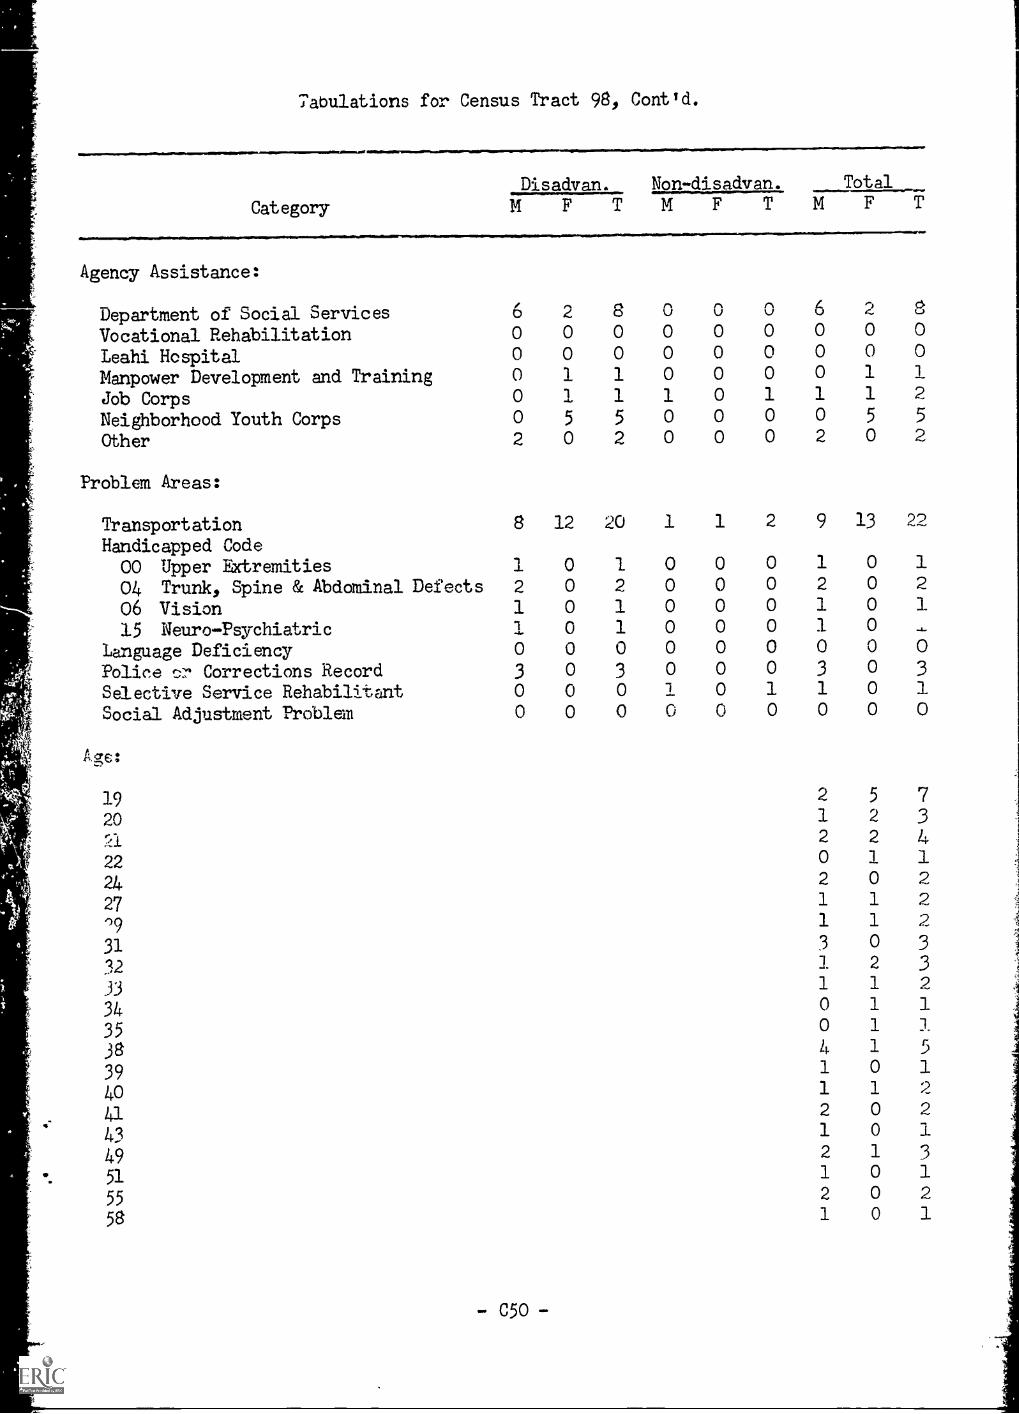
Tabulations for Census Tract 980 Contld.
Category
Disadvan. Non-disadvan. TotalMFTMFTMFTAgency Assistance:
Department of Social Services 6 2 8 0 0 0 6 04. 8
Vocational Rehabilitation 0 0 0 0 0 0 0 0 0
Leahi Hospital 0 0 0 0 0 0 0 0 0
Manpower Development and Training 0 1 1 0 0 0 0 1 1
Jdb Corps 0 1 1 1 0 1 1 1 2
Neighborhood Youth Corps 0 5 5 0 0 0 0 5 5
Other 2 0 2 0 0 0 2 0 2
Problem Areas:
Transportation 8 12 20 1 1 2 9 13 22
Handicapped Code00 Upper Extremdties 1 0 1 0 0 0 1 0 1
04 Trunk, Spine & Abdominal Defects 2 0 2 0 0 0 2 0 2
06 Vision 1 0 1 0 0 0 1 0 1
15 Neuro-Psychiatric 1 0 1 0 0 0 1 0
language Deficiency 0 0 0 0 0 0 0 0 0
Police .e.r Corrections Record 3 0 3 0 0 0 3 0 3
Selective Service Rehabilitant 0 0 0 1 0 1 1 0 1
Social Adjustment Problem 0 0 0 0 0 0 0 0 0
19 2 5 7
20 1 2 3
21 2 2 4
22 0 1 1
24 2 0 2
27 1 1 209 1 1 2
31 3 0 3
32 1 2 3
33 1 1 ?
34 0 1 1
35 0 1 J.
38 4 1 5
39 1 0 1
40 1 1 2
41 2 0 2
43 1 0 1
49 2 1 351 1 0 1
55 2 0 2
58 1 0 1
-050-
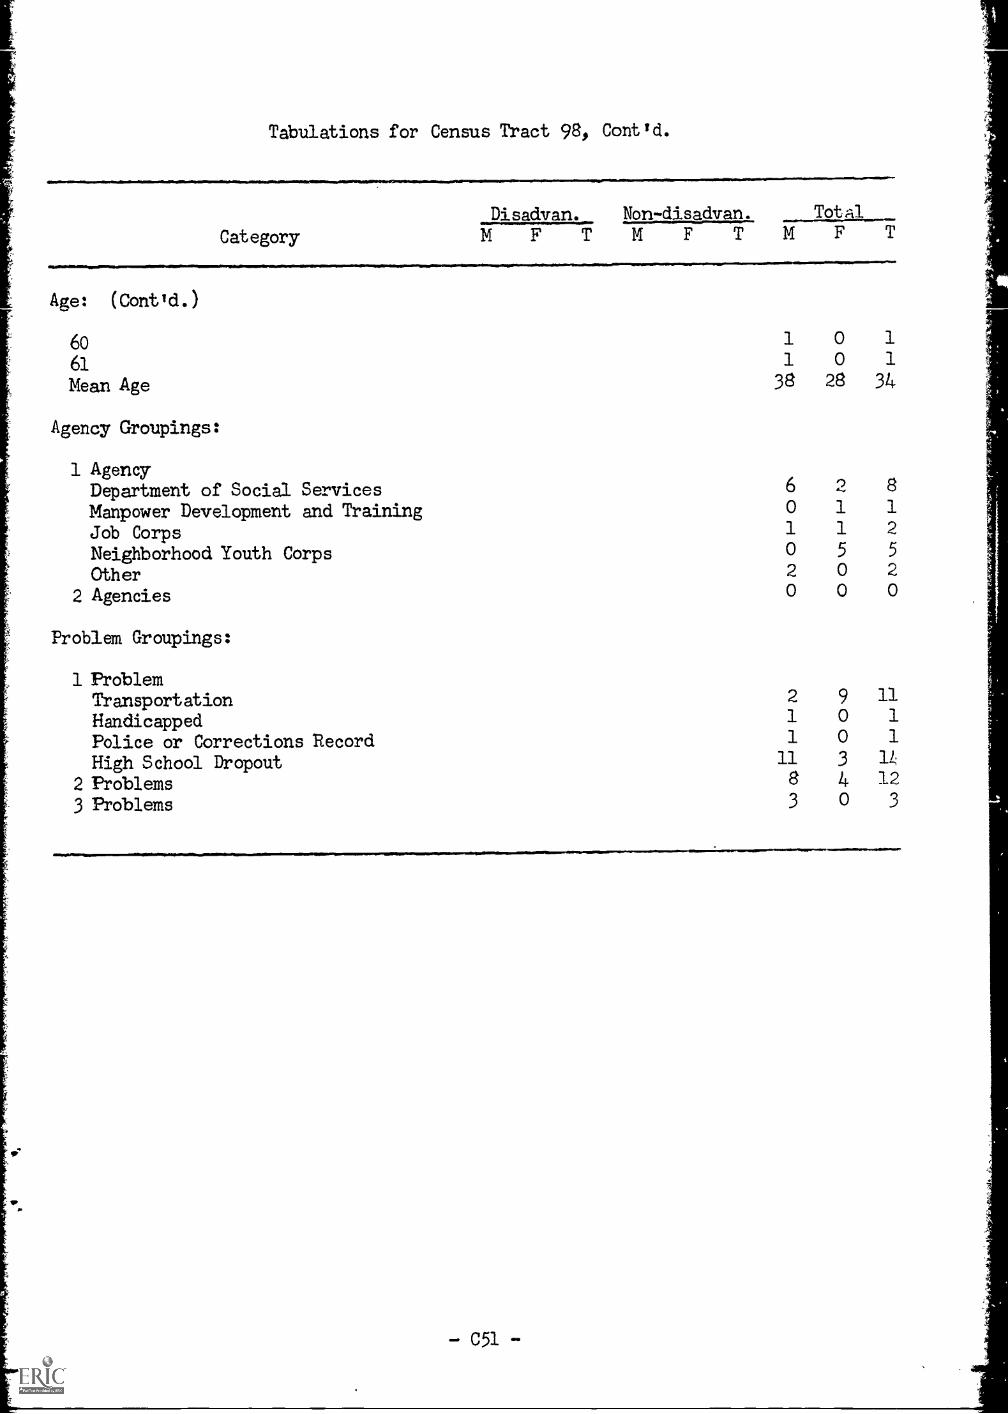
Tabulations for Census Tract 98, Conttd.
Category
Disadvan. Non-disadvan. TotAl
M F T M F T M F T
ARe: (Oonttd.)
60 1 0 1
61 1 0 1
Mean Age 38 28 34
Agency Groupings:
1 AgencyDepartment of Social Services 6 2 8
Manpower Development and Training 0 1 1
Job Corps 1 1 2
Neighborhood Youth Corps 0 5 5
Other 2 0 2
2 Agencies 0 0 0
Problem Groupings:
1 ProblemTransportation 2 9 11
Handicapped 1 0 1
FUice or Corrections Record 1 0 1
High School Dropout 11 3 14
2 Problems 8 4 12
3 Problems 3 0 3