PERCEIVED SERVICE QUALITY IN RESTAURANT SERVICES: …
14
INTERNATIONAL JOURNAL OF MANAGEMENT AND MARKETING RESEARCH ♦VOLUME 5 ♦NUMBER 3 ♦2012 1 PERCEIVED SERVICE QUALITY IN RESTAURANT SERVICES: EVIDENCE FROM MAURITIUS Prabha Ramseook-Munhurrun, University of Technology, Mauritius ABSTRACT The purpose of this study is to investigate service quality dimensions in retsuarant services. The study examines the influence of the service dimensions on customer satisfaction and behavioral intentions within the restaurant context in an island economy, Mauritius. Factor analysis was performed to determine dimensions that are likely to influence customers’ restaurant service evaluations. Based on the analyses, three distinct dimensions were identified by the customers, “Food Quality-Reliability”, “Responsiveness-Assurance-Empathy” and “Tangibles”. Multiple regression analyses were then employed to examine the relative importance of the three service dimensions in determining satisfaction judgments and customers’ behavioral intentions. The results support the links between service quality dimensions, satisfaction and behavioral intentions respectively. The findings are expected to help the owners of restaurants in Mauritius to address the gaps and improve satisfaction level of their customers, thereby bringing about repeat business and improving profits. JEL: M31 KEYWORDS: Service Quality, Customer Satisfaction, Behavioral Intentions, Restaurant INTRODUCTION elivering high quality service is important for the success of organisations so that they can survive and strengthen their competiveness. The restaurant industry has not been exempted from either increased competition or customer demand for high service quality. Nowadays, customers have a wide range of restaurant services to choose from and service quality conditions indeed influence a restaurant competitive advantage (Bojanic & Rosen, 1994; Soriano, 2002; Yüksel & Yüksel, 2002; Sulek & Hensley, 2004; Chow et al., 2007). Since service quality is an important factor for restaurants, research related to service quality, customer satisfaction and behavioral intentions in the restaurant industry has been growing. However, most of the research studies were focused on the United States (US), Hong Kong, China, Korea and Europe (Stevens, Knutson & Patton, 1995; Oh, 2000; Kivela, Inbakaran & Reece, 1999, 2000; Soriano, 2002; Yüksel & Yüksel, 2002; Sulek & Hensley, 2004; Chow et al., 2007; Kim et al, 2009) and very few, if any research has been undertaken to measure service quality of restaurants in an island. Therefore, an understanding of the factors that influence service quality ought to be useful in guiding restaurant owners and managers to design and deliver the right offering to the customers. The trend of globalization has fostered the introduction of a number of foreign chain restaurants into the Mauritian market place, a small developing island in the Indian Ocean. The restaurant industry is one of the fastest growing industries within the island and is likely to continue its development into the future. This growth is also attributed to the development of the tourism sector as well as socio-cultural and economic changes which are influencing the eating habits of local consumers. Consequently there is an increase in the frequency of Mauritians dining outside the home. Changes in local eating behaviour, increased product knowledge and competition have forced the restaurants to improve their product offerings as well as their level of service. Therefore, it is deemed important to explore this industry in terms of service delivery as well as food quality. The aim of this study is to identify the key service quality dimensions that affect customer satisfaction and behavioral intentions in restaurant services in Mauritius. D
Transcript of PERCEIVED SERVICE QUALITY IN RESTAURANT SERVICES: …
INTERNATIONAL JOURNAL OF MANAGEMENT AND MARKETING RESEARCH ♦VOLUME 5 ♦NUMBER 3 ♦2012
1
PERCEIVED SERVICE QUALITY IN RESTAURANT SERVICES: EVIDENCE FROM MAURITIUS Prabha Ramseook-Munhurrun, University of Technology, Mauritius
ABSTRACT
The purpose of this study is to investigate service quality dimensions in retsuarant services. The study examines the influence of the service dimensions on customer satisfaction and behavioral intentions within the restaurant context in an island economy, Mauritius. Factor analysis was performed to determine dimensions that are likely to influence customers’ restaurant service evaluations. Based on the analyses, three distinct dimensions were identified by the customers, “Food Quality-Reliability”, “Responsiveness-Assurance-Empathy” and “Tangibles”. Multiple regression analyses were then employed to examine the relative importance of the three service dimensions in determining satisfaction judgments and customers’ behavioral intentions. The results support the links between service quality dimensions, satisfaction and behavioral intentions respectively. The findings are expected to help the owners of restaurants in Mauritius to address the gaps and improve satisfaction level of their customers, thereby bringing about repeat business and improving profits. JEL: M31 KEYWORDS: Service Quality, Customer Satisfaction, Behavioral Intentions, Restaurant INTRODUCTION
elivering high quality service is important for the success of organisations so that they can survive and strengthen their competiveness. The restaurant industry has not been exempted from either increased competition or customer demand for high service quality. Nowadays, customers
have a wide range of restaurant services to choose from and service quality conditions indeed influence a restaurant competitive advantage (Bojanic & Rosen, 1994; Soriano, 2002; Yüksel & Yüksel, 2002; Sulek & Hensley, 2004; Chow et al., 2007). Since service quality is an important factor for restaurants, research related to service quality, customer satisfaction and behavioral intentions in the restaurant industry has been growing. However, most of the research studies were focused on the United States (US), Hong Kong, China, Korea and Europe (Stevens, Knutson & Patton, 1995; Oh, 2000; Kivela, Inbakaran & Reece, 1999, 2000; Soriano, 2002; Yüksel & Yüksel, 2002; Sulek & Hensley, 2004; Chow et al., 2007; Kim et al, 2009) and very few, if any research has been undertaken to measure service quality of restaurants in an island. Therefore, an understanding of the factors that influence service quality ought to be useful in guiding restaurant owners and managers to design and deliver the right offering to the customers. The trend of globalization has fostered the introduction of a number of foreign chain restaurants into the Mauritian market place, a small developing island in the Indian Ocean. The restaurant industry is one of the fastest growing industries within the island and is likely to continue its development into the future. This growth is also attributed to the development of the tourism sector as well as socio-cultural and economic changes which are influencing the eating habits of local consumers. Consequently there is an increase in the frequency of Mauritians dining outside the home. Changes in local eating behaviour, increased product knowledge and competition have forced the restaurants to improve their product offerings as well as their level of service. Therefore, it is deemed important to explore this industry in terms of service delivery as well as food quality. The aim of this study is to identify the key service quality dimensions that affect customer satisfaction and behavioral intentions in restaurant services in Mauritius.
D
P. Ramseook-Munhurrun | IJMMR ♦ Vol. 5 ♦ No. 3 ♦ 2012
2
The paper is organized as follows. The following section provides the theoretical background of service quality, satisfaction and behavioral intentions. The research methodology and the empirical analysis are presented next, followed by conclusions and managerial implications. In the final section, limitations and directions for future research are provided. LITERATURE REVIEW The fundamental factors that contribute to customer satisfaction in restaurants include food quality (hygiene, balance, and healthiness), service quality, physical provision (layout, furnishing, and cleanliness), atmosphere (feeling and comfort), and service received (speed, friendliness, and care) during the dining experience (Jones, 1983; Johns & Pine, 2002), which in turn determines customers behavioral intentions toward the restaurants. Therefore it is important to identify the factors that affect dining experiences. Service Quality The service literature has demonstrated that customers are becoming increasingly sensitive to service elements and the overall quality of service offered by an organization (Parasuraman, Zeithaml & Berry, 1988). Various researchers have developed alternative concepts for service quality, like the Nordics (Grönroos, 1984, 1988; Lehtinen & Lehtinen, 1991) and the American schools of thought (Parasuraman et al., 1988). The work of Parasuraman et al. (1988) has led to the identification of a service quality measurement tool, SERVQUAL. It is one of the most widely used instruments as it aims to help service managers diagnose and improve the quality of services under their control. The model on which SERVQUAL is based proposes that customers evaluate the quality of a service across five distinct dimensions as follows: Reliability – ability to perform the promised service dependably and accurately; Responsiveness – willingness to help customers and provide prompt service; Assurance – knowledge and courtesy of employees and their ability to inspire trust and confidence; Empathy – caring, individualized attention the firm provides to its customers; Tangibles – appearance of physical facilities, equipment, appearance of personnel, and communication materials. The SERVQUAL scales comprises of 22 questions measuring expectations and 22 questions measuring perceptions. Customers evaluate the quality of services provided by organisations based on the discripancy among expectations and perceptions (Grönroos, 1984; Parasuraman et al., 1988). Although the SERVQUAL instrument has been widely used in various settings (Fick & Ritchie, 1991; Saleh & Ryan, 1992; Jabnoun & Al-Tamimi, 2003; Tan & Kek, 2004; Arasli et al., 2008), it has been subjected to a number of criticisms regarding its operationalisation of expectations, the reliability and validity of the gap score formulation and the difficulty in replicating its dimensions (Carman, 1990; Cronin & Taylor, 1992; Teas, 1993; Baker & Crompton, 2000; Sureshchandar, Rajendran & Kamalanabhan, 2001). Babakus & Boller (1992) suggest that the dimensionality of service quality may vary depending on the type of service sector under investigation. Similarly, Becker et al. (1999) contend that the five-dimensional model does not adequately identify the characteristics most critical to successful service delivery in the hospitality setting. Cronin & Taylor (1994) argue that there is no real evidence to support the concept of performance minus expectations gap as a basis for measuring service quality. In addition, the use of expectation and performance statements may be too time consuming to administer (Carman, 1990; Babakus & Boller, 1992). It has also been argued that the performance-only measure (SERVPERF) explains more of the variance in an overall measure of service quality than the SERVQUAL instrument (Bolton & Drew, 1991; Cronin & Taylor, 1994; Yüksel & Rimmington, 1998). SERVPERF maintains the original 22 items of SERVQUAL but measures perceptions of performance only instead of measuring both expectations and performance and has been empirically validated in banking, pest control, dry cleaning, fast food, advertising and dental service (Cronin & Taylor, 1992, 1994; Quester & Romaniuk, 1997).
INTERNATIONAL JOURNAL OF MANAGEMENT AND MARKETING RESEARCH ♦VOLUME 5 ♦NUMBER 3 ♦2012
3
Customer Satisfaction and Behavioral Intentions Customer satisfaction has been of great interest in services marketing because satisfaction links purchase/consumption to post-purchase phenomena such as attitude change, repeat purchase, positive word-of-mouth, and loyalty (Oliver, 1994; Fornell et al., 1996; Oliver, 1997). Customer satisfaction is defined as a judgment made on the basis of a specific service encounter (Cronin & Taylor, 1992). Several major questions have emerged in the literature such as the relationship between service quality and satisfaction (Parasuraman et al., 1988; Cronin & Taylor, 1992) and the relationship between satisfaction and future intentions of customers (McDougall & Levesque, 2000). Thus satisfaction judgments are seen as moderating the quality attitude and purchase intention relationship (Taylor & Baker, 1994; Mattila, 2000), indicating the need to investigate satisfaction and perceived service quality as two separate constructs. Behavioral intentions are one of the important goals in the service marketing community as it is a key component for an organization’s long-term viability or sustainability. According to Zeithaml et al. (1996), favorable behavioral intentions are associated with a service provider’s ability to get its customers to say positive things about them, recommend them to other customers, remain loyal to them, spend more with the company and pay price premiums. Previous studies have used one or more of these five proposed constructs to examine the outcomes of quality (Oh, 1999; Baker & Crompton, 2000; Kim et al., 2008; Han et al., 2009) and satisfaction (Spreng & Mackoy, 1996). FACTORS INFLUENCING RESTAURANT SERVICES According to Susskind and Chan (2000), three components contribute to overall customer satisfaction with the restaurant: good food, good service and a pleasant setting. Kalra (2001) explains that dinning out has become an integral part of customers’ lifestyle, thus experienced customers have raised their expectations with regard to quality, good service, well-cooked food and no dirty interiors, while seeking a better value for their money. Several researchers have attempted to test the SERVQUAL framework in measuring customer satisfaction in the restaurant industry. Bojanic & Rosen (1994) used the SERVQUAL instrument in a chain restaurant with a diverse clientele in Columbia, South Carolina and a varied menu that included international items. Six dimensions were used as “Empathy” was divided into two dimensions: knowing the customer and access to services. The results identified dimensions similar to those in Parasuraman et al.’s (1988) SERVQUAL instrument, “Knowing the customer”, “Reliability”, and “Assurance” were the most significant in predicting overall restaurant quality; the other three dimensions were not important predictors of overall quality. Lee & Hing (1995) assessed the usefulness and apllicability of the SERVQUAL instrument in the restaurant industry to measure and compare patrons’ perceived service quality at a French and a Chinese restaurant in Australia. The results revealed that the customers’ highest expectations of service quality involved “Assurance” and “Reliability”, while their lowest expectations were related to “Tangibles”. Oubre & Brown (2009) examined the relationship between customer, wait staff and manager perceptions in fine dining restaurants and “Reliability” was found to be the most important dimension, followed by “Tangibles”, “Assurance”, “Responsiveness”, and “Empathy”. In an effort to adapt SERVQUAL to the restaurant industry, Stevens et al. (1995) developed the DINESERV instrument. The final version of DINESERV consisted of 29 items that captured the five dimensions of SERVQUAL. Kim et al. (2003) conducted a study to validate five dimensions of the DINESERV instrument in Korean casual dining restaurants and explored any possible differences in perceived service quality of those restaurants. Other studies on customer expectations and service quality perceptions in the restaurant industry have revealed certain important attributes, such as low price, food quality (food taste and nutrition properties), value for money, service, location, brand name, and image (Pettijohn et al., 1997; Johns & Howard, 1998). Sulek & Hensley (2004) investigated the relative importance of food, physical setting, and service
P. Ramseook-Munhurrun | IJMMR ♦ Vol. 5 ♦ No. 3 ♦ 2012
4
in a full-service restaurant and food quality was found to be the most important factor influencing satisfaction and the only factor predicting behavioral intention. Namkung & Jang (2007) evaluated the relationships of individual attributes that constitute food quality (e.g. food presentation, menu variety, healthy options, taste, food freshness and temperature) with customer satisfaction and behavioral intentions. The findings revealed that food presentation, taste and temperature were significantly related to customer satisfaction whereas food presentation, taste and healthy options (instead of temperature) were significant predictors of behavioral intention. The tangibles represent the restaurant’s physical attributes, which are usually noticed first by customers when they enter the restaurant. Yüksel & Yüksel (2002) examined tourist satisfaction with restaurant services and their study revealed that “service environment” such as seating arrangements, music decoration, is the critical determinant in shaping customers’ behavior. A recent study undertaken by Chow et al. (2007) investigating restaurant services in the Chinese context reveals that interaction with staff and the physical environment are the more important than the outcome quality in predicting service quality for restaurant customers. Similarly, Ryu & Jang (2007) explored the combined effect of atmospheric variables on behavioral intentions in upscale restaurants. Their findings revealed that ambience (e.g. music, aroma and temperature) and employee appearance had the most important influence on customers’ emotional responses, which in turn affected customers’ post-dining behavioral intentions. In their investigation, Han & Ryu (2009) findings suggest that a restaurant firm should carefully design the physical environment to improve the customer’s perceived reasonableness of the price. The authors further indicated that creative use of physical design in a restaurant operation would be essential in enhancing specific marketing objectives such as positive customer perception of quality, positive evaluation of experience, and positive attitudes. Service Quality, Customer Satisfaction and Behavioral Intentions In the restaurant industry, service quality has been found to be important in influencing both customer satisfaction and return intention (Qu, 1997; Pettijohn et al., 1997; Oh, 2000; Ladhari et al., 2008; Kim et al., 2009). While there is no guarantee that a satisfied customer will be a repeat customer, it is most likely that a dissatisfied customer will not return (Soriano, 2002). Therefore customer satisfaction is imperative for service organizations because of the positive correlation it has with future attitudes, intentions and behaviors of customers (Taylor & Baker, 1994; Mattila, 2000). Even though behavioral intentions and customer satisfaction are not the same, they are related because the outcome of satisfaction may reinforce a customer’s decision to use a particular brand of service on a given occasion (Oliver, 1980; Cronin & Taylor, 1992). According to Zeithaml et al. (1996), behavioral intentions can be measured by repurchase intentions, word-of-mouth, loyalty, complaining behavior and price sensitivity. Studies have also shown that when customers perceive poor service quality and when dissatisfaction is felt, the customers are likely to complain about the service and engage in negative word-of-mouth (Richins, 1983; Singh, 1990). Thus customer satisfaction is often used to predict the likelihood of customers returning to a service organization. Previous studies have shown that customer satisfaction is important to food service managers because it leads to repeat patronage, brand loyalty, and new customers through word-of-mouth promotion (Oh, 2000; Yüksel & Yüksel, 2002). According to Gupta et al. (2007), the link between customer satisfaction and repeat buying is an important contributor to a restaurant’s profits. Hence studies investigating these links have been numerous and the literature reveals evidence of strong relationships between customer satisfaction with various restaurant attributes and repeat-purchase intentions (Stevens et al., 1995; Pettijohn et al., 1997; Kivela et al., 1999; Sulek & Hensley, 2004; Söderlund & Öhman, 2005; Cheng, 2005). Other studies have established the relationships between service quality, customer satisfaction and behavioral intentions, namely intention to return and to recommend. Qu (1997) found that food quality in Chinese restaurants was the most important determinants of customer’s decision to return, followed by
INTERNATIONAL JOURNAL OF MANAGEMENT AND MARKETING RESEARCH ♦VOLUME 5 ♦NUMBER 3 ♦2012
5
cleanliness, value, price and convenience, which ranked second, third, fourth and fifth, respectively. Namkung & Jang (2008) also investigated how food quality is perceived in relation to satisfaction and behavioral intentions in mid-to upscale restaurants. Their study showed that overall food quality significantly affected customer satisfaction and behavioral intentions and also revealed that the relationship between food quality and customer behavioral intentions was mediated by satisfaction. Ladhari et al. (2008) investigated determinants of dining satisfaction and post-dining behavioral intentions, and concluded that perceived service quality influenced customer satisfaction through both positive and negative emotions. Based on the literature review, this study investigated customers’ perceptions of restaurants in an island economy terms of food related attributes, service-related attributes and atmosphere-related attributes, and identified the key attributes affecting customer satisfaction and behavioral intentions. Hence, the following hypotheses have been developed: H1: A positive relationship exists between perceived service quality dimensions and satisfaction. H2: Customer satisfaction and perceived service quality positively influence intention to revisit. H3: Customer satisfaction and perceived service quality positively influence intention to recommend. RESEARCH METHODOLOGY Based on a thorough literature review, a self-administered questionnaire was developed to collect data from restaurants in Mauritius. The survey instrument composed of three sections measuring service quality perceptions, customer satisfaction and behavioral intentions, and demographic variables. The first section measured customers’ perceptions of restaurant service quality. This section adopted statements from the SERVPERF model (Cronin & Taylor, 1992) and on previous research findings in the food service sector (Stevens et al., 1995; Kivela et al., 1999; Raajpoot, 2002). Some modifications were made to the SERVPERF items in order to suit the context of restaurant with added items related to food quality. These added items were thought to be important to customers’ dining experience, namely availability of fresh food, well-presented food and taste of food. The modified SERVPERF instrument thus consisted of 6 dimensions and 25 statements instead of 22 statements. The 25 service quality statements were measured on a 5-point Likert-type scale ranging from “1 = strongly disagree” to “5 = strongly agree”. The second section of the survey instrument assessed customers’ overall satisfaction and behavioral intentions. Overall customer satisfaction is measured using two items: Overall, how satisfied are you with the restaurant? (from “1 = very dissatisfied” to “5 = very satisfied”) and I am happy about my decision to use this restaurant services (from “1 = strongly disagree” to 5 = strongly agree”). This study focused on revisit intentions and willingness to recommend as specific forms of behavioral intentions. Two items, which were taken from Zeithaml et al. (1996), were measured using a 5-point Likert-type scale (1 = strongly disagree and 5 = strongly agree). In the third section, respondents’ socio-demographic characteristics, such as age and gender, were gathered. Using convenience sampling technique, customers willing to participate in the survey were approached after they had finished their dinner and were waiting to pay the bill in three restaurants in Port-Louis, the capital of Mauritius. The restaurants characterised in this study comprised of a dining experience which provides a wide range of items from appetizers to deserts with a themed setting. The restaurants further provide professional service, distinctive presentations, elegant décor, exceptional food, and generates the average check of above US$15 per person. The survey was carried out over a 7-day period throughout four weeks. A total of 350 questionnaires were given to the customers in the restaurants, requesting them to evaluate their dining experience by filling in the survey. Of these, 318 questionnaires were returned and in all, 296 questionnaires were found usable for the study, which represents a 85% response rate from the original sample of 350.
P. Ramseook-Munhurrun | IJMMR ♦ Vol. 5 ♦ No. 3 ♦ 2012
6
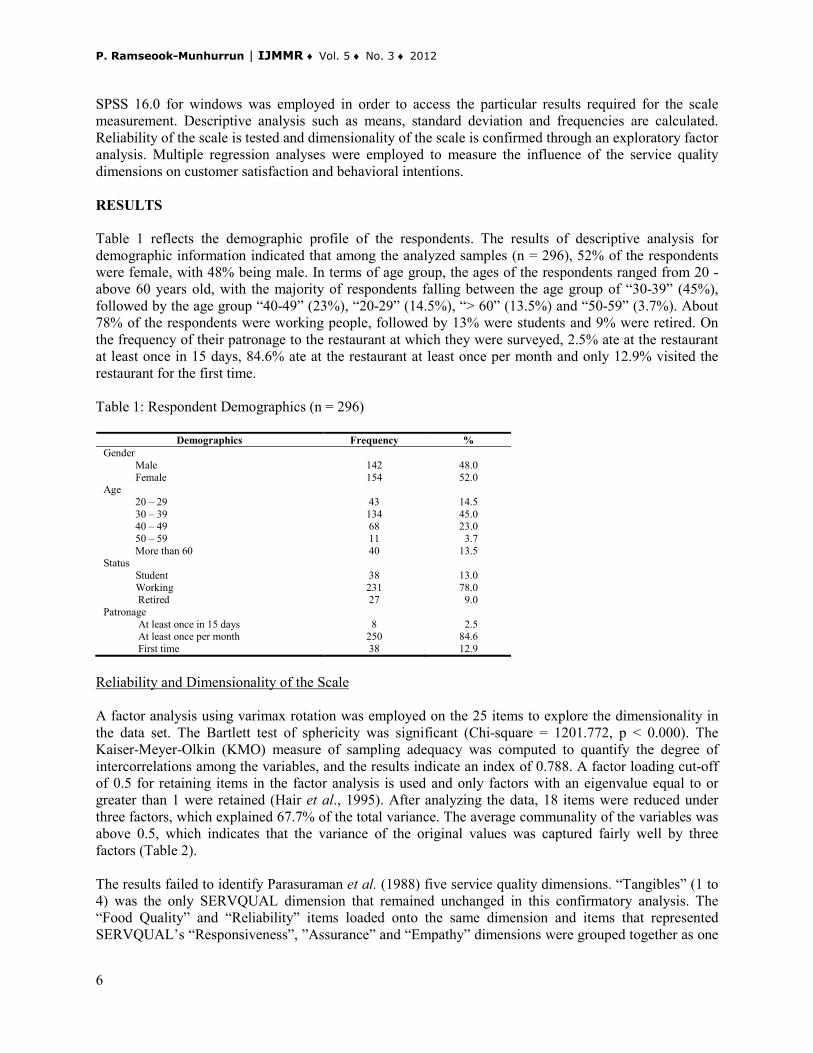
SPSS 16.0 for windows was employed in order to access the particular results required for the scale measurement. Descriptive analysis such as means, standard deviation and frequencies are calculated. Reliability of the scale is tested and dimensionality of the scale is confirmed through an exploratory factor analysis. Multiple regression analyses were employed to measure the influence of the service quality dimensions on customer satisfaction and behavioral intentions. RESULTS Table 1 reflects the demographic profile of the respondents. The results of descriptive analysis for demographic information indicated that among the analyzed samples (n = 296), 52% of the respondents were female, with 48% being male. In terms of age group, the ages of the respondents ranged from 20 - above 60 years old, with the majority of respondents falling between the age group of “30-39” (45%), followed by the age group “40-49” (23%), “20-29” (14.5%), “> 60” (13.5%) and “50-59” (3.7%). About 78% of the respondents were working people, followed by 13% were students and 9% were retired. On the frequency of their patronage to the restaurant at which they were surveyed, 2.5% ate at the restaurant at least once in 15 days, 84.6% ate at the restaurant at least once per month and only 12.9% visited the restaurant for the first time. Table 1: Respondent Demographics (n = 296)
Demographics Frequency % Gender Male Female
142 154
48.0 52.0
Age 20 – 29 30 – 39 40 – 49 50 – 59 More than 60
43 134 68 11 40
14.5 45.0 23.0 3.7 13.5
Status Student Working Retired
38 231 27
13.0 78.0 9.0
Patronage At least once in 15 days At least once per month First time
8
250 38
2.5 84.6 12.9
Reliability and Dimensionality of the Scale A factor analysis using varimax rotation was employed on the 25 items to explore the dimensionality in the data set. The Bartlett test of sphericity was significant (Chi-square = 1201.772, p < 0.000). The Kaiser-Meyer-Olkin (KMO) measure of sampling adequacy was computed to quantify the degree of intercorrelations among the variables, and the results indicate an index of 0.788. A factor loading cut-off of 0.5 for retaining items in the factor analysis is used and only factors with an eigenvalue equal to or greater than 1 were retained (Hair et al., 1995). After analyzing the data, 18 items were reduced under three factors, which explained 67.7% of the total variance. The average communality of the variables was above 0.5, which indicates that the variance of the original values was captured fairly well by three factors (Table 2). The results failed to identify Parasuraman et al. (1988) five service quality dimensions. “Tangibles” (1 to 4) was the only SERVQUAL dimension that remained unchanged in this confirmatory analysis. The “Food Quality” and “Reliability” items loaded onto the same dimension and items that represented SERVQUAL’s “Responsiveness”, ”Assurance” and “Empathy” dimensions were grouped together as one
INTERNATIONAL JOURNAL OF MANAGEMENT AND MARKETING RESEARCH ♦VOLUME 5 ♦NUMBER 3 ♦2012
7
dimension. This indicates that the customers view “Food Quality and Reliability” as one dimension and “Responsiveness-Assurance-Empathy” as a single dimension and not three separate ones. The items for each subscale were subjected to reliability analysis and the alpha coefficient for the total scale was 0.77 and 0.66, 0.62 and 0.6 respectively for the dimensions “Tangibles”, “Food Quality-Reliability” and “Responsiveness-Assurance-Empathy”. According to Nunnally (1994) reliability coefficients greater than or equal to 0.50 are considered sufficient for exploratory studies. Given the increasing importance of the restaurant market, restaurant operators need to know how customers perceive restaurant service quality. In this study, a modified SERVPERF instrument was used to investigate customers’ perceptions of restaurant service quality and the results revealed three dimensions. Parasuraman et al. (1991) found a large interrelationship among SERVQUAL’s five dimensions, especially “responsiveness, assurance, and empathy, implying that one factor is the antecedent for another. So for customers, Responsiveness might be an antecedent of Assurance and Empathy suggesting that staff in the restaurants need to provide prompt service to customers (Responsiveness) for staff knowledge to be appreciated (Assurance) and thus demonstrating that they care for their customers (Empathy).
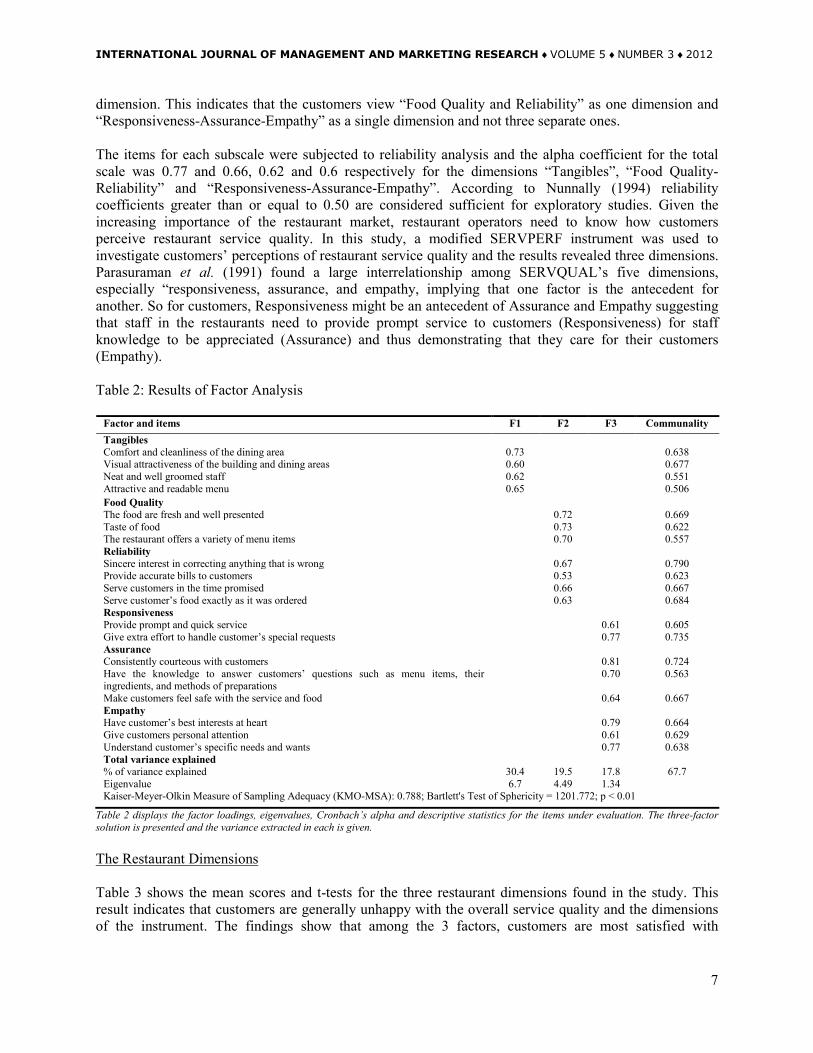
Table 2: Results of Factor Analysis
Factor and items F1 F2 F3 Communality Tangibles Comfort and cleanliness of the dining area 0.73 0.638 Visual attractiveness of the building and dining areas 0.60 0.677 Neat and well groomed staff 0.62 0.551 Attractive and readable menu 0.65 0.506 Food Quality The food are fresh and well presented 0.72 0.669 Taste of food 0.73 0.622 The restaurant offers a variety of menu items 0.70 0.557 Reliability Sincere interest in correcting anything that is wrong 0.67 0.790 Provide accurate bills to customers 0.53 0.623 Serve customers in the time promised 0.66 0.667 Serve customer’s food exactly as it was ordered 0.63 0.684 Responsiveness Provide prompt and quick service 0.61 0.605 Give extra effort to handle customer’s special requests 0.77 0.735 Assurance Consistently courteous with customers 0.81 0.724 Have the knowledge to answer customers’ questions such as menu items, their ingredients, and methods of preparations
0.70 0.563
Make customers feel safe with the service and food 0.64 0.667 Empathy Have customer’s best interests at heart 0.79 0.664 Give customers personal attention 0.61 0.629 Understand customer’s specific needs and wants 0.77 0.638 Total variance explained % of variance explained 30.4 19.5 17.8 67.7 Eigenvalue 6.7 4.49 1.34 Kaiser-Meyer-Olkin Measure of Sampling Adequacy (KMO-MSA): 0.788; Bartlett's Test of Sphericity = 1201.772; p < 0.01
Table 2 displays the factor loadings, eigenvalues, Cronbach’s alpha and descriptive statistics for the items under evaluation. The three-factor solution is presented and the variance extracted in each is given. The Restaurant Dimensions Table 3 shows the mean scores and t-tests for the three restaurant dimensions found in the study. This result indicates that customers are generally unhappy with the overall service quality and the dimensions of the instrument. The findings show that among the 3 factors, customers are most satisfied with
P. Ramseook-Munhurrun | IJMMR ♦ Vol. 5 ♦ No. 3 ♦ 2012
8
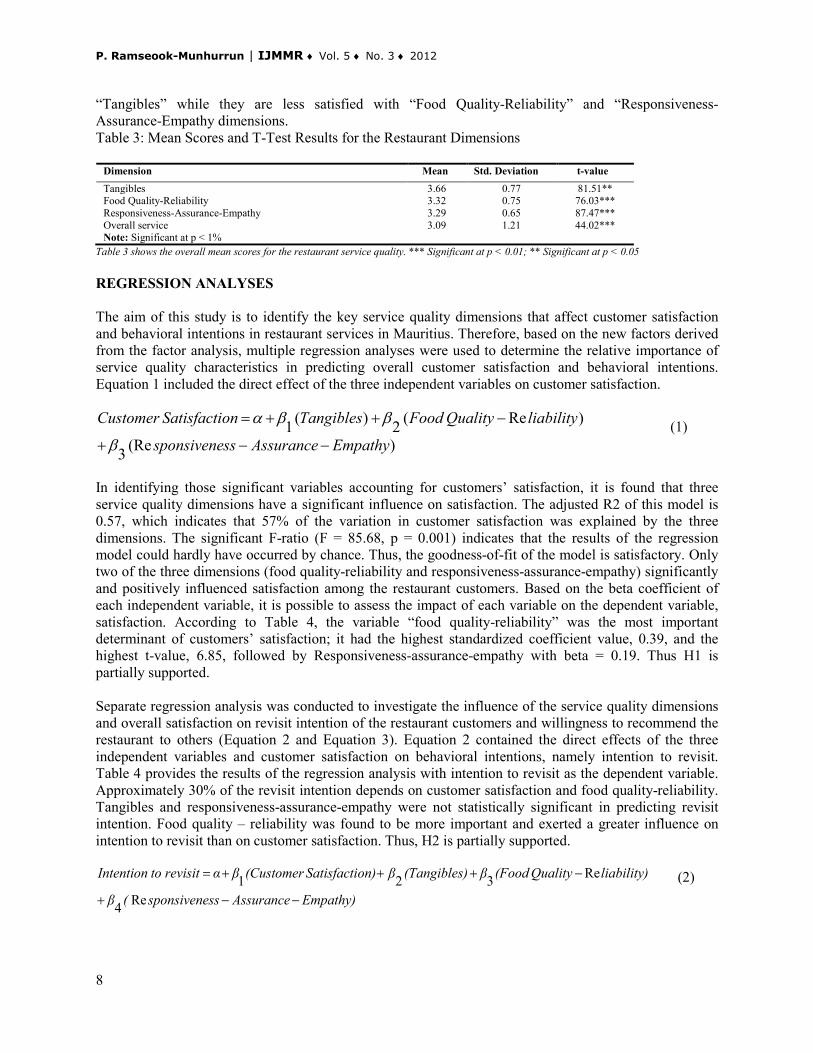
“Tangibles” while they are less satisfied with “Food Quality-Reliability” and “Responsiveness-Assurance-Empathy dimensions. Table 3: Mean Scores and T-Test Results for the Restaurant Dimensions
Dimension Mean Std. Deviation t-value Tangibles 3.66 0.77 81.51** Food Quality-Reliability 3.32 0.75 76.03*** Responsiveness-Assurance-Empathy 3.29 0.65 87.47*** Overall service 3.09 1.21 44.02*** Note: Significant at p < 1%
Table 3 shows the overall mean scores for the restaurant service quality. *** Significant at p < 0.01; ** Significant at p < 0.05 REGRESSION ANALYSES The aim of this study is to identify the key service quality dimensions that affect customer satisfaction and behavioral intentions in restaurant services in Mauritius. Therefore, based on the new factors derived from the factor analysis, multiple regression analyses were used to determine the relative importance of service quality characteristics in predicting overall customer satisfaction and behavioral intentions. Equation 1 included the direct effect of the three independent variables on customer satisfaction.
)(Re3
)Re(2)(1EmpathyAssurancesssponsivene
liabilityQualityFoodTangiblesonSatisfactiCustomer
−−+
−++=
β
ββα (1)
In identifying those significant variables accounting for customers’ satisfaction, it is found that three service quality dimensions have a significant influence on satisfaction. The adjusted R2 of this model is 0.57, which indicates that 57% of the variation in customer satisfaction was explained by the three dimensions. The significant F-ratio (F = 85.68, p = 0.001) indicates that the results of the regression model could hardly have occurred by chance. Thus, the goodness-of-fit of the model is satisfactory. Only two of the three dimensions (food quality-reliability and responsiveness-assurance-empathy) significantly and positively influenced satisfaction among the restaurant customers. Based on the beta coefficient of each independent variable, it is possible to assess the impact of each variable on the dependent variable, satisfaction. According to Table 4, the variable “food quality-reliability” was the most important determinant of customers’ satisfaction; it had the highest standardized coefficient value, 0.39, and the highest t-value, 6.85, followed by Responsiveness-assurance-empathy with beta = 0.19. Thus H1 is partially supported.
Separate regression analysis was conducted to investigate the influence of the service quality dimensions and overall satisfaction on revisit intention of the restaurant customers and willingness to recommend the restaurant to others (Equation 2 and Equation 3). Equation 2 contained the direct effects of the three independent variables and customer satisfaction on behavioral intentions, namely intention to revisit. Table 4 provides the results of the regression analysis with intention to revisit as the dependent variable. Approximately 30% of the revisit intention depends on customer satisfaction and food quality-reliability. Tangibles and responsiveness-assurance-empathy were not statistically significant in predicting revisit intention. Food quality – reliability was found to be more important and exerted a greater influence on intention to revisit than on customer satisfaction. Thus, H2 is partially supported.
Empathy)Assurancesssponsivene(β
liability)Quality(Foodβ)(Tangiblesβon)Satisfacti(CustomerβαrevisittoIntention
−−+
−+++=
Re4
Re321 (2)
INTERNATIONAL JOURNAL OF MANAGEMENT AND MARKETING RESEARCH ♦VOLUME 5 ♦NUMBER 3 ♦2012
9
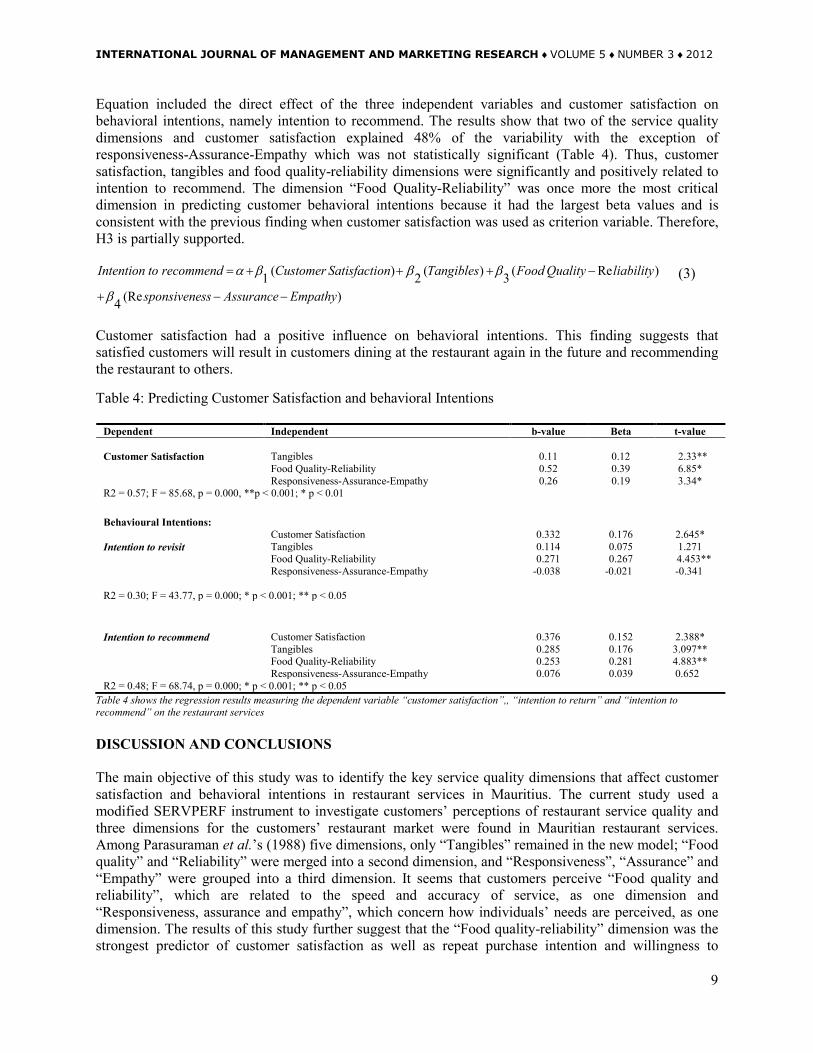
Equation included the direct effect of the three independent variables and customer satisfaction on behavioral intentions, namely intention to recommend. The results show that two of the service quality dimensions and customer satisfaction explained 48% of the variability with the exception of responsiveness-Assurance-Empathy which was not statistically significant (Table 4). Thus, customer satisfaction, tangibles and food quality-reliability dimensions were significantly and positively related to intention to recommend. The dimension “Food Quality-Reliability” was once more the most critical dimension in predicting customer behavioral intentions because it had the largest beta values and is consistent with the previous finding when customer satisfaction was used as criterion variable. Therefore, H3 is partially supported.
)(Re4
)Re(3)(2)(1EmpathyAssurancesssponsivene
liabilityQualityFoodTangiblesonSatisfactiCustomerrecommendtoIntention
−−+
−+++=
β
βββα (3)
Customer satisfaction had a positive influence on behavioral intentions. This finding suggests that satisfied customers will result in customers dining at the restaurant again in the future and recommending the restaurant to others.
Table 4: Predicting Customer Satisfaction and behavioral Intentions
Dependent Independent b-value Beta t-value Customer Satisfaction
Tangibles
0.11
0.12
2.33**
Food Quality-Reliability 0.52 0.39 6.85* Responsiveness-Assurance-Empathy 0.26 0.19 3.34* R2 = 0.57; F = 85.68, p = 0.000, **p < 0.001; * p < 0.01 Behavioural Intentions: Intention to revisit
Customer Satisfaction Tangibles
0.332 0.114
0.176 0.075
2.645* 1.271
Food Quality-Reliability 0.271 0.267 4.453** Responsiveness-Assurance-Empathy -0.038 -0.021 -0.341 R2 = 0.30; F = 43.77, p = 0.000; * p < 0.001; ** p < 0.05
Intention to recommend
Customer Satisfaction
0.376
0.152
2.388*
Tangibles 0.285 0.176 3.097** Food Quality-Reliability 0.253 0.281 4.883** Responsiveness-Assurance-Empathy 0.076 0.039 0.652 R2 = 0.48; F = 68.74, p = 0.000; * p < 0.001; ** p < 0.05
Table 4 shows the regression results measuring the dependent variable “customer satisfaction”,, “intention to return” and “intention to recommend” on the restaurant services DISCUSSION AND CONCLUSIONS The main objective of this study was to identify the key service quality dimensions that affect customer satisfaction and behavioral intentions in restaurant services in Mauritius. The current study used a modified SERVPERF instrument to investigate customers’ perceptions of restaurant service quality and three dimensions for the customers’ restaurant market were found in Mauritian restaurant services. Among Parasuraman et al.’s (1988) five dimensions, only “Tangibles” remained in the new model; “Food quality” and “Reliability” were merged into a second dimension, and “Responsiveness”, “Assurance” and “Empathy” were grouped into a third dimension. It seems that customers perceive “Food quality and reliability”, which are related to the speed and accuracy of service, as one dimension and “Responsiveness, assurance and empathy”, which concern how individuals’ needs are perceived, as one dimension. The results of this study further suggest that the “Food quality-reliability” dimension was the strongest predictor of customer satisfaction as well as repeat purchase intention and willingness to
P. Ramseook-Munhurrun | IJMMR ♦ Vol. 5 ♦ No. 3 ♦ 2012
10
recommend. These aspects of quality are judged to be more important in the minds of the Mauritian customers, and thus will be the key determinants of customer satisfaction and behavioral intentions. This result partially is consistent with the previous findings of Pettijohn et al. (1997), Sulek & Hensley (2004) and Kim et al. (2009) that food quality dimension positively influences satisfaction and behavioral intentions. When analyzing customer satisfaction with likelihood of repeat patronage and intention to recommend, the results showed that customer satisfaction is positive and significantly related to both. The findings are in line with the previous results of Ranaweera & Prabhu (2003). The success of restaurant businesses relies on providing superior service quality, value, and customer satisfaction, which in turn enhances customer behavioral intentions. The customer’s post-dining decision whether to return or not to return to the restaurant is the moment of final truth for the restaurant manager. This study has been the first attempt to gauge the importance of quality dimensions that influence service quality in restaurant services in Mauritius. Theoretically, this study has confirmed the importance of some established dimensions like tangibles (Parasuraman et al., 1985, 1988, 1991; LeBlanc, 1992), and intangibles (reliability, responsiveness, assurance, empathy, food quality) of the service experience (Parasuraman et al., 1985, 1988, 1991; Andaleeb and Conway, 2006). This study contributes to the existing literature by confirming the importance of some key attributes in a different cultural setting. The understanding of restaurant operators that “tangibles”, “food quality-reliability” and “responsiveness-assurance-empathy” are not just important to diners in West but are important to diners everywhere. It is important for restaurant operators in Mauritius to pay more attention to providing friendly services that makes customers feel valued and cared for. Improvement of visual appeal, food taste, freshness and provision of accurate and reliable service might help restaurant operators meet or exceed customer expectations and improve repeat patronage and willingness to recommend. Improving service quality will not only strengthen customer loyalty, but also improve the restaurant’s reputation, and result in more sales and greater revenue in the long term. Limitations and Future Research This study has several limitations. First, the results of this study cannot be applied conclusively to the whole restaurant sector in Mauritius because it was conducted in only one region of the island. To be able to generalize the findings for the restaurant sector, a study that would include more restaurants in different geographic locations could be conducted. Secondly, most of the dimensions employed in this study were adapted from the existing scales created in the context of the United States; the minor modification might not be enough when applying them to a different culture like small island state. Therefore, more exploratory analysis is necessary in this area. In addition, omission of other factors such as price, perceived value and waiting time, related to the service quality in restaurant service could be considered in future research. REFERENCES Arasli, H., Ekiz, E.H. & Katircioglu, S.T. (2008). Gearing service quality into public and private hospitals in small islands: Empirical evidence from Cyprus. International Journal of Health Care Quality Assurance, 21(1), 8-23. Babakus, E. & Boller, G.W. (1992). An empirical assessment of the SERVQUAL scale. Journal of Business Research, 24(2), 253-268. Baker, D.A. & Crompton, J.L. (2000). Quality, satisfaction and behavioral intentions. Annals of Tourism Research, 27(3), 785–804.
INTERNATIONAL JOURNAL OF MANAGEMENT AND MARKETING RESEARCH ♦VOLUME 5 ♦NUMBER 3 ♦2012
11
Becker, C., Murrmann, S.K, Murrmann, K.F. & Cheung, G.W. (1999). A pan-cultural study of restaurant service expectations in the United States and Hong Kong. Journal of Hospitality and Tourism Research, 23(3), 235-255. Bitner, M.J. (1992). Servicesscapes: The Impact of Physical Surroundings on Customers and Employees. Journal of Marketing, 56, 57-71. Bojanic, D.C. & Rosen, L.D. (1994). Measuring service quality in restaurants: An application of the SERVQUAL instrument. Hospitality Research Journal, 18(1), 4-14. Bolton, R.N. & Drew, J. H. (1991). A longitudinal analysis of the impact of service changes on customer attitudes. Journal of Marketing, 55(1), 1-9. Boulding, W., Kalra, A., Staelin, R. & Zeithaml, V.A. (1993). A dynamic process model of service quality: From expectations to behavioral intentions. Journal of Marketing Research, 30(1), 7-27. Carman, J.M. (1990). Consumer Perceptions of Service Quality: An Assessment of the SERVQUAL Dimension. Journal of Retailing, 66(1), 33-55. Cheng, K. (2005). A research on the determinants of consumers’ repurchase toward different classes of restaurants in Taiwan. Business Review, 4(2), 99-105. Chow, I.H., Lau, V.P., Lo, T.W., Sha, Z. & Yun, H. (2007). Service quality in restaurant operations in China: decision- and experiential-oriented perspectives. International Journal of Hospitality Management, 26(3), 698–710. Cronin, J.J. & Taylor, S.A. (1992). Measuring service quality: a re-examination and extension. Journal of Marketing, 56(3), 55-68. Cronin, J.J. & Taylor, S.A. (1994). SERVPERF versus SERVQUAL: reconciling performance based and perceptions minus expectations measurement of service quality. Journal of Marketing, 58, 125-131. Fornell, C., Johnson, M.D., Anderson, E.W., Cha, J. & Bryant, B.E. (1996). The American customer satisfaction index: Nature, purpose and findings. Journal of Marketing, 60, 7–18. Fick, G.R. & Ritchie, J.R.B. (1991). Measuring service quality in the travel and tourism industry. Journal of Travel Research, 30(2), 2-9. Gupta, S., McLaughlin, E. & Gomez, M. (2007). Guest satisfaction and restaurant performance. Cornell Hotel and Restaurant Administration Quaterly, 48(3), 284-298. Grönroos, C. (1984). A service quality model and its marketing implications. European Journal of Marketing, 18(4), 36-44. Grönroos, C. (1988). Service quality: The six criteria of good perceived service quality. Review of Business, 9(3), 10-13. Hair, J.F., Anderson, R. & Black, W.C. (1995). Multivate data analysis with reading. Prentice-Hall, New Jersey.
P. Ramseook-Munhurrun | IJMMR ♦ Vol. 5 ♦ No. 3 ♦ 2012
12
Han, H. & Ryu, K. (2009). The roles of the physical environment, price perception, and customer satisfaction in determining customer loyalty in the restaurant industry. Journal of Hospitality & Tourism Research, 33(4), 487-510 Jabnoun, N. & Al-Tamimi, H.A.H. (2003). Assuring perceived service quality at UAE commercial banks. International Journal of Quality & Reliability Management, 20(4), 458-472. Jones P.A. (1983). The restaurant, a place for quality control and product maintenance. International Journal of Hospitality Management, 2(2), 93-100. Johns, N. & Howard, A. (1998). Customer expectations versus perceptions of service performance in the foodservice industry. International Journal of Service Industry Management, 9(3), 248-265. Johns, N. & Pine, R. (2002). Consumer behavior in the food service industry: a review. International Journal of Hospitality Management, 21(2), 119–134. Kalra, R. (2001). Please please me. Restaurant Business, 100(4), 22. Kim H-J., McCahon, C. & Miller, J. (2003). Assessing service quality in Korean casual-dining restaurants using DINESERV. Journal of Foodservice Business Research, 6, 67–86. Kim, W.G., Ng, C.Y.N. & Kim, Y-S. (2009). Influence of institutional DINESERV on customer satisfaction, return intention, and word-of-mouth. International Journal of Hospitality Management, 28(1), 10-17 Kivela, J., Inbakaran, R. & Reece, J. (1999). Consumer research in the restaurant environment, Part 1: A conceptual model of dining satisfaction and return patronage. International Journal of Contemporary Hospitality Management, 11(5), 205-222. Kivela, J., Inbakaran, R. & Reece, J. (2000). Consumer research in the restaurant environment, Part 3: Analysis, findings and conclusions. International Journal of Contemporary Hospitality Management, 12(1), 13-30. Ladhari, R., Brun, I. & Morales, M. (2008). Determinants of dining satisfaction and post-dining behavioral intentions. International Journal of Hospitality Management, 27(4), 568-573. Lee, Y.L. & Hing, N. (1995). Measuring quality in restaurant operations: An application of the SERVQUAL instrument. International Journal of Hospitality Management, 14(3/4), 293-310. Lehtinen, U. & Lehtinen, J.R. (1991). Two approaches to service quality dimensions. The Service Industries Journal, 11(3), 287-303. McDougall, G.H. & Levesque, T. (2000). Customer satisfaction with service: Putting perceived value into the equation. Journal of Services Marketing, 14(5), 392–410. Mangold, W.G. & Babakus, E. (1990). Monitoring service quality. Review of Business, 11(4), 21-31. Mattila, A.S. (2000). When does mood matter? An examination of two types of hospitality service encounters. Journal of Hospitality and Leisure Marketing, 7(3), 55 – 65.
INTERNATIONAL JOURNAL OF MANAGEMENT AND MARKETING RESEARCH ♦VOLUME 5 ♦NUMBER 3 ♦2012
13
Namkung, Y. & Jang, S.C. (2008). Are highly satisfied restaurant customers really different? A quality perception perspective. International Journal of Cointemporary Hospitality Management, 20(2), 142-155. Nunnally, J.C. (1994). Psychometric theory. New York: McGraw-Hill Oh, H. (2000). Diners’ perception of quality, value, and satisfaction: a practical viewpoint. Cornell Hotel and Restaurant Administration Quarterly, 41(3), 58–66. Oliver, R.L. (1980). A cognitive model for the antecedents and consequences of satisfaction decisions. Journal of Marketing Research, 27(4), 460-469. Oliver, R.L. (1994). Conceptual issues in the structural analysis of consumption emotion, satisfaction and quality: Evidence in a service setting. Advances in Consumer Research, 21, 16-22. Oliver, R.L. (1997). A Behavioral Perspective on the Consumer. McGraw-Hill, New York, N.Y Oubre, J.J. & Brown, D.M. (2009). Stakeholder service perspectives: A triadic analysisof service quality in South Mississippi fine-dining restaurants. Journal of Hospitality and Tourism Research, 3(2), 193-210. Parasuraman, A., Zeithaml, V.A. & Berry, L.L. (1988). SERVQUAL: a multiple item scale for measuring consumer perceptions of service quality. Journal of Retailing, 64(5), 21- 40. Parasuraman, A., Berry, L.L. & Zeithaml, V.A. (1991). Refinement and reassessment of the SERVQUAL scale. Journal of Retailing, 67(4), 420-450. Pettijohn, L.S., Pettijohn, C.E. & Luke, R. (1997). An evaluation of fast food restaurant satisfaction: determinants, competitive comparisons and impact on future patronage. Journal of Restaurant and Foodservice Marketing, 2(3), 3–20. Qu, H. (1997). Determinant factors and choice intention for Chinese restaurant dining: a multivariate approach. Journal of Restaurant and Foodservice Marketing, 2(2), 35-49. Quester, P. & Romaniuk, S. (1997). Service quality in the Australian advertising industry: a methodological study. Journal of Services Marketing, 11, 180–92. Raajpoot, N.A. (2002). TANGSERV: A multiple item scale for measuring tangible quality in foodservice industry. Journal of Foodservice Business Research, 5(2), 109-127. Richins, M. (1983). Negative word-of-mouth by dissatisfied customers: A pilot study. Journal of Marketing, 47 (Winter), 68-78. Rust, R.T. & Oliver, R.L. (1994). Service quality: insights and managerial implications from the frontier. In Rust, R.T., Oliver, R.L. (Eds), Service Quality: New Directions in Theory and Practice. Sage, London, 1–20. Saleh, F. & Ryan, C. (1992). Analyzing service quality in the hospitality industry using SERVQUAL model. The Service Industries Journal, 11(3), 324-343. Singh, J. (1990). Voice, exit and negative word-of-mouth behaviors: an investigation across three service categories. Academy of Marketing Service, 18(1), 1-15.
P. Ramseook-Munhurrun | IJMMR ♦ Vol. 5 ♦ No. 3 ♦ 2012
14
Söderlund, M. & Öhman, N. (2005). Assessing behavior before it becomes behavior: An examination of the role of intentions as a link between satisfaction and repatronizing behavior. International Journal Service Industry Management, 16(2), 169-85. Soriano, D.R. (2002). Customers’ expectations factors in restaurants: The situation in Spain. International Journal of Quality & Reliability Management, 19(8/9), 1055-1067. Spreng, R. & Mackoy, R.D. (1996). An empirical examination of a model of perceived service quality and satisfaction. Journal of Retailing, 72(2), 201 – 214. Stevens, P., Knutson, B. & Patton, M. (1995). DINESERV: A tool for measuring service quality in restaurants. Cornell Hotel and Restaurant Administration Quarterly, 36(2), 56-60. Sulek, J.M. & Hensley, R.L. (2004). The relative importance of food, atmosphere and fairness of wait. Cornell Hotel and Restaurant Administration Quarterly, 45(3), 235-247. Sureshchandar, G.S., Rajendran, C. & Kamalanabhan, T.J. (2001). Customer perceptions of service quality: a critique. Total Quality Management, 12(1), 111-124. Susskind, A.M. & Chan, E.K. (2000). How restaurant features affect check averages. Cornell Hotel and Restaurant Administration Quarterly, 42(6), 56–63. Tan, K.C. & Kek, S.W. (2004). Service Quality in Higher Education using an enhanced SERVQUAL approach. Quality in Higher Education, 10(1), 17-24. Taylor, S.A. & Baker, T.L. (1994). An assessment of the relationships between service quality and customer satisfaction in the formation of consumers’ purchase intentions. Journal of Retailing, 72(2), 163-178. Teas, R.K. (1993). Expectations, performance evaluation and customer’s perceptions of quality. Journal of Marketing, 57(4), 18-34. Yüksel, A. & Rimmington, M. (1998). Customer-satisfaction measurement. Cornell Hotel and Restaurant Administration Quarterly, 39(6), 60-71. Yüksel, A. & Yuksel, F. (2002). Measurement of tourist satisfaction with restaurant services: a segment-based approach. Journal of Vacation Marketing, 9(1), 52-68. Zeithaml, V.A., Berry, L.L. & Parasuraman, A. (1996). The behavioural consequences of service quality. Journal of Marketing, 60(2), 31-46. BIOGRAPHY Prabha Ramseook-Munhurrun is a Lecturer in Services Management in the School of Sustainable Development and Tourism at the University of Technology, Mauritius. Her research focuses on service quality, customer satisfaction and waiting experiences. Prabha Ramseook-Munhurrun is the corresponding author and can be contacted at: [email protected]