Perceived and Actual Risks of Drought : Household and ...
43
Perceived and Actual Risks of Drought : Household and Expert Views From Lower Teesta River Basin of Northern Bangladesh Roquia Salam Begum Rokeya University Bonosri Ghose Begum Rokeya University Badhon Kumar Shill Begum Rokeya University Md. Aminul Islam Begum Rokeya University A R M Towヲqul Islam ( towヲ[email protected] ) Begum Rokeya University https://orcid.org/0000-0001-5779-1382 Md. Abdus Sattar Patuakhali Science and Technology University G M Monirul Alam Bangabandhu Sheikh Mujibur Rahman Agricultural University Bayes Ahmed University College London Research Article Keywords: Drought risk perception, Actual risk and perceived risk, Household and expert, Teesta River Posted Date: March 18th, 2021 DOI: https://doi.org/10.21203/rs.3.rs-310699/v1 License: This work is licensed under a Creative Commons Attribution 4.0 International License. Read Full License
Transcript of Perceived and Actual Risks of Drought : Household and ...

Perceived and Actual Risks of Drought : Householdand Expert Views From Lower Teesta River Basin ofNorthern BangladeshRoquia Salam
Begum Rokeya UniversityBonosri Ghose
Begum Rokeya UniversityBadhon Kumar Shill
Begum Rokeya UniversityMd. Aminul Islam
Begum Rokeya UniversityA R M Tow�qul Islam ( tow�[email protected] )
Begum Rokeya University https://orcid.org/0000-0001-5779-1382Md. Abdus Sattar
Patuakhali Science and Technology UniversityG M Monirul Alam
Bangabandhu Sheikh Mujibur Rahman Agricultural UniversityBayes Ahmed
University College London
Research Article
Keywords: Drought risk perception, Actual risk and perceived risk, Household and expert, Teesta River
Posted Date: March 18th, 2021
DOI: https://doi.org/10.21203/rs.3.rs-310699/v1
License: This work is licensed under a Creative Commons Attribution 4.0 International License. Read Full License

1
Perceived and actual risks of drought : Household and expert views from lower Teesta 1
River Basin of northern Bangladesh 2
3
Roquia Salam1, Bonosri Ghose1, Badhon Kumar Shill1, Md. Aminul Islam1, Abu Reza Md. 4
Towfiqul Islam1,*, Md. Abdus Sattar2, G M Monirul Alam3, Bayes Ahmed4 5
1Department of Disaster Management, Begum Rokeya University, Rangpur 5400, Bangladesh 6
2Department of Disaster Risk Management, Patuakhali Science and Technology University, 7
Bangladesh 8
3Department of Agribusiness, Bangabandhu sheikh Mujibur Rahman Agricultural University, 9
Dhaka, Bangladesh 10
4Institute for Risk and Disaster Reduction (IRDR), University College London (UCL), London, 11
UK 12
13
*Corresponding author: [email protected] 14
Abu Reza Md. Towfiqul Islam, PhD 15
ORCID: 0000-0001-5779-1382 16
Tel: +880-2-58616687 17
Fax: +880-2-58617946 18
19
Abstract 20
Disaster risk perception, as well as risk appraisal, play a pivotal role in making the disaster risk 21
reduction policy. This study examines the actual vs perceived drought risks by constructing risk 22
indices at the household and expert levels using survey data from the lower Teesta River Basin in 23
northern Bangladesh. Survey data were collected from 450 farmers based on the structural 24

2
questionnaire. A composite drought risk index was developed to understand households’ 25
perceived and actual risks in the designated areas. The results show that the actual and perceived 26
risk values differ significantly among the three designated sites of Ganai, Ismail, and Par Sekh 27
Sundar. The risk levels also differ significantly across the household’s gender, income, 28
occupation, and educational attainment. People with poor socio-economic status are more prone 29
to drought risk than others. Results also reveal that the mean level of perceived risk agrees well 30
with the actual risk; females perceive comparatively higher risk than males. Expert views on 31
drought risk are similar to the individual household level perceived risk. The outcomes of this 32
study would help the policy-makers and disaster managers to understand the concrete risk 33
scenarios of the study areas and to take timely and appropriate disaster risk reduction actions for 34
ensuring a drought-resistant society. 35
Keywords: Drought risk perception, Actual risk and perceived risk, Household and expert, 36
Teesta River. 37
1. Introduction 38
The risk appraisal is an integral component of disaster risk reduction and sustainability 39
perspectives (Zhou et al. 2015; Rana and Routray 2016). Risk perception, as well as people’s risk 40
appraisal, are the pivotal element for devising and applying disaster risk reduction strategies and 41
plans (Sattar and Cheung 2019). Risk perception is a component of vulnerability and capacity 42
evaluation (Birkholz et al. 2014; Jamshed et al. 2019). Considering the significance of 43
community involvement in disaster risk reduction strategies, people’s risk perception has gained 44
much attention in recent studies related to disaster risk management (Rana and Routray 2016; 45
Sattar and Cheung 2019). However, there is a wide gap between people’s risk perception and 46
experts’ risk appraisal (Garvin 2001). Ultimately, this gap creates difficulty in implementing 47
disaster risk reduction plans or associated policies. It is evident that women are more concerned 48

3
about environmental issues than men (Habtemariam et al. 2016; Shrestha et al. 2019). Members 49
of the same community perceived different opinions toward several natural hazards, which 50
influence them to take a different decision on a critical issue, resource allocation, and making 51
policy (Alderman et al. 1995). These households decisions are crucial for alleviating any hazard 52
and disaster risk as this is directly related to resource distribution either intellectual or physical 53
resource. Thus, it is essential to study people’s risk perception and to investigate the disaster risk 54
reduction (DRR) plans from both household’s and experts’ points of view. 55
According to the Global Climate Risk (GCR) index, Bangladesh is now ranked 5th extreme 56
disaster risk-prone country in the world (Dastagir 2015). Among the extreme climatic disasters, 57
drought is the most complicated, recurring, and least understood natural disaster (Islam et al. 58
2017; Zhang et al. 2019; Uddin et al. 2020). Drought affects a million people and causes 59
tremendous environmental degradation, social crisis, livelihood problems, economic disruption, 60
and loss of lives compared with other climate-related disasters like floods, cyclones (Habiba and 61
Shaw 2012). Of these effects, drought is a major threat to reduce and loss crop production in 62
Bangladesh, which has been influenced by regional climate change in recent times (Habiba et al. 63
2014; Islam et al. 2014; Mardy et al. 2018; Zinat et al. 2020). Furthermore, the northern region 64
covering the Teesta River Basin is one of the largest crops producing regions of Bangladesh, of 65
which more than 40% are rain-fed agriculture and, this Basin has experienced different levels 66
(e.g. moderate, severe) of drought risk (Mainuddin et al. 2015). To cope with the detrimental 67
impacts of drought on agricultural crop production and ensure food security it is important to 68
increase the understanding of people’s drought risk perception as well as ensure a drought-69
resistant agricultural system. 70
71

4
Implementation and formulation of drought risk reduction strategies have recently been attracted 72
more attention among policymakers and practitioners in this basin area because of the extensive 73
effects of climate change, increasing the intensity and frequency of drought hazards, and loss of 74
agricultural crop production. Understanding peoples’ drought risk perception can assist to devise 75
effective drought risk reduction policies and strategies under changing climate conditions, 76
particularly in water deficit areas in the Teesta River Basin in Bangladesh. Previous studies in 77
Bangladesh have been concentrated on the drought effects on agriculture (Habiba et al. 2012; 78
Islam et al. 2014), food production (Ericksen et al. 1993), economy (World Bank Bangladesh 79
2000), and society (Ferdous and Mallick 2019). Besides, Habiba et al. (2012) assessed people’s 80
perception and adaptation plans to cope with drought in northwest Bangladesh. Few studies exist 81
in some other areas in Bangladesh about drought impacts and adaptations (Mardy et al. 2018; 82
Habiba et al. 2011; Habiba et al. 2013; Shahid 2010). 83
Actual vs perceived risk assessment is an interesting research area among scholars in recent 84
decades. Sattar and Cheung (2019) assessed the actual vs perceived cyclone risk in three 85
communities of southern coastal Bangladesh and found that female households perceive greater 86
risk than male participants in terms of risk perception and proposed some cyclone risk reduction 87
measures. Rana and Routray (2016) reported actual versus perceived flood risk and found 88
noteworthy spatial variations in three urban cities in Pakistan. Previous studies have explored the 89
coping strategies for drought risk reduction purposes only by examining people’s perceptions in 90
Bangladesh (Roy et al. 2020; Al-Amin et al. 2019; Mardy et al. 2018). So far, no prior research 91
has explored the actual vs perceived drought risk based on both household's and expert's views in 92
the Teesta River Basin of, Bangladesh. This study intends to fill this research gap. Thus, the key 93
objective of the current study is to appraise actual vs perceived drought risk at the household and 94

5
expert level in the Teesta River Basin, Bangladesh. The planners and stakeholders will able to 95
know which gender and socio-economic group need more priority to enlighten and educate for 96
increasing knowledge of hazard. Disaster preparedness and mitigation strategies will 97
reduce drought risks and losses and thus make a drought-resilient society. 98
2. Material and methods 99
2.1 Selection of the study area 100
Teesta River Basin is the home of around 30 million people. The northwest part of Bangladesh 101
occupies about 71%, Sikkim 2%, and West Bengal 27% of the Teesta Basin (Waslekar et al. 102
2013). Approximately 3 million people are directly and indirectly affected by drought with 103
tremendous damage to infrastructure, livestock, agricultural crop production in the northern 104
Bangladesh (Islam et al. 2014). This Basin often faces temperatures up to 45 Co or more in the 105
pre-monsoon season and the temperature falls at 5 Co in some areas in the winter (Islam et al. 106
2019). This Basin faces frequent climatic extremes that differ from the rest of the country's 107
climatic conditions (Banglapedia 2006). 108
This study selected the Kaunia, Kishoreganj and Hatibandha Upazilas, respectively, from 109
Rangpur, Nilphamary, and Lalmonirhat districts based on the severity on drought (Figure 1). 110
According to Bangladesh Bureau of Statistics (BBS, 2014) mouza is the lowest administrative 111
unit in Bangladesh that contains one or more villages. For this study, mouza is considered for 112
collecting more precise data. Data were collected from Ganai, Ismail, and Par Sekh Sundar 113
mouza of Tepamadhupur, Kishoreganj, and Saniajan unions, respectively. 114
115

6
From a climatological perspective, this area is distinct from other regions of the country, 116
especially rainfall and temperature. Rainfall is unevenly distributed in this Basin from the ranges 117
of 1120 to 1323 mm at an annual scale (Islam et al. 2017). 118
119
Figure 1: Location map showing the Teesta River Basin of Bangladesh prepared by ArcGIS 10.7 120
(www.esri.com) 121
2.2 Sample size, questionnaire design and data collection 122
Data collection from several extensive field visits was performed to know the basic information 123
of the designated study areas for the subsequent design of the study. The total population of 124
Ganai , Ismail and Par Sekh Sundar were 1055, 1174 and 484, respectively (BBS, 2014; BBS, 125
2015). The formula proposed by Cochran (1977) was used to calculate the sample size of each 126

7
mouza. According to Cochran’s formula, the calculated sample size (p<0.05 and error value at 127
<±7%) was 165, 168, and 137 for Ganai, Ismail, and Par Sekh Sundar mouza, respectively. The 128
present study took the round number of 160, 160, and 130 as the sample size for Ganai, Ismail, 129
and Par Sekh Sundar mouza, respectively. In total 450 sample sizes were considered for 130
collecting information from households. To complement data from the individual household 131
level, 450 respondents were interviewed about their overall perceptions of drought risk. Opinions 132
of 45 experts from the Government officials, Non-Government officials, researchers, university 133
teachers and practitioners from Bangladesh who are actively involved in the disaster 134
management field were considered for collecting data for perceived drought risk assessment at 135
expert level. 136
Before finalizing the structured questionnaire, in July 2019 a pre-testing questionnaire survey 137
was conducted for checking the validity and relevancy of the questions. The final questionnaire 138
was developed based on the feedbacks found from the respondents by a pre-testing survey. The 139
questionnaire was divided into 2 main parts. One was for collecting data for assessing actual risk 140
and the other one was for collecting data for perceived risk assessment. The second section 141
(perceived risk assessment) of the questionnaire was used for collecting information from both 142
households and experts. On the contrary, the first section was used for collecting data from only 143
households. Thus, the questionnaire was divided into 6 parts in total as: i) socio-economic status; 144
ii) hazard component of disaster risk; iii) exposure (vulnerability) component of disaster risk; iv) 145
sensitivity (vulnerability) component of disaster risk; v) capacity component of disaster risk and 146
vi) perceived risk assessment. The ii, iii, iv, and v sections were under the part of the actual risk 147
assessment. The vi section was used for collecting the opinions from both the households and 148
experts. 149

8
Household heads both males and females were considered for data collection. The list of 150
respondent was collected from the Department of Agricultural Extension (DAE). Respondents 151
were selected randomly and they were first informed about the purpose of the study. If someone 152
denied providing any information, then the interviewers proceeded to the next household. Face-153
to-face interviews of the respondent were conducted in August-September 2019. All the answers 154
needed for the detailed questionnaire were close-ended. The answers were then coded and 155
interpreted employing Statistical Package for the Social Science (SPSS) software (version 23). 156
The indicators and their weights are defined in the next sub-section. 157
Table 1: Socio-economic status of the respondents 158
Socio-economic
Characteristics
Description Ganai
(Frequency)
Par Sekh Sundar
(Frequency)
Ismail
(Frequency)
Age <30
31-45
46-60
>60
30
64
47
13
43
46
30
11
31
53
56
20
Sex Male
Female
110
50
102
28
117
43
Educational
status
Illiterate
Primary
Secondary
Higher Secondary
Graduate
37
76
32
11
4
42
50
25
7
6
59
58
32
9
2

9
Occupation Unemployed
Agriculture
Business
Day labor
Govt./Other services
10
64
10
64
12
14
60
17
25
14
12
44
43
28
33
Income <5000
5000-10000
10000-15000
15000-20000
>20000
59
84
11
5
2
50
53
14
10
3
56
51
21
19
13
159
Table 1 represents the socio-economic status of the participants. Most houses (made of bamboo 160
and mud) are kutcha. The light of education has not enlightened the area well. Most of the 161
respondents who involve in farming practices are male. Maximum farmers are illiterate here. 162
Some are involved in other secondary jobs such as business, day laborer, and so forth 163
2.3 Indicators and weights 164
Based on the extensive review of the previous literature (Supplementary Table S1 and Table S2), 165
32 and 6 indicators were selected for assessing actual and perceived risks for this study. 166
Descriptions of each indicator along with the related weight values are presented in the 167
supplementary material of Table S1 and Table S2. Here, 0 to 1 score based on various indicator 168
classes of actual and perceived risk components were allocated. For instance, the lowest hazard, 169
sensitivity, exposure, and capacity classes are allocated the lowest weight values of less than 1 170
and higher is 1. Generally, 1 and 0 weights are utilized for yes and no classes. Three classes are 171

10
assigned as 0.33, 0.67 and 1; four classes are assigned as 0.2, 0.4, 0.6, 0.8 and five classes are 172
assigned as 0, 0.2, 0.4, 0.6, 0.8 and 1. Therefore, the values of both the actual and perceived risk 173
indices are between 1 and 0. The weights were assigned based on previous studies carried out in 174
different parts of the world, where scholars utilized the same weights for the same indicators as 175
used in the present study (Saha 2009; Flanagan et al. 2011; Udmale et al. 2014; Barua et al. 176
2016; Rana et al. 2010; Roy et al. 2015; Nhuan et al. 2016; Karim and Thiel 2017; Zhang et al. 177
2017; Sattar and Cheung 2019). The justification of the selection of indicators is given in the 178
supplementary material of Table S1 and Table S2. 179
2.4 Actual and perceived risk index 180
The scientific community is widely accepted the drought risk equation (1) that is the combination 181
of hazards, a vulnerability multiplied by capacity or manageability (Zhang et al. 2017; Zhang 182
2004; Bollin et al.2016). 183
𝐷𝑟𝑜𝑢𝑔ℎ𝑡 𝑟𝑖𝑠𝑘 = 𝐻𝑎𝑧𝑎𝑟𝑑 × 𝑉𝑢𝑙𝑛𝑒𝑟𝑎𝑏𝑖𝑙𝑖𝑡𝑦𝐶𝑎𝑝𝑎𝑐𝑖𝑡𝑦 𝑜𝑟 𝑚𝑎𝑛𝑎𝑔𝑒𝑎𝑏𝑖𝑙𝑖𝑡𝑦 (1) 184
Where, 185
Risk =Probability of damage and loss due to drought, 186
Hazard=Potential occurrence of a natural or man-made event, and physical effect of the 187
disturbance, 188
Vulnerability =Lack of capacity of a community to face and adapt to a hazard, and 189
Capacity =Community assets and available resources that lessening community susceptibility. 190
In the present study, the following equation (2) has been adopted for computing the actual 191
drought risk at the intra-household level in the Teesta River Basin, northern Bangladesh (Sattar 192
and Cheung 2019; Bollin et al. 2016). 193

11
Drought risk (R) = Hazard (H) × Exposure(E) × Sensitivity (S)Adaptive capacity (C) (2) 194
32 indicators/questions were constructed (6, 6, 10, and 10 for hazard (H), exposure (E), 195
sensitivity (S), and capacity (C) component of risk, respectively) for assessing actual drought 196
risk at the household level. This was based on the respondents’ previous experience of severe 197
drought. Perceived risk was also assessed from both the households and expert perspectives. For 198
assessing perceived risk, 6 indicators/questions were asked. This was also based on the 199
respondents’ previous experience of severe drought. For computing the H, E, S, C, and PR 200
indices, equation 3 was considered followed by Rana and Routray (2016); Gain et al. (2015); 201
Bashierr and Jayant (2014). 202 Cl = W1+W2+W3+⋯Wnn = ∑ Winni=1 (3) 203
Where, 204
CI ¼ = composite index, 205
W1 to Wn ¼ = respective weights employed to indicators and 206
n ¼ = number of the indicators used for computing the CI. 207
Following the composite index, Hazard Index (HI), Exposure Index (EI), Sensitivity Index (SI) 208
and Capacity Index (CAI), and Perceived Risk Index (PRI) are computed which are defined as 209
follows: 210 𝐻𝑎𝑧𝑎𝑟𝑑 𝐼𝑛𝑑𝑒𝑥 (𝐻𝐼) = ∑ 𝐻𝑊𝑖6𝑖=1𝑛 (4) 211
𝐸𝑥𝑝𝑜𝑠𝑢𝑟𝑒 𝐼𝑛𝑑𝑒𝑥 (𝐸𝐼) = ∑ 𝐸𝑊𝑖6𝑖=1𝑛 (5) 212
𝑆𝑒𝑛𝑠𝑖𝑡𝑖𝑣𝑖𝑡𝑦 𝐼𝑛𝑑𝑒𝑥 (𝑆𝐼) = ∑ 𝑆𝑊𝑖10𝑖=1𝑛 (6) 213
𝐶𝑎𝑝𝑎𝑐𝑖𝑡𝑦 𝐼𝑛𝑑𝑒𝑥 (𝐶𝐼) = ∑ 𝐶𝑊𝑖10𝑖=1𝑛 (7) 214

12
𝑃𝑒𝑟𝑐𝑖𝑒𝑣𝑒𝑑 𝑅𝑖𝑠𝑘 𝐼𝑛𝑑𝑒𝑥 (𝑃𝑅𝐼) = ∑ 𝑃𝑊𝑖6𝑖=1𝑛 (8) 215
𝐴𝑐𝑡𝑢𝑎𝑙 𝑅𝑖𝑠𝑘 = 𝐻𝐼∗(𝐸𝐼∗𝑆𝐼)𝐶𝐴𝐼 (9) 216
2.5 Data homogeneity 217
Risk indices were analyzed using one-way analysis of variance (one-way ANOVA) using SPSS 218
software. To observe data homogeneity, a one-sample t-test was performed and the results reveal 219
that the actual risk and perceived risk (both households and experts) values are 99% (p-value 220
0.000) significant (Supplementary Table S3). One sample Kolmogorov–Smirnov test also 221
indicates that all risk values are 99% (p < 0.01) significant. The chi-square test gives the same 222
result as all risk values are 99% significant (Supplementary Table S3). All the above test results 223
indicate that the estimated risk values are valid for further analyses. 224
2.6 Ethics 225
Participants were informed of the specific aim of this work before proceeding to the survey. 226
Participant’s consent was taken before the questionnaire survey and their anonymity was 227
confirmed. The survey was done only once, and the survey could be completed/terminated 228
whenever they wished. The questionnaire survey content and procedure were properly reviewed 229
and approved by the proposal evaluation and ethical committee of the Department of Disaster 230
Management of Begum Rokeya University, Rangpur. 231

13
232
Figure 2: Index of actual risk: (a) Mean value, and (b) Individual value for the three study areas 233
3. Results 234
3.1 Actual risk assessment at the household level 235
Among the three sites, Ganai shows the highest risk value of 0.35, whereas Par Sekh Sundar 236
(0.27) and Ismail (0.29) show the lowest risk. The people of Ganai pose a higher vulnerability to 237

14
drought hazards. ANOVA test also reveals that there exists no significant difference between the 238
area of Par Sekh Sundar and Ismail, but there exists a significant difference between Ganai and 239
the other two areas (Par Sekh Sundar and Ismail). It is widely reported that the risk of a hazard 240
extremely varies from individual to individual, and the results of the present study also comply 241
with this general fact (Figure 2b). An enormous variety of risks is evident among the 242
participants, ranging from 0.1 to 0.8 in this study. Furthermore, the highest risk (0.33) value is 243
reported by female respondents and the lowest risk (0.30) value is reported by male respondents, 244
which are statistically significant (p<0.05) (Figure 3). 245
246
Figure 3: Actual risk variability based on gender 247
Figure 4 shows that the actual risk varies with the variation of respondent educational status, 248
occupation, and income level. Figure 4(a) shows that illiterate and lower educated (primary 249
passed) people have experienced comparatively high drought risk (0.3) than as secondary (0.25) 250
and higher secondary (0.24) competed people. The Graduate people have experienced moderate 251
drought risk (0.27). Although graduate people hold more knowledge about the impacts of 252
drought and better know how to reduce the risk, they face a higher risk than higher secondary 253

15
and secondary completed people. This is the result of their negligence towards taking appropriate 254
drought risk reduction strategies. Figure 4(b) shows that day labor experienced a comparatively 255
higher risk (0.35) than others as their work is uncertain and is not permanent. Unemployed (0.32) 256
and agricultural workers (0.30) experienced moderate risk. Businessmen (0.26), govt. employees 257
and other services (0.27) holders experienced the lowest risk because their income sources are 258
permanent. Figure 4(c) shows that whose income <5000 taka (0.31) and 5000-10000 taka (0.32) 259
were experiencing high risk and moderate risk (0.26-0.29) was experienced by the income 260
groups of 10000-15000 and 15000-20000. Low risk (0.22) was experienced by the income group 261
of >20000 taka. This result indicates that higher income groups have a high drought risk 262
reduction capacity, except for the unemployed group. 263
264
265

16
266
Figure 4: Dependence of actual drought risk on education, occupation, and income (Bangladeshi 267
Taka) 268
3.2 Perceived risk assessment from households and experts views 269
The perceived risk (both households and experts) indices for three areas of Ganai, Par Sekh 270
Sundar, and Ismail was assessed. Figure 5a shows that the people of Ismail perceived high risk 271
(0.69), people of Ganai perceived moderate risk (0.59) and the people of Par Sekh Sundar 272

17
perceived low risk (0.55). ANOVA test reveals that there exists a significant difference between 273
the three areas. 274
275
Figure 5: Index of perceived risk: (a) Mean value, and (b) Individual value at household level for 276
the three study areas 277

18
278
Figure 6: Degree of perceived risk at household’s vs experts 279
Similar to actual risk, perceived risk also differs significantly among individuals, ranging from 280
0.42 to 0.84 (Figure 5b). There is no notable difference between experts and household views on 281
perceived drought risk (Figure 6). A slight difference is found in 3 hazard characters which are 282
likelihood of drought occurrence (0.7 for households and 0.65 for experts), ability to cope (0.65 283
and 0.7 for households and experts, respectively) and knowledge about mitigation actions (0.84 284
and 0.7 for households and experts, respectively). The degree of perceived drought risk for the 285
hazard characters of dread (fear), likelihood of future damage from drought and altering 286
relationships were similar between households and experts (Figure 6). Approximately similar 287
views are found from both households and experts. 288

19
289
Figure 7: Risk perceptions from gender perspectives for both (a) households and (b) experts 290
Notable risk difference is found from gender perspectives (Figure 7). Females perceived higher 291
risk (0.63 for households and 0.66 for experts) than males (0.60 for households and 0.57 for 292
experts). Perceived risk (households) also varies with the variation of respondent educational 293
status, occupation, and income level (Figure 8). 294

20
295
Figure 8: Dependence of perceived drought risk (households) on education, occupation and 296
income (Bangladeshi Taka) 297
Figure 8(a) shows that illiterate people perceived higher risk (0.64), moderate risk (0.6) is 298
perceived by primary and secondary school passing people, and lower risk (0.57) is perceived by 299
higher secondary passed as well as graduate people. Figure 8(b) shows that business holders 300
perceived higher risk (0.649) and lower risk (0.6) is perceived by other occupation groups and 301

21
unemployed people. Figure 8(c) shows that the people who earn >20,000 taka perceived higher 302
risk (0.69) and moderate risk (0.60–0.64) is perceived by other income groups. 303
3.3 Correlation between actual risk and perceived risk at the household level 304
There is a positive correlation between the actual risk and perceived risk (Figure 9). The values 305
of correlation are ranged from -1 to +1. A positive value indicates a proportional relation 306
between variables and a negative value indicates an inverse relationship between variables 307
(Salam et al., 2019). Figure 9 indicates that there exists a weak positive correlation between 308
actual risk and perceived risk. Kendall's tau_b and Spearman's rho test results indicate an 309
insignificant (r<0.3) positive correlation between actual risk and perceived risk (Supplementary 310
Table S4). Pearson correlation (Table S4) indicates a significant (r>0.3) positive correlation 311
between actual risk and perceived risk. All these results and the figure testify that actual risk is 312
increased with the increase in perceived risk and vice versa. 313
314
315
Figure 9: Correlation between actual and perceived risk at the household level 316

22
4. Discussions 317
Drought is a silent disaster that causes serious consequences including crop production loss, the 318
deficit of drinking water, and so on. More research and studies on drought phenomena are urgent 319
because of its inadequate literature on perceived and actual drought risk in northern Bangladesh. 320
Therefore, this study is intended to fulfilling the existing gap by adding new knowledge into 321
current knowledge. We found that actual and perceived risks vary with the variation of gender, 322
educational status, geographic location, occupation, and monthly income which is consistent 323
with the findings of Kellens et al. (2011), Wachinger et al. (2013), Mills et al. (2016), Rana and 324
Routry (2016), Sarker (2017) and Sattar and Cheung (2019). No identical difference is found 325
between the opinions of experts and households regarding perceived drought risk except gender. 326
People of Ganai experienced high actual drought risk. On the contrary people of Ismail and Par 327
Sekh Sundar experienced lower actual drought risk. Unlike actual risk, the people of Ismail, 328
Ganai, and Par Sekh Sundar perceived high, moderate, and low risk, respectively. Buurman et al. 329
(2020) reported based on a household survey that upstream communities experienced high 330
drought risk than downstream communities in central Vietnam. For both actual and perceived 331
(both household’s and expert’s) drought risk, high risk is reported by female participants. The 332
female perceived more risk (0.63 for households and 0.66 for experts) than the male (0.60 for 333
households and 0.57 for experts). Sattar and Cheung (2019) also found a similar outcome that 334
females perceived and experienced high risk than males. According to the previous research, 335
women experienced comparatively high disaster risk than men due to their poor socio-economic 336
conditions, traditional practices, etc (UN, 2015; Neumayer & Plümper, 2007). Khan et al. (2020) 337
explored that girls perceived higher disaster risk than boys that is highly analogous to this 338
present study. 339

23
Illiterate and lower educated (primary) people experienced higher risk and graduate people 340
experienced moderate risk. The rest of the groups were reported low risk. Like the actual drought 341
risk, illiterate and lower educated (primary) people perceived higher risk, and comparatively high 342
educated (graduate and higher secondary) people perceived low risk. Roco et al. (2015) stated 343
that comparatively educated people perceived a clear idea of disaster risks that made them 344
understand how to deal with those disasters to reduce the risks. Ullah et al. (2015) and Lucas and 345
Pabuayon (2011) reported that education expands people’s knowledge on disasters and climate 346
risk which influences people to take proper initiatives to lower the disasters risks. The income 347
group that has no permanent income source (e.g. day labor) has faced higher risk. In converse, 348
the income group that has a secure source of income (e.g. Govt. employees and other services 349
holders) has faced the lower drought risk. Businessmen perceived higher risk than other income-350
generating groups. Sam et al. (2019) explored that unemployed people experienced high drought 351
risk which is analogous to the present study. The relation between participant's monthly income 352
(BDT) and drought risk showed a converse relationship. With the increase of income, drought 353
risk decreases and vice-versa. De Silva and Kawasaki (2018) explored the same findings as this 354
study that lower-income generating people experienced high drought risk than comparatively 355
high-income generating people. The relation between participant's monthly income (BDT) and 356
perceived drought risk showed a proportional relationship. With the increase of income, 357
perceived drought risk increases and vice-versa. This perception leads to positive change in the 358
way that people who perceived high risk and also have sufficient financial support taking timely 359
strategies to reduce the upcoming drought risks. Furthermore, this study finds a difference in risk 360
perception between expert and layperson and this finding is consistent with other studies 361
(Peacock et al. 2005; Garvin 2001; Li 2009). An enormous variation in risk perception is found 362

24
among the household, it is, therefore, urgent to promote awareness-raising programs for drought 363
risk and adaptation so that farmers and community people are well-prepared and fully equipped 364
to face future drought events. 365
It is a general belief that a person perceives higher risk, who has already been experienced with 366
the higher impacts by any kind of disaster. Similar to Rana and Routray (2016), this study found 367
a slightly positive correlation between actual and perceived risk, but this relationship is not 368
statistically significant, whereas Sattar and Cheung (2019) reported reverse or no correlation. It 369
implies that risk perception is a very complex issue that is controlled not only by experience with 370
the hazard but also by some other demographic and socioeconomic factors. This provides some 371
crucial information for both the disaster management practitioners, farmers, and government 372
officials for better preparedness for drought even in these study areas. Furthermore, it gives 373
valuable information about the risk areas. 374
5. Conclusions 375
This study aims to appraise actual versus perceived risk in the lowerTeesta River Basin of 376
northern Bangladesh. A risk index was constructed to assess the farmer's perceived and actual 377
risks in the study sites. Among the three study sites, the people of Ganai experienced a high 378
actual risk that is significantly diverse from the other two sites of Ismail and Par Sekh Sundar. A 379
significant relationship was found between the actual risk and socio-economic conditions of the 380
respondents. Results from the perceived risk appraisal reveal that the mean level of perceived 381
drought risk is high from both the household and expert perspective, and the average perceived 382
risks of females are comparatively higher than male and expert levels in the Teesta River Basin. 383
Risk varies with the variation of the respondent’s gender, educational status, occupation, and 384
monthly income. Furthermore, the local inhabitants have little knowledge of drought risk 385

25
reduction and climate change residences. Droughts have more impact on the Ganai of northern 386
Bangladesh because most people are below the average income level and little educational 387
qualification compared to Ismail and Par Sekh Sundar. The outcomes of this study exhibit a 388
strong correspondence with reality and these outcomes can help policymakers and practitioners 389
to prepare appropriate drought risk reduction strategies. This study contributes to scientific 390
knowledge effectively that adequately appraises the factor influencing actual drought risk and 391
shows the gaps between them. Overall, this study implies that drought risk perception appraisal 392
is a prerequisite for applying any drought risk reduction policy or action plan. 393
Acknowledgment 394
We would like to acknowledge the Department of Disaster Management, Begum Rokya 395
University, Rangpur for other sorts of support. We thank all participants who have provided 396
valuable information regarding this research. 397
Data availability 398
Data are available upon request on the corresponding author 399
Conflict of interest 400
There is no conflict of interest to publish this research 401
Funding 402
Self-funding 403
404
References 405
Ahsan MN, Warner J (2014) The socioeconomic vulnerability index: A pragmatic approach for 406
assessing climate change led risks–A case study in the south-western coastal 407
Bangladesh. Int. J. Disast Ri Reduc 8:32-49. doi: 10.1016/j.ijdrr.2013.12.009. 408
Alam E, Collins AE (2010) Cyclone disaster vulnerability and response experiences in coastal 409
Bangladesh. Disast 34(4) (2010) 931-954. doi: 10.1111/j.1467-7717.2010.01176.x. 410
Al-Amin, A. A., Akhter, T., Islam, A. H. M. S., Jahan, H., Hossain, M. J., Prodhan, M. M. H., 411
Mainuddin, M. & Kirby, M. (2019). An intra-household analysis of farmers’ 412

26
perceptions of and adaptation to climate change impacts: empirical evidence from 413
drought prone zones of Bangladesh. Climatic Change, 156(4), 545-565. 414
Armaş I, Avram E (2009) Perception of flood risk in Danube Delta, Romania. Nat Hazar 415
50(2):269-287. doi: 10.1007/s11069-008-9337-0. 416
Banglapedia (2006) Drought in Bangladesh. http://banglapedia.search.com.bd/HT/D_0284.htm. 417
Accessed 5 Sept 2019 418
Barua U, Akhter MS, Ansary MA (2016) District-wise multi-hazard zoning of Bangladesh. Nat 419
Hazar 82(3) :1895-1918. doi: 10.1007/s11069-016-2276-2. 420
Bashier AH, Jayant KR (2014) Vulnerability to flood-induced public health risks in Sudan. 421
Disas Prev and Manag 23(4)395-419. doi: 10.1108/DPM-07-2013-0112. 422
BBS, (2014). Small Area Atlas Bangladesh, Bangladesh bureau of statistics, statistics and 423
information division, ministry of planning. Government of the People’s Republic of 424
Bangladesh, Dhaka. 425
BBS, (2015). Small Area Atlas Bangladesh, Bangladesh bureau of statistics, statistics and 426
informationn division, ministry of planning. Government of the People’s Republic of 427
Bangladesh, Dhaka. 428
Birkmann J, Cardona OD, Carreño ML, Barbat AH, Pelling M, Schneiderbauer S, Welle T 429
(2013) Framing vulnerability, risk and societal responses: the MOVE framework. Nat 430
Hazar 67(2):193-211. doi: 10.1007/s11069-013-0558-5. 431
Bollin C, Cardenas C, Hahn GH, Vatsa KS (2016) Disaster Risk Management by Communities 432
and Local Governments. 433
Boruff BJ (2009) Environmental Hazards: Assessing Risk and Reducing Disasters. Geo. 434
Research. 47(4) 454-455. doi: 10.1111/j.1745-5871.2009.00611.x. 435
Buurman, J., Bui, D. D., & Du, L. T. T. (2020). Drought risk assessment in Vietnamese 436
communities using household survey information. International Journal of Water 437
Resources Development, 36(1), 88-105. 438
Cochran, W.G. (1977). Sampling techniques, 3rd edn. John Wiley, New York. 439
Cutter SL, Boruff BJ, Shirley WL(2003) Social vulnerability to environmental hazards. Soci sci 440
quart 84(2) :242-261. doi: 10.1111/1540-6237.8402002. 441
Dastagir MR (2015) Modeling recent climate change induced extreme events in Bangladesh: A 442
review. Wea Clima Extre 7:49-60. doi: 10.1016/j.wace.2014.10.003. 443

27
De Silva, M. M. G. T., & Kawasaki, A. (2018). Socioeconomic vulnerability to disaster risk: a 444
case study of flood and drought impact in a rural Sri Lankan community. Ecological 445
Economics, 152, 131-140. 446
Dilley M, Boudreau TE (2001) Coming to terms with vulnerability: a critique of the food 447
security definition. F Poli 26(3): 229-247. doi: 10.1016/S0306-9192(00)00046-4. 448
Ekpoh IJ (1999) Rainfall and peasant agriculture in northern Nigeria. Glob J Pure Appl Sci 449
5(1999): 123-128. 450
Ericksen NJ, Ahmad QK, Chowdhury AR (1993) Socio-economic implications of climate 451
change for Bangladesh. (p. 1). Dhaka: Bangladesh Unnayan Parishad. 452
Fedeski M, Gwilliam J (2007) Urban sustainability in the presence of flood and geological 453
hazards: The development of a GIS-based vulnerability and risk assessment 454
methodology. Lands Ur Plann 83(1):50-61. doi: 10.1016/j.landurbplan.2007.05.012. 455
Ferdous J, Mallick D (2019) Norms, practices, and gendered vulnerabilities in the lower Teesta 456
Basin, Bangladesh. Env Develop 31: 88-96. 457
Field CB, Barros V, Stocker TF, Dahe Q (2012) Managing the risks of extreme events and 458
disasters to advance climate change adaptation: special report of the intergovernmental 459
panel on climate change. Cambridge University Press. 460
Flanagan BE, Gregory EW, Hallisey EJ, Heitgerd JL, Lewis B (2011) A social vulnerability 461
index for disaster management. J. Homeland Sec. Emer. Manage. 8(1). doi: 462
10.2202/1547-7355.1792. 463
Gain AK, Mojtahed V, Biscaro C, Balbi S, Giupponi C (2015) An integrated approach of flood 464
risk assessment in the eastern part of Dhaka City. Nat. Hazards 79(3)1499-1530. doi: 465
10.1007/s11069-015-1911-7. 466
Garvin T (2001) Analytical paradigms: the epistemological distances between scientists, policy 467
makers, and the public. Ri Analy. 21(3) :443-456. doi: 10.1111/0272-4332.213124. 468
Habiba U, Shaw R, Hassan A (2013) Drought Risk and Reduction Approaches in Bangladesh. 469
131-164. 470
Habiba U, Shaw R, Takeuchi Y (2011) Drought risk reduction through a Socio-economic, 471
Institutional and Physical approach in the northwestern region of Bangladesh. Env 472
Hazard 10:121-138. 473
28
Habiba U, Shaw R, Takeuchi Y (2012) Farmer's perception and adaptation practices to cope with 474
drought: Perspectives from Northwestern Bangladesh. Int J Disas Ris Reduc 1:72-84. 475
doi: 10.1016/j.ijdrr.2012.05.004. 476
Habiba U, Shaw R, Takeuchi Y (2014) Farmers’ adaptive practices for drought risk reduction in 477
the northwest region of Bangladesh. Nat Hazar 72(2) :337-359. doi: 10.1007/s11069-478
013-1011-5. 479
Hahn MB, Riederer AM, Foster SO (2009) The Livelihood Vulnerability Index: A pragmatic 480
approach to assessing risks from climate variability and change—A case study in 481
Mozambique. Glob Env Chan 19(1) :74-88. doi: 10.1016/j.gloenvcha.2008.11.002. 482
483
Islam ARMT, Shen S, Hu Z, Rahman MA (2017) Drought hazard evaluation in boro paddy 484
cultivated areas of western Bangladesh at current and future climate change 485
conditions. Advan. Meteorol 486
Islam ARMT, Shen S, Yang S, Hu Z, Chu R (2019) Assessing recent impacts of climate change 487
on design water requirement of Boro rice season in Bangladesh. Theor. Appl. 488
Climatol. 138(2019) 97-113. doi: 10.1007/s00704-019-02818-8 489
Islam ARMT, Tasnuva A, Sarker SC, Rahman MM, Mondal MSH, Islam MMU (2014) Drought 490
in Northern Bangladesh: social, agroecological impact and local perception. Int. J. 491
Ecosyst 4(3)150-158. doi: 10.5923/j.ije.20140403.07. 492
Jamshed A, Rana IA, Mirza UM, Birkmann J (2019) Assessing relationship between 493
vulnerability and capacity: An empirical study on rural flooding in Pakistan. Int. J. 494
Disaster Risk Reduc. https://doi.org/10.1016/j.ijdrr.2019.101109. 495
Karim MR, Thiel A (2017) Role of community based local institution for climate change 496
adaptation in the Teesta riverine area of Bangladesh. Clim Risk Manage 17: 92-103. 497
doi: 10.1016/j.crm.2017.06.002. 498
Kellens W, Zaalberg R, Neutens T, Vanneuville W, De Maeyer P (2011) An analysis of the 499
public perception of flood risk on the Belgian coast. Ris Analy 31:1055-1068. 500
Khan S (2012) Vulnerability assessments and their planning implications: a case study of the 501
Hutt Valley, New Zealand. Nat Hazar 64(2) :1587-1607. doi: 10.1007/s11069-012-502
0327-x. 503

29
Khan, A. A., Rana, I. A., & Nawaz, A. (2020). Gender-based approach for assessing risk 504
perception in a multi-hazard environment: A study of high schools of Gilgit, Pakistan. 505
International journal of disaster risk reduction, 44, 101427. 506
Krug EG, Kresnow MJ, Peddicord JP, Dahlberg LL, Powell KE, Crosby AE, Annest JL (1998) 507
Suicide after natural disasters. New Engla J Medi 338(6):373-378. doi: 508
10.1056/NEJM199802053380607. 509
Kulatunga U, Wedawatta G, Amaratunga D, Haigh R (2014) Evaluation of vulnerability factors 510
for cyclones: the case of Patuakhali, Bangladesh. Int J Disas Ri Reduc. 9:204-211. doi: 511
10.1016/j.ijdrr.2014.05.011. 512
Li GM (2009) Tropical cyclone risk perceptions in Darwin, Australia: a comparison of different 513
residential groups. Nat. Hazar 48(3): 365-382. doi: 10.1007/s11069-008-9269-8. 514
Lucas, M. P., & Pabuayon, I. M. (2011). Risk perceptions, attitudes, and influential factors of 515
rainfed lowland rice farmers in Ilocos Norte, Philippines. Asian Journal of Agriculture 516
and Development, 8(1362-2016-107714), 61-77. 517
Mainuddin M, Kirby M, Chowdhury RAR,. Shah-Newaz SM (2015) Spatial and temporal 518
variations of and the impact of climate change on, the dry season crop irrigation 519
requirements in Bangladesh. Irrig Sci 33:107–120. doi:10.1007/s00271-014-0451-3. 520
Mallick B, Ahmed B, Vogt J (2017) Living with the risks of cyclone disasters in the south-521
western coastal region of Bangladesh. Env. 4(1) 13. doi: 522
10.3390/environments4010013. 523
Mardy T, Uddin M, Sarker M, Roy D, Dunn E (2018) Assessing coping strategies in response to 524
drought: A micro level study in the north-west region of Bangladesh. Clima 6(2):23. 525
doi:10.3390/cli6020023. 526
Mills, M., Mutafoglu, K., Adams, V. M., Archibald, C., Bell, J., & Leon, J. X. (2016). Perceived 527
and projected flood risk and adaptation in coastal Southeast Queensland, Australia. 528
Climatic change, 136(3-4), 523-537. 529
Mortimore MJ, Adams WM (2001) Farmer adaptation, change and ‘crisis’ in the Sahel. Glob 530
Env Chan 11(1):49-57. doi: 10.1016/S0959-3780(00)00044-3. 531
Neumayer, E., & Plümper, T. (2007). The gendered nature of natural disasters: The impact of 532
catastrophic events on the gender gap in life expectancy, 1981–2002. Annals of the 533
Association of American Geographers, 97(3), 551-566. 534

30
Nhuan MT, Tue NT, Hue NTH, Quy TD, Lieu TM (2016) An indicator-based approach to 535
quantifying the adaptive capacity of urban households: The case of Da Nang city, 536
Central Vietnam. Urban Clim 15:60-69. doi: 10.1016/j.uclim.2016.01.002. 537
O'bryan J ( 2016) A Systematic Review Of Sexual Violence And Hiv In The Post-Disaster 538
Context: Latin America And The Caribbean. 539
Peacock WG, Brody SD, Highfield W (2005) Hurricane risk perceptions among Florida’s single 540
family homeowners. Landsc. Urb Plan 73 :120–135. 541
doi:10.1016/j.landurbplan.2004.11.004. 542
Phung D, Rutherford S, Dwirahmadi F, Chu C,Do CM, Nguyen T, Duong NC (2016) The spatial 543
distribution of vulnerability to the health impacts of flooding in the Mekong Delta, 544
Vietnam. Int J Biometeorol 60(6) 857-865. doi: 10.1007/s00484-015-1078-7. 545
Qasim S, Khan AN, Shrestha RP, Qasim M (2015) Risk perception of the people in the flood 546
prone Khyber Pukhthunkhwa province of Pakistan. Int J Disas Ri Reduc 14 :373-378. 547
doi: 10.1016/j.ijdrr.2015.09.001. 548
Rana IA, Routray JK (2016) Actual vis-à-vis perceived risk of flood prone urban communities in 549
Pakistan. Int. J. Disast Risk Reduc 19 :366-378. doi: 10.1016/j.ijdrr.2016.08.028. 550
Roco, L., Engler, A., Bravo-Ureta, B. E., & Jara-Rojas, R. (2015). Farmers’ perception of 551
climate change in mediterranean Chile. Regional Environmental Change, 15(5), 867-552
879. 553
Roy C, Sarkar SK, Åberg J, Kovordanyi R (2015) The current cyclone early warning system in 554
Bangladesh: Providers' and receivers' views. Int. J. Disas Risk Reduc. 12 (285-299). 555
doi: 10.1016/j.ijdrr.2015.02.004. 556
Roy, D., Datta, A., Kuwornu, J. K., & Zulfiqar, F. (2020). Comparing farmers’ perceptions of 557
climate change with meteorological trends and examining farm adaptation measures in 558
hazard-prone districts of northwest Bangladesh. Environment, Development and 559
Sustainability, 1-23. 560
Saha CK ( 2015) Dynamics of disaster-induced risk in southwestern coastal Bangladesh: an 561
analysis on tropical Cyclone Aila. Nat Hazards 75(1) (2015) 727-754. doi: 562
10.1007/s11069-014-1343-9. 563

31
Sam, A. S., Abbas, A., Padmaja, S. S., Kaechele, H., Kumar, R., & Müller, K. (2019). Linking 564
food security with household’s adaptive capacity and drought risk: Implications for 565
sustainable rural development. Social Indicators Research, 142(1), 363-385. 566
Sarker MAR (2017) Farmersperception on climate change-driven rice production loss in 567
drought-prone and groundwater-depleted areas of Bangladesh: An ordered probit 568
analysis.University of Queensland, School of Economics. 569
Sattar MA, Cheung KK (2019) Tropical cyclone risk perception and risk reduction analysis for 570
coastal Bangladesh: Household and expert perspectives. Int J Disast Risk Reduc 571
41:101283. doi: 10.1016/j.ijdrr.2019.101283. 572
Sattar, M. A., & Cheung, K. K. (2019). Tropical cyclone risk perception and risk reduction 573
analysis for coastal Bangladesh: household and expert perspectives. International 574
Journal of Disaster Risk Reduction, 41, 101283. 575
Saunders ME, Senkbeil JC, Perceptions of hurricane hazards in the mid‐Atlantic region. Meteor 576
Applic 24(1) : 120-134. doi: 10.1002/met.1611. 577
Shahid S (2010) Drought Risk Assessment in the Western Part of Bangladesh. Nat Hazar 46. 578
Syed A (2017) The Teesta Basin Enough water for power and agriculture for all? Himalayan 579
Adaptation, Water and Resilience Research (HI-AWARE). 580
Syed A, Haq A, Uzzaman A, Goodrich CG, Mallick D, Mini G, Sharma G, Nyima K, Mamnun 581
N, Varma N., Singh P. (2017) The Teesta Basin: Enough water for power and 582
agriculture for all. HI-AW Work Pape 12. 583
Terpstra T, Gutteling JM (2008) Households’ perceived responsibilities in flood risk 584
management in The Netherlands. Int. J. Water Res. Dev. 24 : 555–565. 585
Uddin MJ, Hu J, Islam ARMT, Eibek KU, Zahan MN (2020) A comprehensive statistical 586
assessment of drought indices to monitor drought status in Bangladesh, Arabian 587
Journal of Geosciences, 1.327, 13: 323, DOI: 10.1007/s12517-020-05302-0. 588
Udmale P, Ichikawa Y, Manandhar S, Ishidaira H, Kiem AS (2014) Farmers׳ perception of 589
drought impacts, local adaptation and administrative mitigation measures in 590
Maharashtra State, India. Int J of Dis Ri Reduc 10 :250-269. 591

32
Ullah, R., Shivakoti, G. P., & Ali, G. (2015). Factors effecting farmers’ risk attitude and risk 592
perceptions: The case of Khyber Pakhtunkhwa, Pakistan. International journal of 593
disaster risk reduction, 13, 151-157. 594
United Nations International Strategy for Disaster Reduction. (2015). Women’s leadership in 595
risk-resilient development good practices and lessons learned. Bangkok: Thammada 596
Press. 597
Wachinger, G., Renn, O., Begg, C., & Kuhlicke, C. (2013). The risk perception paradox—598
implications for governance and communication of natural hazards. Risk analysis, 599
33(6), 1049-1065. 600
World Bank Bangladesh, Bangladesh agriculture in the 21st century 2000. World Bank 601
Bangladesh, Dhaka. 602
Zhang F, Chen Y, Zhang J, Guo E,Wang R, Li D (2019) Dynamic drought risk assessment for 603
maize based on crop simulation model and multi-source drought indices, Jour of Clean 604
Produc 233(100-114) 605
Zhang J (2004) Risk assessmentBollin of drought disaster in the maizegrowing region of 606
Songliao Plain, China, Agriculture. Ecosys Env 102(2):133–153. 607
Zhang W, Wang W, Lin J, Zhang Y, Shang X, Wang X, Ma W (2017) Perception, knowledge 608
and behaviors related to typhoon: a cross sectional study among rural residents in 609
Zhejiang, China. Int J Env Rese Pub Heal 14(5) :492. doi: 10.3390/ijerph14050492. 610
Zhou Y, Liu Y, Wu W, Li N (2015) Integrated risk assessment of multi-hazards in China. Nat 611
Haza 78:257–280. doi:10.1007/s11069-015-1713-y. 612
Zinat MRM, Salam R, Badhan MA, Islam ARMT (2020) Appraising drought hazard during Boro 613
rice growing period in western Bangladesh, International Journal of Biometeorology, 614
DOI:10.1007/s00484-020-01949-2. 615
Shrestha UB, Shrestha AM, Aryal S, Shrestha S, Gautam MS, Ojha H (2019) Climate change in 616
Nepal: a comprehensive analysis of instrumental data and people’s perceptions. 617
Climatic Change. 154(3-4): 315. https://doi.org/10.1007/s10584-019-02418-5. 618
Habtemariam LT, Gandorfer M, Kassa GA, Heissenhuber A (2016) Factors influencing 619
smallholder farmers’climate change perceptions: a study from farmers in Ethiopia. 620
Environ Manag 58(2):343–358. 621

33
Alderman H, Chiappori PA, Haddad L, Hoddinott J, Kanbur R (1995) Unitary versus collective 622
models of the household: is it time to shift the burden of proof? World Bank Res Obs 623
10(1):1–19. 624

Figures
Figure 1
Location map showing the Teesta River Basin of Bangladesh prepared by ArcGIS 10.7 (www.esri.com)Note: The designations employed and the presentation of the material on this map do not imply theexpression of any opinion whatsoever on the part of Research Square concerning the legal status of anycountry, territory, city or area or of its authorities, or concerning the delimitation of its frontiers orboundaries. This map has been provided by the authors.

Figure 2
Index of actual risk: (a) Mean value, and (b) Individual value for the three study areas
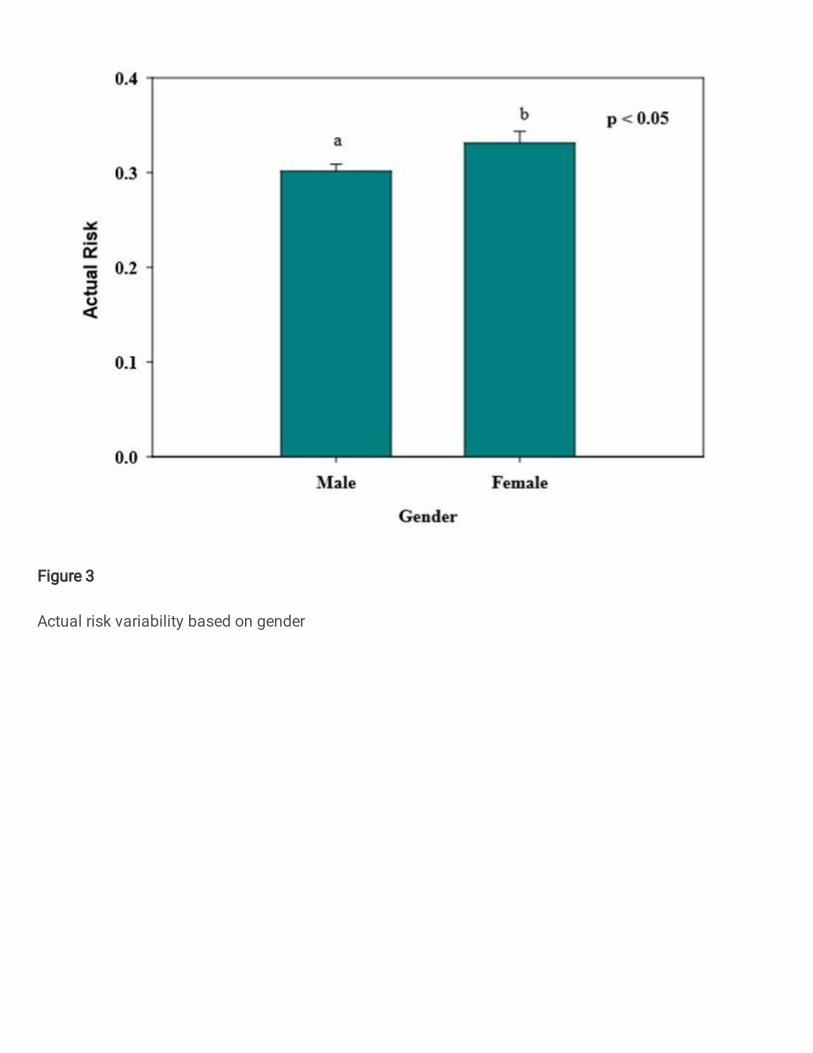
Figure 3
Actual risk variability based on gender

Figure 4
Dependence of actual drought risk on education, occupation, and income (Bangladeshi Taka)

Figure 5
Index of perceived risk: (a) Mean value, and (b) Individual value at household level for the three studyareas

Figure 6
Degree of perceived risk at household’s vs experts

Figure 7
Risk perceptions from gender perspectives for both (a) households and (b) experts Notable risk differenceis found from gender perspectives (Figure 7). Females perceived higher risk (0.63 for households and0.66 for experts) than males (0.60 for households and 0.57 for experts). Perceived risk (households) alsovaries with the variation of respondent educational status, occupation, and income level (Figure 8).

Figure 8
Dependence of perceived drought risk (households) on education, occupation and income (BangladeshiTaka)

Figure 9
Correlation between actual and perceived risk at the household level
Supplementary Files
This is a list of supplementary �les associated with this preprint. Click to download.
Suplementarymaterials07032021.docx