Stellar Jeevan Resale - 9910155922 , Resale Flats in Stellar Jeevan

f o o d & B e v e r a g e • c o n c e p t t o d e l i v e r y • p r e s e n t t o f u t u r e
PepsiCo’s stellar performance clinches
second place, Tyson returns to No. 1
Sponsored by:
neXtarticles

Succeeding in a Difficult Year
Tyson returns to the top and PepsiCo and Nestle
turn in stellar years in our annual ranking of the
largest food and beverage companies in the U.S.
and Canada. By Dave Fusaro, Editor in Chief
in a testament to management and to the hard work of thousands of employees, most of our Top 100© food companies turned in respect-able years in 2007. Despite all the grousing over how tough the past
year was, all of the 10 largest companies managed sales increases, and seven out of the 10 improved profits as well.
Much as we try not to turn this into a footrace each year, it’s difficult not to acknowledge the shuffling of the top three finishers on our list and the remarkable sprint of the North American operations of perennial No. 4 Nestle.
Tyson Foods returned to the No. 1 position, which it held in our 2005 and 2006 reports. PepsiCo had such a good 2007 (sales up 10.4 percent) that it leapfrogged Kraft into the No. 2 spot. While the U.S. and Canadian operations of Nestle remained in fourth, the position those divisions have held for several years, the North American chunk of the world’s biggest food company recorded a 12.6 percent sales increase.
Kraft in various incarnations had been the U.S. and Canada’s big-gest food and beverage company for the first 30 years of this annual report. In its first full year of independence from Philip Morris Cos., Kraft’s U.S.- and Canadian-based sales rose 3.5 percent in 2007, and overall, global sales rose 8.4 percent. Net earnings were down 15.4 per-cent, however.
After a disappointing fiscal 2006, in which it suffered a $196 million loss, Tyson came back strong in its fiscal 2007. “Following one of the most challenging years in the company’s history, we are back on solid footing and on track to achieve our long-term goals,” President/CEO Richard Bond wrote in the company’s annual report.
At PepsiCo, “What makes me particularly proud is that our 2007 performance was strong – not just measured by these short-term met-rics, but also with the long-term in mind,” wrote Chairman/CEO In-dra Nooyi. “We increased capital expenditures in plant and equipment
articles neXtprevious
worldwide … We added several tuck-in acquisitions in key markets and segments … We funded incremental investment to explore breakthrough R&D opportunities.”
Nestle, especially in North America but also worldwide, was aided by the 2007 acquisition of baby-food company Gerber, bought from No-vartis AG. But it wasn’t all based on acquisitions. “The food, beverages and nutrition business, with … an increase of 9.2 percent, was the main contributor to growth,” said the company’s annual report. “It achieved organic growth of 7.1 percent, with real internal growth of 4 percent and pricing of 3.1 percent. This relatively high level of pricing, com-pared with recent years, reflects our success in passing on raw material cost pressures and is a testament to the strength of our brands.”
The biggest growth (17.1 percent) of any of our top 10 companies belongs to Dean Foods. The Dallas-based dairy became the biggest fluid milk supplier in the world by acquisitions, and it made a big one in early 2007: Friendship Dairies, one of the largest dairies in the northeastern U.S. But input costs rose faster than sales. Raw milk prices in the second half of 2007 averaged more than 80 percent higher than in the prior year, so it was no surprise that Dean’s sales soared even as profits dipped – for the second year in a row.
But the biggest sales increase on our chart belongs to Pilgrim’s Pride. Its $1.2 billion purchase of Gold Kist Inc. in December 2006 created the world’s largest chicken company and fueled its 45 percent sales growth. More importantly, after losing money in 2006, Pilgrim’s Pride returned to profitability in 2007.
The past year saw the beginning of two main trends that had huge impacts on the sales and the bottom lines of our Top 100 companies: changes in consumer spending patterns and soaring agricultural com-modity prices. Those trends continue unabated into 2008.
First, consumer spending is changing as a result of the stumbling economy and rising energy prices. Unemployment is high and mortgag-es are dicey, but people are not giving up their homes or their cars. What they are doing is eating out less often and being a little more careful how they spend their money.
There’s speculation this could bring about the disappearance of second- and third-tier brands. Brand loyalists will continue to spend a little more on their favorites but for other products may turn to private label or economy brands whenever they perceive little or no difference in quality.
“For the first six months of 2008, the producer price index for ‘intermediate foods,’ the food products used in the production of final food products, rose 15 percent, following a 14 percent jump in 2007,” says Kevin Flaherty, senior vice president and senior research analyst with GE Commercial Finance. “That’s the most severe infla-tion since the 1973-74 period.”
He also notes that, in the first half of 2008, retail food store sales growth outpaced restaurant sales growth for the first time since 1993, when the U.S. Census Bureau began tracking those metrics.
Also, there are a couple of new names on the list … but only new names for old companies. Swift, which was owned by a holding com-pany, was bought in mid-2007 by Brazilian meat processor JBS S.A. and renamed JBS Swift & Co. (sometimes referred to as JBS USA). Also semi-new is Dr Pepper Snapple Group. The North American beverage operations of Cadbury Schweppes PLC were spun off into an independent company on May 7. They accounted for $5.7 billion of what last year was $7.6 billion in U.S.- and Canadian-based sales of Cadbury Schweppes.
A note about these figures: We count only value-added/ready-for-sale food products, meaning all packaged foods and even beef pat-
ties sold to McDonald’s ... but not ground beef or raw milk sold to another food processor, nor ingredients. And we count only U.S.- and Canadian-manufactured products. Exports are OK, but not products manufactured overseas.
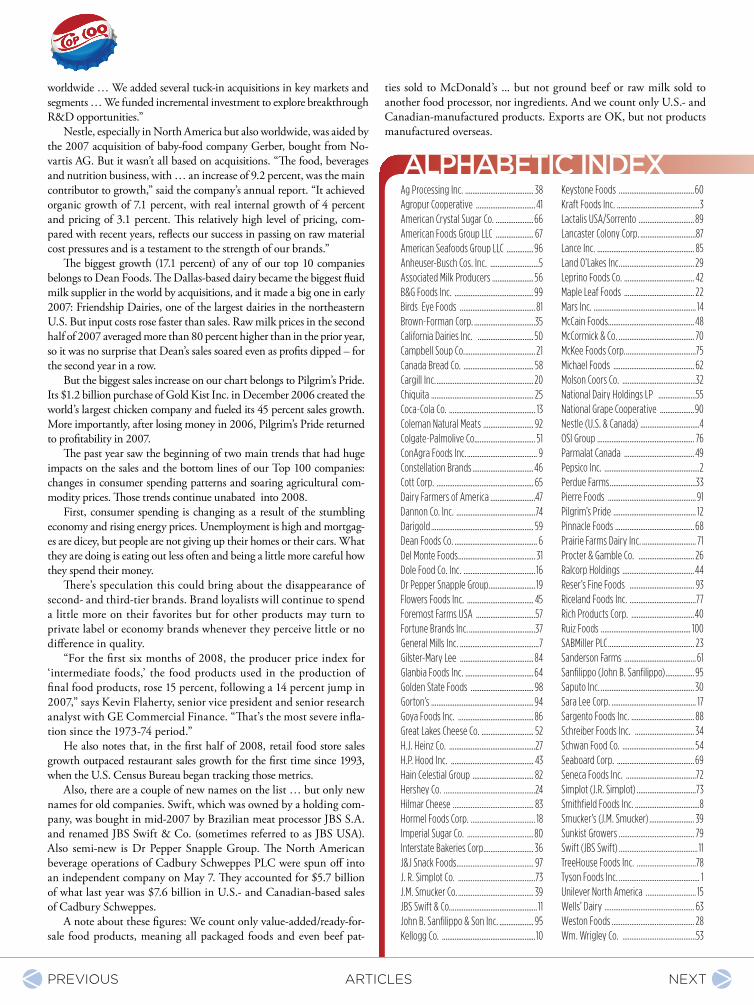
Ag Processing Inc. ...................................... 38Agropur Cooperative ................................. 41American Crystal Sugar Co. .....................66American Foods Group LLC ..................... 67American Seafoods Group LLC ...............96Anheuser-Busch Cos. Inc. ...........................5Associated Milk Producers ....................... 56B&G Foods Inc. ............................................99Birds Eye Foods .......................................... 81Brown-Forman Corp. ..................................35California Dairies Inc. ............................... 50Campbell Soup Co. ....................................... 21Canada Bread Co. ....................................... 58Cargill Inc. ...................................................... 20Chiquita ......................................................... 25Coca-Cola Co. ................................................ 13Coleman Natural Meats ............................ 92Colgate-Palmolive Co.................................. 51ConAgra Foods Inc. ....................................... 9Constellation Brands .................................. 46Cott Corp. ...................................................... 65Dairy Farmers of America .........................47Dannon Co. Inc. ............................................74Darigold ......................................................... 59Dean Foods Co. .............................................. 6Del Monte Foods ........................................... 31Dole Food Co. Inc. ........................................ 16Dr Pepper Snapple Group .......................... 19Flowers Foods Inc. ..................................... 45Foremost Farms USA .................................57Fortune Brands Inc. .....................................37General Mills Inc. ............................................7Gilster-Mary Lee ......................................... 84Glanbia Foods Inc. ......................................64Golden State Foods ................................... 98Gorton’s ......................................................... 94Goya Foods Inc. .......................................... 86Great Lakes Cheese Co. ............................. 52H.J. Heinz Co. ................................................27H.P. Hood Inc. .............................................. 43Hain Celestial Group .................................. 82Hershey Co. ...................................................24Hilmar Cheese ............................................. 83Hormel Foods Corp. .................................... 18Imperial Sugar Co. ..................................... 80Interstate Bakeries Corp............................ 36J&J Snack Foods ........................................... 97J. R. Simplot Co. ...........................................73J.M. Smucker Co. .......................................... 39JBS Swift & Co. ................................................ 11John B. Sanfilippo & Son Inc. ................... 95Kellogg Co. .................................................... 10
Keystone Foods ..........................................60Kraft Foods Inc. ..............................................3Lactalis USA/Sorrento ............................... 89Lancaster Colony Corp. ...............................87Lance Inc. ...................................................... 85Land O’Lakes Inc. ......................................... 29Leprino Foods Co. ....................................... 42Maple Leaf Foods ....................................... 22Mars Inc. ......................................................... 14McCain Foods ................................................ 48McCormick & Co. .......................................... 70McKee Foods Corp. .......................................75Michael Foods ............................................. 62Molson Coors Co. .........................................32National Dairy Holdings LP .....................55National Grape Cooperative ...................90Nestle (U.S. & Canada) .................................4OSI Group ...................................................... 76Parmalat Canada ....................................... 49Pepsico Inc. .....................................................2Perdue Farms ................................................33Pierre Foods .................................................91Pilgrim’s Pride .............................................. 12Pinnacle Foods ............................................ 68Prairie Farms Dairy Inc. .............................. 71Procter & Gamble Co. ............................... 26Ralcorp Holdings ........................................ 44Reser’s Fine Foods .................................... 93Riceland Foods Inc. .....................................77Rich Products Corp. ...................................40Ruiz Foods .................................................. 100SABMiller PLC ................................................ 23Sanderson Farms ........................................ 61Sanfilippo (John B. Sanfilippo) ................ 95Saputo Inc. .................................................... 30Sara Lee Corp. ............................................... 17Sargento Foods Inc. ................................... 88Schreiber Foods Inc. ................................. 34Schwan Food Co. ........................................ 54Seaboard Corp. ........................................... 69Seneca Foods Inc. .......................................72Simplot (J.R. Simplot) .................................73Smithfield Foods Inc. ....................................8Smucker’s (J.M. Smucker) ......................... 39Sunkist Growers .......................................... 79Swift (JBS Swift) ............................................ 11TreeHouse Foods Inc. .................................78Tyson Foods Inc. ............................................. 1Unilever North America ............................ 15Wells’ Dairy .................................................. 63Weston Foods .............................................. 28Wm. Wrigley Co. .........................................53
alphabetic index
neXtprevious articles
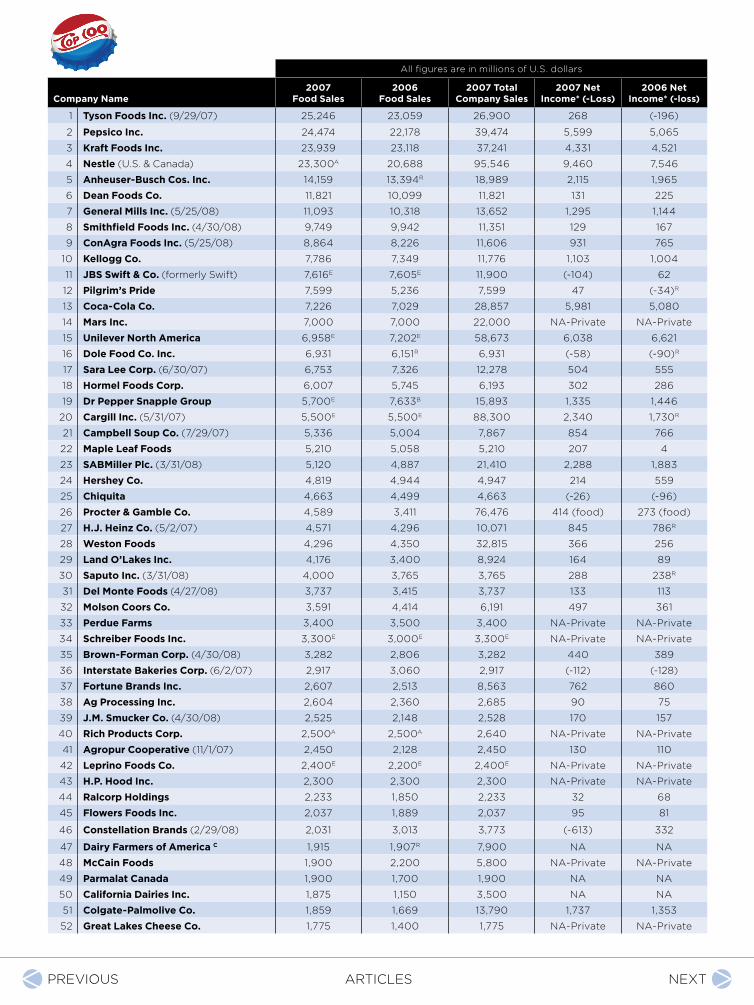
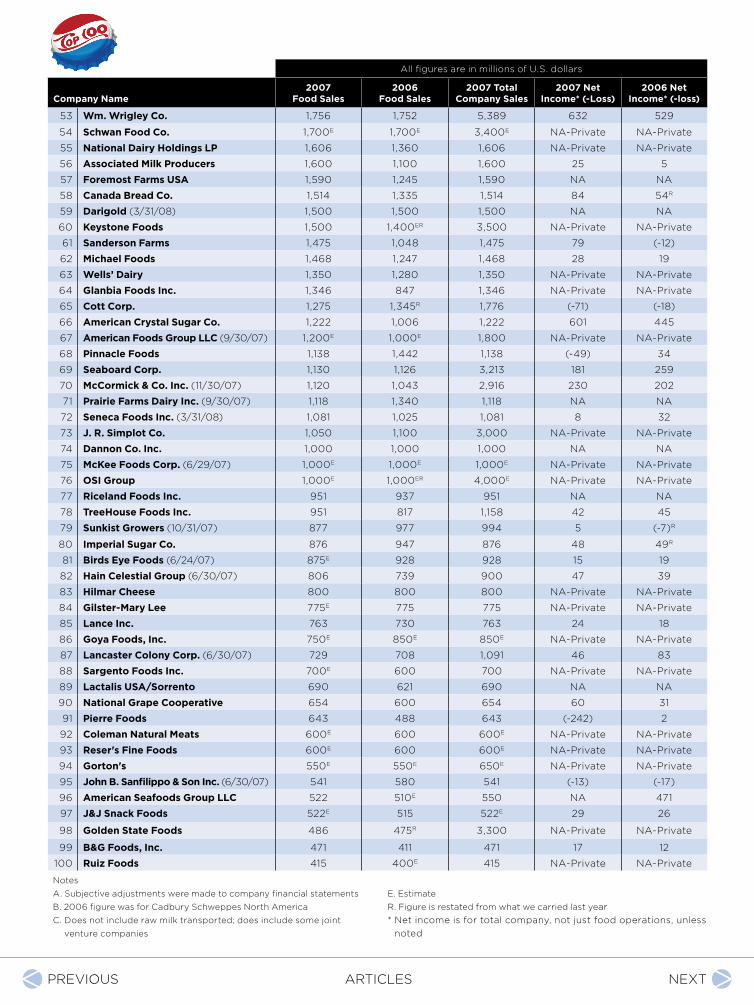
all figures are in millions of u.s. dollars
Company Name2007
Food Sales2006
Food Sales2007 Total
Company Sales2007 Net
Income* (-Loss)2006 Net
Income* (-loss)
1 Tyson Foods Inc. (9/29/07) 25,246 23,059 26,900 268 (-196)
2 Pepsico Inc. 24,474 22,178 39,474 5,599 5,065
3 Kraft Foods Inc. 23,939 23,118 37,241 4,331 4,521
4 Nestle (u.s. & canada) 23,300A 20,688 95,546 9,460 7,546
5 Anheuser-Busch Cos. Inc. 14,159 13,394R 18,989 2,115 1,965
6 Dean Foods Co. 11,821 10,099 11,821 131 225
7 General Mills Inc. (5/25/08) 11,093 10,318 13,652 1,295 1,144
8 Smithfield Foods Inc. (4/30/08) 9,749 9,942 11,351 129 167
9 ConAgra Foods Inc. (5/25/08) 8,864 8,226 11,606 931 765
10 Kellogg Co. 7,786 7,349 11,776 1,103 1,004
11 JBS Swift & Co. (formerly swift) 7,616E 7,605E 11,900 (-104) 62
12 Pilgrim’s Pride 7,599 5,236 7,599 47 (-34)R
13 Coca-Cola Co. 7,226 7,029 28,857 5,981 5,080
14 Mars Inc. 7,000 7,000 22,000 na-private na-private
15 Unilever North America 6,958E 7,202E 58,673 6,038 6,621
16 Dole Food Co. Inc. 6,931 6,151R 6,931 (-58) (-90)R
17 Sara Lee Corp. (6/30/07) 6,753 7,326 12,278 504 555
18 Hormel Foods Corp. 6,007 5,745 6,193 302 286
19 Dr Pepper Snapple Group 5,700E 7,633B 15,893 1,335 1,446
20 Cargill Inc. (5/31/07) 5,500E 5,500E 88,300 2,340 1,730R
21 Campbell Soup Co. (7/29/07) 5,336 5,004 7,867 854 766
22 Maple Leaf Foods 5,210 5,058 5,210 207 4
23 SABMiller Plc. (3/31/08) 5,120 4,887 21,410 2,288 1,883
24 Hershey Co. 4,819 4,944 4,947 214 559
25 Chiquita 4,663 4,499 4,663 (-26) (-96)
26 Procter & Gamble Co. 4,589 3,411 76,476 414 (food) 273 (food)
27 H.J. Heinz Co. (5/2/07) 4,571 4,296 10,071 845 786R
28 Weston Foods 4,296 4,350 32,815 366 256
29 Land O’Lakes Inc. 4,176 3,400 8,924 164 89
30 Saputo Inc. (3/31/08) 4,000 3,765 3,765 288 238R
31 Del Monte Foods (4/27/08) 3,737 3,415 3,737 133 113
32 Molson Coors Co. 3,591 4,414 6,191 497 361
33 Perdue Farms 3,400 3,500 3,400 na-private na-private
34 Schreiber Foods Inc. 3,300E 3,000E 3,300E na-private na-private
35 Brown-Forman Corp. (4/30/08) 3,282 2,806 3,282 440 389
36 Interstate Bakeries Corp. (6/2/07) 2,917 3,060 2,917 (-112) (-128)
37 Fortune Brands Inc. 2,607 2,513 8,563 762 860
38 Ag Processing Inc. 2,604 2,360 2,685 90 75
39 J.M. Smucker Co. (4/30/08) 2,525 2,148 2,528 170 157
40 Rich Products Corp. 2,500A 2,500A 2,640 na-private na-private
41 Agropur Cooperative (11/1/07) 2,450 2,128 2,450 130 110
42 Leprino Foods Co. 2,400E 2,200E 2,400E na-private na-private
43 H.P. Hood Inc. 2,300 2,300 2,300 na-private na-private
44 Ralcorp Holdings 2,233 1,850 2,233 32 68
45 Flowers Foods Inc. 2,037 1,889 2,037 95 81
46 Constellation Brands (2/29/08) 2,031 3,013 3,773 (-613) 332
47 Dairy Farmers of America C 1,915 1,907R 7,900 na na
48 McCain Foods 1,900 2,200 5,800 na-private na-private
49 Parmalat Canada 1,900 1,700 1,900 na na
50 California Dairies Inc. 1,875 1,150 3,500 na na
51 Colgate-Palmolive Co. 1,859 1,669 13,790 1,737 1,353
52 Great Lakes Cheese Co. 1,775 1,400 1,775 na-private na-private
neXtprevious articles
all figures are in millions of u.s. dollars
Company Name2007
Food Sales2006
Food Sales2007 Total
Company Sales2007 Net
Income* (-Loss)2006 Net
Income* (-loss)
53 Wm. Wrigley Co. 1,756 1,752 5,389 632 529
54 Schwan Food Co. 1,700E 1,700E 3,400E na-private na-private
55 National Dairy Holdings LP 1,606 1,360 1,606 na-private na-private
56 Associated Milk Producers 1,600 1,100 1,600 25 5
57 Foremost Farms USA 1,590 1,245 1,590 na na
58 Canada Bread Co. 1,514 1,335 1,514 84 54R
59 Darigold (3/31/08) 1,500 1,500 1,500 na na
60 Keystone Foods 1,500 1,400ER 3,500 na-private na-private
61 Sanderson Farms 1,475 1,048 1,475 79 (-12)
62 Michael Foods 1,468 1,247 1,468 28 19
63 Wells’ Dairy 1,350 1,280 1,350 na-private na-private
64 Glanbia Foods Inc. 1,346 847 1,346 na-private na-private
65 Cott Corp. 1,275 1,345R 1,776 (-71) (-18)
66 American Crystal Sugar Co. 1,222 1,006 1,222 601 445
67 American Foods Group LLC (9/30/07) 1,200E 1,000E 1,800 na-private na-private
68 Pinnacle Foods 1,138 1,442 1,138 (-49) 34
69 Seaboard Corp. 1,130 1,126 3,213 181 259
70 McCormick & Co. Inc. (11/30/07) 1,120 1,043 2,916 230 202
71 Prairie Farms Dairy Inc. (9/30/07) 1,118 1,340 1,118 na na
72 Seneca Foods Inc. (3/31/08) 1,081 1,025 1,081 8 32
73 J. R. Simplot Co. 1,050 1,100 3,000 na-private na-private
74 Dannon Co. Inc. 1,000 1,000 1,000 na na
75 McKee Foods Corp. (6/29/07) 1,000E 1,000E 1,000E na-private na-private
76 OSI Group 1,000E 1,000ER 4,000E na-private na-private
77 Riceland Foods Inc. 951 937 951 na na
78 TreeHouse Foods Inc. 951 817 1,158 42 45
79 Sunkist Growers (10/31/07) 877 977 994 5 (-7)R
80 Imperial Sugar Co. 876 947 876 48 49R
81 Birds Eye Foods (6/24/07) 875E 928 928 15 19
82 Hain Celestial Group (6/30/07) 806 739 900 47 39
83 Hilmar Cheese 800 800 800 na-private na-private
84 Gilster-Mary Lee 775E 775 775 na-private na-private
85 Lance Inc. 763 730 763 24 18
86 Goya Foods, Inc. 750E 850E 850E na-private na-private
87 Lancaster Colony Corp. (6/30/07) 729 708 1,091 46 83
88 Sargento Foods Inc. 700E 600 700 na-private na-private
89 Lactalis USA/Sorrento 690 621 690 na na
90 National Grape Cooperative 654 600 654 60 31
91 Pierre Foods 643 488 643 (-242) 2
92 Coleman Natural Meats 600E 600 600E na-private na-private
93 Reser's Fine Foods 600E 600 600E na-private na-private
94 Gorton's 550E 550E 650E na-private na-private
95 John B. Sanfilippo & Son Inc. (6/30/07) 541 580 541 (-13) (-17)
96 American Seafoods Group LLC 522 510E 550 na 471
97 J&J Snack Foods 522E 515 522E 29 26
98 Golden State Foods 486 475R 3,300 na-private na-private
99 B&G Foods, Inc. 471 411 471 17 12
100 Ruiz Foods 415 400E 415 na-private na-private
notes
a. subjective adjustments were made to company financial statements
B. 2006 figure was for cadbury schweppes north america
c. does not include raw milk transported; does include some joint
venture companies
e. estimate
r. figure is restated from what we carried last year* net income is for total company, not just food operations, unless
noted
neXtprevious articles
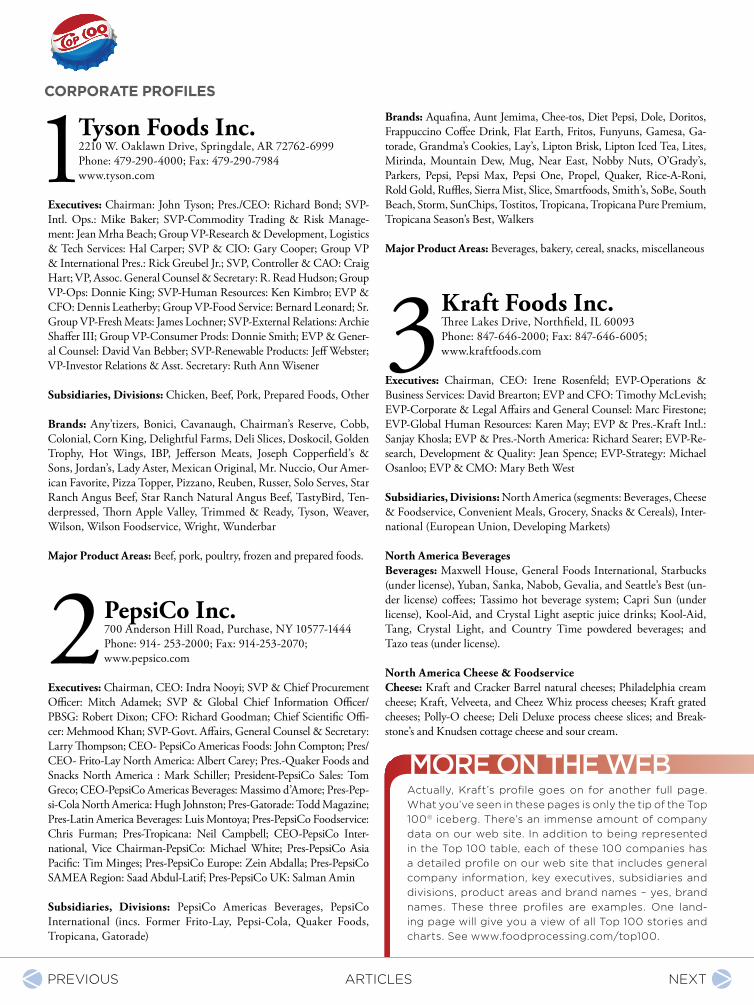
Tyson Foods Inc.2210 W. Oaklawn Drive, Springdale, AR 72762-6999 Phone: 479-290-4000; Fax: 479-290-7984www.tyson.com
Executives: Chairman: John Tyson; Pres./CEO: Richard Bond; SVP-Intl. Ops.: Mike Baker; SVP-Commodity Trading & Risk Manage-ment: Jean Mrha Beach; Group VP-Research & Development, Logistics & Tech Services: Hal Carper; SVP & CIO: Gary Cooper; Group VP & International Pres.: Rick Greubel Jr.; SVP, Controller & CAO: Craig Hart; VP, Assoc. General Counsel & Secretary: R. Read Hudson; Group VP-Ops: Donnie King; SVP-Human Resources: Ken Kimbro; EVP & CFO: Dennis Leatherby; Group VP-Food Service: Bernard Leonard; Sr. Group VP-Fresh Meats: James Lochner; SVP-External Relations: Archie Shaffer III; Group VP-Consumer Prods: Donnie Smith; EVP & Gener-al Counsel: David Van Bebber; SVP-Renewable Products: Jeff Webster; VP-Investor Relations & Asst. Secretary: Ruth Ann Wisener
Subsidiaries, Divisions: Chicken, Beef, Pork, Prepared Foods, Other Brands: Any’tizers, Bonici, Cavanaugh, Chairman’s Reserve, Cobb, Colonial, Corn King, Delightful Farms, Deli Slices, Doskocil, Golden Trophy, Hot Wings, IBP, Jefferson Meats, Joseph Copperfield’s & Sons, Jordan’s, Lady Aster, Mexican Original, Mr. Nuccio, Our Amer-ican Favorite, Pizza Topper, Pizzano, Reuben, Russer, Solo Serves, Star Ranch Angus Beef, Star Ranch Natural Angus Beef, TastyBird, Ten-derpressed, Thorn Apple Valley, Trimmed & Ready, Tyson, Weaver, Wilson, Wilson Foodservice, Wright, Wunderbar
Major Product Areas: Beef, pork, poultry, frozen and prepared foods.
PepsiCo Inc.700 Anderson Hill Road, Purchase, NY 10577-1444 Phone: 914- 253-2000; Fax: 914-253-2070; www.pepsico.com
Executives: Chairman, CEO: Indra Nooyi; SVP & Chief Procurement Officer: Mitch Adamek; SVP & Global Chief Information Officer/PBSG: Robert Dixon; CFO: Richard Goodman; Chief Scientific Offi-cer: Mehmood Khan; SVP-Govt. Affairs, General Counsel & Secretary: Larry Thompson; CEO- PepsiCo Americas Foods: John Compton; Pres/CEO- Frito-Lay North America: Albert Carey; Pres.-Quaker Foods and Snacks North America : Mark Schiller; President-PepsiCo Sales: Tom Greco; CEO-PepsiCo Americas Beverages: Massimo d’Amore; Pres-Pep-si-Cola North America: Hugh Johnston; Pres-Gatorade: Todd Magazine; Pres-Latin America Beverages: Luis Montoya; Pres-PepsiCo Foodservice: Chris Furman; Pres-Tropicana: Neil Campbell; CEO-PepsiCo Inter-national, Vice Chairman-PepsiCo: Michael White; Pres-PepsiCo Asia Pacific: Tim Minges; Pres-PepsiCo Europe: Zein Abdalla; Pres-PepsiCo SAMEA Region: Saad Abdul-Latif; Pres-PepsiCo UK: Salman Amin
Subsidiaries, Divisions: PepsiCo Americas Beverages, PepsiCo International (incs. Former Frito-Lay, Pepsi-Cola, Quaker Foods, Tropicana, Gatorade)
Brands: Aquafina, Aunt Jemima, Chee-tos, Diet Pepsi, Dole, Doritos, Frappuccino Coffee Drink, Flat Earth, Fritos, Funyuns, Gamesa, Ga-torade, Grandma’s Cookies, Lay’s, Lipton Brisk, Lipton Iced Tea, Lites, Mirinda, Mountain Dew, Mug, Near East, Nobby Nuts, O’Grady’s, Parkers, Pepsi, Pepsi Max, Pepsi One, Propel, Quaker, Rice-A-Roni, Rold Gold, Ruffles, Sierra Mist, Slice, Smartfoods, Smith’s, SoBe, South Beach, Storm, SunChips, Tostitos, Tropicana, Tropicana Pure Premium, Tropicana Season’s Best, Walkers
Major Product Areas: Beverages, bakery, cereal, snacks, miscellaneous
Kraft Foods Inc.Three Lakes Drive, Northfield, IL 60093Phone: 847-646-2000; Fax: 847-646-6005; www.kraftfoods.com
Executives: Chairman, CEO: Irene Rosenfeld; EVP-Operations & Business Services: David Brearton; EVP and CFO: Timothy McLevish; EVP-Corporate & Legal Affairs and General Counsel: Marc Firestone; EVP-Global Human Resources: Karen May; EVP & Pres.-Kraft Intl.: Sanjay Khosla; EVP & Pres.-North America: Richard Searer; EVP-Re-search, Development & Quality: Jean Spence; EVP-Strategy: Michael Osanloo; EVP & CMO: Mary Beth West
Subsidiaries, Divisions: North America (segments: Beverages, Cheese & Foodservice, Convenient Meals, Grocery, Snacks & Cereals), Inter-national (European Union, Developing Markets) North America BeveragesBeverages: Maxwell House, General Foods International, Starbucks (under license), Yuban, Sanka, Nabob, Gevalia, and Seattle’s Best (un-der license) coffees; Tassimo hot beverage system; Capri Sun (under license), Kool-Aid, and Crystal Light aseptic juice drinks; Kool-Aid, Tang, Crystal Light, and Country Time powdered beverages; and Tazo teas (under license).
North America Cheese & FoodserviceCheese: Kraft and Cracker Barrel natural cheeses; Philadelphia cream cheese; Kraft, Velveeta, and Cheez Whiz process cheeses; Kraft grated cheeses; Polly-O cheese; Deli Deluxe process cheese slices; and Break-stone’s and Knudsen cottage cheese and sour cream.
CORPORATE PROFILES
2actually, Kraft’s profile goes on for another full page. What you’ve seen in these pages is only the tip of the top 100© iceberg. there’s an immense amount of company data on our web site. in addition to being represented in the top 100 table, each of these 100 companies has a detailed profile on our web site that includes general company information, key executives, subsidiaries and divisions, product areas and brand names – yes, brand names. these three profiles are examples. one land-ing page will give you a view of all top 100 stories and charts. see www.foodprocessing.com/top100.
more on the web
3
neXtprevious articles
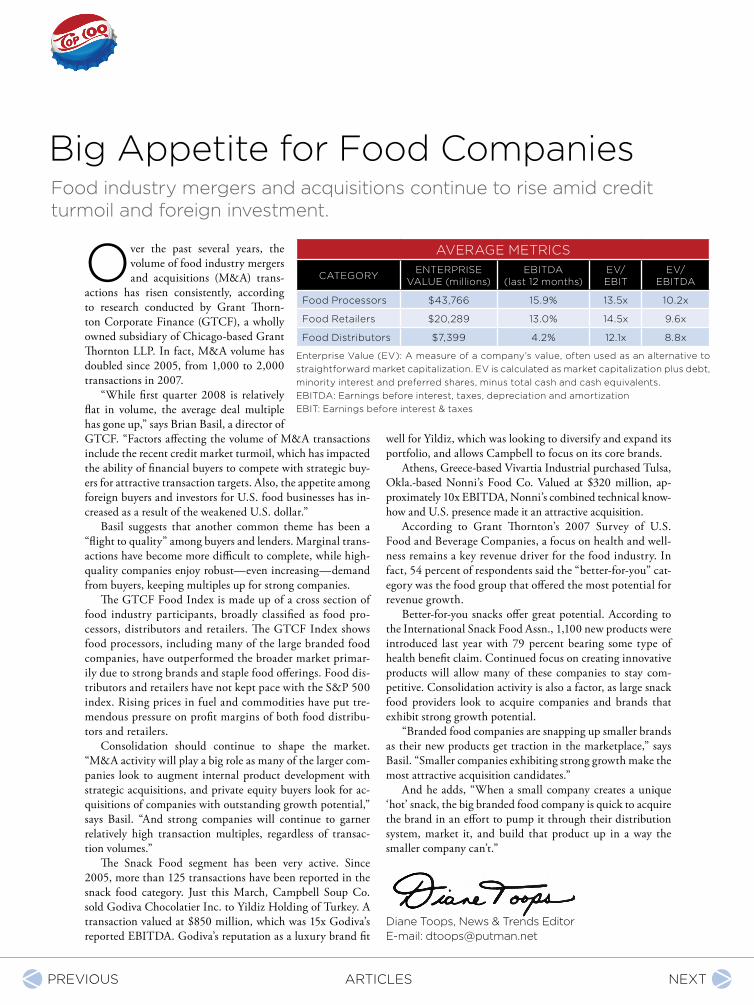
Big appetite for food companies
Over the past several years, the volume of food industry mergers and acquisitions (M&A) trans-
actions has risen consistently, according to research conducted by Grant Thorn-ton Corporate Finance (GTCF), a wholly owned subsidiary of Chicago-based Grant Thornton LLP. In fact, M&A volume has doubled since 2005, from 1,000 to 2,000 transactions in 2007.
“While first quarter 2008 is relatively flat in volume, the average deal multiple has gone up,” says Brian Basil, a director of GTCF. “Factors affecting the volume of M&A transactions include the recent credit market turmoil, which has impacted the ability of financial buyers to compete with strategic buy-ers for attractive transaction targets. Also, the appetite among foreign buyers and investors for U.S. food businesses has in-creased as a result of the weakened U.S. dollar.”
Basil suggests that another common theme has been a “flight to quality” among buyers and lenders. Marginal trans-actions have become more difficult to complete, while high-quality companies enjoy robust—even increasing—demand from buyers, keeping multiples up for strong companies.
The GTCF Food Index is made up of a cross section of food industry participants, broadly classified as food pro-cessors, distributors and retailers. The GTCF Index shows food processors, including many of the large branded food companies, have outperformed the broader market primar-ily due to strong brands and staple food offerings. Food dis-tributors and retailers have not kept pace with the S&P 500 index. Rising prices in fuel and commodities have put tre-mendous pressure on profit margins of both food distribu-tors and retailers.
Consolidation should continue to shape the market. “M&A activity will play a big role as many of the larger com-panies look to augment internal product development with strategic acquisitions, and private equity buyers look for ac-quisitions of companies with outstanding growth potential,” says Basil. “And strong companies will continue to garner relatively high transaction multiples, regardless of transac-tion volumes.”
The Snack Food segment has been very active. Since 2005, more than 125 transactions have been reported in the snack food category. Just this March, Campbell Soup Co. sold Godiva Chocolatier Inc. to Yildiz Holding of Turkey. A transaction valued at $850 million, which was 15x Godiva’s reported EBITDA. Godiva’s reputation as a luxury brand fit
well for Yildiz, which was looking to diversify and expand its portfolio, and allows Campbell to focus on its core brands.
Athens, Greece-based Vivartia Industrial purchased Tulsa, Okla.-based Nonni’s Food Co. Valued at $320 million, ap-proximately 10x EBITDA, Nonni’s combined technical know-how and U.S. presence made it an attractive acquisition.
According to Grant Thornton’s 2007 Survey of U.S. Food and Beverage Companies, a focus on health and well-ness remains a key revenue driver for the food industry. In fact, 54 percent of respondents said the “better-for-you” cat-egory was the food group that offered the most potential for revenue growth.
Better-for-you snacks offer great potential. According to the International Snack Food Assn., 1,100 new products were introduced last year with 79 percent bearing some type of health benefit claim. Continued focus on creating innovative products will allow many of these companies to stay com-petitive. Consolidation activity is also a factor, as large snack food providers look to acquire companies and brands that exhibit strong growth potential.
“Branded food companies are snapping up smaller brands as their new products get traction in the marketplace,” says Basil. “Smaller companies exhibiting strong growth make the most attractive acquisition candidates.”
And he adds, “When a small company creates a unique ‘hot’ snack, the big branded food company is quick to acquire the brand in an effort to pump it through their distribution system, market it, and build that product up in a way the smaller company can’t.”
diane toops, news & trends editorE-mail: [email protected]
food industry mergers and acquisitions continue to rise amid credit turmoil and foreign investment.
average Metrics
category enterprise value (millions)
eBitda (last 12 months)
EV/eBit
EV/ eBitda
food processors $43,766 15.9% 13.5x 10.2x
food retailers $20,289 13.0% 14.5x 9.6x
food distributors $7,399 4.2% 12.1x 8.8x
enterprise value (ev): a measure of a company’s value, often used as an alternative to straightforward market capitalization. ev is calculated as market capitalization plus debt, minority interest and preferred shares, minus total cash and cash equivalents.eBitda: earnings before interest, taxes, depreciation and amortizationeBit: earnings before interest & taxes
neXtprevious articles
What they’re saying“Management and the Board have been impressed with
Grant Thornton’s transition of our audit work from a
Big Four firm. The engagement team asked the right
questions to understand our business ... Grant Thorn-
ton demonstrated the understanding they gained of our
business and successfully met our critical deadline. We
have appreciated the team’s dedication, responsiveness
and agility in resolving technical matters in a timely and
effective manner.”
Paul Geist, CFO American Italian Pasta Company
previous articles
about grant thornton llpGrant Thornton LLP is the U.S. member firm
of Grant Thornton International Ltd, one of
the six global accounting, tax and business
advisory organizations. Through more than
100 countries, including 50 offices in the
United States, the partners and employees of
Grant Thornton International Ltd member
and correspondent firms provide audit, tax
and advisory services to public and private cli-
ents around the globe.
If you would like to discuss how Grant Thorn-
ton can assist you with improving your com-
pany’s financial and operational performance,
please view our website at www.GrantThorn-
ton.com or contact us at 866.728.5264 or
visit our newly updated Management resource center (www.foodprocessing.com/management) click here for details.