PEPCO’s Experience with Historian
39
PEPCO’s Experience PEPCO’s Experience with Historian with Historian EMS Users Group EMS Users Group March 14, 2000 March 14, 2000 Potomac Electric Power Company Potomac Electric Power Company
-
Upload
alana-cervantes -
Category
Documents
-
view
23 -
download
1
description
PEPCO’s Experience with Historian. EMS Users Group March 14, 2000 Potomac Electric Power Company. PEPCO Needs. Electric system data archive Corporate wide EMS data access Operations Planning Maintenance Data security. Historian System. - PowerPoint PPT Presentation
Transcript of PEPCO’s Experience with Historian

PEPCO’s Experience with PEPCO’s Experience with HistorianHistorian
EMS Users GroupEMS Users GroupMarch 14, 2000March 14, 2000
Potomac Electric Power CompanyPotomac Electric Power Company
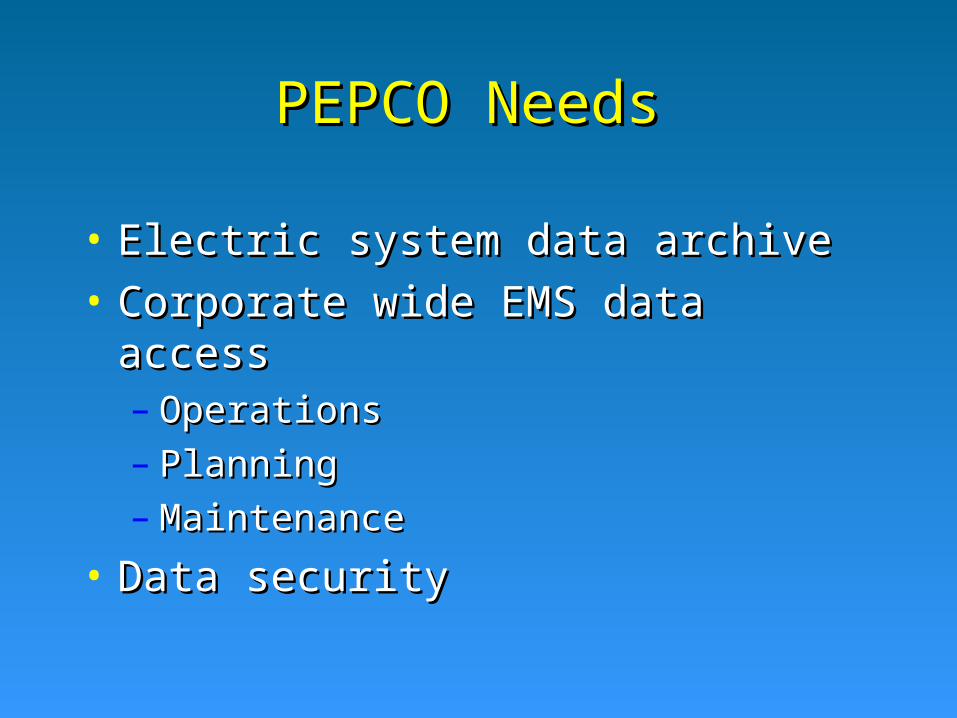
PEPCO NeedsPEPCO Needs
• Electric system data archiveElectric system data archive
• Corporate wide EMS data accessCorporate wide EMS data access– OperationsOperations– PlanningPlanning– MaintenanceMaintenance
• Data securityData security

Historian System Historian System
• Collects & stores real time data from Collects & stores real time data from Energy Management System for archivalEnergy Management System for archival
• Architecture is client/serverArchitecture is client/server
• Uses multiple compression algorithmsUses multiple compression algorithms

Historian FeaturesHistorian Features
• Collects the following data types with quality:Collects the following data types with quality:– StatusStatus– AnalogsAnalogs– AccumulatorAccumulator– Data from the Ranger Integrated Data Base (IDB)Data from the Ranger Integrated Data Base (IDB)
• Provides interface to PC based commercial Provides interface to PC based commercial software (Excel, Word, etc.)software (Excel, Word, etc.)
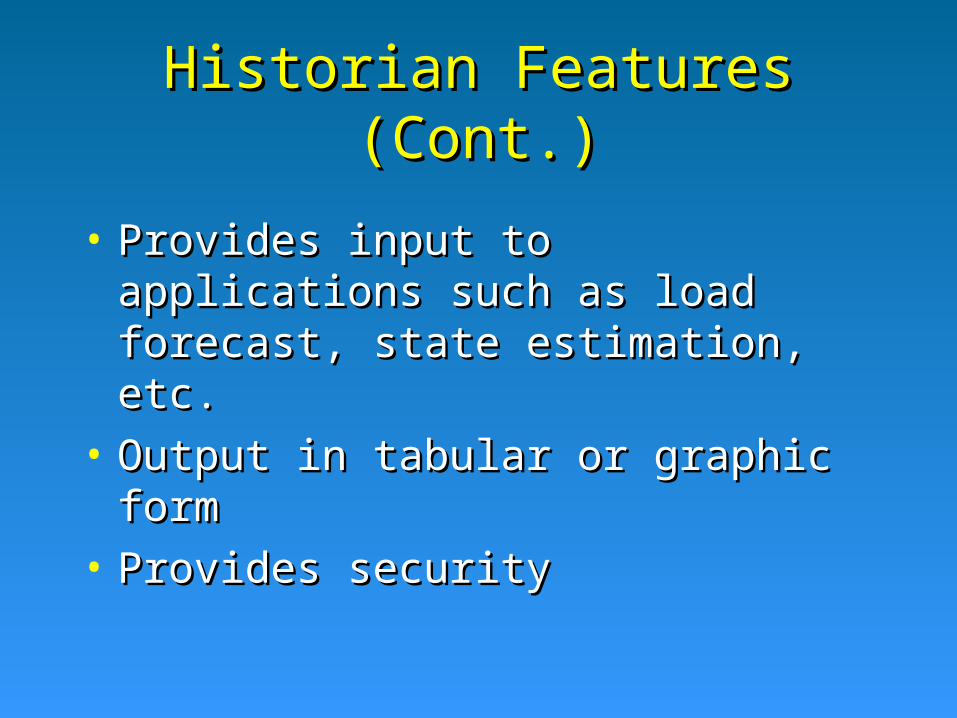
Historian Features (Cont.)Historian Features (Cont.)
• Provides input to applications such as load Provides input to applications such as load forecast, state estimation, etc.forecast, state estimation, etc.
• Output in tabular or graphic formOutput in tabular or graphic form
• Provides securityProvides security
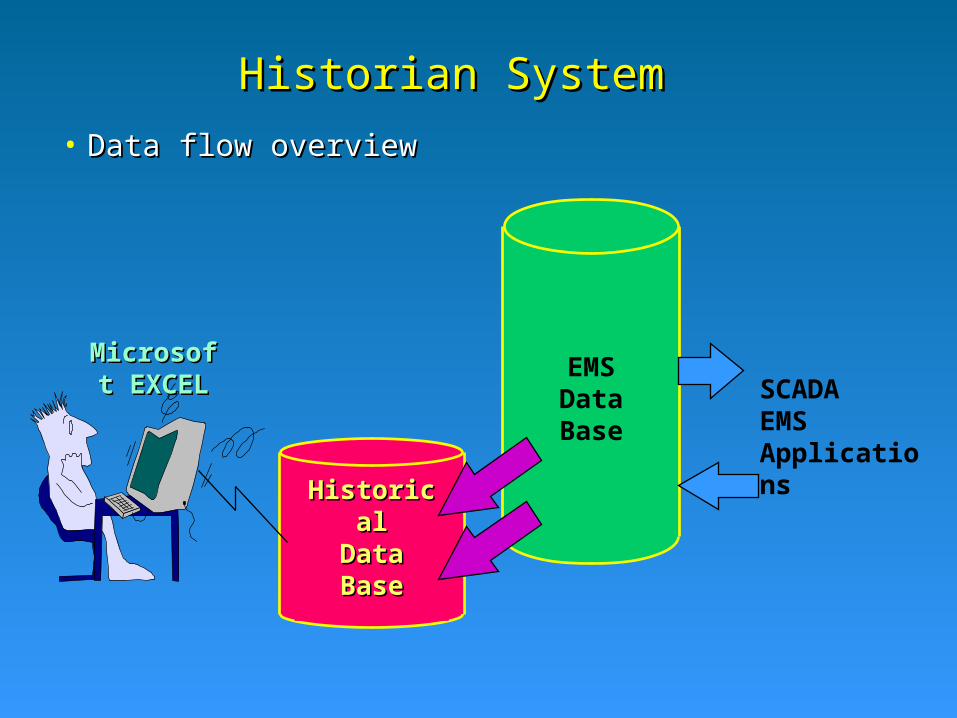
EMSDataBase
HistoricalHistoricalDataDataBaseBase
SCADAEMSApplications
Microsoft Microsoft EXCELEXCEL
• Data flow overviewData flow overview
Historian SystemHistorian System
PEPCO Historian UsersPEPCO Historian Users
• OperationsOperations
• PlanningPlanning
• MaintenanceMaintenance

Use of Historian for OperationsUse of Historian for Operations
• Track current electric system conditionsTrack current electric system conditions– Spreadsheet (tabular)Spreadsheet (tabular)– One line (graphical display)One line (graphical display)
• Power Flow/Contingency AnalysisPower Flow/Contingency Analysis
• Retrieve historical data for switching Retrieve historical data for switching decisionsdecisions
• Trend line loading and voltagesTrend line loading and voltages
• Clearance workClearance work
Use of Historian for PlanningUse of Historian for Planning
• Monitor equipment performanceMonitor equipment performance
• Track system load and power factor profiles Track system load and power factor profiles used in construction recommendationsused in construction recommendations
• Power flow/contingency analysisPower flow/contingency analysis
• Calculate electric system lossesCalculate electric system losses

Use of Historian for Use of Historian for Maintenance Maintenance
• For PEPCO’s new Maintenance Management For PEPCO’s new Maintenance Management System System – Help transition from preventive to Help transition from preventive to
predictive/proactive maintenance approachpredictive/proactive maintenance approach
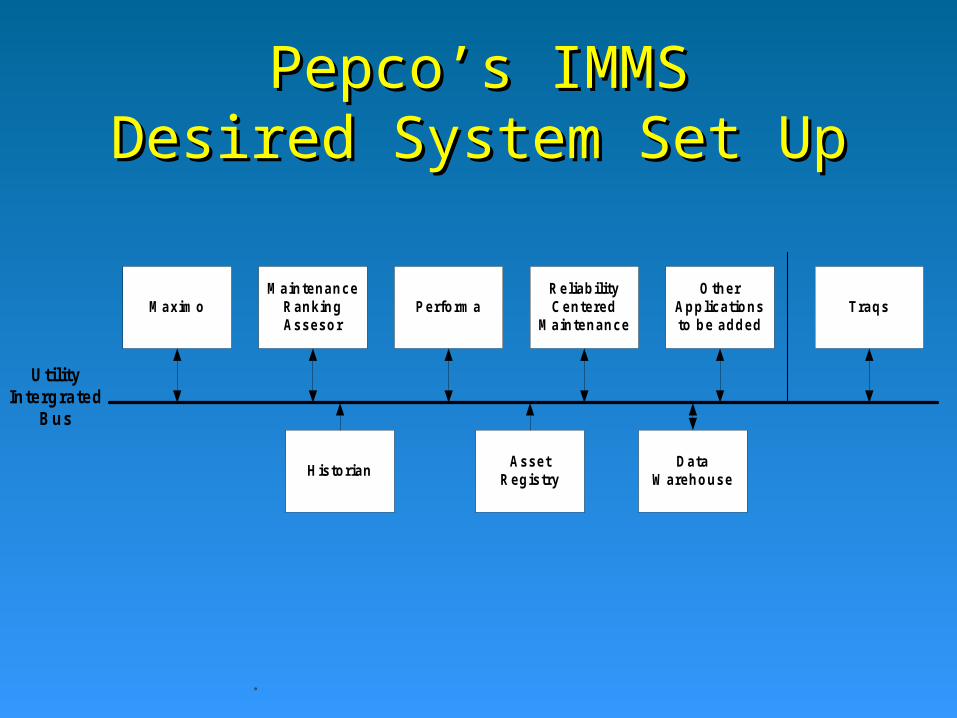
Pepco’s IMMSPepco’s IMMSDesired System Set UpDesired System Set Up
M axim oReliabilityCentered
M aintenancePerform a
M aintenanceRankingAssesor
Traqs
HistorianAsset
RegistryData
W arehouse
UtilityIntergrated
Bus
OtherApplicationsto be added
Maintenance System PayoffMaintenance System Payoff
• Preparation for changing utility operationsPreparation for changing utility operations
• Better track maintenance history and Better track maintenance history and maintenance patternsmaintenance patterns
• Better utilize work force for multi-skilling Better utilize work force for multi-skilling effortsefforts
• Provide better reliability of equipment Provide better reliability of equipment readinessreadiness
Historian ExamplesHistorian Examples
• Excel spreadsheetsExcel spreadsheets
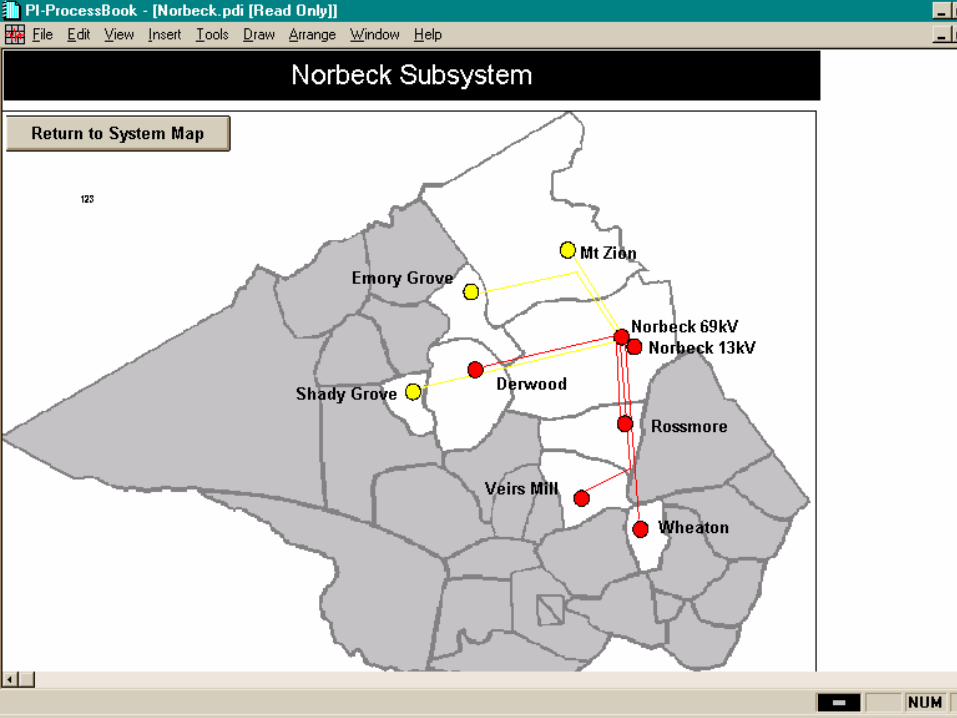
• One-linesOne-lines
• Charts and graphsCharts and graphs

Washington, DCDowntown
PEPCO

PEPCO
Washington, DCDowntown

PEPCO
Washington, DCDowntown

PEPCO
Washington, DCDowntown

PEPCO
Washington, DCDowntown

PEPCO
Washington, DCDowntown

PEPCO
Washington, DCDowntown

PEPCO
Washington, DCDowntown

PEPCO
Washington, DCDowntown

PEPCO
Washington, DCDowntown

PEPCO
Washington, DCDowntown

PEPCO
Washington, DCDowntown

Washington, DCDowntown
PEPCO

20:2
7:17
20:2
7:39
20:2
8:00
20:2
8:22
20:2
8:44
20:2
9:05
20:2
9:27
20:2
9:48
20:3
0:10
0
20
40
60
80
100
120
MW
TIME (h:mm:s)
Station "C" MW Profile
C-1
C-2
C-3
C-4
C-5
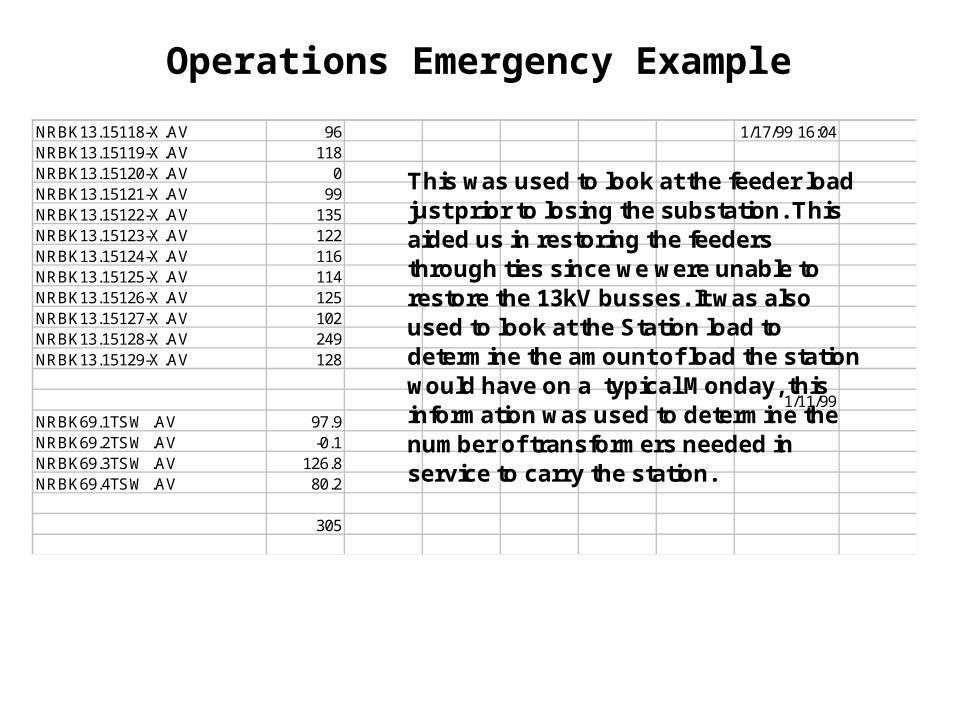
NRBK13.15118-X .AV 96 1/17/99 16:04NRBK13.15119-X .AV 118NRBK13.15120-X .AV 0NRBK13.15121-X .AV 99NRBK13.15122-X .AV 135NRBK13.15123-X .AV 122NRBK13.15124-X .AV 116NRBK13.15125-X .AV 114NRBK13.15126-X .AV 125NRBK13.15127-X .AV 102NRBK13.15128-X .AV 249NRBK13.15129-X .AV 128
1/11/99NRBK69.1TSW .AV 97.9NRBK69.2TSW .AV -0.1NRBK69.3TSW .AV 126.8NRBK69.4TSW .AV 80.2
305
This was used to look at the feeder load just prior to losing the substation. This aided us in restoring the feeders through ties since we were unable to restore the 13kV busses. It was also used to look at the Station load to determine the amount of load the station would have on a typical Monday, this information was used to determine the number of transformers needed in service to carry the station.
Operations Emergency Example

23016
C #1
C #2
C #3
C #4
C #5
90
2
85
6
106
7
109
3
108
6
57 -63
56 -63
23106
23107
POTOMACRIVER
PALMERS CORNER
ALABAMAAVENUE
BUZZARD POINT
-175 0 3 -183
23093
23091
23092
23090
134 47
143 77
23088
23089
116 35
155 110
135 33
23016
23026
23027
69kV
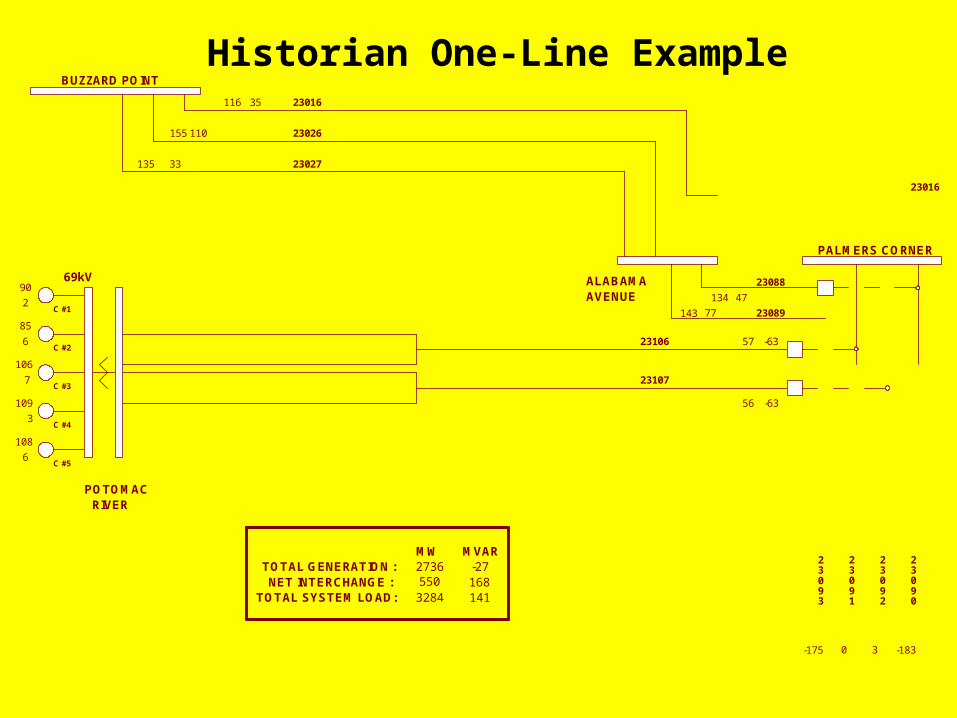
TOTAL GENERATION : NET INTERCHANGE :
TOTAL SYSTEM LOAD:
MW MVAR2736 -27550 1683284 141
Historian One-Line Example

23032
23034
23033
23035
23111
23102
23101
23103
23104
CT #1
CT #2
D #1
D #2
D #3
Sta. "H"
Dickerson
1 1
0 0
-193 42
-222 -20
-0
-0
63 -42
53 -41
-67 42
-20 44
0 0
0 0
156 26
133 31
0 0
QUINCE ORCHARDMT. ZION
23022
23024
23023
23025
168 -32
83 -22
50 23
-9 -10
23122
23014
23123
23015
-223 131
-109 17
BRIGHTON
23012
23013
23014
23015
-21 -88
-95 -39
-144 66
-35 31
23042
23044
23043
23045
179 -18
181 11
91 -43
202 11
2314 2334
-177
-16
-147
-41
2341
2340
47 57
31 -36
E #1 E #2 E #3
330
20
367
39
642
86
558
52
F #1 F #2
0
0
0
1
BOWIE
OAK GROVE
CHALK POINTMORGANTOWNBURCHES HILL
BELLS MILLNORBECK
MTEZEROTT RD.
23028
23030
23029
23031
23009
44-10
23011
62-12
54-10
38-20
23008
23010
23040
23046
23041
23047
-193-20
-147-23
-18
-124-30
-192-2
-21324
24442
222-22
23065
23054
23045
23042
-205 -18
-178 8
23062
23064
270 -34
264 -21
-228
-27
-238
-21
-261
1
-272
31
23065
23063
23064
23062
23074
23072
23073
23071
-177 15
-174 8
135 -16
134 -8
BURTONSVILLE
-94
2
-39
7
-39
-1
-96
4
23076
23086
23085
23077
147-27
149-24
54-9
55-2
23087
23067
23068
23066
-11734
-12037
23081
23082
5011
5053
5055535 -21 -324 179
241 -146
5072
-305 149
5071
-219 -23
5070
144 14
5071
222 45
382
101
E #4
-0
76
-520
33
Open
-89 7
-164 38
-151 37
-133 43
23060
23059
23061
23058
RITCHIE
-114 5123016
86 0
135 1623001
23002
A #15
A #16
0
-0
0
0
C #1
C #2
C #3
C #4
C #5
84
3
80
1
106
10
109
-3
106
-1
55 -63
53 -62
23106
23107
POTOMACRIVER
PALMERS CORNER
ALABAMAAVENUE
BUZZARD POINT
-193
-2
-3
-66
-0
-68
-201
-3
23093
23091
23092
23090
127 127
160 80
23088
23089
118 43
170 114
148 115
23016
23026
23027
500kV
500kV
69kV
500kV
69kV
RYCEVILLE
HAWKINS GATE
446
-10
TOTAL GENERATION : NET INTERCHANGE :
TOTAL SYSTEM LOAD:
MW MVAR3133 221195 1023325 322
93.51
118.22
118.85
119.50
118.24
118.61
118.53
118.95
117.62
117.85
59.975
59.980
59.985
59.990
59.995
60.000
60.005
60.010
60.015
11:5
5:00
11:5
5:40
11:5
6:20
11:5
7:00
11:5
7:40
11:5
8:20
11:5
9:00
11:5
9:40
12:0
0:20
12:0
1:00
12:0
1:40
12:0
2:20
12:0
3:00
12:0
3:40
12:0
4:20
12:0
5:00
12:0
5:40
12:0
6:20
12:0
7:00
12:0
7:40
12:0
8:20
12:0
9:00
12:0
9:40
12:1
0:20
12:1
1:00
12:1
1:40
12:1
2:20
12:1
3:00
12:1
3:40
12:1
4:20
12:1
5:00
Fre
qu
ency
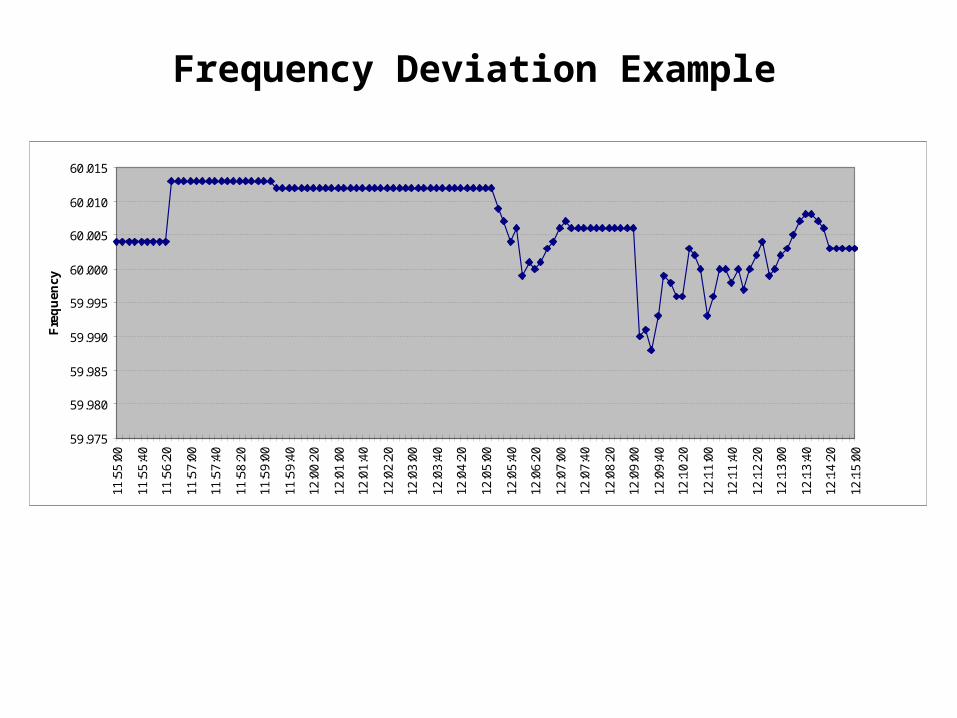
Frequency Deviation Example

PJM06 Current
APS-PJM SCHEDULE -584 EASTERN TRANS. 3061CEI-PJM SCHEDULE -444 EASTERN TRANS LIMIT 4783VP-PJM SCHEDULE -338 EASTERN MARGIN 1737
NYPP-PJM SCHEDULE 675
PJM NET LOAD MW 29050PJM NEW GEN MW 30110PJM NET INT MW -1030
PJM SPINNING RES. 1120PJM OPERATING RES. 5266
BGE LOAD 3282WESTERN TRANS. 2397 BGE GEN 2941
WESTERN TRANS LIMIT 4375 BGE NET INT. MW 342WESTERN MARGIN 1964 BGE NET INT. MVAR 67
WEST-PJM SCHEDULE -1481 BGE SPINNING RES. 40WEST-PJM TIE FLOW -1114 BGE OPERATING RES. 74PJM WESTERN CIRC. 424 BGE/PEPCO NET INT. 790
BGE/PEPCO IMPORT LIM. 3600
DNW 8/12/98
Update
Historian Excel Example

Plot-0
I6 PEPCO Zone Price
4/16/99 05:15:37 AM 4/16/99 01:15:37 PM8.00 Hour(s)
SYDPJM.DLAMDA.I6
$MWH
PEPZONE
$/MWH
10
20
30
40
50
0
6037.00000
52.40000
SYDPJM.DLAMDA.I6
$MWH
PEPZONE
$/MWH
Lambda vs LMP ComparisonLambda vs LMP Comparison
Lambda LMP

Plot-0
PEPCO Zone Price Eastern Hub Western Hub Western_Int Hub
4/16/99 05:46:03 AM 4/16/99 01:46:03 PM8.00 Hour(s)
PEPZONE
$/MWH
EastHub
$/MWh
WestHub
$/MWh
West_IntHub
$/MWh
20
25
30
35
40
45
50
15
5536.50000
36.50000
36.50000
36.50000
PEPZONE
$/MWH
EastHub
$/MWh
WestHub
$/MWh
West_IntHub
$/MWh
LMP and Transmission Congestion
Four Representative LMPs--When Identical, No Transmission Congestion

Plot-0
PJM Xfer East Actual Flow PJM Xfer East Emerg Lmt PJM Xfer West Actual Flow PJM Xfer West Emerg Lmt
4/16/99 05:39:22 AM 4/16/99 01:39:22 PM8.00 Hour(s)
EastActFlow
MWH
EastEmergLmt
MWH
WestActFlow
MWH
WestEmergLmt
MWH
2500
3000
3500
4000
4500
2300
50003324.00000
4720.00000
2619.00000
4553.00000
EastActFlow
MWH
EastEmergLmt
MWH
WestActFlow
MWH
WestEmergLmt
MWH
Transfer Limits and Actual Flowsfrom PJM OASIS

Future Historian UsesFuture Historian Uses
• Study State EstimationStudy State Estimation
• Distribution AutomationDistribution Automation
• External/outside utility data storageExternal/outside utility data storage
SummarySummary
• Has capabilities that meet Pepco’s needs for Has capabilities that meet Pepco’s needs for data archiving, data access and data securitydata archiving, data access and data security
• Excel interface provides for PC data Excel interface provides for PC data analysis and graphical charting optionsanalysis and graphical charting options
• Large potential for future usesLarge potential for future uses