Peoria Programs Rail - American Public Transportation ... · Peoria Programs Rail Commuter Rail...
15
Peoria Programs Rail Commuter Rail Concept John McCarthy, AICP Jacobs, Project Manager St. Louis, MO Jim Prost, AICP Vantage Point Development Advisors, Principal Annapolis, MD 2013 Rail Conference
Transcript of Peoria Programs Rail - American Public Transportation ... · Peoria Programs Rail Commuter Rail...

Peoria Programs Rail Commuter Rail Concept
John McCarthy, AICPJacobs, Project ManagerSt. Louis, MO
Jim Prost, AICPVantage Point Development Advisors, PrincipalAnnapolis, MD
2013 Rail Conference

Basis for Concept
• Peoria is largest of 8 Illinois MSAs without any rail service
• HSR does not serve Peoria• Peoria with Bloomington-Normal is a half
million strong • Peoria would like a two-anchor commuter
rail service with HSR access
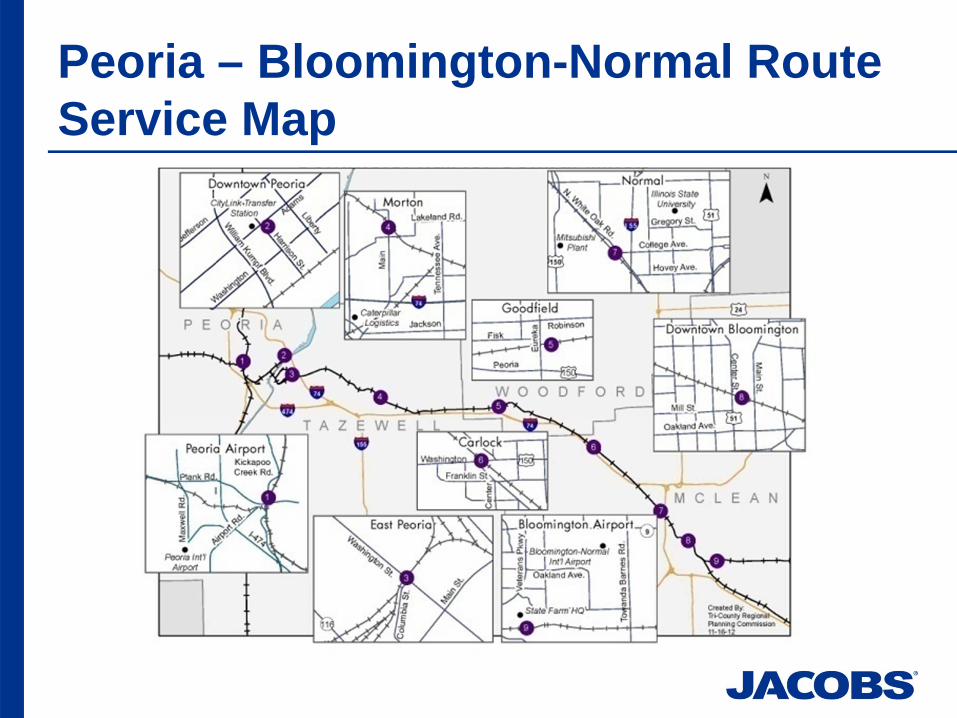
Peoria – Bloomington-Normal Route Service Map

Study Components
• Operating Scenarios• Ridership Estimates/Station Boardings• Sources and Uses of Capital Costs• Sources and Uses of Operating Costs• Development Considerations

Alternative Rail Operating Scenario Components
RoundTrips /
Service Hours
Daily Annual
Trip
s
Car
-Mile
s
Trai
n-H
rs
Car
-Mile
s
Trai
n-H
rs
8 / 12 16 1,575 24 399,980 6,100
6 / 12 12 1,181 24 299,980 6,100
6 / 9 12 1,181 18 299,980 4,570
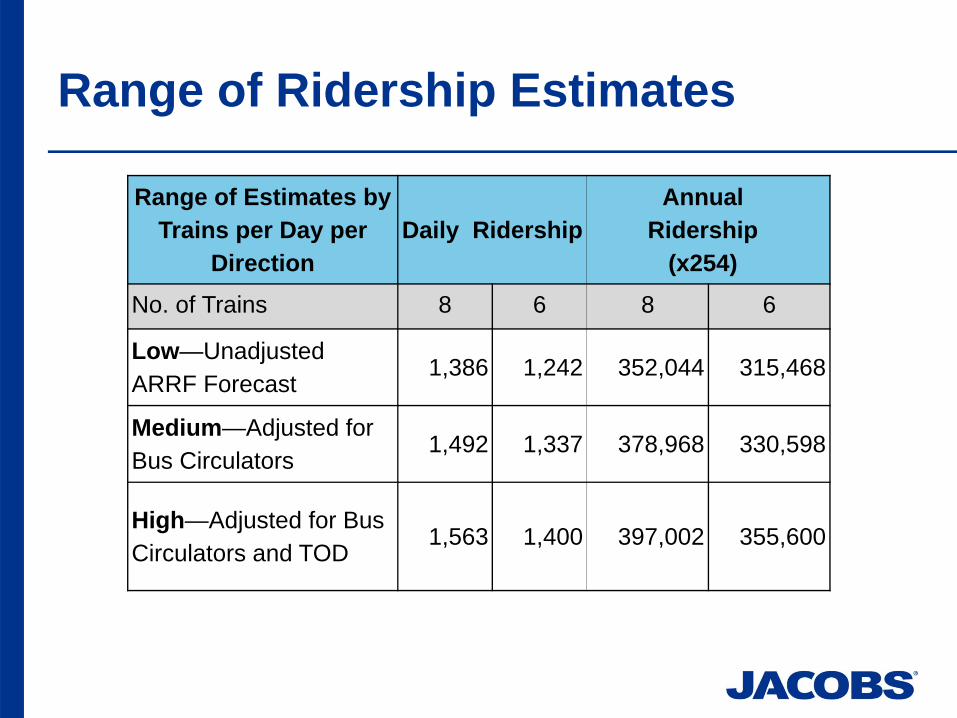
Range of Ridership Estimates
Range of Estimates by Trains per Day per
DirectionDaily Ridership
AnnualRidership
(x254)
No. of Trains 8 6 8 6
Low—Unadjusted ARRF Forecast
1,386 1,242 352,044 315,468
Medium—Adjusted for Bus Circulators
1,492 1,337 378,968 330,598
High—Adjusted for Bus Circulators and TOD
1,563 1,400 397,002 355,600

Projected Daily Station Boardings
2035 Forecast By Station Daily Boardings (Rounded)
Trains: 6 8Peoria Airport 170 220
Downtown Peoria 320 380
East Peoria 180 220
Morton 80 150
Goodfield 10 10
Carlock 10 10
West Normal 120 150
Bloomington 200 240
SE Bloomington 160 190
Totals 1,250 1,570

Sources and Uses of Capital Costs
Capital Costs (Total)Sources M % Uses M %
FTA New Starts Grants (5309) $75.0 42% Track-work $30.3 17%
Subtotal Federal $75.0 42% Stations $35.4 20%IDOT-DPIT Grants $25.0 14% Yard & Shops $1.7 1%Illinois Finance Authority Loans $25.0 14% Parking $9.2 5%Subtotal State $50.0 28% Systems $13.5 8%
TCRPC STP-MM Funds $1.6 1% ROW $7.8 4%
Sales Taxes $38.6 21% Vehicles $40.0 22%
Bonds $13.6 8% Professional Services $24.7 14%
Subtotal Local $53.8 30% Contingency $16.2 9%Total $178.8 100 Total $178.8 100

Sources and Uses of Annual Operating Costs
Operating Costs (Annual)*Source M % Uses M %
Fares $3.8 24%Rail
Operations$12.6 79%
Parking $1.0 6%Bus
Operations$2.1 13%
Advertising & Rents
$0.1 1% Interest $1.3 8%
Sales Taxes $11.1 69%
Total $16.0 100% Total $16.0 100%*Excludes any annualized operating agreement costs to use railroad rights-of-way, which are unknown at this time.
Development Considerations
• Supportive Public Policies• Transit Oriented Development (TOD)• Abe Lincoln Knowledge Corridor
Supportive Public Policies
• Can Enhance Rail and In Turn Are Enhanced by Rail
• A Critical Part of New Starts Funding• Bridge the Gap Between Land Use,
Transportation and Environmental Planning• Are at the Regional (MPO), County and
Local Level
Established Policies Include:
• Zoning, Land Use, Infrastructure and Economic Development Policies
• Regional Elements Are Focused on: – Agricultural Preservation– Balanced Growth– High Speed Rail to Chicago and St. Louis
• Local Elements Are Focused on:– Smart Growth– TOD– Walkability– Bicycle Parking/Lanes– Parking Management

TOD Methodology
• Part of Land Use, Economic Development and Ridership Evaluation
• Derived from Regional, Jurisdictional and ½ Mile Radius from Transit Stations Economic/Demographic Projections
• Considerations:– Existing/Future Land Use– Available Land– Development Plans– Area Opportunities/Constraints– Potential Market Capture Rates
• Established Station Area Typologies, Formulated Base/Threshold TODs, Utilized Empirical Evidence of Incremental TOD Impacts (10%-30% over a 15-20 year time frame)

TOD Projections
Station Area
Typology TOD Increment
Use Characteristics
Development Intensity Households Employment
Peoria Airport Mixed Low 200 100Downtown Peoria Employment High 600 1,305East Peoria Employment High 200 550Morton Mixed Low 200 100Goodfield Residential Low 200 20Carlock Residential Low 200 20West Normal Mixed High 200 100Bloomington Employment Medium 200 280Bloomington SE Employment High 200 225Total 2,200 2,700

Abe Lincoln Knowledge Corridor
• Rail Connectivity Viewed As a Key Element of Transportation, Housing, Land Use, Economic Development and Supportive Public Policies In the Larger Illinois-I-74 (Iowa/Missouri to Indiana Corridor)
• Creates Combined 1.5M-Person 0.5M-Employee Interconnected Economic Powerhouse with Advanced Manufacturing, Health Care, Education/Innovation
• Key Elements: – Branding– Regional Collaboration/Leadership Development– Leveraging of Assets– Interconnectivity– Competitiveness– Enhancement of Passenger and Freight Movement