PeopleCert SixSigma GreenBelt Sample Paper
10
-
Upload
ahmad-rizal-satmi -
Category
Documents
-
view
227 -
download
2
Transcript of PeopleCert SixSigma GreenBelt Sample Paper
8/9/2019 PeopleCert SixSigma GreenBelt Sample Paper
http://slidepdf.com/reader/full/peoplecert-sixsigma-greenbelt-sample-paper 1/10

8/9/2019 PeopleCert SixSigma GreenBelt Sample Paper
http://slidepdf.com/reader/full/peoplecert-sixsigma-greenbelt-sample-paper 2/10
8/9/2019 PeopleCert SixSigma GreenBelt Sample Paper
http://slidepdf.com/reader/full/peoplecert-sixsigma-greenbelt-sample-paper 3/10
IASSC Six Sigma Green Belt Certification | Sample Paper© 2010 PEOPLECERT All rights reservedOctober 2010 / Version 01.0
IASSC SIX SIGMA CERTIFICATION EXAM
SAMPLE PAPER – GREEN BELT
Sample Test Questions (Select all applicable answers)
Phase 1 - Define Phase
1. A shoe manufacturing firm learned through a Lean Six Sigma project their boot soles
could be made of a different material requiring two less steps in the process. Removal
of these two steps yielded a monthly cost savings of $7,500. Therefore the reported
financial savings for this LSS project were _____________.
a. $45,000
b. $75,000
c. $90,000
d. $120,000
2. A Belt utilized a diamond symbol in a Process Map she created for the process that
was subject to her LSS project. By use of the diamond symbol she was showing a(n)
_______________ point in the process.
a. Ending
b. Beginning
c. Decision
d. Repair station
3. When in the process of trying to identify the Critical X’s for a LSS project a Belt creates
a(n) _____________ because frequently it is 20% of the inputs that have an 80%
impact on the output.
a. Pareto Chart
b. FMEA
c. Np Chart
d. X-Y Diagram
8/9/2019 PeopleCert SixSigma GreenBelt Sample Paper
http://slidepdf.com/reader/full/peoplecert-sixsigma-greenbelt-sample-paper 4/10
IASSC Six Sigma Green Belt Certification | Sample Paper© 2010 PEOPLECERT All rights reservedOctober 2010 / Version 01.0
Phase 2 - Measure Phase
1. When a Belt is developing a Macro Process Map to define a complex process he will
frequently include activities across various department to capture all the appropriateactivity. He will use _____________ to show which department is responsible for
which steps in the process.
a. Subscripts
b. Superscripts
c. Swim Lanes
d. Fence Posts
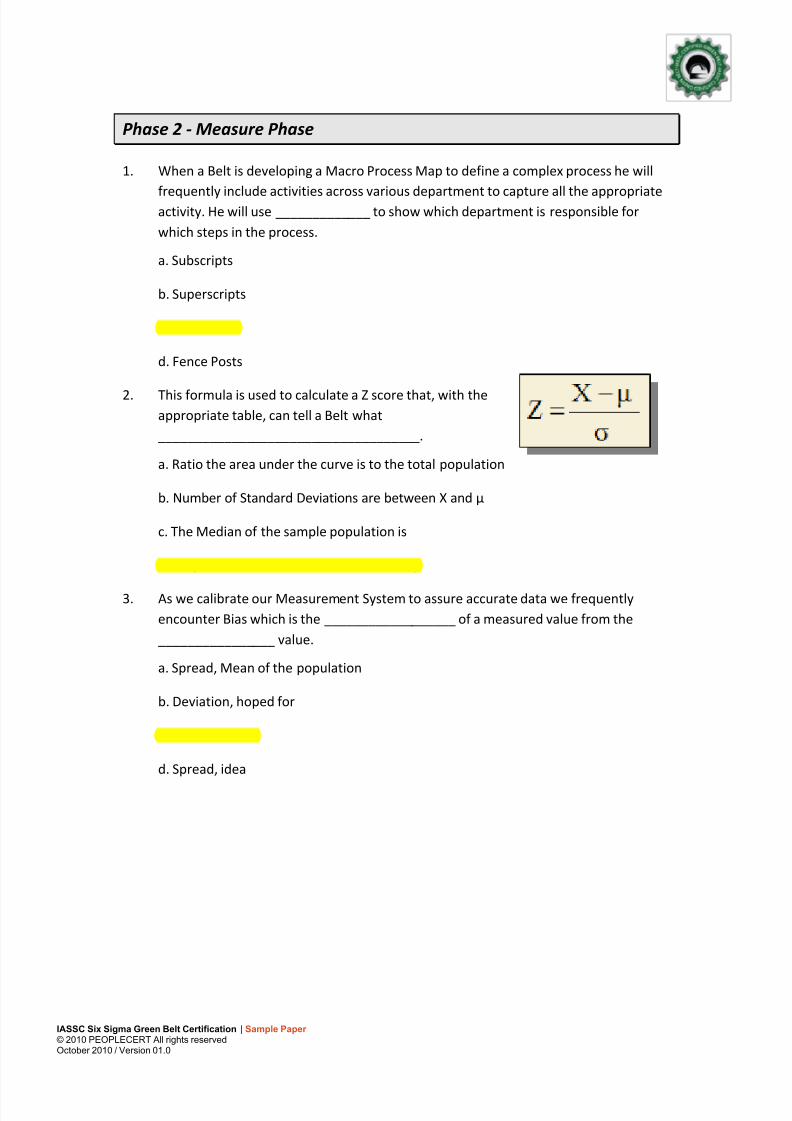
2. This formula is used to calculate a Z score that, with theappropriate table, can tell a Belt what
____________________________________.
a. Ratio the area under the curve is to the total population
b. Number of Standard Deviations are between X and μ
c. The Median of the sample population is
d. Proportion of the data is between X and μ
3. As we calibrate our Measurement System to assure accurate data we frequently
encounter Bias which is the __________________ of a measured value from the
________________ value.
a. Spread, Mean of the population
b. Deviation, hoped for
c. Deviation, true
d. Spread, idea
8/9/2019 PeopleCert SixSigma GreenBelt Sample Paper
http://slidepdf.com/reader/full/peoplecert-sixsigma-greenbelt-sample-paper 5/10
IASSC Six Sigma Green Belt Certification | Sample Paper© 2010 PEOPLECERT All rights reservedOctober 2010 / Version 01.0
Phase 3 - Analyze Phase
1. In an “X” Sifting exercises a Belt will use a(n) _______________ to assist in isolating
families of variation that may exist within a subgroup, between subgroups or vary overtime..
a. Multi-Vari Chart
b. Pareto Chart
c. FMEA
d. Shewhart Analysis
2. When analyzing sample data a Belt may experience a Bimodal Distribution with each
mode displaying Normal Distribution. This could be caused by __________________________ .
a. Two different machines being read
b. Two operators on different shifts
c. Two suppliers parts being used
d. All these are correct answers
3. A battery manufacturer was considering changing suppliers for a particular part. The
purchasing manager required that the average cost of the part be less than or equal to
$32 in order to stay within budget. A sample of the 32 initial deliveries had a Mean of
the new product upgrade price of $28 with an estimated Standard Deviation of $3.
Based on the data provided, the Z value for the data assuming a Normal Distribution
is?
a. 0.67
b. 1.33
c. 2.67
d. 4.33
8/9/2019 PeopleCert SixSigma GreenBelt Sample Paper
http://slidepdf.com/reader/full/peoplecert-sixsigma-greenbelt-sample-paper 6/10
IASSC Six Sigma Green Belt Certification | Sample Paper© 2010 PEOPLECERT All rights reservedOctober 2010 / Version 01.0
Phase 4 - Improve Phase
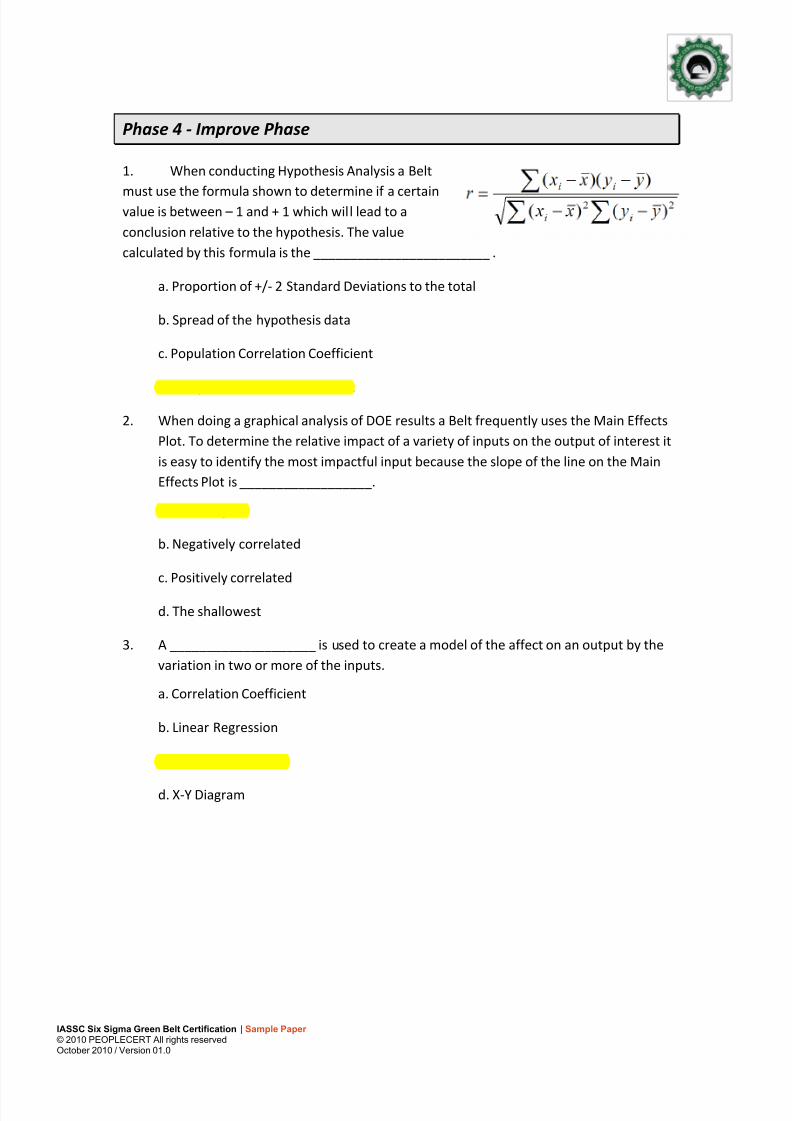
1. When conducting Hypothesis Analysis a Belt
must use the formula shown to determine if a certainvalue is between – 1 and + 1 which will lead to a
conclusion relative to the hypothesis. The value
calculated by this formula is the ________________________ .
a. Proportion of +/- 2 Standard Deviations to the total
b. Spread of the hypothesis data
c. Population Correlation Coefficient
d. Sample Correlation Coefficient
2. When doing a graphical analysis of DOE results a Belt frequently uses the Main Effects
Plot. To determine the relative impact of a variety of inputs on the output of interest it
is easy to identify the most impactful input because the slope of the line on the Main
Effects Plot is __________________.
a. The steepest
b. Negatively correlated
c. Positively correlated
d. The shallowest
3. A ____________________ is used to create a model of the affect on an output by the
variation in two or more of the inputs.
a. Correlation Coefficient
b. Linear Regression
c. Multiple Regression
d. X-Y Diagram
8/9/2019 PeopleCert SixSigma GreenBelt Sample Paper
http://slidepdf.com/reader/full/peoplecert-sixsigma-greenbelt-sample-paper 7/10
IASSC Six Sigma Green Belt Certification | Sample Paper© 2010 PEOPLECERT All rights reservedOctober 2010 / Version 01.0
Phase 5 - Control Phase
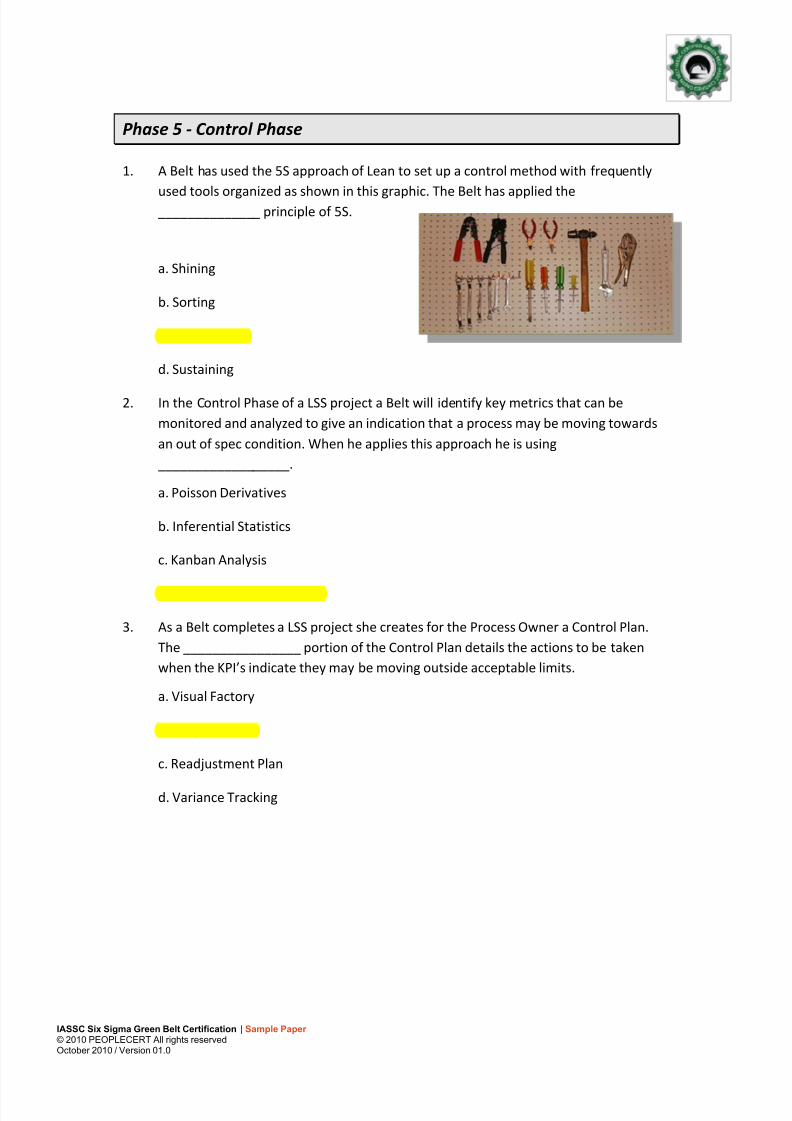
1. A Belt has used the 5S approach of Lean to set up a control method with frequently
used tools organized as shown in this graphic. The Belt has applied the ______________ principle of 5S.
a. Shining
b. Sorting
c. Straightening
d. Sustaining
2. In the Control Phase of a LSS project a Belt will identify key metrics that can be
monitored and analyzed to give an indication that a process may be moving towards
an out of spec condition. When he applies this approach he is using
__________________.
a. Poisson Derivatives
b. Inferential Statistics
c. Kanban Analysis
d. Statistical Process Control
3. As a Belt completes a LSS project she creates for the Process Owner a Control Plan.
The ________________ portion of the Control Plan details the actions to be taken
when the KPI’s indicate they may be moving outside acceptable limits.
a. Visual Factory
b. Response Plan
c. Readjustment Plan
d. Variance Tracking
8/9/2019 PeopleCert SixSigma GreenBelt Sample Paper
http://slidepdf.com/reader/full/peoplecert-sixsigma-greenbelt-sample-paper 8/10
IASSC Six Sigma Green Belt Certification | Sample Paper© 2010 PEOPLECERT All rights reservedOctober 2010 / Version 01.0
S AMPLE T EST QUESTIONS ANSWER K EY
Phase 1 - Define Phase
1. C $90,000
2. C Decision
3. A Pareto Chart
Phase 2 -Measure Phase
1. C Swim Lanes
2. D Proportion of the data is between X and μ
3. C Deviation, true
Phase 3 - Analyze Phase
1. A Multi-Vari Chart
2. D All these are correct answers
3. B 1.33
Phase 4 - Improve Phase
1. D Sample Correlation Coefficient
2. A The steepest
3. C Multiple Regression
Phase 5 - Control Phase
1. C Straightening
2. D Statistical Process Control
3. B Response Plan
8/9/2019 PeopleCert SixSigma GreenBelt Sample Paper
http://slidepdf.com/reader/full/peoplecert-sixsigma-greenbelt-sample-paper 9/10
IASSC Six Sigma Green Belt Certification | Sample Paper© 2010 PEOPLECERT All rights reservedOctober 2010 / Version 01.0
NOTES
……………………………………………………………………………………………………………………………………….
……………………………………………………………………………………………………………………………………….
……………………………………………………………………………………………………………………………………….
……………………………………………………………………………………………………………………………………….
……………………………………………………………………………………………………………………………………….
……………………………………………………………………………………………………………………………………….
……………………………………………………………………………………………………………………………………….
……………………………………………………………………………………………………………………………………….
……………………………………………………………………………………………………………………………………….
……………………………………………………………………………………………………………………………………….
……………………………………………………………………………………………………………………………………….
……………………………………………………………………………………………………………………………………….
……………………………………………………………………………………………………………………………………….
……………………………………………………………………………………………………………………………………….
……………………………………………………………………………………………………………………………………….
……………………………………………………………………………………………………………………………………….
……………………………………………………………………………………………………………………………………….

8/9/2019 PeopleCert SixSigma GreenBelt Sample Paper
http://slidepdf.com/reader/full/peoplecert-sixsigma-greenbelt-sample-paper 10/10