People re-identification by spectral classification of … re-identification by spectral...
13
People re-identification by spectral classification of silhouettes D.-N. Truong Cong a, , L. Khoudour a , C. Achard b , C. Meurie c , O. Lezoray d a The French National Institute for Transport and Safety Research (INRETS), LEOST, 20, rue Elise´e Reclus, 59650 Villeneuve d’Ascq Cedex, France b UMPC Univ Paris 06, ISIR, UMR 7222, France c University of Technology of Belfort Montbe ´liard, SeT, France d University of Caen Basse-Normandie, GREYC UMR CNRS 6072, France article info Article history: Received 30 October 2008 Received in revised form 31 May 2009 Accepted 4 September 2009 Keywords: Surveillance systems Person re-identification People tracking Spectral analysis Support vector machines Color invariant abstract The problem described in this paper consists in re-identifying moving people in different sites which are completely covered with non-overlapping cameras. Our proposed framework relies on the spectral classification of the appearance-based signatures extracted from the detected person in each sequence. We first propose a new feature called ‘‘color-position’’ histogram combined with several illumination invariant methods in order to characterize the silhouettes in static images. Then, we develop an algorithm based on spectral analysis and support vector machines (SVM) for the re-identification of people. The performance of our system is evaluated on real datasets collected on INRETS premises. The experimental results show that our approach provides promising results for security applications. & 2009 Elsevier B.V. All rights reserved. 1. Introduction Nowadays, there is no doubt that security should be a major worry for the actors of public transport (travelers, staff, operating companies, governments). Each network or country has established measures according to their knowledge of these problems, to local conditions, and cultural traditions (for example: attitudes and legal limits relative to private life). Timely detection and intervention are needed in the case of threats for security, such as aggressions against people, vandalism against property, acts of terrorism, accidents and major catastrophes such as fires. The Closed-Circuit TeleVision (CCTV) coverage, which is considered as an essential element by several networks of large and middle-size cities, local authorities and police forces, has improved unceasingly. For instance, it was estimated that more than a million cameras are in public places in the United Kingdom and that on average, an individual is ‘‘seen’’ by 300 cameras in only one day in London. However, the lack of staff limits drastically the general use of CCTV, especially if these systems must be used for prevention, rather than to react after the detection of accidents. It is usual that a human operator, responsible for a video surveillance system, should have to manage simultaneously 20–40 video sources. It brings new difficulties in defining the suitable procedures capable of managing the large volumes of information produced by such systems. When raw video data are available, one must automatically identify incidents as well as danger- ous and potentially dangerous situations. Indeed, it is essential to avoid the visual excess to which human operators are currently exposed. The research presented in this paper is within the framework of BOSS European project [1] (on BOard wireless Secured video Surveillance) which aims at devel- oping a multi-camera vision system specified to monitor, detect and recognize abnormal events occurring on-board trains. One of the important tasks of such a system is to establish correspondence between observations of people Contents lists available at ScienceDirect journal homepage: www.elsevier.com/locate/sigpro Signal Processing ARTICLE IN PRESS 0165-1684/$ - see front matter & 2009 Elsevier B.V. All rights reserved. doi:10.1016/j.sigpro.2009.09.005 Corresponding author. Tel.: þ33 3 20 43 83 43; fax: þ33 3 20 43 83 59. E-mail address: [email protected] (D.-N. Truong Cong). Signal Processing ] (]]]]) ]]]–]]] Please cite this article as: D.-N. Truong Cong, et al., People re-identification by spectral classification of silhouettes, Signal Process. (2009), doi:10.1016/j.sigpro.2009.09.005
Transcript of People re-identification by spectral classification of … re-identification by spectral...

People re-identification by spectral classification of silhouettes
D.-N. Truong Cong a,!, L. Khoudour a, C. Achard b, C. Meurie c, O. Lezoray d
a The French National Institute for Transport and Safety Research (INRETS), LEOST, 20, rue Elisee Reclus, 59650 Villeneuve d’Ascq Cedex, Franceb UMPC Univ Paris 06, ISIR, UMR 7222, Francec University of Technology of Belfort Montbeliard, SeT, Franced University of Caen Basse-Normandie, GREYC UMR CNRS 6072, France
a r t i c l e i n f o
Article history:Received 30 October 2008Received in revised form31 May 2009Accepted 4 September 2009
Keywords:Surveillance systemsPerson re-identificationPeople trackingSpectral analysisSupport vector machinesColor invariant
a b s t r a c t
The problem described in this paper consists in re-identifying moving people indifferent sites which are completely covered with non-overlapping cameras. Ourproposed framework relies on the spectral classification of the appearance-basedsignatures extracted from the detected person in each sequence. We first propose a newfeature called ‘‘color-position’’ histogram combined with several illumination invariantmethods in order to characterize the silhouettes in static images. Then, we developan algorithm based on spectral analysis and support vector machines (SVM) for there-identification of people. The performance of our system is evaluated on real datasetscollected on INRETS premises. The experimental results show that our approachprovides promising results for security applications.
& 2009 Elsevier B.V. All rights reserved.
1. Introduction
Nowadays, there is no doubt that security should be amajor worry for the actors of public transport (travelers,staff, operating companies, governments). Each networkor country has established measures according to theirknowledge of these problems, to local conditions, andcultural traditions (for example: attitudes and legal limitsrelative to private life). Timely detection and interventionare needed in the case of threats for security, such asaggressions against people, vandalism against property,acts of terrorism, accidents and major catastrophes suchas fires. The Closed-Circuit TeleVision (CCTV) coverage,which is considered as an essential element by severalnetworks of large and middle-size cities, local authoritiesand police forces, has improved unceasingly. For instance,it was estimated that more than a million cameras are inpublic places in the United Kingdom and that on average,
an individual is ‘‘seen’’ by 300 cameras in only one day inLondon.
However, the lack of staff limits drastically the generaluse of CCTV, especially if these systems must be used forprevention, rather than to react after the detection ofaccidents. It is usual that a human operator, responsiblefor a video surveillance system, should have to managesimultaneously 20–40 video sources. It brings newdifficulties in defining the suitable procedures capable ofmanaging the large volumes of information produced bysuch systems. When raw video data are available, onemust automatically identify incidents as well as danger-ous and potentially dangerous situations. Indeed, it isessential to avoid the visual excess to which humanoperators are currently exposed.
The research presented in this paper is within theframework of BOSS European project [1] (on BOardwireless Secured video Surveillance) which aims at devel-oping a multi-camera vision system specified to monitor,detect and recognize abnormal events occurring on-boardtrains. One of the important tasks of such a system is toestablish correspondence between observations of people
Contents lists available at ScienceDirect
journal homepage: www.elsevier.com/locate/sigpro
Signal Processing
ARTICLE IN PRESS
0165-1684/$ - see front matter & 2009 Elsevier B.V. All rights reserved.doi:10.1016/j.sigpro.2009.09.005
! Corresponding author. Tel.: !33320 438343; fax: !33320 438359.E-mail address: [email protected] (D.-N. Truong Cong).
Signal Processing ] (]]]]) ]]]–]]]
Please cite this article as: D.-N. Truong Cong, et al., People re-identification by spectral classification of silhouettes,Signal Process. (2009), doi:10.1016/j.sigpro.2009.09.005

over different camera views located at different physicalsites. In most cases, such a task relies on the appearance-based models of moving people that may vary dependingon several factors, such as illumination conditions, cameraangles and pose changes.
In this paper, we propose a particular function betweentwo cameras in order to re-identify a person who hasappeared in the field of one camera and then reappears infront of another camera. Our proposed approach consistsof several steps. First, we compute invariant features (alsocalled signatures) in order to characterize the silhouettesin static images. Then, a graph-based approach isintroduced to reduce the effective working space andrealize the comparison of two video sequences (twopassages). The performance of our system is evaluatedon a real dataset containing 40 people filmed in twodifferent environments (one indoors and one outdoors).
One of the originalities of our research is the trackingof people that represent in the image processing field,what are called deformable shapes. The second originalityis the developed algorithms based on spectral analysis andsupport vector machines (SVM) for the re-identification ofpeople as they move from one location to another. Lastly,the third strong point is that the algorithm is fullyilluminant invariant.
The organization of the article is as follows: after thisintroduction, we will find in Section 2 a short state of theart on video sequence comparison. Section 3 describeshow the invariant signature of a detected person isgenerated. In Section 4, after a few theoretical reminderson spectral analysis, we explain howwe adapt the latter toour problematic. The first illustrated results allow us toestablish a good discrimination between individuals. InSection 5, we briefly describe the main concepts of SVMand their application to our problem. In fact, the use ofSVM is an interested step that complements spectralanalysis to perform re-identification. Section 6 presentsglobal results on the performance of our system on a realdataset. Finally, in Section 7, conclusions and importantshort-term perspectives are given.
2. State of the art on video sequence comparison
Over the past several years, a significant amount ofresearch has been carried out in the field of objectrecognition by comparing video sequences. It is usual todescribe the color-based features of video sequences usinga set of key frames that describes well an entire videosequence. Several techniques of key frame selection fromvideo sequences have been proposed so far. Ueda et al. [2]used the first and last frames of each sequence as two keyframes. Ferman et al. [3] clustered the frames in eachsequence. The closest frame to the center of the largestcluster is selected as the key frame for that shot. Sun et al.[4] divided a video sequence into intervals which aredetermined by computing the largest dissimilaritybetween the first and last frames. Girgensohn et al. [5]determined the key frames by clustering the frames in avideo shot and by selecting the most representative framefor each cluster. Yang et al. [6] proposed a key frame
selection process based on a comparison of the distancesof the current key frame to the following frames with agiven threshold. Although the latter key frame selectiontechniques are computationally inexpensive, the videosequence description they provide varies significantlywith the selection criterion.
Given the drawback of key frame extraction methods, apreferable approach is to consider the characteristics of allthe frames within a sequence and to compute a singlecompound signature of the sequence. Ferman et al. [7,8]proposed various histogram-based color descriptors torepresent the color properties of a sequence. Leclercq et al.[9] proposed to use co-occurrence matrices to have aspatial distribution of the pixels in a shape. They thenused principal component analysis (PCA) for dimension-ality reduction and final classification. Gheissari et al. [10]proposed a temporal signature which is invariant to theposition of the body and the dynamic appearance ofclothing within a video shot.
3. Signature generation
The first step in our system consists in extracting fromeach frame a robust signature characterizing the passageof a person. To do this, a detection of moving areas, bybackground subtraction, combined with a shadow elim-ination algorithm is first carried out [11,12]. Let us assumenow that each person’s silhouette is located in all theframes of a video sequence. Since the appearance ofpeople is dominated by their clothes, color features aresuitable for their description. Several tools can then beused, such as the color histogram [13] that is the mostcommonly used structure to represent global imagefeatures. It is invariant to translation, rotation and canbecome invariant to scale by normalization. The undeni-able advantage of the color path length feature [14] is itsability to include some spatial information: each pixelinside the silhouette is represented by a feature vector"x; l#, where x is the color value and l is the length betweenan anchor point (the top of the head) and the pixel. Thedistribution of p"x; l# is then estimated with a 2Dhistogram. We can lastly cite spatiograms [15], which area generalization of histograms including higher orderspatial moments. For example, the second-order spatio-gram contains, for each histogram bin, the spatial meanand covariance.
In our research, we propose a new descriptor for staticimages called the ‘‘color-position’’ histogram (Fig. 1). Thisis really easy to estimate because the silhouette is firstvertically divided into n equal parts. Then, the meancolor is computed to characterize each part. The‘‘color-position’’ histogram is then composed of n$ 3values (while working with three color channels).Compared to the classical color histogram, it leads tobetter results (thanks to the spatial information) and usesless memory. Its advantages regarding the color pathlength feature are a faster estimation and lower memoryconsumption. Furthermore, this new feature is morehomogeneous than the spatiogram; this leads to simpleand more reliable measures to compare two silhouettes.
ARTICLE IN PRESS
Please cite this article as: D.-N. Truong Cong, et al., People re-identification by spectral classification of silhouettes,Signal Process. (2009), doi:10.1016/j.sigpro.2009.09.005
D.-N. Truong Cong et al. / Signal Processing ] (]]]]) ]]]–]]]2

Unfortunately, the color acquired by cameras is heavilydependent on several factors, such as the surfacereflectance, illuminant color, lighting geometry, responseof the sensor, etc. and preliminary processings have to beintroduced to obtain invariant signatures.
Several normalizations have been proposed in litera-ture and we tested most of them. We only cite the mostinteresting as the chromaticity space derived from the RGBspace from:
r %R
R! G! B; g %
GR! G! B
; b %B
R! G! B"1#
It is very simple and is independent of illuminantintensity (but not illuminant color).
Greyworld normalization [16] consists in dividing foreach channel, the pixel value by the average of the image(or in a given area):
R0 %R
mean"R#; G0 %
Gmean"G#
; B0 %B
mean"B#"2#
This normalization is derived from the diagonal model ofcolor change proposed by Finlayson et al. [17]. Invarianceis obtained according to illuminant color (but not toilluminant intensity).
To be invariant to both intensity and color changes,Finlayson et al. have introduced the comprehensivenormalization procedure [17], which is an iterative algo-rithm with two steps in the principal loop, one for eachinvariance.
A new feature based on the assumption that the rankordering of sensor responses is preserved across a changein imaging illuminations has also been introduced [18].The rank measure for the level i and the channel k isobtained with
Mk"i# %Xi
u%0
Hk"u#Xi
u%0
Hk"u#
,"3#
where Nb is the number of quantization steps and Hk"&# isthe histogram for the channel k.
ARTICLE IN PRESS
Fig. 1. Color-position histogram: original image (a), localization of the silhouette (b), color distribution in the silhouette (c). (For interpretation of thereferences to color in this figure legend, the reader is referred to the web version of this article.)
Please cite this article as: D.-N. Truong Cong, et al., People re-identification by spectral classification of silhouettes,Signal Process. (2009), doi:10.1016/j.sigpro.2009.09.005
D.-N. Truong Cong et al. / Signal Processing ] (]]]]) ]]]–]]] 3

Lastly, we have tested the affine normalization defined by
R0 %R'mean"R#
std"R#; G0 %
G'mean"G#std"G#
; B0 %R'mean"B#
std"B#"4#
For all these methods, the color normalization is appliedinside the silhouette of each person before computing itscolor-position histogram. A comparative study of thedifferent normalization procedures will be presented inSection 6.
The output of this first step is a color-positionhistogram, invariant to lighting conditions and estimatedon each frame. However, the signature extracted from justone frame is not robust enough for comparing two imagesequences. A stronger solution is needed to characterizethe whole sequence. In the following section, we willintroduce a graph-based approach that can reduce thedimensionality of our dataset (set of signatures of asequence) without losing useful information and obtain asingle representation of a whole sequence.
4. Dimensionality reduction
4.1. Overview
High-dimensional data, meaning data that requireseveral dimensions to represent, can be difficult tointerpret and process. One approach to tackle thisproblem is to assume that the data of interest lies on anembedded non-linear manifold within the higher dimen-sional space. If the manifold is of low enough dimensionthen the data can be visualized in the low dimensionalspace. Spectral methods have recently emerged as apowerful tool for non-linear dimensionality reductionand manifold learning [19,20]. Each input example is thenassociated with a low-dimensional representation thatcorresponds to its estimated coordinates on the manifold.Dimensionality reduction can yield to a new representa-tion that preserves almost all the original informationwhile this new representation can also ease learningand improve generalization in a supervised learningprocess. In addition to being useful as a preprocessingstep for supervised learning, non-linear dimensionalityreduction is often used for data analysis and visualization,since visualizing the projections of the data can help tobetter understand it. In the last few years, manyunsupervised learning algorithms have been proposedwhich share the use of an eigen-decomposition forobtaining a lower-dimensional embedding of the datathat characterizes a non-linear manifold near which thedata would lie: locally linear embedding (LLE) [21],Isomap [22], Laplacian eigenmaps [23], diffusion maps[24] and many variants of spectral analysis [25,26].
In this paper, we only focus on graph-based methodsfor non-linear dimensionality reduction. Sometimes calleddiffusion maps, Laplacian eigenmaps or spectral analysis,these manifold-learning techniques preserve the localproximity between data points by first constructing agraph representation for the underlying manifold withvertices and edges. The vertices represent the data points,
and the edges connecting the vertices, represent thesimilarities between adjacent nodes. If properly normal-ized, these edge weights can be interpreted as transitionprobabilities for a random walk on the graph. Afterrepresenting the graph with a matrix, the spectralproperties of this matrix are used to embed the datapoints into a lower dimensional space, and gain insightinto the geometry of the dataset.
Let fx1;x2; . . . ;xmg 2 Rn be m sample vectors. Given aneighborhood graph G associated to these vectors,one considers its adjacency matrix W where weightsWij are given by a Gaussian kernel Wij % K"xi;xj# %exp"'Jxi ' xjJ2=s2#. Let D denote the diagonal matrixwith elements Dii %
PjWij and D denote the un-normal-
ized Laplacian defined by D % D'W. The dimensionalityreduction consists in searching for a new representationfj1;j2; . . . ;jmg with ji 2 Rm, obtained by minimizing
12
X
ij
Jji 'jjJ2Wij % Tr"YTDY#
with Y % (j1;j2; . . . ;jm)
"5#
This cost function encourages nearby sample vectors to bemapped to nearby outputs. This is achieved by finding theeigenvectors j1;j2; . . . ;jm of matrix D. Dimensionalityreduction is obtained by considering the q lowesteigenvectors (the first eigenvector being discarded) withq5n. Therefore, we can define a dimensionality reductionoperator h : xi-"j2"i#; . . . ;jq"i## where jk"i# is the i thcoordinate of eigenvector jk. When the graph G is aneighborhood graph (e.g. a k nearest neighbor graph), thisdimensionality reduction is called Laplacian eigenmaps[23]. When the graph G is a complete graph, thisdimensionality reduction is called diffusion maps [24].Both methods are equivalent (up to some normalization)and very close to spectral analysis [20]. In the rest of thepaper, we will use the term spectral analysis to denote adimensionality reduction performed by the above-mentioned graph-based approach.
4.2. Silhouette categorization
In this section, we present our framework based onspectral analysis that is able to reduce the dimensionalityof an image set and provides a new 2D visualization. Thisapproach enables us to visualize the images of twosequences in a 2D space and thus helps us to interpretthem more easily.
Given an image set S consisting of m images belongingto two sequences S % fI1; I2 . . . ; Img, the first step of ourframework is to extract the invariant signature ‘‘color-position’’ described in Section 3. This leads to a new set ofvectors X % fx1;x2; . . . ;xmg 2 Rk, where each vector xicorresponds to the image Ii. We now associate to the setof vectors X a complete neighborhood graph G % "V ; E#where each vector xi (as well as each image Ii)corresponds to a vertex vi in this graph. Two verticescorresponding to two vectors xi and xj are connected by anedge that is weighted by Wij % exp"'d"xi;xj#2=s2#. Here,we use the L1 norm for computing the distance betweentwo characteristic vectors d"xi;xj# %
Pnk%1 jxik 'xjkj. The
ARTICLE IN PRESS
Please cite this article as: D.-N. Truong Cong, et al., People re-identification by spectral classification of silhouettes,Signal Process. (2009), doi:10.1016/j.sigpro.2009.09.005
D.-N. Truong Cong et al. / Signal Processing ] (]]]]) ]]]–]]]4

parameter s is chosen as s % mean(d"xi;xj#); 8i; j %1; . . . ;m "iaj#. Ideally, Wij is large when images indexedby i and j are preferably in the same sequence, and is smallotherwise. Now, we can compute the un-normalizedLaplacian D and produce the eigenstructure of D. Theeigenvectors "j1;j2; . . . ;jm# provide a new coordinate forthe image set.
Dimensionality reduction is obtained by considering theq lowest eigenvectors with q5n. Choosing number q couldbe a problem. A solution proved by von Luxburg et al. [27]is that the eigenvalues corresponding to the eigenvectorsused for dimensionality reduction and then for spectralclustering must be significantly below the minimal degreein the graph (i.e. li5minj%1;...;nDjj; 8i % 1; . . . ; q). The othereigenvectors which correspond to eigenvalues withlZminDjj are almost Dirac functions. Within the frame-work of our approach, two eigenvectors "j2;j3# whoseeigenvalues are significantly below minDjj are used forcreating a 2D projection suitable for the visualization of thewhole image set. Each image Ii is now represented by pointui % "j2"i#;j3"i## in the 2D Euclidean space.
In order to illustrate the output of the spectral analysisand demonstrate that it is a good representation forvisualizing and comparing two sequences, we carried outseveral tests. The first is achieved by applying the spectralanalysis to an image set composed of two sequences (10frames per sequence) representing two people differentlydressed.
Fig. 2 presents the 2D space "j2;j3# in which the set offrames of two sequences is plotted. On the left-handdiagram, the frames of the two sequences are illustratedby star points (blue for one person and red for the other)while on the right-hand diagram the points are directlyillustrated by the corresponding silhouettes. According tothe results shown in Fig. 2, we notice that the image set ofthis experiment contains two well-separated clusters witha large gap between both (i.e. the space between the twoclusters is large). In other words, as the image set isnaturally partitioned into two disjoint classes in the"j2;j3# space, we can assert that the two testedsequences represent two different people. In this case,only j2 eigenvector is sufficient to perform the clustering.This corresponds to use the sign of j2 and is equivalent touse the normalized cut algorithm [26].
The second trial is carried out with sequences of twodifferent people very similarly dressed (they both wear awhite T-shirt and blue jeans). Note that these twosequences are captured by two cameras located at twodifferent sites (indoors in a hall near windows andoutdoors with natural light). The result is shown inFig. 3. For this image set, we can see that the twoclusters are now less easily identifiable because, even ifthe two sequences represent two different individuals,their colorimetric appearances are very similar. There isstill a gap between the two clusters, but it is not so easy tosplit the 20 frames into two groups without any priorknowledge. It is worth to note that here the normalizedcut criterion is not accurate enough to perform theclustering.
The last trial image set consists of two sequences of thesame person captured in different locations: indoors, in a
hall near windows and, outdoors, in a garden. Shootingenvironments are completely different in terms of light-ing, background, and so on. The mapping in Fig. 4 showsthat the clusters of the two image sequences stronglyoverlap. There are no longer clear clusters and well-defined gap in this image set. This means that, in spite ofthe different environments, the two groups of frames arerecognized as similar and, in other words, correspond tothe same person.
Thus, these first experimental results illustrate that,by using the invariant signature ‘‘color-position’’ histo-gram to create the set of characteristic vectors of twotest sequences and by applying spectral analysis, we canobtain a new visualization of an image set that helps usto determine the gap (the distance) between two image
ARTICLE IN PRESS
Fig. 2. Visualization of two sequences containing two people differentlydressed in the 2D space represented by "j2 ;j3# (one wears a whiteT-shirt and blue jeans, the other wears a black dress). (For interpretationof the references to color in this figure legend, the reader is referred tothe web version of this article.)
Please cite this article as: D.-N. Truong Cong, et al., People re-identification by spectral classification of silhouettes,Signal Process. (2009), doi:10.1016/j.sigpro.2009.09.005
D.-N. Truong Cong et al. / Signal Processing ] (]]]]) ]]]–]]] 5

sequences. The more dissimilar the two sequences,the larger the gap. Because our objective is to re-identify people (recognize them from one camera toanother) based on their color appearance, these resultsare very satisfactory and encourage us to continue inthis way.
Spectral analysis is a very important step allowing adimensional reduction without losing too much informa-tion included in the data. At this step, a higher levelmodule has to be introduced to take a final decision ofre-identification when comparing two sequences.Different parametric, non-parametric, and discriminating
methods have been considered and the SVM seems to beappropriate for our problem. In the following section, wewill briefly describe the main concepts of SVM and theirspecific application to our problem.
5. Application of SVM in measuring the similarity of twosequences
In Section 4, we described how an image set can bemapped into a 2D plane by using spectral dimensionalityreduction. Several experimental results showed that thenew coordinate system is a good representation forvisualizing the image set. Moreover, it introduces a gapbetween two clusters that can be used to solve ourobjective of re-identification. We present in this sectionthe application of SVM [28] (see Appendix for moredetails) to define the gap between two clusters (two
ARTICLE IN PRESS
Fig. 3. Visualization of two sequences belonging to two different peoplesimilarly dressed in the 2D space represented by "j2 ;j3# (both wear awhite T-shirt and blue jeans). (For interpretation of the references tocolor in this figure legend, the reader is referred to the web version ofthis article.)
Fig. 4. Visualization of two sequences describing the same person in adifferent location in the 2D space represented by "j2;j3#.
Please cite this article as: D.-N. Truong Cong, et al., People re-identification by spectral classification of silhouettes,Signal Process. (2009), doi:10.1016/j.sigpro.2009.09.005
D.-N. Truong Cong et al. / Signal Processing ] (]]]]) ]]]–]]]6

groups of frames, for instance), and to compute thedistance between the two sequences.
Let ui 2 R2 be the vector obtained by spectral analysiscorresponding to the i-th image of the tested image set.Each vector is labeled by a class vi 2 f'1;!1g according tothe sequences it belongs to. The linear SVM whose kernelfunction K"&; &# is defined as K"ui;uj# % uT
i uj is now applieddirectly to the input–output set "ui;vi# in order todetermine the optimal hyperplane w & f"w# ! b % 0 whichseparates the two classes with the widest margin.Computing this hyperplane is equivalent to minimizethe following optimization problem [29]:
V"w; b; x# % 12JwJ2 ! C
Xm
i%1
xi
!"6#
where the constraint 8mi%1 : vi(w & f"ui# ! b)Z1' xi; xiZ0requires that all training examples are correctly classifiedup to some slack x and C is a parameter allowing trading-off between training errors and model complexity.
We first discuss the case where the training dataset islinearly separable (Figs. 2 and 3). This means that it ispossible to find an optimal hyperplane which separatestwo classes without error (i.e. there is no slack x inclassification). The distance between two image se-quences in this case is defined as the optimal margin2=JwJ obtained by the SVM. Fig. 5 shows the resultsobtained by applying SVM to the image sets shown in Figs.2 and 3. We notice that the distance between the twoimage sequences in the first test (Fig. 5a) is larger than inthe second (Fig. 5b). This means that the more differentthe appearances of two individuals are, the larger thedistance between two image sequences.
The above discussion has been restricted to the casewhere the image set is linearly separable. For the non-separable image set, there are always several misclassifi-cation errors which are measured by the slack xi. Theresult of the classification in this case depends onparameter C (see Eq. (6)) which corresponds to the degreeof penalty assigned to an error. In our algorithm, wechoose C equal to infinity. For such a value of C,the solution of SVM converges towards the solutionobtained by the optimal separating hyperplane for thenon-separable dataset.
Fig. 6 shows the result obtained by applying SVM to theimage set shown in Fig. 4. The errors of classification arerepresented by a surrounding circle in the diagram. Wenotice that, for such a dataset, we cannot find twohyperplanes H1 and H2 which separate the twosequences according to the linear model. The distancebetween two image sequences in this case can beconsidered equal to 0, or, in other words, these twosequences represent the same person in our case.However, such an assessment can result in two possiblecases: a true re-identification (true positive) if two imagesequences are from the same person and a falsere-identification (false positive or type 1 error) if twoimage sequences are from two different people.
In order to further describe the characteristic of twoimage sequences in the non-separable case, we introducea notion of ‘‘mixture score’’ which is defined as
ARTICLE IN PRESS
Fig. 5. Linear separating hyperplanes for the image set of Figs. 2 and 3.
Fig. 6. Application of SVM for the image set of Fig. 4.
Please cite this article as: D.-N. Truong Cong, et al., People re-identification by spectral classification of silhouettes,Signal Process. (2009), doi:10.1016/j.sigpro.2009.09.005
D.-N. Truong Cong et al. / Signal Processing ] (]]]]) ]]]–]]] 7

s % 'Pk
i%1 xi=JwJ. The more misclassification errors thereare, the smaller the mixture score. This notion can be usedas a complementary condition for comparing twosequences in case there are many pairs of sequenceswhich cannot be separated by a linear model.
6. Experimental results
As mentioned above, our research aims to set up anon-board surveillance system that is able to re-identify aperson through multiple cameras with different fields ofvision. Before collecting a real on-board dataset, a largedatabase containing video sequences of 40 peopleacquired in INRETS premises was collected for theevaluation of our algorithms. We have chosen twodifferent locations (indoors in a hall near windows andoutdoors with natural light) to set up these two cameras.Fig. 7 illustrates one of the 40 people in these twolocations. We notice that the color appearance is verydifferent according to the real scene illuminationconditions.
For each video sequence, the silhouette of the movingperson is extracted by using the background subtractiontechnique, combined with a shadow elimination
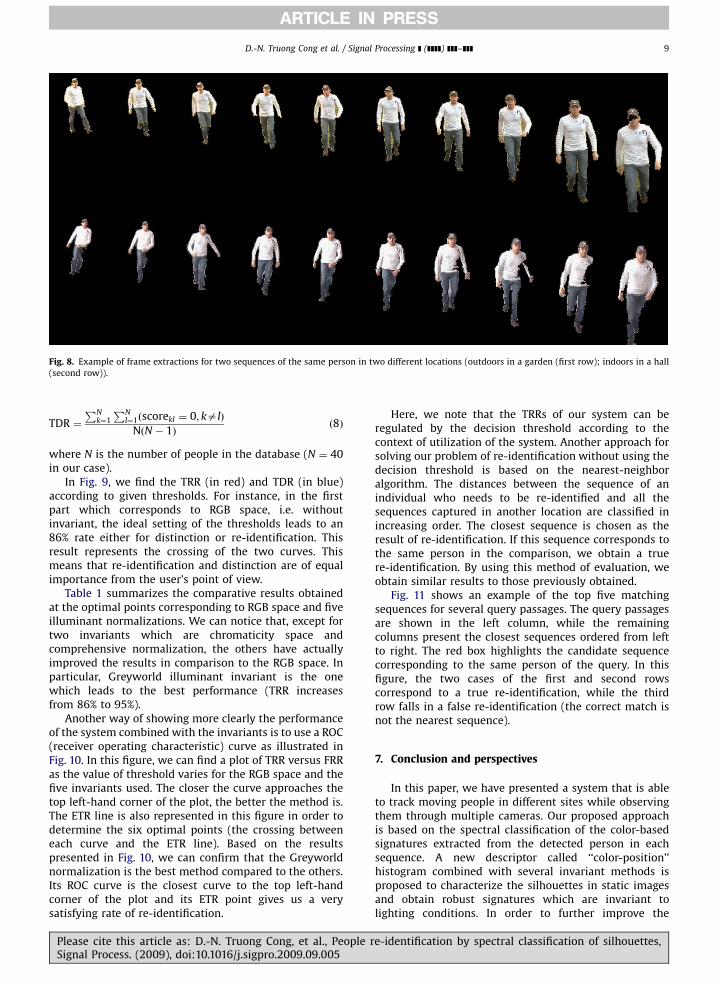
algorithm [11,12] and morphological operators (erosionand dilation). A set of key frames in which people areentirely viewed is then extracted in order to characterizethe passage of an individual. For this database, we havechosen to extract 10 key frames per passage and perlocation. Such a number of frames is sufficient fordescribing the characteristics of a passage in front ofcamera and for ensuring an adequate time processing.Fig. 8 illustrates the key frames extracted from twosequences of the same person.
For each query passage in front of one camera, thedistances between the query passage and each of thecandidate passages of the other camera are calculated byapplying the spectral analysis for dimensional reductionand the SVM for similarity measure. A decision thresholdis chosen; distances below the threshold indicate are-identification "score % 1#. This means that twopassages belong to the same person. If the distance isabove the threshold, this means it is a distinction andthese two test passages belong to two different indivi-duals "score % 0#.
Since there are 40 video sequences for each location,40$ 40 distances (i.e. dissimilarities between two videosequences) are calculated and then compared with thethreshold. The resulting scores can be arranged in a 40$40 score matrix. An ideal score matrix is one whosediagonal elements are 1 (true re-identification) and whoseoff-diagonal elements are 0 (true distinction). In fact, areal re-identification system can give one of four possibleresults:
* True re-identification (also known as true match, truepositive): the system declares a re-identification"score % 1# when the two passages belong to the sameperson (the diagonal).
* True distinction (also known as true non-match, truenegative): the system declares a distinction "score % 0#when the two passages represent two different people(the off-diagonal).
* False re-identification (also known as false positive,false match or type II error): the system declares a re-identification "score % 1# when the two passagesrepresent two different people (the off-diagonal).
* False distinction (also known as false negative, falsenon-match or type I error): the system declares adistinction "score % 0# when the two passages repre-sent the same person (the diagonal).
Hence, these four possible rates (true re-identificationrate, TRR, true distinction rate, TDR, false re-identificationrate, FRR, and false distinction rate, FDR) can be calculatedfrom the score matrix and are functions of the thresholdwhich can be changed according to the context ofutilization of the system. In our system, we choose theoptimal threshold by referring to the equal true rate (ETR)point which assumes the equality of TRR and TDR. Twosuch rates can be calculated from the score matrix byusing the following definitions:
TRR %PN
k%1"scorekk % 1#N
"7#
ARTICLE IN PRESS
Fig. 7. Illustrations of the large real database representing the sameperson in two different environments: indoors in a hall (left) andoutdoors (right).
Please cite this article as: D.-N. Truong Cong, et al., People re-identification by spectral classification of silhouettes,Signal Process. (2009), doi:10.1016/j.sigpro.2009.09.005
D.-N. Truong Cong et al. / Signal Processing ] (]]]]) ]]]–]]]8
TDR %PN
k%1
PNl%1"scorekl % 0; kal#N"N ' 1#
"8#
where N is the number of people in the database (N % 40in our case).
In Fig. 9, we find the TRR (in red) and TDR (in blue)according to given thresholds. For instance, in the firstpart which corresponds to RGB space, i.e. withoutinvariant, the ideal setting of the thresholds leads to an86% rate either for distinction or re-identification. Thisresult represents the crossing of the two curves. Thismeans that re-identification and distinction are of equalimportance from the user’s point of view.
Table 1 summarizes the comparative results obtainedat the optimal points corresponding to RGB space and fiveilluminant normalizations. We can notice that, except fortwo invariants which are chromaticity space andcomprehensive normalization, the others have actuallyimproved the results in comparison to the RGB space. Inparticular, Greyworld illuminant invariant is the onewhich leads to the best performance (TRR increasesfrom 86% to 95%).
Another way of showing more clearly the performanceof the system combined with the invariants is to use a ROC(receiver operating characteristic) curve as illustrated inFig. 10. In this figure, we can find a plot of TRR versus FRRas the value of threshold varies for the RGB space and thefive invariants used. The closer the curve approaches thetop left-hand corner of the plot, the better the method is.The ETR line is also represented in this figure in order todetermine the six optimal points (the crossing betweeneach curve and the ETR line). Based on the resultspresented in Fig. 10, we can confirm that the Greyworldnormalization is the best method compared to the others.Its ROC curve is the closest curve to the top left-handcorner of the plot and its ETR point gives us a verysatisfying rate of re-identification.
Here, we note that the TRRs of our system can beregulated by the decision threshold according to thecontext of utilization of the system. Another approach forsolving our problem of re-identification without using thedecision threshold is based on the nearest-neighboralgorithm. The distances between the sequence of anindividual who needs to be re-identified and all thesequences captured in another location are classified inincreasing order. The closest sequence is chosen as theresult of re-identification. If this sequence corresponds tothe same person in the comparison, we obtain a truere-identification. By using this method of evaluation, weobtain similar results to those previously obtained.
Fig. 11 shows an example of the top five matchingsequences for several query passages. The query passagesare shown in the left column, while the remainingcolumns present the closest sequences ordered from leftto right. The red box highlights the candidate sequencecorresponding to the same person of the query. In thisfigure, the two cases of the first and second rowscorrespond to a true re-identification, while the thirdrow falls in a false re-identification (the correct match isnot the nearest sequence).
7. Conclusion and perspectives
In this paper, we have presented a system that is ableto track moving people in different sites while observingthem through multiple cameras. Our proposed approachis based on the spectral classification of the color-basedsignatures extracted from the detected person in eachsequence. A new descriptor called ‘‘color-position’’histogram combined with several invariant methods isproposed to characterize the silhouettes in static imagesand obtain robust signatures which are invariant tolighting conditions. In order to further improve the
ARTICLE IN PRESS
Fig. 8. Example of frame extractions for two sequences of the same person in two different locations (outdoors in a garden (first row); indoors in a hall(second row)).
Please cite this article as: D.-N. Truong Cong, et al., People re-identification by spectral classification of silhouettes,Signal Process. (2009), doi:10.1016/j.sigpro.2009.09.005
D.-N. Truong Cong et al. / Signal Processing ] (]]]]) ]]]–]]] 9

appearance-based model of an individual, many images ofa video sequence should be exploited. Hence, an algorithmwhich is based on spectral analysis coupled with a specificSVM-based classification is applied to compare twosequences and make the final decision of re-identification.
The global system was tested on a real and difficultdataset composed of 40 individuals filmed at two differentlocations: indoors near windows and outdoors with verydifferent lighting conditions. The experimental resultshave shown that our proposed approach provides reliableresults: 95% for the true re-identification rate and thedistinction rate as well. These results are the fruit of theclever combination of the spectral analysis, the SVMmethod and the illuminant invariance of the colorposition silhouettes.
In order to further improve the performance of oursystem, the appearance-based signatures need to addmore temporal and spatial information in order to befurther discriminating among different people and tobe unifying in order to make coherent classes withall the features belonging to the same person. Anadditional classification should be carried out in the casewhere the appearance of a moving person changessignificantly due to occlusion, partial detection, etc. Theother features, such as camera transition time, movingdirection of the individual, biometrics features (face,gait), etc. should also be considered in order to improvethe performance of the re-identification system, especiallyin the more challenging scenarios (multiple passagesin front of cameras, many people wearing same colorclothes, etc.).
More extensive evaluation also needs to be carriedout. A good occasion will be to test it on people trackingin transport environment in the framework of theEuropean BOSS project. On-board automatic videosurveillance is a challenge due to the difficulties indealing with fast illumination variations, reflect-ions, vibrations, high people density and static/dynamic occlusions that perturb actual video interpreta-tion tools.
ARTICLE IN PRESS
Table 1TRRs at the optimal points corresponding to RGB space and five colornormalization procedures obtained by the proposed approach.
TRRs at the optimal points (%)
RGB 86Chromaticity space 65Greyworld normalization 95Comprehensive normalization 80RGB-rank 88Affine normalization 91
Fig. 10. ROC curves for comparing five invariant methods.
Fig. 9. Variation of TRR and TDR according to the settings of threshold.Two ETR points (A, B) corresponding to two color spaces (RGB andGreyworld, respectively) are presented. (For interpretation of thereferences to color in this figure legend, the reader is referred to theweb version of this article.)
Please cite this article as: D.-N. Truong Cong, et al., People re-identification by spectral classification of silhouettes,Signal Process. (2009), doi:10.1016/j.sigpro.2009.09.005
D.-N. Truong Cong et al. / Signal Processing ] (]]]]) ]]]–]]]10

Appendix A. Support vector machines
The SVMs were developed by Vapnik et al. [28]. Theyare based on the structural risk minimization principle
from statistical learning theory. SVMs express predictionsin terms of a linear combination of kernel functionscentered on a subset of the training data, known assupport vectors.
ARTICLE IN PRESS
Fig. 11. Example of the top five matching sequences for several query passages.
Please cite this article as: D.-N. Truong Cong, et al., People re-identification by spectral classification of silhouettes,Signal Process. (2009), doi:10.1016/j.sigpro.2009.09.005
D.-N. Truong Cong et al. / Signal Processing ] (]]]]) ]]]–]]] 11

Given the training data "xi; yi#, i % f1; . . . ;mg, xi 2 Rn,yi 2 f'1;!1g, a SVM maps the input vector x into ahigh-dimensional feature space H through some mappingfunctions f : Rn-H, and builds an optimal separatinghyperplane in this space. The mapping f"&# is performedby a kernel function K"&; &# that defines an inner product inH. The kernel function maps the input space into a highdimensional Euclidean space and this kernel trick enablesnon-linear classification. A typical kernel is Gaussiankernel K"xi;xj# % exp"'Jxi ' xjJ2=2s2#. The separatinghyperplane given by a SVM is w &f"w# ! b % 0. Theoptimal hyperplane is characterized by the maximaldistance to the closest training data. The margin isinversely proportional to the norm of w. Thus, computingthis hyperplane is equivalent to minimize the followingoptimization problem [29]:
V"w; b; x# %12JwJ2 ! C
Xm
i%1
xi
!"A:1#
where the constraint 8mi%1 : yi(w &f"xi# ! b)Z1' xi; xiZ0requires that all training examples are correctly classifiedup to some slack x and C is a parameter allowing trading-off between training errors and model complexity. Thisoptimization is a convex quadratic programming problem.Its whole dual [28] is to maximize the followingoptimization problem:
W"a# %Xm
i%1
ai '12
Xm
i;j%1
aiajyiyjK"wi;wj# "A:2#
subject to 8mi%1 : 0rairC,Pm
i%1 yiai % 0.The optimal solution a+ specifies the coefficients for
the optimal hyperplane w+ %Pm
i%1 a+i yif"xi# and defines
the subset SV of all support vectors. An example xi ofthe training set is a SV if a+
i Z0 in the optimal solution.The support vectors subset gives the binary decisionfunction h:
h"x# % sign"f "x##; f "x# %X
i2SV
a+i yiK"xi;x# ! b+ "A:3#
where the threshold b+ is computed via the unboundedsupport vectors [28] (i.e. 0oa+
i oC).An efficient algorithm SMO [30] and many refinements
[31] were proposed to solve dual problem. SVM arepowerful classifiers having high generalization abilities,but the decision function build by SVM has a complexitythat increases with training set size. Moreover, highdimensional spaces are sensitive to the curse of dimen-sionality and scalar products quickly become hard tocompute. One way to cope with these problems is toreduce the size of the input space by dimensionalityreduction. Moreover, dimensionality reduction can easethe learning process and improve generalization abilities.
References
[1] /http://www.celtic-boss.org/S.[2] H. Ueda, T. Miyatake, S. Yoshizawa, An interavtive natural
motion picture dedicated multimedia authoring system, in: CHI’91 Conference Proceedings, ACM Press, New York, 1991, pp.343–350.
[3] A. Ferman, A. Tekalp, Multiscale content extraction and representa-tion for video indexing, in: Multimedia Storage and ArchivingSystems II, Proceedings of the SPIE, vol. 3229, 1997, pp. 23–31.
[4] X. Sun, M. Kankanhalli, Y. Zhu, J. Wu, Content-based representativeframe extraction for digital video, in: IEEE Conference of Multi-media Computing and Systems, 1998, pp. 190–193.
[5] A. Girgensohn, J. Boreczky, Time-constrained keyframe selectiontechnique, Multimedia Tools and Applications 11 (3) (2000) 347–358.
[6] Y. Yu, D. Harwood, K. Yoon, L. Davis, Human appearance modelingfor matching across video sequences, Machine Vision and Applica-tions 18 (3) (2007) 139–149.
[7] A. Ferman, S. Krishnamachari, A. Tekalp, M. Abdel-Mottaleb, R.Mehrotra, Group-of-frames/pictures color histogram descriptors formultimedia applications, in: Proceedings of the IEEE InternationalConference on Image Processing, 2000, pp. 65–68.
[8] A. Ferman, A. Tekalp, R. Mehrotra, Robust color histogramdescriptors for video segment retrieval and identification, IEEETransactions on Image Processing 11 (5) (2002) 497–508.
[9] T. Leclercq, L. Khoudour, L. Macaire, J.-G. Postaire, Compact colorvideo signature by principal component analysis, in: Proceedings ofthe International Conference on Computer Vision and Graphics,2004, pp. 814–819.
[10] N. Gheissari, T. Sebastian, R. Hartley, Person reidentification usingspatiotemporal appearance, in: Proceedings of the 2006 IEEEComputer Society Conference on Computer Vision and PatternRecognition, IEEE Computer Society, Washington, DC, USA, 2006,pp. 1528–1535.
[11] F. Porikli, O. Tuzel, Human body tracking by adaptive backgroundmodels and mean-shift analysis, in: IEEE International Workshop onPerformance Evaluation of Tracking and Surveillance, March 2003.
[12] D. Hall, J. Nascimento, P. Ribeiro, E. Andrade, P. Moreno, S. Pesnel, T.List, R. Emonet, R. Fisher, J. Victor, J. Crowley, Comparison oftarget detection algorithms using adaptive background models,in: IEEE International Workshop on Visual Surveillanceand Performance Evaluation of Tracking and Surveillance, 2005,pp. 113–120.
[13] O. Javed, Z. Rasheed, K. Shafique, M. Shah, Tracking across multiplecameras with disjoint views, in: Ninth IEEE International Con-ference on Computer Vision, 2003.
[14] K. Yoon, D. Harwood, L. Davis, Appearance-based person recognitionusing color/path-length profile, Journal of Visual Communicationand Image Representation 17 (3) (2006) 605–622.
[15] S. Birchfield, S. Rangarajan, Spatiograms versus histograms forregion-based tracking, in: IEEE Computer Society Conference onComputer Vision and Pattern Recognition (CVPR 2005), vol. 2, 2005,pp. 1158–1163.
[16] G. Buchsbaum, A spatial processor model for object color percep-tion, Journal of the Franklin Institute 310 (1) (1980) 1–26.
[17] G.D. Finlayson, B. Schiele, J. Crowley, Comprehensive color imagenormalization, in: Proceedings of the Fifth European Conference onComputer Vision, 1998, pp. 475–490.
[18] G. Finlayson, S. Hordley, G. Schaefer, G. Yun Tian, Illuminant anddevice invariant colour using histogram equalisation, PatternRecognition 38 (2) (2005) 179–190.
[19] Y. Bengio, O. Delalleau, N.L. Roux, J.-F. Paiement, P. Vincent, M.Ouimet, Spectral dimensionality reduction, in: I. Guyon, S. Gunn, M.Nikravesh, L. Zadeh (Eds.), Feature Extraction, Foundations andApplications, Studies in Fuzziness and Soft Computing, vol. 207,Springer, Berlin, 2006, pp. 519–550.
[20] L. Saul, K. Weinberger, J. Ham, F. Sha, D. Lee, Spectral methods fordimensionality reduction, in: O. Chapelle, B. Scholkopf, A. Zien(Eds.), Semi-Supervised Learning, MIT Press, Cambridge, MA, 2006,pp. 279–294.
[21] S. Roweis, L. Saul, Nonlinear dimensionality reduction by locallylinear embedding, Science 290 (5500) (2000) 2323–2326.
[22] J.B. Tenenbaum, V. de Silva, J.C. Langford, A global geometricframework for nonlinear dimensionality reduction, Science 290(5500) (2000) 2319–2323.
[23] M. Belkin, P. Niyogi, Laplacian eigenmaps for dimensionalityreduction and data representation, Neural Computation 15 (6)(2003) 1373–1396.
[24] B. Nadler, S. Lafon, R.R. Coifman, I.G. Kevrekidis, Diffusionmaps, spectralclustering and eigenfunctions of Fokker–Planck operators, in: Advancesin Neural Information Processing Systems, 2005, pp. 955–962.
[25] A.Y. Ng, M.I. Jordan, Y. Weiss, On spectral clustering: analysis and analgorithm, in: Advances in Neural Information Processing Systems,MIT Press, Cambridge, MA, 2001, pp. 849–856.
[26] U. von Luxburg, A tutorial on spectral clustering, Statistics andComputing 17 (4) (2007) 395–416.
ARTICLE IN PRESS
Please cite this article as: D.-N. Truong Cong, et al., People re-identification by spectral classification of silhouettes,Signal Process. (2009), doi:10.1016/j.sigpro.2009.09.005
D.-N. Truong Cong et al. / Signal Processing ] (]]]]) ]]]–]]]12

[27] U. von Luxburg, O. Bousquet, M. Belkin, Consistency of spectralclustering, Technical Report 134, Max Planck Institute for BiologicalCybernetics, 2004.
[28] V.N. Vapnik, Statistical Learning Theory, Wiley, New York, 1998.[29] J. Shawe-Taylor, N. Cristianini, Support Vector Machines and Other
Kernel-based Learning Methods, Cambridge University Press, Cam-bridge, MA, 2000.
[30] J. Platt, Fast training of support vector machines usingsequential minimal optimization, in: Advances in Kernel Meth-ods—Support Vector Learning, MIT Press, Cambridge, MA, 1999, pp.185–208.
[31] C.-C. Chang, C.-J. Lin, LIBSVM: a library for support vector machines,Software Available at: /http://www.csie.ntu.edu.tw/,cjlin/libsvmS,2001.
ARTICLE IN PRESS
Please cite this article as: D.-N. Truong Cong, et al., People re-identification by spectral classification of silhouettes,Signal Process. (2009), doi:10.1016/j.sigpro.2009.09.005
D.-N. Truong Cong et al. / Signal Processing ] (]]]]) ]]]–]]] 13