People, Plagues, and Prices in the Roman World: The ... · 803 People, Plagues, and Prices in the...
37
803 People, Plagues, and Prices in the Roman World: The Evidence from Egypt KYLE HARPER The papyri of Roman Egypt provide some of the most important quantifiable data from a first-millennium economy. This paper builds a new dataset of wheat prices, land prices, rents, and wages over the entire period of Roman control in Egypt. Movements in both nominal and real prices over these centuries suggest periods of intensive and extensive economic growth as well as contraction. Across a timeframe that covers several severe mortality shocks, demographic changes appear to be an important, but by no means the only, force behind changes in factor prices. T his article creates and analyzes a time series of wheat and factor prices for Egypt from AD 1 to the Muslim conquest, ~AD 641. From the time the territory was annexed by Octavian in 30 BCE until it was permanently taken around AD 641, Egypt was an important part of the Roman Empire. Famously, it supplied grain for the populations of Rome and later Constantinople, but more broadly it was integrated into the culture, society, and economy of the Roman Mediterranean. While every province of the sprawling Roman Empire was distinctive, recent work stresses that Egypt was not peculiar (Bagnall 1993; Rathbone 2007). Neither its Pharaonic legacy, nor the geography of the Nile valley, make it unrepresentative of the Roman world. In one crucial sense, however, Roman Egypt is truly unique: the rich- ness of its surviving documentation. Because of the valley’s arid climate, tens of thousands of papyri, covering the entire spectrum of public and private documents, survive from the Roman period (Bagnall 2009). In aggregate this cache of evidence provides a unique vantage—documen- tary and quantitative—onto the dynamics and performance of the Roman economy in the long run. To be sure, the evidence from Roman Egypt will never compare with some of the archives of late medieval and early The Journal of Economic History, Vol. 76, No. 3 (September 2016). © The Economic History Association. All rights reserved. doi: 10.1017/S0022050716000826 Kyle Harper is Professor of Classics and Letters and Senior Vice President and Provost, The University of Oklahoma, 660 Parrington Oval, Norman, OK 73019. E-mail: [email protected]. I would like to express my gratitude to all who have read and made helpful suggestions on this article, including Michael McCormick, Dominic Rathbone, Peter Temin, and the anonymous readers of this JOURNAL. I am especially grateful to Ann Carlos for her many thoughtful comments and to Federico Morelli for generously sharing unpublished work. I thank my colleague Jeffrey Widener for authoring Map 1. All errors of course remain my own.
Transcript of People, Plagues, and Prices in the Roman World: The ... · 803 People, Plagues, and Prices in the...
803
People, Plagues, and Prices in the Roman World: The Evidence from Egypt
Kyle Harper
The papyri of Roman Egypt provide some of the most important quantifiable data from a first-millennium economy. This paper builds a new dataset of wheat prices, land prices, rents, and wages over the entire period of Roman control in Egypt. Movements in both nominal and real prices over these centuries suggest periods of intensive and extensive economic growth as well as contraction. Across a timeframe that covers several severe mortality shocks, demographic changes appear to be an important, but by no means the only, force behind changes in factor prices.
This article creates and analyzes a time series of wheat and factor prices for Egypt from AD 1 to the Muslim conquest, ~AD 641. From
the time the territory was annexed by Octavian in 30 BCE until it was permanently taken around AD 641, Egypt was an important part of the Roman Empire. Famously, it supplied grain for the populations of Rome and later Constantinople, but more broadly it was integrated into the culture, society, and economy of the Roman Mediterranean. While every province of the sprawling Roman Empire was distinctive, recent work stresses that Egypt was not peculiar (Bagnall 1993; Rathbone 2007). Neither its Pharaonic legacy, nor the geography of the Nile valley, make it unrepresentative of the Roman world.
In one crucial sense, however, Roman Egypt is truly unique: the rich-ness of its surviving documentation. Because of the valley’s arid climate, tens of thousands of papyri, covering the entire spectrum of public and private documents, survive from the Roman period (Bagnall 2009). In aggregate this cache of evidence provides a unique vantage—documen-tary and quantitative—onto the dynamics and performance of the Roman economy in the long run. To be sure, the evidence from Roman Egypt will never compare with some of the archives of late medieval and early
The Journal of Economic History, Vol. 76, No. 3 (September 2016). © The Economic History Association. All rights reserved. doi: 10.1017/S0022050716000826
Kyle Harper is Professor of Classics and Letters and Senior Vice President and Provost, The University of Oklahoma, 660 Parrington Oval, Norman, OK 73019. E-mail: [email protected].
I would like to express my gratitude to all who have read and made helpful suggestions on this article, including Michael McCormick, Dominic Rathbone, Peter Temin, and the anonymous readers of this Journal. I am especially grateful to Ann Carlos for her many thoughtful comments and to Federico Morelli for generously sharing unpublished work. I thank my colleague Jeffrey Widener for authoring Map 1. All errors of course remain my own.

Harper804
modern Europe, which have allowed economic historians to explore in depth the nature of late pre-industrial economies. But the evidence from Roman Egypt provides a unique opportunity to deepen our understanding of a first-millennium economy, extending backward in time questions about the major determinants and overall levels of output in pre-industrial economies. Moreover, the Roman economy can and should occupy an important place in global economic history. Indeed, Ian Morris’ attempt at a global “social development index” suggests the Romans may have achieved a lunge toward development that was significant in scope and extensive in both space and time (Morris 2010, 2013). But the outlines of that development—its scale, chronology, and causes—remain the subject of debate, and the evidence from Egypt furnishes a means to seek quan-titative answers.
One long-standing view of the Roman economy stresses its failure to achieve significant levels of development. In this interpretation, trade and technology had limited impact in the context of an ancient economy dominated by agrarian production.1 The growth that seems apparent, for instance, in the archaeological record was merely extensive growth, achieved by the blunt force of more people. Possibly, as some have argued, population growth even overwhelmed productivity gains; larger populations eventually suffered from diminishing returns to land and/or labor, and thus the inhabitants of the Roman Empire experienced lower per capita output and lower average living standards (Frier 2001; Lo Cascio and Malanima 2005; Lo Cascio 2009). In short, demographic factors overwhelmed other forces in the determination of incomes in the Roman world. A more optimistic interpretation of the Roman economy emphasizes the possibility of intensive growth.2 If the Roman economy experienced sustained intensive growth, as Peter Temin (2013, pp. 195–219) argues, it occurred through some combination of two mecha-nisms: trade and technology.3 The empire integrated different regions of the circum-Mediterranean into one political entity, and signs of increased trade are manifest in legal records, literary sources, dated shipwrecks, and above all ceramic transport containers and domestic wares that trav-elled across commercial networks and are well preserved. The insti-tutional regime of Roman law and the transportation infrastructure of
1 The classic statement is Finley (1973); see Scheidel, Morris, and Saller (2007) for the state of the question.
2 For example, Wilson (2002) and Jongman (2007), and the essays in Bowman and Wilson (2009).
3 Here we mention but cannot explore the possibility of climate change, compassed as an independent influence on Roman economic productivity in recent work (McCormick et al. 2012; Hin 2013).

People Plagues, and Prices in the Roman World 805
the Roman Empire lowered transaction costs and facilitated exchange. Trade allowed specialization, fostering what is generally called Smithian growth: higher living standards achieved by greater output created by the specialization of labor. The empire also facilitated technological devel-opment and diffusion. More machines and other technical improvements allowed what is generally called Schumpeterian growth: higher living standards achieved by greater output created by more and better produc-tive technologies. These can be complementary, and both have propo-nents in the Roman context.4
In general, it is believed that Smithian growth in the Roman world would have been of limited duration, a one-off benefit from imperial integration. Schumpeterian growth, by contrast, could have been more extended in time but is thought to have been limited in scope (Temin 2013, p. 233). Regardless of the source of intensive growth, the more fundamental question is whether such economic growth was eroded by population expansion. Is it true of the Romans, as Gregory Clark has posited more generally, that “in the preindustrial world sporadic tech-nological advance produced people, not wealth” (Clark 2007, p. 32)?5 Indeed Walter Scheidel (2012a, p. 11) has argued that “Perhaps the biggest unacknowledged question of Roman economic history is whether population pressure was already mounting before the imperial power structure started to unravel or whether the epidemics of the second and third centuries CE provided temporary relief (or instead made matters worse)... In the long run, the Roman economy was unable to overcome fundamental demographic constraints on intensive economic growth.” And similarly, he and others have speculated that the demographic contraction caused by bubonic plague, at the end of the period under study here, “may temporarily have driven up real incomes. Unfortunately, this scenario has barely begun to be explored by historians specializing in this period.”6
To decide whether demographic factors dominated income determina-tion in the Roman world would require both economic and demographic data, and predictably, both are hard to retrieve from an ancient civiliza-tion. Nonetheless, Roman Egypt is perhaps the earliest society for which quantitative patterns are recoverable—in even rudimentary form—over
4 For trade, see Scheidel, Morris, and Saller (2007, pp. 222–23); for technology, Greene (2000) and (Wilson 2002). On the idea of “efflorescence” generally, see Goldstone (2002, p. 333): “‘efflorescences’ typically involve both Smithian and Schumpeterian growth, in a mutually reinforcing fashion.”
5 In the words of Temin (2013, p. 209), “a strict Malthusian model implies that economic growth results in a growing population rather than an increase in per capita income.”
6 Scheidel (2010, p. 457); also Pamuk and Shatzmiller (2014).
Harper806
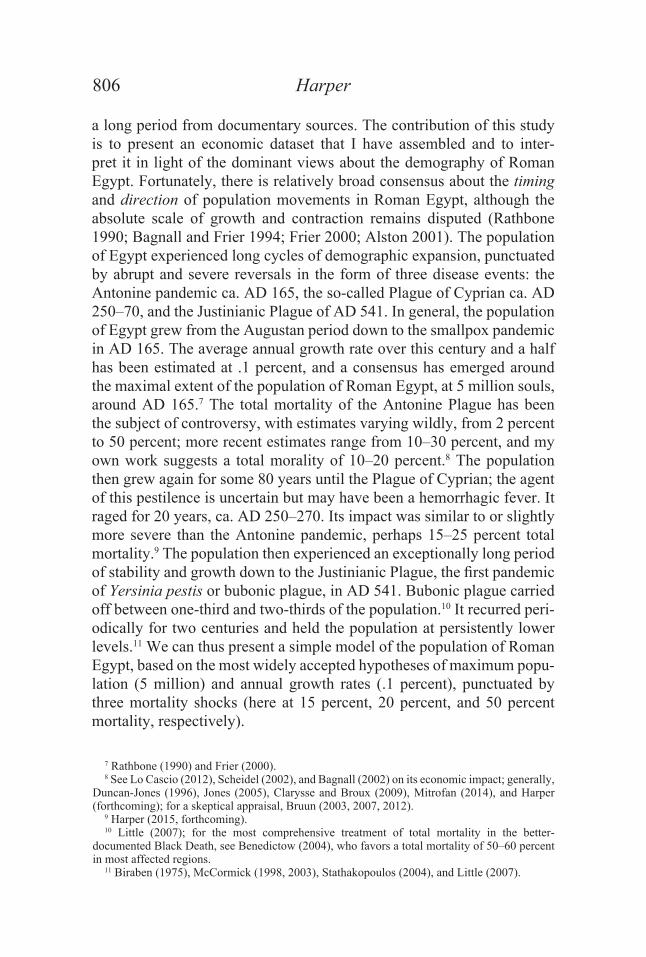
a long period from documentary sources. The contribution of this study is to present an economic dataset that I have assembled and to inter-pret it in light of the dominant views about the demography of Roman Egypt. Fortunately, there is relatively broad consensus about the timing and direction of population movements in Roman Egypt, although the absolute scale of growth and contraction remains disputed (Rathbone 1990; Bagnall and Frier 1994; Frier 2000; Alston 2001). The population of Egypt experienced long cycles of demographic expansion, punctuated by abrupt and severe reversals in the form of three disease events: the Antonine pandemic ca. AD 165, the so-called Plague of Cyprian ca. AD 250–70, and the Justinianic Plague of AD 541. In general, the population of Egypt grew from the Augustan period down to the smallpox pandemic in AD 165. The average annual growth rate over this century and a half has been estimated at .1 percent, and a consensus has emerged around the maximal extent of the population of Roman Egypt, at 5 million souls, around AD 165.7 The total mortality of the Antonine Plague has been the subject of controversy, with estimates varying wildly, from 2 percent to 50 percent; more recent estimates range from 10–30 percent, and my own work suggests a total morality of 10–20 percent.8 The population then grew again for some 80 years until the Plague of Cyprian; the agent of this pestilence is uncertain but may have been a hemorrhagic fever. It raged for 20 years, ca. AD 250–270. Its impact was similar to or slightly more severe than the Antonine pandemic, perhaps 15–25 percent total mortality.9 The population then experienced an exceptionally long period of stability and growth down to the Justinianic Plague, the first pandemic of Yersinia pestis or bubonic plague, in AD 541. Bubonic plague carried off between one-third and two-thirds of the population.10 It recurred peri-odically for two centuries and held the population at persistently lower levels.11 We can thus present a simple model of the population of Roman Egypt, based on the most widely accepted hypotheses of maximum popu-lation (5 million) and annual growth rates (.1 percent), punctuated by three mortality shocks (here at 15 percent, 20 percent, and 50 percent mortality, respectively).
7 Rathbone (1990) and Frier (2000).8 See Lo Cascio (2012), Scheidel (2002), and Bagnall (2002) on its economic impact; generally,
Duncan-Jones (1996), Jones (2005), Clarysse and Broux (2009), Mitrofan (2014), and Harper (forthcoming); for a skeptical appraisal, Bruun (2003, 2007, 2012).
9 Harper (2015, forthcoming).10 Little (2007); for the most comprehensive treatment of total mortality in the better-
documented Black Death, see Benedictow (2004), who favors a total mortality of 50–60 percent in most affected regions.
11 Biraben (1975), McCormick (1998, 2003), Stathakopoulos (2004), and Little (2007).

People Plagues, and Prices in the Roman World 807
The present study is built on a fresh and comprehensive investigation of the papyri from Roman Egypt, which I have used to construct a new dataset of four economic indicators spanning the entire period of Roman control in Egypt from 1 to 641 CE: wheat prices, land prices, wages, and rents.12 These data allow me to trace patterns in the economy of Roman Egypt over six and a half centuries. I begin by describing the sources used and then discuss the trajectory of wheat and factor prices over these centuries. As will be clear, the quality and density of the evidence is better in some centuries than in others, and caution is obviously warranted in light of our limited data and sometimes limited ability to control relevant variables. Nonetheless, significant patterns of change emerge:
• The period down to the Antonine pandemic (to AD 165) was characterized by rising real land prices, rents, and above all wages; real wage growth outpaced the other indices and shows that the economy experienced intensive growth during this phase of demographic expansion.
0
1000000
2000000
3000000
4000000
5000000
6000000
100 200 300 400 500 600
Year
Figure 1POPULATION OF ROMAN EGYPT
Source: Data-file, darmc.harvard.edu, sheet 19.
12 The entire dataset, called herein Data-file, is available online as “Geodatabase of Prices, Wages, and Rents in Roman Egypt, AD 1–700,” under “Data Availability” at the Digital Atlas of Roman and Medieval Civilizations: darmc.harvard.edu. See also Appendix 1, “Note on Accessing the Primary Sources Used.”

Harper808
• The demographic contraction of the Antonine pandemic (AD 165) induced complex changes, most notably a decline in real rents. There were at most modest wage gains, less significant than other studies have suggested; for ordinary workers, the benefits of greater scarcity of labor were probably offset by some economic regression from technological losses and/or reduced market activity.
• The Plague of Cyprian (AD 250–270) was marked by a period of extreme variability in all indices; this phase of instability was followed by a century of well-known monetary crisis. In the fourth century, real wheat prices declined, while real rents again started to rise, tracking population expansion.
• In the decades leading up to the Justinianic Plague (AD 541), wheat prices rose significantly, undermining the consensus that there was a single “late antique” price of wheat. In the same decades, wages and rents seem stagnant or declining. The bubonic plague was correlated with complex effects. Wheat prices fell precipitously and stayed at a low level to the end of the Roman period. Real wages increased, as a factor proportions model would predict. However, land prices and rents also increased, patterns which may reflect the strong influence of non-market forces or the general disequilibria of this period of profound demographic turmoil.
• In general, each of the pandemic events was coincident with profound monetary change (quite possibly linked directly or indi-rectly with the mortality shocks). But my data also show that the pandemics were associated with moments of reorganization in real factor prices too.
• In the Roman world, demography was an important determinant of income levels and economic performance, but hardly the only one. Trade, technology, and other forces (climate, institutions) must also be sought as variables in a pre-industrial economy that was anything but static.
CONTEXT AND SOURCES OF PAPYROLOGICAL DATA
Octavian, soon to take the name of Augustus, annexed the territory of Egypt (30 BCE) with his defeat of Marcus Antonius and Cleopatra at the Battle of Actium. In deposing Cleopatra, Octavian brought to an end nearly three centuries of rule by the Ptolemies, the successors of Alexander the Great who had significantly Hellenized Egypt. The
People Plagues, and Prices in the Roman World 809
acquisition of Egypt came at a moment of geo-political consolidation and regime-building by Rome’s first emperor. The province would be ruled by an equestrian (i.e., not senatorial) official directly responsible to the emperor. From the first century on, Egypt was deeply influenced by the broader currents of Greco-Roman culture (Rathbone 2007). The styles and consumption habits of both elites and non-elites were shaped by Roman influence. Cities flourished, above all the wealthy metropolis Alexandria at the mouth of the Nile. While indigenous and Hellenic institutions remained important, Roman law gradually permeated local life, and the main principles of Roman administration—such as a strong commitment to the neutral enforcement of property rights—prevailed.
Egypt was an important source of grain, textiles, papyrus, and minerals; moreover, it was the hinge between the Roman Empire and trade with the Red Sea and Indian Ocean, a commercial network whose importance has been increasingly appreciated (Casson 1989; Parker 2008; Tomber 2008). By the second century, a strong local aristocracy was increasingly visible, and in later centuries it played a role in broader Mediterranean circles. In AD 212, all free inhabitants of the Roman Empire received Roman citi-zenship, including those in Egypt. The region was afflicted by the turmoil of the mid-third-century crisis and was reorganized and subdivided by the reformist emperor Diocletian (AD 284–305). Its grain taxes were redirected to Constantinople after its elevation to the status of an impe-rial capital by Constantine in AD 325. Egypt was quickly Christianized and became an important center of monasticism and remained an integral part of the eastern Roman (aka early Byzantine) empire, and a major grain exporter. In the early seventh century Egypt was a theater in the Byzantine-Persian conflict, and Constantinople temporarily lost control of the region. In AD 618, the distribution of Egyptian-supplied grain in the imperial capital was cancelled, bringing to an end a long era during which Egypt was the breadbasket of Mediterranean empires. Finally, in AD 641 Alexandria was taken in the Islamic conquests, and the region effectively conquered.13
Transactions in Egypt tended to be market-based and monetized. The Romans left in place the Ptolemaic monetary system, based on the silver Egyptian tetradrachm minted at Alexandria (as was regular practice with eastern cities allowed to mint their own currency). The provincial coin was equated to the Roman denarius, even though its actual silver content was very low (Howgego et al. 2010). It was a token coin that only circu-lated in Egypt and provided a stable currency for the region down to the
13 For overviews, see Bowman (1989), Bagnall (1993), and Riggs (2012).
Harper810
middle of the third century. The period from ca. AD 250 was the begin-ning of empire-wide monetary crisis.14 Diocletian’s sweeping adminis-trative reforms brought an end to the monetary independence of Egypt (in AD 296), and henceforth the region was fully integrated into the currency regime of the wider empire, including the shift to the gold solidus in the middle of the fourth century that re-stabilized the currency system around gold. Towns were important centers of exchange and specialization, with the Nile River itself provided reliable and cheap transport. In short, “The economy of Roman Egypt was highly integrated and fundamentally free market” (Rathbone 2007, p. 712).
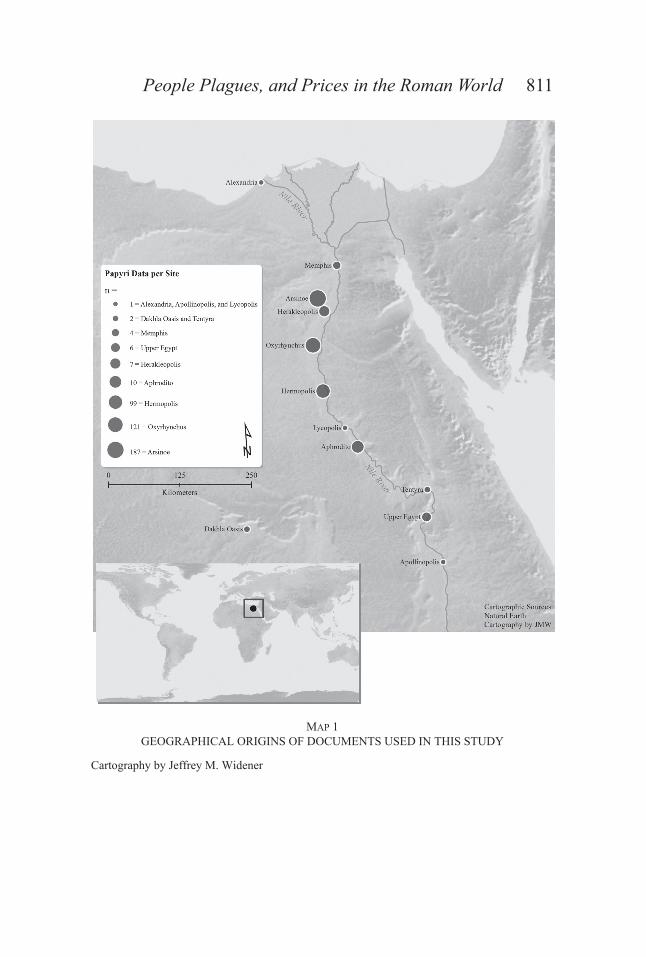
The papyri of Egypt are one of the great sources for the study of ancient society and economy. Their survival to the present is haphazard and uneven, the result of chance and circumstance.15 Most papyri of the Roman period were discovered in the late nineteenth and early twentieth centuries, although their discovery continues down to the present day, especially in archaeological excavations; the decipherment and publi-cation of papyri from collections in Europe and the United States has proceeded almost constantly down to the present. Although occasionally we have bursts of material from a public or private archive that survived to the present, the notable feature of the papyri is their overwhelmingly dispersed nature. A broad range of document types is attested: tax regis-ters, census declarations, contracts of sale, receipts, leases, loans, estate accounts, etc. Most of the wheat and land prices come from contracts of sale or receipts. The rent levels are extracted from contracts of lease. The wages most often come from estate registers used for internal accounting, although there are also receipts noting the execution of payment. Unsurprisingly, the documents used in this study overwhelm-ingly originate in middle Egypt, in the cities and villages along the Nile below the delta and north of upper Egypt, the area which has left us the most papyri from the Roman period. Map 1 presents a weighted represen-tation of the geographic origins of the data. It is notable that 92 percent (407/441) of the data come from three nomes (districts): the Arsinoite, the Oxyrhynchite, and the Hermopolite.
14 The monetary history of this period is complex, although diligent work in the last generation has clarified much. The silver content of the coinage crashed from ca. AD 250; the old sesterces and denarii were melted down and ceased to be minted, so that the antoninianus (worth 2 denarii) was the only silver coin in circulation; its silver content declined from ca. 1.5 g in AD 250 to virtually nil by AD 270; a major effort at reforming the currency by Aurelian in AD 274 failed and prices leapt ten-fold when the coinage lost all fiduciary value. The main trigger of this chaos was some combination of lack of access to the silver mines, Gresham’s Law/hoarding of good coins, civil war, and the mortality shock. See Corbier (2008), Harper (2015), and Haklai-Rotenberg (2011).
15 See Bagnall (2003) for an accessible exploration.
People Plagues, and Prices in the Roman World 811
Map 1GEOGRAPHICAL ORIGINS OF DOCUMENTS USED IN THIS STUDY
Cartography by Jeffrey M. Widener

Harper812
I am not the first to use these sources to study prices, rents, and wages. The datasets built here are indebted to the pioneering and fundamental work of many scholars going back to the early twentieth century.16 Yet this study makes several improvements in the scope and reliability of the data. First, the datasets are intended to be reasonably comprehensive and up-to-date, incorporating numerous papyri published since the earlier studies. The late antique data (ca. AD 250–650) have been in particular need of updating.17 Second, these datasets adopt a carefully critical attitude to the primary sources. In some cases, the need for a cautious treatment is acute. In particular, Hans-Joachim Drexhage’s exhaustive compilation, while still useful, leaves much to be desired in many of its interpreta-tions, particularly in the case of rents (Drexhage 1991); noted by, e.g., Roger S. Bagnall (2002). Whereas previous analyses have relied more or less uncritically on his data, the present study is based on a thorough re-evaluation of the primary evidence, which yields significantly different conclusions as discussed below. Difficult and contestable choices about the data of course remain, but the aim here is to be cautious, consistent, and transparent about the filters used to include or exclude data. Third, this study crosses the boundary between the “high” (to ca. AD 250) and “late” (to ca. AD 650) Roman Empire. While there are challenges in such an analysis, the analytical divide of the third century is artificial, and the benefits of working across the high and late empire and being able to compare them are manifest. Finally, the analysis of the late antique price data is based on a corrected understanding of the gold currency, in partic-ular the notoriously obscure “minus-carats” system of accounting. Jairus Banaji offered the right solution: references to amounts “minus so-and-so many carats” appeared because different locales had different weight standards, and gold circulated at its intrinsic value, based on weight.18 Earlier analyses systemically overvalued the purchasing power of gold in late antiquity.
The focus in this article is the generation of a time series of wheat prices and factor prices for Egypt from AD 1 to the Muslim conquest, AD 641. Table 1 offers a sense of the chronological distribution of the data by category. The uneven pattern across time is familiar to historians of the period. Generally, information on rents is most available and land prices
16 Johnson and West (1949), Duncan-Jones (1982, 1990), Drexhage (1991), Bagnall (1985, 1989), Bagnall and Hope (1997), Rathbone (1996, 1997), Carrié (1997), Scheidel (2002, 2012b), and Rathbone and von Reden (2015).
17 Johnson and West (1949), Morrison (1989), and Ostrogorsky (1932); Morelli (1996) is valuable and the author has in preparation a much-needed study of late antique prices.
18 Banaji (1998); see also Maresch (1994); for a different perspective, Zuckerman (2004).

People Plagues, and Prices in the Roman World 813
the least. The second century, considered the “golden age” of the Roman Empire, is the most abundantly documented. There is a sharp drop-off in the immediate aftermath of the Antonine Plague which has been obscured by the arbitrary boundaries of centuries (Duncan-Jones 1996). The fifth century, despite being a time when there were no major crises in Egypt, is a period notoriously poor in papyrological documentation, for reasons that are still not well understood. But after this gap in the papyri, there is reasonably thick documentation from around the accession of Anastasius (AD 491) to the Muslim conquest (AD 641).
For the sake of convenience, I offer here the basic metrological equiv-alences used throughout this study. Roman weights and measures are by now rather well understood. There remain small disagreements about the precise weight of the Roman pound, but the other equivalences are universally accepted.
WHEAT PRICES
Wheat was the most important product and principal commodity of the Roman economy. Wheat prices and their movement are also of interest in their own right, as indices of supply and demand as well as monetary change. We know that wheat prices could vary, by region and even by season, within short time frames; poor inundations of the Nile or other short-term crises could produce sharp fluctuations.19 What is of interest, however, is long-range movement in average prices. The goal of this section is twofold. First is to provide a series of nominal prices, which
Table 1NUMBER OF DATA USED IN THIS STUDY, BY CATEGORY AND CENTURY
Period Wheat Prices Land Prices Wages Rents
1–100 5 7 7 25
101–200 13 28 42 65
201–300 24 15 16 44
301–400 27 7 12 19
401–500 5 3 2 6
501–600 30 2 13 21
601–700 7 1 9 6Source: Data-file, darmc.harvard.edu.
19 See e.g., P. Oxy. 51.3628-3636, a series of state observations from the early fifth century, in which prices fluctuate within the same year and across neighboring regions of Egypt.

Harper814
is complicated because the unit of account in Egypt changes over the centuries. There are three periods of monetary history in Roman Egypt. The first period extends from AD 1–296 and corresponds to the era of the Alexandrian tetradrachm; the second reaches from ca. AD 296–370, when the denarius was used in Egypt as the main unit of account; the third stretches ca. AD 350–650, corresponding to the period of dominance of the gold solidus. Second, having established the patterns in nominal prices, I translate these values into a real price of wheat, measured in terms of grams of silver per hectoliter of wheat.
Wheat is the best-studied commodity in Roman economic history, and I am fortunate to be able to build on the solid ground of existing work, especially for the period down to ca. AD 275.20 Dominic Rathbone has very recently produced an up-to-date dataset which, for the first three centuries of the common era, can scarcely be improved upon. Although every price has been individually rechecked, the data are the same as those offered in his study. My analysis departs from his in how we might interpret the time period AD 250–275 (Rathbone 1996, 1997). Much less information exists for late antiquity. Bagnall’s work remains indispens-able for the fourth century, which experienced inflation in the nominal
Table 2METROLOGICAL EQUIVALENCES
Article Ancient Measure Modern Equivalent
Grain Artaba Dry volume measure equal to 38.8 liters or .388 hl
Land Aroura Measure of area equal to .2756 hectares
Metal Pound (Roman) Measure of weight equal to ~325 grams
Silver currency Obols
7 obols = 1 drachma
4 drachmai = 1 tetradrachm
1 tetradrachm = 1 denarius
The Roman denarius was nominally worth ~3.36 g of silver, although the actual content varied and declined with time. The nominal equivalences represented here were maintained until AD 296, when monetary unity was formalized and all silver denominations henceforth were in denarii.
Gold currency Carats
24 carats = 1 solidus
From Constantine onward, the solidus weighed 1/72 of a Roman pound = ~4.51g of gold.
Source: Data-file, darmc.harvard.edu.
20 Rathbone and von Reden (2015), Duncan-Jones (1990, pp. 143–55), and Erdkamp (2005), focused on the Roman west, offers useful comparisons.
People Plagues, and Prices in the Roman World 815
unit of account, the denarius (Bagnall 1985; Camilli and Sorda 1993). From the middle of the fourth century, the gold solidus, minted at 72 to the pound, gradually prevailed as both a medium of circulation and a unit of account, so that from ~AD 350 the price of wheat is given in terms of gold (Carrié 2007). Trends in wheat prices from ~AD 350–650 have not been comprehensively updated since the mid-twentieth century (Johnson and West 1949; Jones 1964); the canonical figure of 10–12 artabai per solidus (e.g., Jones 1964, vol. 1, pp. 445–46, often cited) obscures the variety and change we find in the data following.21
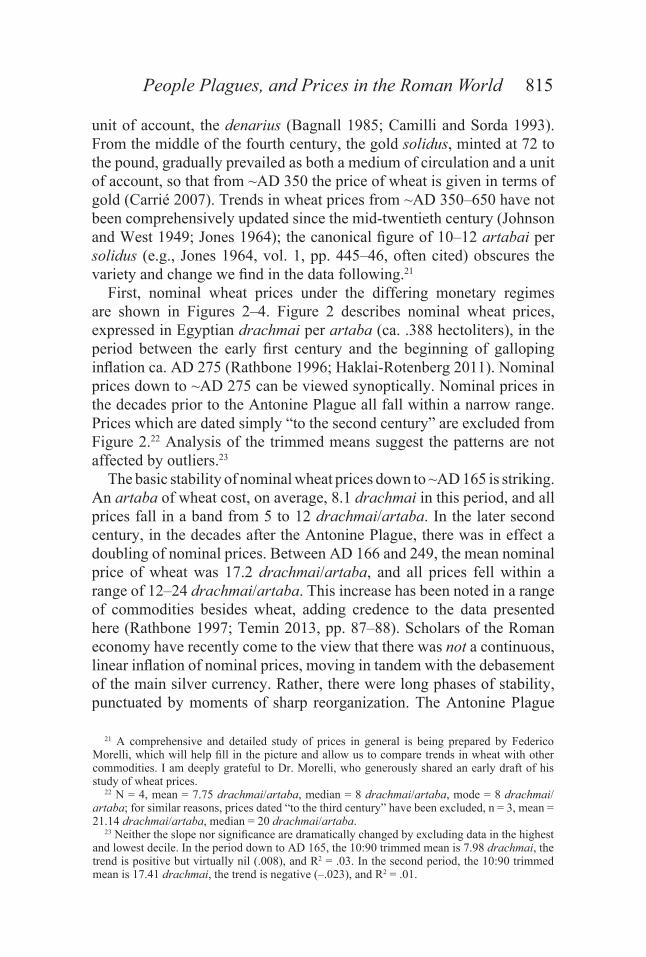
First, nominal wheat prices under the differing monetary regimes are shown in Figures 2–4. Figure 2 describes nominal wheat prices, expressed in Egyptian drachmai per artaba (ca. .388 hectoliters), in the period between the early first century and the beginning of galloping inflation ca. AD 275 (Rathbone 1996; Haklai-Rotenberg 2011). Nominal prices down to ~AD 275 can be viewed synoptically. Nominal prices in the decades prior to the Antonine Plague all fall within a narrow range. Prices which are dated simply “to the second century” are excluded from Figure 2.22 Analysis of the trimmed means suggest the patterns are not affected by outliers.23
The basic stability of nominal wheat prices down to ~AD 165 is striking. An artaba of wheat cost, on average, 8.1 drachmai in this period, and all prices fall in a band from 5 to 12 drachmai/artaba. In the later second century, in the decades after the Antonine Plague, there was in effect a doubling of nominal prices. Between AD 166 and 249, the mean nominal price of wheat was 17.2 drachmai/artaba, and all prices fell within a range of 12–24 drachmai/artaba. This increase has been noted in a range of commodities besides wheat, adding credence to the data presented here (Rathbone 1997; Temin 2013, pp. 87–88). Scholars of the Roman economy have recently come to the view that there was not a continuous, linear inflation of nominal prices, moving in tandem with the debasement of the main silver currency. Rather, there were long phases of stability, punctuated by moments of sharp reorganization. The Antonine Plague
21 A comprehensive and detailed study of prices in general is being prepared by Federico Morelli, which will help fill in the picture and allow us to compare trends in wheat with other commodities. I am deeply grateful to Dr. Morelli, who generously shared an early draft of his study of wheat prices.
22 N = 4, mean = 7.75 drachmai/artaba, median = 8 drachmai/artaba, mode = 8 drachmai/artaba; for similar reasons, prices dated “to the third century” have been excluded, n = 3, mean = 21.14 drachmai/artaba, median = 20 drachmai/artaba.
23 Neither the slope nor significance are dramatically changed by excluding data in the highest and lowest decile. In the period down to AD 165, the 10:90 trimmed mean is 7.98 drachmai, the trend is positive but virtually nil (.008), and R2 = .03. In the second period, the 10:90 trimmed mean is 17.41 drachmai, the trend is negative (–.023), and R2 = .01.

Harper816
certainly stands as a plausible causal factor in the escalation of prices in the second half of the second century.24
Rathbone has argued that nominal price levels remained at their post-Antonine equilibrium down to the currency reform of Aurelian. As shown in Figure 3, there is no doubt that ~AD 274 prices were marked by a ten-fold increase, much greater than the increase after the AD 160s. But the period ~AD 250–275 stands out as a phase of distinct instability, economically and politically (Harper 2015; Witschel 1999; Liebeschuetz 2007). Rathbone attributes part of this price instability to the poor inun-dation of the Nile in the AD 240s, but, as discussed later, the instability is not limited to wheat prices, and something more than a series of poor harvests in the middle of the 240s should be considered in light of the sharp increase in price variability across a range of goods and services in the entire period AD 250–275. Indeed, around AD 251, the debasement of the silver currency rapidly accelerated (Corbier 2005, 2008) and perhaps even more importantly, the Plague of Cyprian arrived. Documented in a wide range of sources across the entire empire, there is a strong case to be made that it was a mortality event at least on par with the Antonine Plague (Harper 2015). While there are few price observations in the decade or two after the outbreak of the Antonine Plague, in the case of the Plague of Cyprian the fortuitous survival of a handful of estate-based
R2 = 0.06412
0.00
5.00
10.00
15.00
20.00
25.00
- 50 100 150 200 250 300 Year
Antonine Plague
Plague of Cyprian
R2=.00009
Figure 2NOMINAL WHEAT PRICES (DRACHMAI/ARTABA) TO 275
Source: Data-file, darmc.harvard.edu, sheet 2.
24 Lo Cascio (1993), Rathbone (1996, 1997), and Scheidel (2002).
People Plagues, and Prices in the Roman World 817
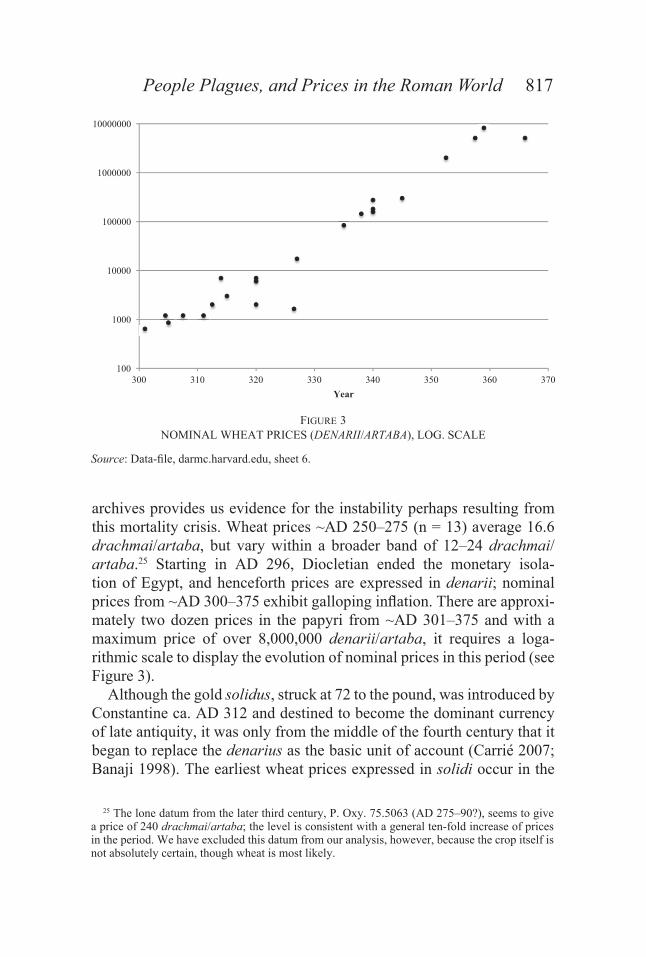
archives provides us evidence for the instability perhaps resulting from this mortality crisis. Wheat prices ~AD 250–275 (n = 13) average 16.6 drachmai/artaba, but vary within a broader band of 12–24 drachmai/artaba.25 Starting in AD 296, Diocletian ended the monetary isola-tion of Egypt, and henceforth prices are expressed in denarii; nominal prices from ~AD 300–375 exhibit galloping inflation. There are approxi-mately two dozen prices in the papyri from ~AD 301–375 and with a maximum price of over 8,000,000 denarii/artaba, it requires a loga-rithmic scale to display the evolution of nominal prices in this period (see Figure 3).
Although the gold solidus, struck at 72 to the pound, was introduced by Constantine ca. AD 312 and destined to become the dominant currency of late antiquity, it was only from the middle of the fourth century that it began to replace the denarius as the basic unit of account (Carrié 2007; Banaji 1998). The earliest wheat prices expressed in solidi occur in the
100
1000
10000
100000
1000000
10000000
300 310 320 330 340 350 360 370Year
Figure 3NOMINAL WHEAT PRICES (DENARII/ARTABA), LOG. SCALE
Source: Data-file, darmc.harvard.edu, sheet 6.
25 The lone datum from the later third century, P. Oxy. 75.5063 (AD 275–90?), seems to give a price of 240 drachmai/artaba; the level is consistent with a general ten-fold increase of prices in the period. We have excluded this datum from our analysis, however, because the crop itself is not absolutely certain, though wheat is most likely.

Harper818
later fourth century. There are a small number of prices from the fifth century—indeed, there are relatively few papyri from this century alto-gether—before a more abundantly documented period in the sixth and seventh centuries. These include a number of state purchases, which of course may not have been at precisely the market rate, but which nonethe-less do not affect the pattern. In Figure 4, prices are represented in terms of carats (24 carats = 1 solidus; 1 carat = .188 g of gold) per hectoliter of grain (1 artaba = .388 hl). Figure 4 does include a number of prices dated only “to the sixth” or “to the seventh” century, plotting them at the midpoint of each century (marked with “x” in the graph).
The distribution immediately dispels the notion, which should never have taken root, that there was a “late antique” price for grain (e.g., a single figure representing the price of grain ca. AD 300–650). Moreover, when we look more carefully at dated prices, we can discern signifi-cant chronological patterns. For these purposes papyri dated simply to the “sixth century” are relatively unhelpful (n = 8, mean = 10.3 artabai/solidus or 6 carats/hl), because they do not indicate whether the attested price occurred before or after the eruption of the Justinianic Plague (AD 541). If we exclude these prices, the remaining data fall into four chrono-logical bands.
0.00
2.00
4.00
6.00
8.00
10.00
12.00
14.00
16.00
350 400 450 500 550 600 650Year
Figure 4NOMINAL WHEAT PRICES IN GOLD (CARATS/HL)
Source: Data-file, darmc.harvard.edu, sheet 4.

People Plagues, and Prices in the Roman World 819
Wheat prices rose in the decades preceding the Justinianic Plague and declined afterward.26 What caused the decrease in wheat prices is another matter, though again the demographic event itself plausibly played a role, as discussed later. It is sometimes thought that the series of emperors in the early sixth century attempted to hold the value of gold low (Hahn 2013, pp. 13–18; Zuckerman 2004, pp. 57–114); perhaps they were successful, until the chaos of the pandemic, but the topic merits further investigation.
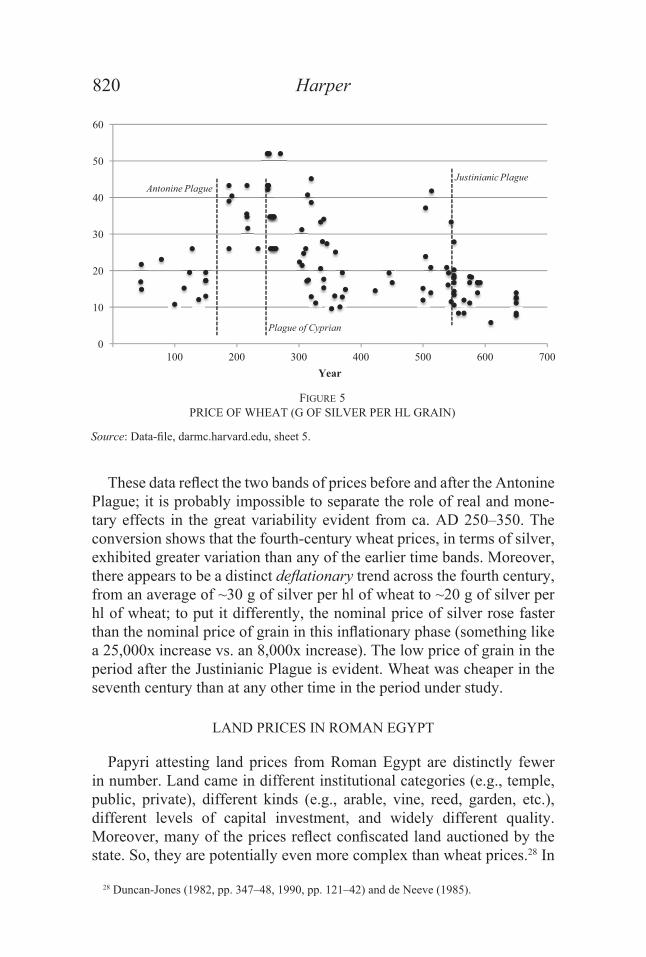
Given the changes in monetary units over the centuries, it is difficult to make comparisons of nominal wheat prices over the whole period. To attenuate that problem, I generate a measure of the real price of wheat in terms of silver. Because the Alexandrian tetradrachm was worth one Roman denarius, and the denarius in turn was theoretically minted at the target weight of 3.36 g from the reforms of Nero (AD 64) to the later third century, we can convert prices from the earlier period into grams of silver per hectoliter by equating 1 drachma to .84 g of silver and 1 artaba to .388 hl.27 For the fourth century, we have to know the value of silver in terms of the unit of account, the denarius. There are over two dozen such prices known from the papyri, which at least allow us to attempt to peg the value of wheat in terms of silver. The gold:silver value ratio in late antiquity, from ~AD 350 on, is accepted to be 1:14.4: CT 13.2.1 (AD 397); (Lo Cascio 1993, p. 172). Each carat, then, was worth 2.7 g silver (1 carat = 1/24 of 4.51 g gold x 14.4 = 2.7 g silver). The results are shown in Figure 5.
Table 3NOMINAL WHEAT PRICES IN GOLD
n Carats gold (= 1/24 solidus) / hl wheat
350–499 4 6.07500–541 10 8.18542–599 13 5.75600–650 7 3.81Source: Data-file, darmc.harvard.edu.
26 This trend is not affected if we trim the top and bottom decile to reduce the risk of outlier effects. Excluding prices which can only be dated to the “sixth century,” the 10:90 trimmed means are 6.16 carats/hl before the plague and 5.19 carats/hl post-plague, even though all the high outliers are from 550 or before and all the low outliers are from after AD 550.
27 I should caution that the Alexandrian coinage was always to a large extent fiduciary, and that the imperial coinage from the late second century until the crisis of the third century (ca. AD 250–75) was increasingly fiduciary; the higher band of prices in terms of silver from the late second and third century may reflect this. See, in general, Haklai-Rotenberg (2011).
Harper820
These data reflect the two bands of prices before and after the Antonine Plague; it is probably impossible to separate the role of real and mone-tary effects in the great variability evident from ca. AD 250–350. The conversion shows that the fourth-century wheat prices, in terms of silver, exhibited greater variation than any of the earlier time bands. Moreover, there appears to be a distinct deflationary trend across the fourth century, from an average of ~30 g of silver per hl of wheat to ~20 g of silver per hl of wheat; to put it differently, the nominal price of silver rose faster than the nominal price of grain in this inflationary phase (something like a 25,000x increase vs. an 8,000x increase). The low price of grain in the period after the Justinianic Plague is evident. Wheat was cheaper in the seventh century than at any other time in the period under study.
LAND PRICES IN ROMAN EGYPT
Papyri attesting land prices from Roman Egypt are distinctly fewer in number. Land came in different institutional categories (e.g., temple, public, private), different kinds (e.g., arable, vine, reed, garden, etc.), different levels of capital investment, and widely different quality. Moreover, many of the prices reflect confiscated land auctioned by the state. So, they are potentially even more complex than wheat prices.28 In
0
10
20
30
40
50
60
100 200 300 400 500 600 700Year
Antonine Plague
Plague of Cyprian
Justinianic Plague
Figure 5PRICE OF WHEAT (G OF SILVER PER HL GRAIN)
Source: Data-file, darmc.harvard.edu, sheet 5.
28 Duncan-Jones (1982, pp. 347–48, 1990, pp. 121–42) and de Neeve (1985).
People Plagues, and Prices in the Roman World 821
the analysis following, any land that was manifestly not arable land—so all vineyards, reed plots, etc.—has been excluded. This leaves only 64 data points over six centuries, about ten a century; however, 29 of the 64 prices are from the second century, so the data from the other centuries are actually much thinner.
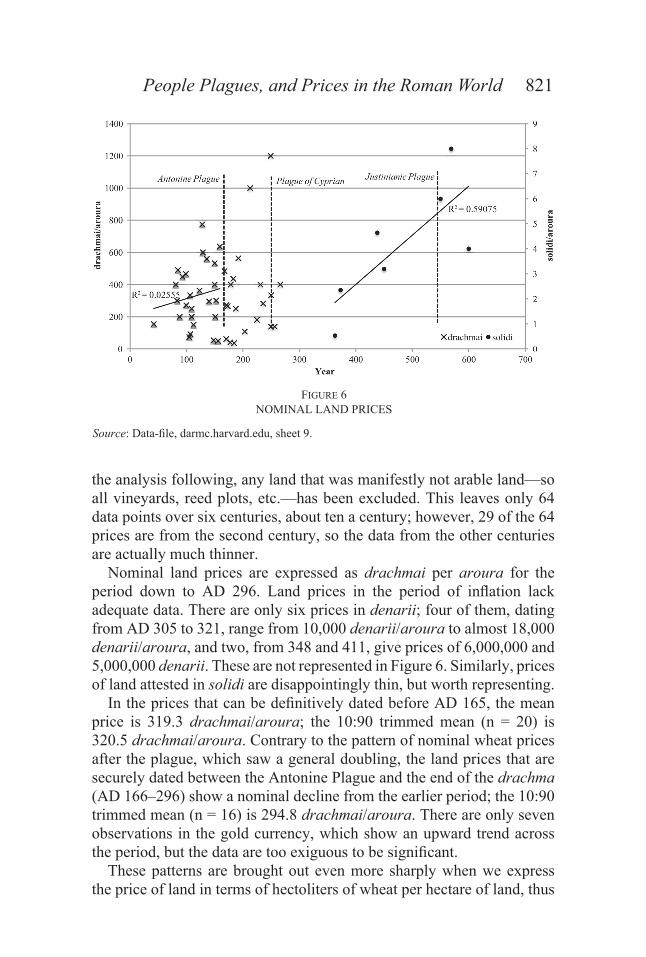
Nominal land prices are expressed as drachmai per aroura for the period down to AD 296. Land prices in the period of inflation lack adequate data. There are only six prices in denarii; four of them, dating from AD 305 to 321, range from 10,000 denarii/aroura to almost 18,000 denarii/aroura, and two, from 348 and 411, give prices of 6,000,000 and 5,000,000 denarii. These are not represented in Figure 6. Similarly, prices of land attested in solidi are disappointingly thin, but worth representing.
In the prices that can be definitively dated before AD 165, the mean price is 319.3 drachmai/aroura; the 10:90 trimmed mean (n = 20) is 320.5 drachmai/aroura. Contrary to the pattern of nominal wheat prices after the plague, which saw a general doubling, the land prices that are securely dated between the Antonine Plague and the end of the drachma (AD 166–296) show a nominal decline from the earlier period; the 10:90 trimmed mean (n = 16) is 294.8 drachmai/aroura. There are only seven observations in the gold currency, which show an upward trend across the period, but the data are too exiguous to be significant.
These patterns are brought out even more sharply when we express the price of land in terms of hectoliters of wheat per hectare of land, thus
Figure 6NOMINAL LAND PRICES
Source: Data-file, darmc.harvard.edu, sheet 9.
Harper822
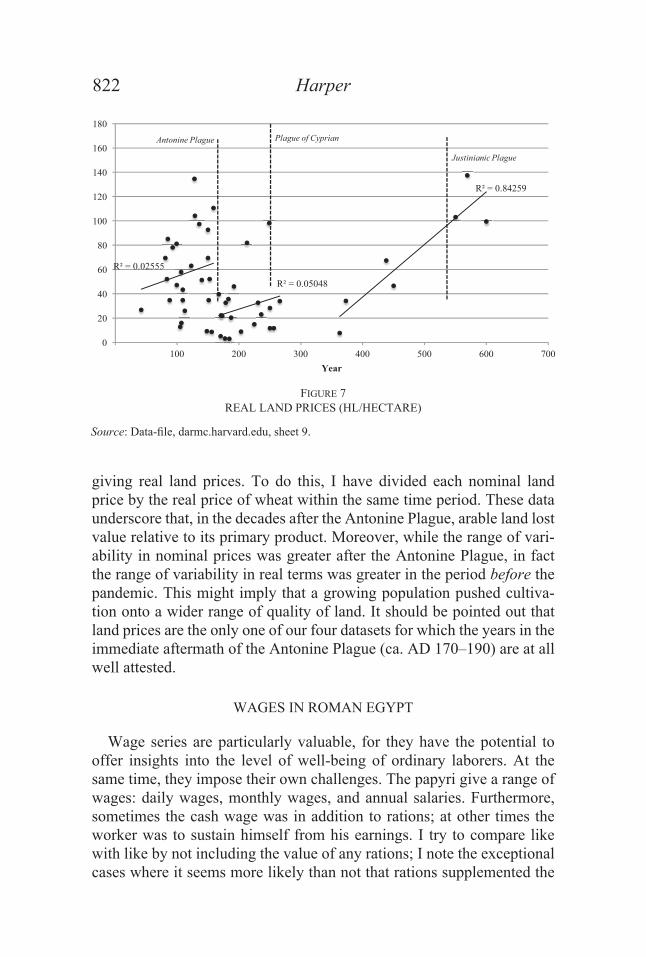
giving real land prices. To do this, I have divided each nominal land price by the real price of wheat within the same time period. These data underscore that, in the decades after the Antonine Plague, arable land lost value relative to its primary product. Moreover, while the range of vari-ability in nominal prices was greater after the Antonine Plague, in fact the range of variability in real terms was greater in the period before the pandemic. This might imply that a growing population pushed cultiva-tion onto a wider range of quality of land. It should be pointed out that land prices are the only one of our four datasets for which the years in the immediate aftermath of the Antonine Plague (ca. AD 170–190) are at all well attested.
WAGES IN ROMAN EGYPT
Wage series are particularly valuable, for they have the potential to offer insights into the level of well-being of ordinary laborers. At the same time, they impose their own challenges. The papyri give a range of wages: daily wages, monthly wages, and annual salaries. Furthermore, sometimes the cash wage was in addition to rations; at other times the worker was to sustain himself from his earnings. I try to compare like with like by not including the value of any rations; I note the exceptional cases where it seems more likely than not that rations supplemented the
R = 0.02555
R = 0.05048
R = 0.84259
0
20
40
60
80
100
120
140
160
180
100 200 300 400 500 600 700Year
Antonine Plague Plague of Cyprian
Justinianic Plague
Figure 7REAL LAND PRICES (HL/HECTARE)
Source: Data-file, darmc.harvard.edu, sheet 9.
People Plagues, and Prices in the Roman World 823
cash wage. Admittedly this is a potential source of error that we cannot fully control. Furthermore, sometimes the employer assumed respon-sibility for the personal tax liability of the laborer, other times not.29 Usually we are not explicitly informed. The present analysis of wages in Roman Egypt attempts to examine only unskilled labor. Especially in the documents of the first three centuries, there is a level of consistency and clarity in the sources that survive: I am comparing unskilled labor of adult males remunerated on a daily basis for activities like digging, hauling, fertilizing, winnowing, harvesting, etc. Of particular value is a large cluster of wage payments recorded in estate accounts from the later first to the later third centuries. In the sheer number of individual observations, these estate accounts would dominate the dataset, but since we are interested in movements across time and space, I have taken one average of unskilled labor from each time and place and counted it as one datum.30 Precisely because of their richness and specificity, we can consider the estate accounts a privileged dataset of their own.
I begin with real daily wages paid for unskilled labor across the entire period in terms of wheat.
Real wages rose across the decades leading up to the Antonine Plague, a period of population growth.31 This evidence implies that unskilled workers were not experiencing declining living standards in the decades leading up to the great pandemic: this ranks among the most specific evidence yet produced from the Roman world against the claim that levels of well-being were sinking in the period leading up to the smallpox outbreak. Moreover, the claim that real wages rose in the decades after the Antonine Plague is highly dependent on (1) the weight of a single outlier from AD 255 and (2) wages actually recorded in the midst of or after the Plague of Cyprian. The evidence of real daily wages cannot conclusively determine whether incomes increased or decreased after the Antonine Plague. Daily wages are dramatically more difficult to come by in late antiquity; there are only eight attestations in the papyri, scattered over three centuries. There are three references in the literary sources,
29 See Rathbone (1991, p. 121), on this issue.30 In this we follow Rathbone and von Reden (2015), and depart from Scheidel (2002), who
reports attestations within a single document as discrete data, so that his trends are dominated by the huge number of workers paid in a handful of estate documents, especially in the third century. My method is similar in that respect to Clark (2001, p. 479–81), who also averages by place and year. In contrast to Clark’s English data, the Egyptian data do not show greater variability around the harvest, and no effort to exclude hay and harvest work has been made here.
31 This remains true if we take the 10:90 trimmed mean, even though the lowest observed wages are all early (before AD 110) and the highest observed wages are all late (AD 131/2, 150, and 150).

Harper824
that we may use for comparison, in addition to Diocletian’s Price Edict.32 It is impossible to make much of these late-period data. Some of these wages are implausibly high and probably reflect either error introduced by our inability to be precise about the level of inflation or wages paid for what was actually skilled labor.
It is worth isolating and testing the data drawn from estate accounts as an independent set. The estate accounts are internal ledgers used by farm managers overseeing the economic operations of medium-to-large scale agricultural enterprises; daily wage observations survive from seven estates; five of them are from the Arsinoite nome, one from the Hermopolite nome, and one from the Memphite nome (See Map 1).33
Figure 8REAL DAILY WAGE (LITERS WHEAT)
Source: Data-file, darmc.harvard.edu, sheet 12.
32 Gregory of Nyssa, Epistulae, 25; Leontius, Vita Joannis Eleemosynarii episcopi Alexandrini, 38; Life of Abba Daniel of Scetis, see Vivian (2008); for a useful analysis of the wage levels implied by the Price Edict, see Allen (2007).
33 Bagnall (1974) and Rathbone (1991). Hickey (2012), for a later estate, but with many parallels.

People Plagues, and Prices in the Roman World 825
In general there is a tendency for these estates—as we can reconstruct them—to grow in scale across the late first to mid-third century. The estates of the second century are those of elites from the nearby towns, who owned property in an outlying village; by the third century, we have records from larger landowners residing in Alexandria who might have properties scattered across several villages. The Appianus estate of the mid-third century has left behind sufficient documentation that its managerial structure has been reconstructed in detail. It was a centrally-managed, market-oriented enterprise (Rathbone 1991). In all, Rathbone estimates that the Alexandrian owner may have held over 4,400 hect-ares in the Arsinoite nome. The account books record payments made to agricultural workers as costs to the estate, and thus they provide us with a relatively consistent format. In another case, there are actually detailed wage data from a single property across several generations from the late first to late second century, in the so-called Patron archive from Tebtynis.34 Three clusters of precisely dated wage payments, all for menial tasks like breaking dirt, hauling manure, sowing, mowing, sheep shearing, etc., are preserved from the Patron archive, from AD 109/10 (n = 7), the AD 150s (n = 96), and the AD 160s (n = 5). The mean daily nominal wage paid by the estate in 109/110 was 3.8 obols/day; in the 150s, 6.02 obols/day; in the 160s, 10.77 obols/day. Wages from the third-century are, on average, higher in nominal terms. These include a series of wages preserved in BGU 1.14, a papyrus of AD 255 from a property in Upper Egypt. These have seemed problematic because they are so high, with rates of up to 9 drachmai per day attested for unskilled labor. Bagnall protested Scheidel’s use of these data, suggesting it was unclear that these are daily wages. But that is manifestly the sense of the account, which totals expenses for Mesore 1–24 of the year AD 255; column 2, lines 18–19, for instance, clearly describes the payment for a team of men who worked on river irrigation for a total of 303 man-days of labor at 6 drachmai per day; it even gives the specific number of man-days for each day of the month on which labor was performed (Bagnall 2002). High as these numbers are, there seems no alternative to the explanation of daily wages, so they are plotted later. Figure 9 represents the estate-based aver-aged daily wages, with the name of the landowner where known.
Beyond the daily wage data, there is also evidence for monthly and annual wages. In assembling the dataset of monthly wage rates, I have attempted to exclude any skilled jobs such as estate management or roles
34 Formerly but erroneously called the “Laches archive”: Bagnall (1974) and Clarysse and Gallazzi (1993).

Harper826
requiring literacy; the kinds of work that remain are perhaps slightly above the daily wage jobs. These data (represented in Figure 10) again testify to a rise in nominal wages after the Antonine Plague but not a significant rise in real wages. The most important evidence from the mid-third century comes from the Appianus estate. In using this evidence, I only include the monthly wage levels for the “higher paid” workers called the metrematiaioi (contract workers), excluding the oiketai (tied workers or slaves). These latter were quite possibly slaves and were barely paid more than subsistence rations.35 Even though the metrema-tiaioi have high turnover rates, their compensation was low (Rathbone 1991, p. 93). But, as Rathbone notes, it is likely that the estate owner paid their personal taxes on their behalf, both deepening their dependence
Didymos Patron 1Patron 2
Patron 3
Gemellus
Titanianus AppianusHerakleides
Memphite
-5
5
15
25
35
45
55
50 100 150 200 250 300
Antonine Plague
Plague of Cyprian
Figure 9NOMINAL DAILY WAGES ON ESTATES (OBOLS/DAY)
Source: Data-file, darmc.harvard.edu, sheet 11.
35 Against seeing the oiketai as free, see Harper (2011, pp. 513–18); for the opposite view, Rathbone (1991, pp. 106–15). The issue is murky for the oiketai in the Heroninos archive, but the outcome of this quandry does not much affect the analysis here. It is worth noting that the Heroninos archive provides some closely dated and relatively controlled wages over the period AD 247–262, which saw the devastation of the Plague of Cyprian. In AD 247–249, most of the metrematiaioi in the Arsinoite village of Euhemeria were paid 8 drachmai per month (Rathbone 1991, 120ff.). In the mid-250s, the metrematiaioi in Theadelphia were still paid that rate as a base rate (P. Flor. 3.321). By AD 260, however, the standard amount of cash payment had risen from 8 drachmai to 20 drachmai per month (P. Prag. Varcl. 2.6.). In AD 262, it was rising still (now at 20 drachmai, 1.5 art, 4 dr month clothing, 4 kot veg oil: P. Fuad. Univ. 25 and PSI 9.1050). Whether the cause of these rising prices was demographic or monetary or both, they seem to provide a snapshot of the rising price of labor in the 250s and early 260s.

People Plagues, and Prices in the Roman World 827
and increasing their de facto rate of remuneration in a way that is not included in our calculation. They were also probably housed in the estate barracks (Rathbone 1991, pp. 140–41). Thus, the daily wage data are probably somewhat cleaner than the monthly data, though these latter should not be ignored; if taxes and lodging were added in, the actual value of total remuneration received by the workers would probably be higher. Finally, a number of annual salaries for unskilled or low-skilled labor also survive in the papyri, especially from the later centuries. By annualizing the earnings for daily and monthly wages and converting them to wheat, I have a consistent measure of real annual earnings across all centuries. Here, daily wages are transformed into annual levels by multiplying them by 300 days, a not unreasonable estimate of the number of days that might be worked in a year.36 Monthly wages are multiplied by 12. Figure 10 excludes the Memphite estate and the handful of early fourth-century prices that seem implausible and depend too greatly on understanding the exact moment in the progress of inflation to turn them
R = 0.22703
0.00
5.00
10.00
15.00
20.00
25.00
100 200 300 400 500 600 700
Daily
Monthly
Yearly
Antonine Plague
Plague of Cyprian
Justinianic Plague
Figure 10REAL WAGE, ANNUAL BASIS (HL/YEAR)
Source: Data-file, darmc.harvard.edu, sheet 21.
36 Clark and Werf (1998) for discussion concerning the early modern period.

Harper828
into real wages.37 Finally, to reduce the effect of outliers, I have taken the 10:90 trimmed mean for each of three chronological periods (AD 1–200; 200–400; 400–650).
These data, in combination with the demographic model in Figure 1, suggest that, for the first three centuries of the Roman Empire, popula-tion and real wages moved in the same direction; in the last century and a half, the inverse relationship held. Laborers earned more in the decades after the Justinianic Plague than in the decades before. The many papyri dated only “to the sixth century,” often on paleographical grounds, would reward re-examination, for if it could be determined whether they belong early or late in the century, they could add robustness to our under-standing of the mortality crisis of the sixth century. Certainly, there is other evidence for efforts by laborers to benefit from the pandemic. Most notably there is an imperial constitution issued by Justinian in AD 544 that attempted to restrain prices and wages by government command: “It has come to our knowledge that even after the correction meted out according to the Lord God’s love of humanity [sc., the plague], men engaged in dealing and scheming and those who practice different crafts and those who work the land, and even sailors, who ought to have been made better, have turned to greed, and seek double or triple prices and wages against ancient custom” (Justinian, Novella 122, AD 544). Finally, the raw trend for real wages across all six centuries is downward; the mid-second century was a peak that was never reached again.
RENTS IN ROMAN EGYPT
Rents are an especially valuable economic index because they reflect the productivity of the land and its market access. They are also rela-tively abundant: there are nearly 200 rent rates recovered for our collec-tion, which excludes all share-cropping arrangements. Extracting rates of rent from the papyri, however, is often more complex than it might be thought. By its very nature, what survives is evidence of contractual tenancy agreements. “Extremes of permanence and transience” tend not to leave such documentary traces (Hickey 2012, p. 20). Thus, the record itself reflects probably only a sub-sample of all farm tenancy, whose contours we cannot fully discern. Relations based on custom may have been both unresponsive to change and unlikely to receive documentation.
37 N = 4: P. Sakaon 58; P. Oxy. 38.2859; PSI 9.1037; P. Oxy. 14.1626. Those papyri assigned only “to the sixth century” have been converted with an average of all sixth century wheat prices (= 10.43 artabai/solidus).
People Plagues, and Prices in the Roman World 829
From the Apion accounts, for example, some leases (perhaps by the state) to farmers are described as “according to ancient custom.” Further, we happen to possess estate accounts for exactly the same estate agent nine years apart; the amount to be collected, from dozens of sub-properties, had not changed by a farthing in the intervening years.38
Turning to the documents themselves, rent contracts present consider-able complexities of interpretation. Land of different quality and land in different locations should have different rents, and we usually have no idea of the quality of the land under cultivation.39 Moreover, rents could be paid in different forms: fixed in cash, in kind, or both, or a share of the harvest (Kehoe 2007; Rowlandson 1996). My analysis here sets share-cropping arrangements to one side. Those rents specifying in addition the delivery of small gifts—usually chickens or pigs—from the lessee to the landowner are categorized as straight rental agreements, figuring that a rooster here and there is not material. In general, the landowner paid the taxes and furnished the seed (nearly always one artaba per aroura, or 1.41 hl/hectare); sometimes provision was made in the event of a poor inundation. The analysis here focuses solely on rents on arable land, excluding for instance vine or reed land.
Straight cash rents are rare in the early period. Four in the second century amount to 35–40 drachmai/aroura, while one from AD 192 is substantially higher at 140 drachmai/aroura. In late antiquity, while cash rents were common on vineland, there are some for arable land. Figure 11 represents all cash rents on arable land, expressed in terms of grams of silver per hectare. Perhaps the only noteworthy pattern is the decline in the period after the Justinianic Plague; this contrasts with the (more numerous) rents in kind from the same period. The divergence could suggest that land rentals in cash were more exposed to market processes in this period than land rentals in kind.
Rents in kind (i.e., annual payments in wheat) are far more abundant on arable land in all periods. These data have the advantage of already and always being expressed in real terms, artabai of wheat per aroura of land, which I have converted to hl/hectare. But rents in kind are not
38 P. Oxy. 16.1911 (AD 557) and P. Oxy. 55.3804 (AD 566); on these documents, see Mazza (1998) and Hickey (2012, pp. 57–58, 67–68).
39 In general, the geography of the Nile valley, the ease and affordability of river transport, and the prominence of canals would have suppressed the importance of location for agricultural rents in Egypt, relative to other parts of the empire. There are not strong differences detectible between nomes (Scheidel 2002, p. 101); within nomes, there may have been an effect for distance from the Nile. I have been able to test this crudely from the series of first-century Arsinoite rents (n = 9, four of which from Tebtynis were averaged); the rents show a negative relationship between distance from the Nile and agricultural rents (R2 = .572): see Data-file, sheet 21.

Harper830
as simple as they seem. Often, arable land was divided between wheat and barley; to add to the complexity, multi-year leases often specify that parts of the land should be alternated with fodder crops; most of the time, the land under wheat was charged a fixed rent in kind, while land under fodder was charged a relatively modest cash rent.40 Hence, not only does the present analysis bring the catalogue up to date, it also recalculates each rent, taking into account the complexities of fallowing and cash charges: for instance, the rent on a field of one hectare leased for two years at total rent of 10 hectoliters, agreed to be left fallow for one of the two years, would be calculated as 5 hl/hectare; if a cash payment of 10 drachmai were included, that cash amount would be converted into wheat equivalent and added to the total rent. When barley was the only crop under cultivation, the rent has been excluded from the anal-ysis; when barley was the minor part of the lease, it has been included and converted to wheat at a 1:2 ratio (wheat:barley) which is a roughly average and consistent ratio of their values over a very long period of time (Rathbone and von Reden 2015, Table A8.16). With all charges converted to wheat, the total rent has been calculated on the entire term
0
5
10
15
20
25
30
35
100 200 300 400 500 600Year
Antonine Plague Justinianic Plague
Figure 11CASH RENTS (GRAMS SILVER / HECTARE)
Source: Data-file, darmc.harvard.edu, sheet 17.
40 Drexhage’s catalogue of rent levels ignores these complexities; his rent data cannot serve the kind of economic analysis we might wish to perform.

People Plagues, and Prices in the Roman World 831
of the lease and converted to an annual average; I have taken the 10:90 trimmed mean for each of four periods (AD 1–165; 166–249; 250–400; 400–650) to suppress outlier effects.
The data are thick enough that we can produce a 20-year moving average to gain a sense of the movement over time. While there are many variables we would like to be able to control more precisely, this is the longest and most accurate set of rental data from the Roman world. It shows basic stability down to the Antonine Plague (a slight increase in the raw data, almost completely level taking the 10:90 trimmed mean), then a definite fall until the early fourth century.41 The data from AD 300–400 are consistent enough to allow us to see a gradual increase in rates, which might plausibly be tied to a period of demographic growth and economic recovery after the first two mortality shocks. The sixth-century rates show high levels of variability (and the mid-century aver-ages are heavily influenced by a single, especially high rate in AD 549).
REFLECTIONS ON THE DATA
These data from Egypt can contribute to our understanding of the basic trajectory of the Roman economy and the interplay of economics and demography in the long run. The ability to combine wheat and land
0
2
4
6
8
10
12
14
100 200 300 400 500 600 700Year
Justinianic PlaguePlague of Cyprian
Antonine Plague
Figure 12RENTS IN KIND (HL/HECTARE)
Source: Data-file, darmc.harvard.edu, sheet 18.
41 The trimmed mean up to AD 165 (n = 56) = 8.2 hl/hectare; the trimmed mean from AD 166–249 (n = 32) = 6.0 hl/hectare.

Harper832
price data with wage and rent data is critical, because it allows us to evaluate the shifting balance in the main factors of production, behind the noise of monetary instability. Of course, as this study confirms, demographic and monetary history were closely linked in Roman antiq-uity, as major mortality shocks were all consistently aligned with sharp changes in the monetary regime. But the movements in real prices are even more interesting. The papyri evidence of Egypt, which furnishes incomparable evidence for the living standards of ordinary laborers in the Roman Empire, suggests that the Romans achieved both population growth and intensive economic growth over the century and a half down to the Antonine Plague in AD 165. Against a background of ~.1 percent population growth, real wages rose faster than any of the other indices I have reconstructed.42
Such growth does not imply escape from the limits of pre-indus-trial economies; rather, the sources of growth, such as trade and tech-nology, were great enough both to accommodate the larger population and to provide intensive growth on a broad scale over this period. In the words of Temin (2013, p. 236), “The question therefore is not whether Malthusian constraints were present, but rather what changes in Roman
0
2
4
6
8
10
12
14
16
100 200 300 400 500 600 700Year
Antonine Plague Plague of Cyprian Justinianic Plague
Figure 13RENTS IN KIND (HL/HECTARE, 20-YEAR MOVING AVERAGE)
Source: Data-file, darmc.harvard.edu, sheet 18.
42 For a graphical representation, see Data-file, sheet 22.
People Plagues, and Prices in the Roman World 833
times led to growth within these constraints and how far growth went.” Future work should try to compare the absolute levels of Roman living standards over these seven centuries with other times and places. Robert C. Allen (2007) found that the consumption levels of ordinary workers, implied by the Price Edict of Diocletian (AD 301), was comparable to some early modern societies, though not the higher wage ones such as the Dutch and English cases. While the Price Edict allows the recon-struction of a consumption basket from a single source of data, it is ulti-mately a normative document. Moreover, the incomes reconstructed in my study suggest higher levels than the Price Edict, especially during the early empire. Most importantly, since levels of income changed over time within the Roman period, the Price Edict cannot be testimony for “Roman” incomes without qualification. Finally, any estimation of Roman economic performance overall will have to account not just for incomes but also for population growth itself. The combination of exten-sive and intensive growth in the period of the Roman Empire’s maximum efflorescence was impressive.
No one believes or should believe, however, that the Romans could have sustained intensive growth permanently; the “pull of Malthusian equilibrium” would have been felt if the population had continued to grow indefinitely (Temin 2013, pp. 231–32). But, as it happened, envi-ronmental change intervened before declines in living standards provided any cause for fertility to fall or mortality to rise. This is clearest in the case of the Antonine Plague but seems true also of the Cyprianic and Justinianic plagues; possibly the rising price of wheat leading into the Justinianic Plague implies some pressure, but the (admittedly limited) evidence does not suggest falling real wages or rising rents in the same decades. This article has suggested that the effects of these demographic shocks were complex. On the one hand, shifting factor proportions proved favorable for labor, but in each case it may have taken some time for workers to turn new circumstances into higher incomes. Moreover, these crises simultaneously undermined the trade networks and techno-logical advances that supported economic growth. In the aftermath of the Antonine Plague, wages remained at similar levels as before, suggesting that losses to trade and technology were offset by the greater scarcity of labor; real land prices fell, as did real rents. The damage done by the Plague of Cyprian may have been more long-lasting, as evidenced by the massive inflation of the following century; still, modest recovery and growth are evident in the fourth century. After the Justinianic Plague, wheat prices fell precipitously, while real wages seemed to have risen, but only very modestly. However, in this case, the evidence does not show

Harper834
falling land prices or rents. The Justinianic Plague is thought to have been the most devastating ancient mortality shock, and it is possible that it truly undermined the foundations of economy and society. Possibly, it was not until the Islamic Golden Age that laborers meaningfully benefited from their relative scarcity (Pamuk and Shatzmiller 2014). Thus, not only do population, trade, technology, institutions, and the environment interact in complex ways in pre-industrial economies, they do so on time-scales that require us to take the very long view.
Appendix 1: Note on Accessing the Primary Sources Used
This study is built upon a new dataset of economic data recovered from Roman-era papyri from Egypt. Papyri have been edited in a large variety of different editions over the last century and a half. The complete list of primary sources used in this study is available online in Excel format including all of the data (“Geodatabase of Prices, Rents, and Wages in Roman Egypt, AD 1–700”) at darmc.harvard.edu under “Data Availability.” The discipline of papyrology uses a standard list of abbreviations to refer to the original edition of the papyri; this key is called the “Checklist of Editions of Greek, Latin, Demotic, and Coptic Papyri, Ostraca, and Tablets,” available at http://papyri.info/docs/checklist. The vast majority of original texts are also available online open access at papyri.info. The easiest way to find each primary source used in this study is to consult the Data-file to find the abbreviated reference, use the Checklist to identify the complete title of the edition, and from there find the source in a library or online at papyri.info. For further questions, consult the author at [email protected].
REFERENCES
Allen, Robert C. “How Prosperous were the Romans? Evidence from Diocletian’s Price Edict (301 AD).” In Quantifying the Roman Economy: Methods and Problems, edited by Alan K. Bowman, Andrew Wilson, 327–45. Oxford: Oxford University Press, 2007.
Alston, Richard. “Urban Population in Late Roman Egypt and the End of the Ancient World.” In Debating Roman Demography, by Walter Scheidel, 161–204. Leiden: Brill, 2001.
Bagnall, Roger S. Currency and Inflation in Fourth Century Egypt. Chico, CA: Scholars Press, 1985.
———. “Fourth-Century Prices: New Evidence and Further Thoughts.” Zeitschrift für Papyrologie und Epigraphik 76 (1989): 69–76.
———. Egypt in Late Antiquity. Princeton, NJ: Princeton University Press, 1993. ———. “The Effects of Plague: Model and Evidence.” Journal of Roman Archaeology
15 (2002): 114–20.———. Reading Papyri, Writing Ancient History. United States and Canada: Routledge,
2003.

People Plagues, and Prices in the Roman World 835
———, ed. The Oxford Handbook of Papyrology. Oxford and New York: Oxford University Press, 2009.
Bagnall, Roger S., and Bruce W. Frier. The Demography of Roman Egypt. Cambridge, U.K. and New York, NY: Cambridge University Press, 1994.
Bagnall, Roger S., C. A. Hope. The Kellis Agricultural Account Book: (P. Kell. IV Gr. 96). Oxford, U.K.: Oxbow Books, 1997.
Bagnall, W. S. “The Archive of Laches: Prosperous Farmers of the Fayum in the Second Century.” Ph.D. diss, Duke University, 1974.
Banaji, Jairus. “Discounts, Weight Standards, and the Exchange-Rate between Gold and Copper: Insights into the Monetary Process of the Sixth Century.” In Atti dell’Accademia romanistica costantiniana: XII Convegno Internazionale sotto l’alto patronato del presidente della repubblica: in onore Di Manilo Sargenti: 183–202. Napoli: Edizioni scientifiche italiane, imp. 1998.
Benedictow, Ole J. The Black Death, 1346–1353: A Complete History. Woodbridge: Boydell & Brewer, 2004.
Biraben, Jean Noël. Les hommes et la peste en France et dans les pays européens et méditerranéens. Paris: Mouton, 1975.
Bowman, Alan K. Egypt after the Pharaohs 332 BC–AD 642 : From Alexander to the Arab Conquest. Berkeley: University of California Press, 1989.
Bowman, Alan K., and Andrew Wilson. Quantifying the Roman Economy: Methods and Problems. Oxford Studies on the Roman Economy. Oxford: Oxford University Press, 2009.
Bruun, Christer. “The Antonine Plague in Rome and Ostia.” Journal of Roman Archaeology 16 (2003): 426–34.
———. “The Antonine Plague and the ‘Third-Century’ Crisis.” In Crises and the Roman Empire, edited by Olivier Hekster, Gerda de Kleijn, Daniëlle Slootjes, 201–17. Leiden: Brill, 2007.
———. “La mancanza di prove di un effetto catastrofico della ‘peste antonina’ (dall’ 166 d.c. in poi).” In L’impatto della ‘peste antonina’, edited by Elio Lo Cascio, 123–65. Bari: Edipuglia, 2012.
Camilli, Luciano, and Sara Sorda. 1993. L’“Inflazione” nel quarto secolo d.C.: Atti dell’incontro di studio, Roma 1988. Roma: Istituto Italiano di Numismatica.
Carrié, Jean-Michel. “L’arithmétique sociale de l’économie agraire. Prix de la terre, rente foncière et prix des céréales dans l’Égypte romano-byzantine.” In Economie antique: prix et formation des prix dans les économies antiques, 121–46. Saint-Bertrand-de-Comminges: Musée archéologique départemental, 1997.
———. “Les Crises Monétaires de l’Empire Romain Tardif.” In La monnaie dévoilée par ses crises, edited by B. Théret, 131–64. Paris: Editions de l’Ecole des hautes études en sciences sociales, 2007.
Casson, Lionel, ed. The Periplus Maris Erythraei: Text with Introduction, Translation, and Commentary. Princeton: Princeton University Press, 1989.
Clark, Gregory. “Farm Wages and Living Standards in the Industrial Revolution: England, 1670–1869.” Economic History Review 54 no. 3 (2001): 477–505.
———. A Farewell to Alms : A Brief Economic History of the World. Princeton Economic History of the Western World. Princeton: Princeton University Press, 2007.
Clark, Gregory, and Ysbrand Van Der Werf. “Work in Progress? The Industrious Revolution.” Journal of Economic History 58, no. 3 (1998): 830–43.
Harper836
Clarysse, Willy, and Yanne Broux. “Two Greek Funerary Stelae from Lydia and the Antonine Plague.” Tyche. Beiträge zur Alten Geschichte, Papyrologie und Epigraphik 24 (2009): 27–33.
Clarysse, Willy, and C. Gallazzi. “Archivio Dei Discendenti Di Laches O Dei Discendenti Di Patron?” Ancient Society 24 (1993): 63–68.
Corbier, Mireille. “Coinage, Society and Economy.” In The Cambridge Ancient History. Vol. 12, The Crisis of Empire, A.D. 193–337, edited by Alan K. Bowman, Peter Garnsey, and Averil Cameron, 2nd ed., 393–439. Cambridge: Cambridge University Press, 2005.
———. “Coinage and Taxation: The State’s Point of View, A.D. 193–337.” In The Cambridge Ancient History. Vol. 12, The Crisis of Empire, A.D. 193–337, edited by Alan K. Bowman, Peter Garnsey, and Averil Cameron, 2nd ed., 327–92. Cambridge: Cambridge University Press, 2008.
de Neeve, P.W. “The Price of Agricultural Land in Roman Italy and the Problem of Economic Rationalism.” Opus 4 (1985): 77–109.
Drexhage, Hans-Joachim. Preise, Mieten/Pachten, Kosten und Löhne im römischen Ägypten bis zum Regierungsantritt Diokletians. St. Katharinen: Scripta Mercaturae, 1991.
Duncan-Jones, Richard P. The Economy of the Roman Empire: Quantitative Studies. Cambridge and New York: Cambridge University Press, 1982.
———. Structure and Scale in the Roman Economy. Cambridge and New York: Cambridge University Press, 1990.
———. “The Impact of the Antonine Plague.” Journal of Roman Archaeology 9 (1996): 108–36.
Erdkamp, Paul. The Grain Market in the Roman Empire: A Social, Political and Economic Study. Cambridge, U.K. and New York, NY: Cambridge University Press, 2005.
Finley, M. I. The Ancient Economy. London: Chatto & Windus, 1973.Frier, Bruce W. “Demography.” In The Cambridge Ancient History. Vol. 11, The High
Empire, A.D. 70–192, edited by Alan K. Bowman, Peter Garnsey, and Dominic Rathbone, 787–816. Cambridge: Cambridge University Press, 2000.
———. “More Is Worse: Some Observations on the Population of the Roman Empire.” In Debating Roman Demography, edited by Walter Scheidel, 139–59. Leiden, Netherlands: Brill, 2001.
Goldstone, Jack A. “Efflorescences and Economic Growth in World History: Rethinking the ‘Rise of the West’ and the Industrial Revolution.” Journal of World History 13, no. 2 (2002): 323–89.
Greene, Kevin. “Technological Innovation and Economic Progress in the Ancient World: M. I. Finley Re-Considered.” Economic History Review 53, no. 1 (2000): 29–59.
Hahn, Wolfgang. Money of the Incipient Byzantine Empire: (Anastastius I - Justinian I, 491-565). Vienna: Östereichische Forschungsgesellschaft für Numismatik am Institut für Numismatik und Geldgeschichte, 2000.
Haklai-Rotenberg, Merav. “Aurelian’s Monetary Reform: Between Debasement and Public Trust.” Chiron 41 (2011): 1–39.
Harper, Kyle. Slavery in the Late Roman World, AD 275–425. Cambridge: Cambridge University Press, 2011.

People Plagues, and Prices in the Roman World 837
———. “Pandemics and Passages to Late Antiquity: Rethinking the Plague of C. 249–70 Described by Cyprian.” Journal of Roman Archaeology 28 (2015): 223–60.
———. The Environmental Fall of the Roman Empire: Climate Change, Disease, and the Coming of the Dark Ages. Princeton, NJ: Princeton University Press, forthcoming.
Hickey, Todd M. Wine, Wealth, and the State in Late Antique Egypt: The House of Apion at Oxyrhynchus. New Texts from Ancient Cultures. Ann Arbor: University of Michigan Press, 2012.
Hin, Saskia. The Demography of Roman Italy: Population Dynamics in an Ancient Conquest Society (201 BCE–14 CE). Oxford and New York: Oxford University Press, 2013.
Howgego, Christopher, Kevin Butcher, Matthew Ponting, et al. “Coinage and the Roman Economy in the Antonine Period: The View from Egypt.” Oxford Roman Economy Project: Working Papers, 2010.
Johnson, Allan Chester, and Louis C. West. Byzantine Egypt: Economic Studies. Princeton University Studies in Papyrology, No. 6. Princeton, NJ: Princeton University Press, 1949.
Jones, A. H. M. The Later Roman Empire, 284–602: A Social, Economic, and Administrative Survey. Oxford: Blackwell, 1964.
Jones, Christopher. “Ten Dedications ‘To the gods and goddesses’ and the Antonine Plague.” Journal of Roman Archaeology 18 (2005): 293–301.
Jongman, Willem M. “The Early Roman Empire: Consumption.” In The Cambridge Economic History of the Greco-Roman World, edited by Walter Scheidel, Ian Morris, and Richard P. Saller, 592–618. Cambridge, U.K. and New York, NY: Cambridge University Press, 2007.
Kehoe, Dennis P. Law and the Rural Economy in the Roman Empire. Ann Arbor: University of Michigan Press, 2007.
Liebeschuetz, Wolf. “Was There a Crisis of the Third Century?” In Crises and the Roman Empire, edited by Olivier Hekster, Gerda de Kleijn, and Daniëlle Slootjes, 11–20. Leiden: Brill, 2007.
Little, Lester K. Plague and the End of Antiquity: The Pandemic of 541–750. Cambridge: Cambridge University Press, 2007.
Lo Cascio, Elio. “Prezzo Dell’oro E Prezzi Delle Merci.” In L’“Inflazione” nel quarto secolo d.C.: Atti dell’incontro di studio, Roma 1988, edited by Luciano Camilli and Sara Sorda, 155–88. Roma: Istituto Italiano di Numismatica, 1993.
———. Crescita e declino: studi di storia dell’economia romana. Roma: “L’Erma” di Bretschneider, 2009.
———, ed. L’impatto della ‘peste antonina’. Bari: Edipuglia, 2012. Lo Cascio, Elio, and Paolo Malanima. “Cycles and Stability. Italian Population before
the Demographic Transition (225 BC–AD 1900).” Rivista di storia economica 21, no. 3 (2005): 197–232.
Maresch, Klaus. Nomisma und Nomismatia: Beiträge zur Geldgeschichte Ägyptens im 6. Jahrhundert n. Chr. Opladen: Westdeutscher Verlag, 1994.
Mazza, Roberta. “P.Oxy. XVI 1911 e i conti annuali dei pronoetai.” Zeitschrift für Papyrologie und Epigraphik 122 (1998): 161–72.
McCormick, Michael. “Bateaux de vie, bateaux de mort. Maladie, commerce, transports annonaires et le passage économique du bas-empire au moyen âge.” Settimane di studio - Centro Italiano di studi alto medioevo 45 (1998): 35–118.
Harper838
———. “Rats, Communications, and Plague: Toward an Ecological History.” Journal of Interdisciplinary History 34, no. 1 (2003): 1–25.
McCormick, Michael, Ulf Büntgen, Mark A. Cane, et al. “Climate Change during and after the Roman Empire: Reconstructing the Past from Scientific and Historical Evidence.” Journal of Interdisciplinary History 43, no. 2 (2012): 169–220.
Mitrofan, Dragoș. “The Antonine Plague in Dacia and Moesia Inferior.” Journal of Ancient History and Archaeology 1, no. 2 (2014): 9–13.
Morelli, Federico. Olio e retribuzioni nell’Egitto tardo: (V-VIII d.C.). Florence: Istituto papirologico G. Vitelli, 1996.
Morris, Ian. Why the West Rules—for Now: The Patterns of History, and What They Reveal about the Future. New York: Farrar, Straus and Giroux, 2010.
———. The Measure of Civilization: How Social Development Decides the Fate of Nations. Princeton: Princeton University Press, 2013.
Morrison, Cécile. “Monnaie et prix à Byzance du Ve au VIIe Siècle.” In Hommes et richesse dans l’empire byzantin (IVe–VIIe Siècle), edited by Catherine Abadie-Reynal, 239–60. Paris: P. Lethielleux, 1989.
Ostrogorsky, Georg. “Löhne und Preise in Byzanz.” Byzantinische Zeitschrift 32, no. 2 (1932): 293–333.
Pamuk, Şevket, and Maya Shatzmiller. “Plagues, Wages, and Economic Change in the Islamic Middle East, 700–1500.” Journal of Economic History 74, no. 1 (2014): 196–229.
Parker, Grant Richard. The Making of Roman India. Greek Culture in the Roman World. Cambridge, U.K. and New York, NY: Cambridge University Press, 2008.
Rathbone, Dominic W. “Villages, Land and Population in Graeco-Roman Egypt.” The Cambridge Classical Journal 36 (January 1990): 103–42.
———. Economic Rationalism and Rural Society in Third-Century A.D. Egypt: The Heroninos Archive and the Appianus Estate. Cambridge: Cambridge University Press, 1991.
———. “Monetisation, Not Price-Inflation, in Third-Century AD Egypt?” In Coin Finds and Coin Use in the Roman World: The Thirteenth Oxford Symposium on Coinage and Monetary History, 25.-27.3.1993: A NATO Advanced Research Workshop, edited by Cathy King, 321–39. Berlin: Gebr. Mann Verlag, 1996.
———. “Prices and Price Formation in Roman Egypt.” In Economie antique: prix et formation des prix dans les économies antiques, 183–244. Saint-Bertrand-de-Comminges: Musée archéologique départemental, 1997.
———. “Roman Egypt.” In The Cambridge Economic History of the Greco-Roman World, edited by Walter Scheidel, Ian Morris, and Richard Saller, 698–719. Cambridge: Cambridge University Press, 2007.
Rathbone, Dominic W. and Sitta von Reden. “Mediterranean Grain Prices in Classical Antiquity.” In A History of Market Performance: From Ancient Babylonia to the Modern World, edited by R.J. Van der Spek, Jan Luiten, and Bas van Zanden, 149–235. London: Routledge, 2015.
Riggs, Christina. The Oxford Handbook of Roman Egypt. Oxford University Press, 2012.
Rowlandson, Jane. Landowners and Tenants in Roman Egypt the Social Relations of Agriculture in the Oxyrhynchite Nome. Oxford: Clarendon Press, 1996.

People Plagues, and Prices in the Roman World 839
Scheidel, Walter. “A Model of Demographic and Economic Change in Roman Egypt after the Antonine Plague.” Journal of Roman Archaeology 15 (2002): 97–114.
———. “Real Wages in Early Economies: Evidence for Living Standards from 1800 BCE to 1300 CE.” Journal of the Economic and Social History of the Orient 53, no. 3 (2010): 425–62.
———. “Approaching the Roman Economy.” In The Cambridge Companion to the Roman Economy, edited by Walter Scheidel, 1–21. Cambridge: Cambridge University Press, 2012a.
———. “Roman Wellbeing and the Economic Consequences of the Antonine Plague.” In L’impatto della peste antonina, edited by E. Lo Cascio, 265–95. Bari: Edipuglia, 2012b.
Scheidel, Walter, Ian Morris, and Richard P. Saller, eds. The Cambridge Economic History of the Greco-Roman World. Cambridge, U.K. and New York, NY: Cambridge University Press, 2007.
Stathakopoulos, Dionysios. Famine and Pestilence in the Late Roman and Early Byzantine Empire: A Systematic Survey of Subsistence Crises and Epidemics. Aldershot: Ashgate, 2004.
Temin, Peter. The Roman Market Economy. Princeton, NJ: Princeton University Press, 2013.
Tomber, R. Indo-Roman Trade : From Pots to Pepper. Duckworth Debates in Archaeology. London: Duckworth, 2008.
Vivian, Tim, ed. Witness to Holiness: Abba Daniel of Scetis. Kalamazoo, MI: Cistercian Publications, 2008.
Wilson, Andrew. “Machines, Power and the Ancient Economy.” Journal of Roman Studies 92 (2002): 1–32.
Witschel, Christian. Krise, Rezession, Stagnation?: Der Westen des Römischen Reiches im 3. Jahrhundert N. Chr. Frankfurt am Main: Marthe Clauss, 1999.
Zuckerman, Constantin. Du village à l’empire: autour du registre fiscal d’Aphroditó (525/526). Paris: Association des Amis du Centre d’Histoire et Civilisation de Byzance, 2004.