Pension Asset-Liability Study: Initial Results · PDF fileAon Hewitt | Retirement and...
58
Aon Hewitt Retirement and Investment Investment advice and consulting services provided by Aon Hewitt Investment Consulting, Inc., an Aon Company. Pension Asset-Liability Study: Initial Results Florida State Board of Administration February 2017
Transcript of Pension Asset-Liability Study: Initial Results · PDF fileAon Hewitt | Retirement and...

Aon Hewitt Retirement and Investment Investment advice and consulting services provided by Aon Hewitt Investment Consulting, Inc., an Aon Company.
Pension Asset-Liability Study: Initial Results Florida State Board of Administration February 2017
Aon Hewitt | Retirement and Investment Investment advice and consulting services provided by Aon Hewitt Investment Consulting, Inc., an Aon Company. 2
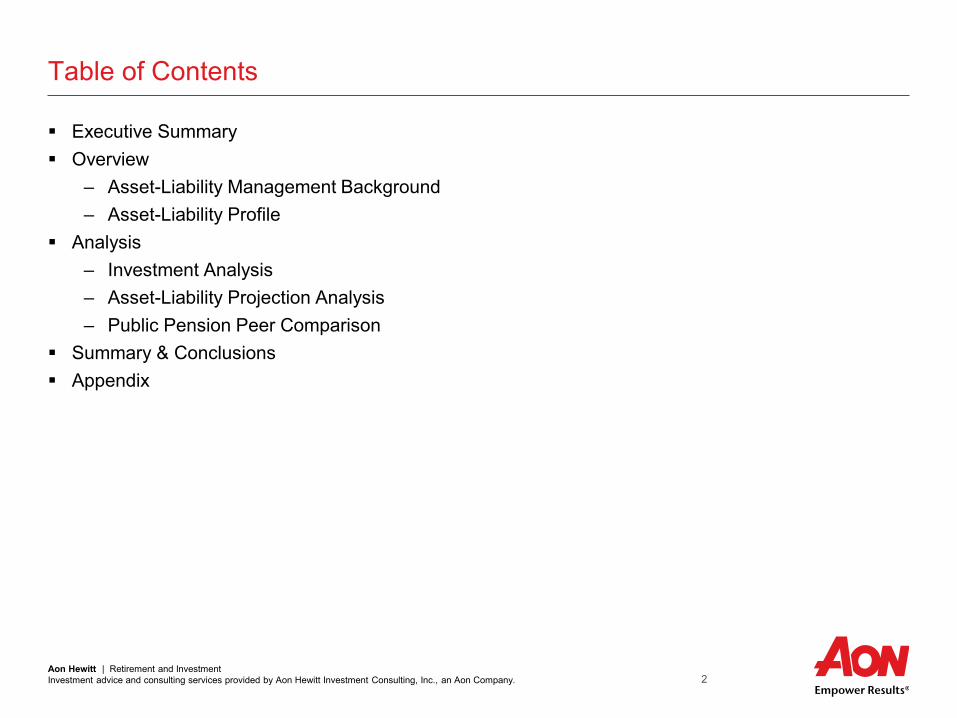
Table of Contents
Executive Summary Overview
– Asset-Liability Management Background – Asset-Liability Profile
Analysis – Investment Analysis – Asset-Liability Projection Analysis – Public Pension Peer Comparison
Summary & Conclusions Appendix

Aon Hewitt | Retirement and Investment Investment advice and consulting services provided by Aon Hewitt Investment Consulting, Inc., an Aon Company. 3
Executive Summary
Aon Hewitt | Retirement and Investment Investment advice and consulting services provided by Aon Hewitt Investment Consulting, Inc., an Aon Company. 4
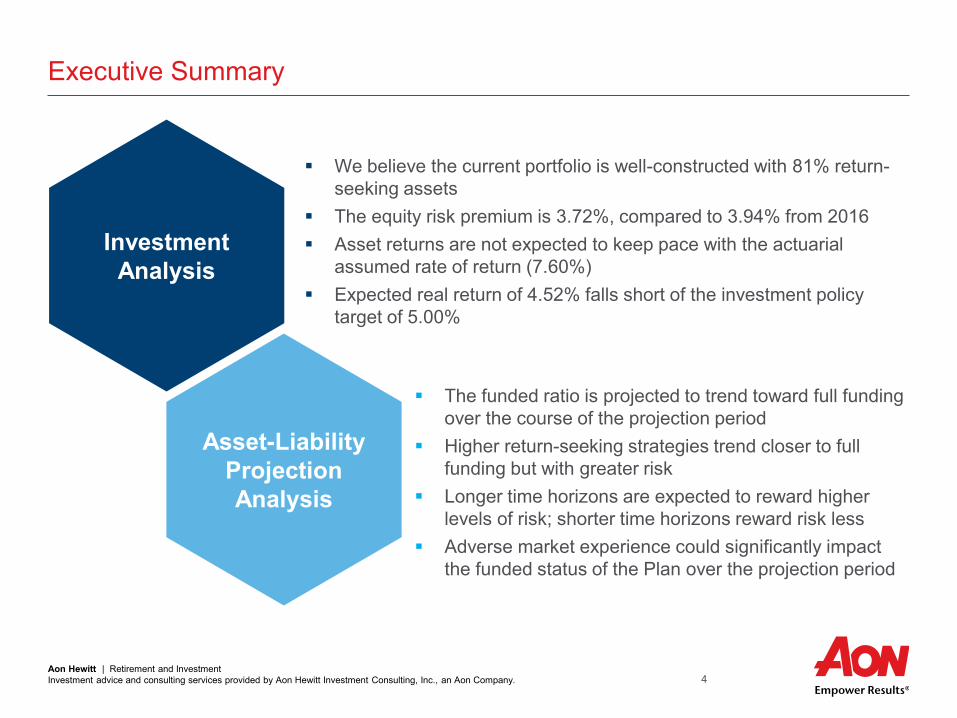
Executive Summary
We believe the current portfolio is well-constructed with 81% return-seeking assets
The equity risk premium is 3.72%, compared to 3.94% from 2016 Asset returns are not expected to keep pace with the actuarial
assumed rate of return (7.60%) Expected real return of 4.52% falls short of the investment policy
target of 5.00%
The funded ratio is projected to trend toward full funding over the course of the projection period
Higher return-seeking strategies trend closer to full funding but with greater risk
Longer time horizons are expected to reward higher levels of risk; shorter time horizons reward risk less
Adverse market experience could significantly impact the funded status of the Plan over the projection period
Investment Analysis
Asset-Liability Projection Analysis

Aon Hewitt | Retirement and Investment Investment advice and consulting services provided by Aon Hewitt Investment Consulting, Inc., an Aon Company. 5
Overview Asset-Liability Management Background

Aon Hewitt | Retirement and Investment Investment advice and consulting services provided by Aon Hewitt Investment Consulting, Inc., an Aon Company. 6
Scope of Project
Annual Asset-Liability Management (ALM) review and update – 30 year asset-liability projection analysis – Review stochastic risk/reward results – Review multiple portfolio strategies

Aon Hewitt | Retirement and Investment Investment advice and consulting services provided by Aon Hewitt Investment Consulting, Inc., an Aon Company. 7
Asset-Liability Management Background What is an Asset-Liability Study?
Provides fiduciaries with an understanding of the dynamic relationship between plan assets and liabilities over time
Illustrates the impact of various asset allocation targets on required contributions and funded status under a range of different macro-economic scenarios
Identifies future trends in the financial health of the plan based on economic uncertainties that may not be evident from an actuarial valuation, which provides only a snapshot at a point in time
Helps determine the level of risk that is appropriate in the context of the Plan’s liabilities
An asset-liability study provides the tools to align a plan’s risk taking with its liabilities

Aon Hewitt | Retirement and Investment Investment advice and consulting services provided by Aon Hewitt Investment Consulting, Inc., an Aon Company. 8
Asset-Liability Management Background Balance of Liabilities and Assets
Assets $ Liabilities
$
PENSION PLAN + New Benefit
Accrual
+ Cash Contributions
+ Asset Return + Liability
Return
- Benefit Payments
- Benefit Payments

Aon Hewitt | Retirement and Investment Investment advice and consulting services provided by Aon Hewitt Investment Consulting, Inc., an Aon Company. 9
Types of Risk Time Horizon Risk Management Tools and Controls
Return Shortfall Assets do not grow with liabilities Investment return & contribution less
than liability growth
Long-Term (10+ years)
Funding policy Plan design Investment policy Assumptions & methods
Liquidity Cannot liquidate assets efficiently to
meet needs Lose control of asset allocation
Short- to Medium-Term (<5 years)
Funding policy Benefit accruals Use of Illiquid investments Scenario analysis Monitoring
Investment Asset allocation (policy) Investment structure Manager selection Rebalancing Scenario (or path risk) Factor
Short-to Medium-Term (<5 years)
Investment policy statement – Static/dynamic – Asset allocation – Rebalancing – Manager guidelines – Monitoring/roles & responsibilities
Risk budgeting Monitoring / dashboards Medium term views Regression and scenario analysis
Asset-Liability Management Background Key Risks for Public Pension Plans

Aon Hewitt | Retirement and Investment Investment advice and consulting services provided by Aon Hewitt Investment Consulting, Inc., an Aon Company. 10
Asset-Liability Management Background Overview of the Asset-Liability Study Process
+ + + Planning Objectives of the
Study Modeling and
Liability Assumptions
Risk Tolerance Risk Preference Demographics Funded Status Business/Financial Industry Practices
Liability Analysis Cost Projections Funded Status Sensitivity Analysis
Asset Modeling Capital Market
Analysis Efficient Frontier
Analysis Portfolios for Study
Desired Outcomes: Understand the pension risk Identify optimal investment strategy
Planning Discussions Asset-Liability Projections
Implementation
Monitoring & Execution

Aon Hewitt | Retirement and Investment Investment advice and consulting services provided by Aon Hewitt Investment Consulting, Inc., an Aon Company. 11
Asset-Liability Management Background Modeling Process
Goals of an asset-liability study: – Understand the pension plan’s asset-liability risk, and – Identify the optimal investment strategies
Stochastic, Monte Carlo simulation analysis used
– 5,000 independent economic trials – Building block approach
• Starts with inflation and interest rates • Using a multi-factor regression analysis, other asset classes are then modeled
– Assets and liabilities are modeled over the projection period • Projections include contribution requirements and funded ratios
Asset-liability studies are best-suited to determine the optimal mix of return-seeking (e.g., equity) and fixed income
assets for the pension fund – Asset mix is the single most important investment decision for the plan sponsor
• Is it worthwhile to have a more aggressive allocation in order to reduce long term cost in exchange for risk of higher costs in a bad outcome?
• Is it worthwhile to have a more conservative allocation in order to have a more predictable cost in exchange for potentially higher average costs?

Aon Hewitt | Retirement and Investment Investment advice and consulting services provided by Aon Hewitt Investment Consulting, Inc., an Aon Company. 12
Asset-Liability Management Background Mechanics of Asset-Liability Modeling Process
Contributions Funded Ratio
Correlation Duration Discount Rate
Salary Increase
Asset Mix
Demographics Plan Design
Actuarial Assumptions
Portfolio Return Liabilities
Inflation Interest Rate
Asset and liability modeling integrated in single platform Integrates impact of key
economic variables
Flexibility in modeling parameters and output to client preferences
Stochastic and deterministic modeling performed

Aon Hewitt | Retirement and Investment Investment advice and consulting services provided by Aon Hewitt Investment Consulting, Inc., an Aon Company. 13
Asset-Liability Management Background Long-Term Economic Cost of Plan
Main component of long-term economic cost
Does not reflect the plan’s funded status at the end of the forecast period
Present Value of Plan
Contributions
Present Value of Terminal
Funding
Utility Factor Applied to Terminal Funding
Reflects the plan’s funded status at the end of the forecast period
Surplus assets are valuable as they lower future contributions
Unfunded liabilities are costs that will be recognized in future years
Terminal Funding Surplus Shortfall
Utility Rationale
Declining value, or utility, from very
high funded ratios
Increasing “pain” as unfunded
amounts grow to high levels
Threshold PVB / AL (5 Yrs. of Benefit Payments) / AL
Utility Factor above/below threshold
50% 200%
Long-Term Economic Cost = Present Value of Plan Contributions +
Present Value of Terminal Funding,
adjusted by a utility factor
Aon Hewitt | Retirement and Investment Investment advice and consulting services provided by Aon Hewitt Investment Consulting, Inc., an Aon Company. 14
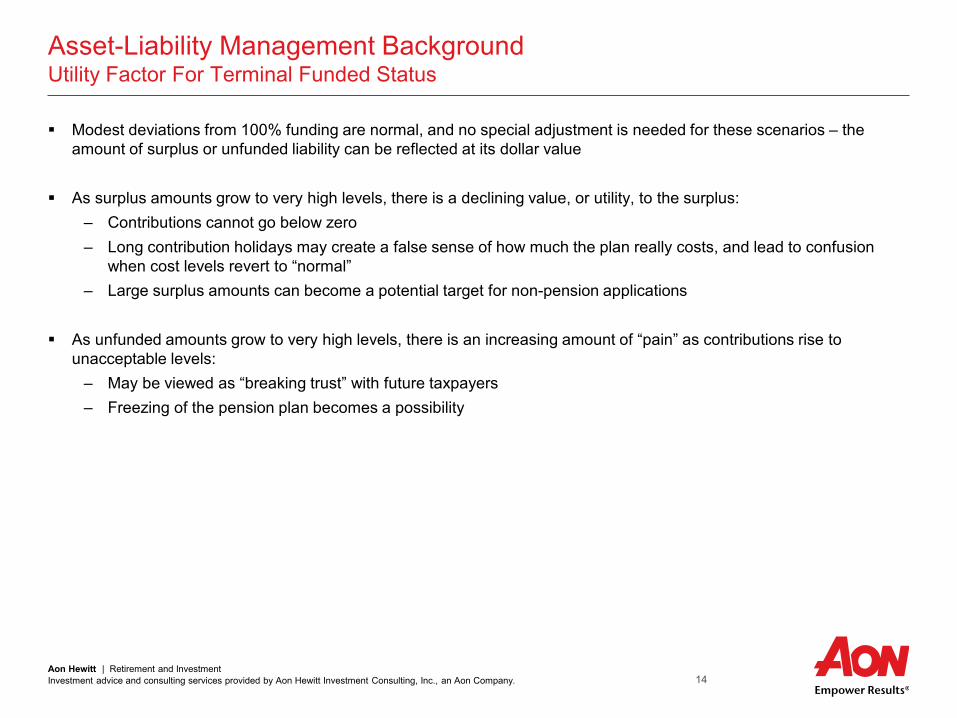
Asset-Liability Management Background Utility Factor For Terminal Funded Status
Modest deviations from 100% funding are normal, and no special adjustment is needed for these scenarios – the amount of surplus or unfunded liability can be reflected at its dollar value
As surplus amounts grow to very high levels, there is a declining value, or utility, to the surplus: – Contributions cannot go below zero – Long contribution holidays may create a false sense of how much the plan really costs, and lead to confusion
when cost levels revert to “normal” – Large surplus amounts can become a potential target for non-pension applications
As unfunded amounts grow to very high levels, there is an increasing amount of “pain” as contributions rise to
unacceptable levels: – May be viewed as “breaking trust” with future taxpayers – Freezing of the pension plan becomes a possibility

Aon Hewitt | Retirement and Investment Investment advice and consulting services provided by Aon Hewitt Investment Consulting, Inc., an Aon Company. 15
Asset-Liability Management Background Risk and Return in an Asset-Liability Context
Traditional: - Return = Investment performance - Risk = Annual volatility of investment gains and losses
(e.g. weak/negative capital market returns)
Asset-Liability: - Return = Potential cost reduction or funded status improvement under average economic conditions - Risk = During the worst economic conditions, contributions need to increase or funded status declines
(e.g., stocks decline, inflation/deflation shocks and/or interest rates decline)

Aon Hewitt | Retirement and Investment Investment advice and consulting services provided by Aon Hewitt Investment Consulting, Inc., an Aon Company. 16
Asset-Liability Management Background Key Factors Affecting the Risk/Reward Trade-off
The key take-away from the A/L study is the allocation between equity (“return-seeking”) vs. fixed income (“risk-reducing”)
Major factors affecting the ultimate mix are: – Time horizon (or amortization period of unfunded liability) to fund the liability: a longer time horizon supports more
risk taking – Characteristics of plan participants: a growing population of active participants supports more risk taking; a
mature population with significant retirees might need a more conservative policy – Funded status: a less funded plan can utilize additional returns from equity investments – Nature of plan benefits: a pension with sensitivity to wage inflation growth can benefit from equities in the long-
term; an increased need in liquidity due to significant benefit payments in the near future can have a more conservative policy

Aon Hewitt | Retirement and Investment Investment advice and consulting services provided by Aon Hewitt Investment Consulting, Inc., an Aon Company. 17
Asset-Liability Management Background Glossary of Terms
AVA = Actuarial Value of Assets (i.e., incorporates smoothing of gains and losses) Asset Growth Rate or “Hurdle Rate” – The required rate of growth of the assets (through both contributions and investment
returns) to keep pace with the growth of the liability Current Frontier – uses SBA’s mix of asset classes within the Return-Seeking allocation, then dials the Return-Seeking
allocation up and down from 0% to 100% to illustrate forecasted returns at various Return-Seeking / Safety Asset mixes Economic Cost – Present Value of forecasted future contributions + Funding Shortfall / (Surplus) Liability Growth Rate – the projected growth of the liability over the coming year as measurement by the sum of the Normal Cost
(new benefit accruals) and Interest Cost (one year of discounting) MVA = Market Value of Assets (i.e., un-smoothed / economic reality) Return-Seeking Assets (“R-S”) – All non “Safety” assets Safety Assets – Assets where the primary function is risk control / downside mitigation. Target Mix – the allocation of assets between Return-Seeking Assets and Safety Assets

Aon Hewitt | Retirement and Investment Investment advice and consulting services provided by Aon Hewitt Investment Consulting, Inc., an Aon Company. 18
Overview Asset-Liability Profile

Aon Hewitt | Retirement and Investment Investment advice and consulting services provided by Aon Hewitt Investment Consulting, Inc., an Aon Company. 19
Asset-Liability Profile as of July 1, 2016
1 Based on plan's valuation interest rate of 7.60% from the 2016 actuarial valuation report (Funding)
Asset-Liability Snapshot as of 7/1/2016 Metric ($, Billions) Value Fund % Market Value of Assets $141.8 83.2% Actuarial Value of Assets $145.5 85.4% Liability Metrics Actuarial Liability (AL) - Funding $170.4 1
Asset-Liability Growth Metrics Metric ($, Billions) Value % Liability % Assets AL Interest Cost $12.9 7.6% 9.1% AL Normal Cost $1.7 1.0% 1.2% Total Liability Hurdle Rate $14.7 8.6% 10.3% Expected Return on Assets $10.8 6.3% 7.6% ER + EE Contributions $3.1 1.8% 2.2% Total Exp. Asset Growth $13.9 8.1% 9.8% Hurdle Rate Shortfall $0.7 0.5% 0.5% Est. Benefit Payments $9.2 5.4% 6.5%
Target Asset Allocation as of 7/1/2016 Metric ($, Billions) Value Alloc % Return-Seeking
- Global Equity $75.1 53% - Private Equity $8.5 6% - Strategic $17.0 12% - Real Estate $14.2 10% - Total $114.8 81%
Risk-Reducing - Cash & Short Duration Fixed Income $1.4 1% - Intermediate Duration Fixed Income $25.5 18% - Total $26.9 19%
Total $141.8 100%

Aon Hewitt | Retirement and Investment Investment advice and consulting services provided by Aon Hewitt Investment Consulting, Inc., an Aon Company. 20
Analysis Investment Analysis

Aon Hewitt | Retirement and Investment Investment advice and consulting services provided by Aon Hewitt Investment Consulting, Inc., an Aon Company. 21
Investment Analysis SBA Approach: Equity Risk Premium1
Starting in 2016, the SBA averages the Global equity risk premiums from four consulting firms and then uses that average risk premium to scale AHIC’s expected returns for the “Risk Assets” 2017 Average Global Equity Risk Premium = Average (Global Equity Return – U.S. Bond Return) = 3.72%
All returns are 15-year geometric average (compounded) expected returns.
1 Equity Risk Premium is defined as the excess return earned over bonds that compensates investors for taking on higher risk. 2 Prior to 2016, ERP was U.S.-based. Starting in 2016, ERP was globally-based.
AHIC Mercer Wilshire Callan Average
2017 Assumptions (15-year geometric average expected returns)
- Global Equity 7.15% 7.53% 6.70% 6.93% 7.08%
- Core U.S. Bonds 3.40% 3.40% 3.65% 3.00% 3.36%
- Global Equity Risk Premium 3.75% 4.13% 3.05% 3.93% 3.72%
2016 Global Equity Risk Premium 3.70% 4.40% 3.20% 4.45% 3.94%
Change 2017 vs. 2016 0.05% -0.27% -0.15% -0.52% -0.22%
Prior Years:
- 2015 (based on U.S. ERP) 3.62% 3.00% 2.90% 4.60% 3.53%
- 2013 (based on U.S. ERP) 5.10% 4.30% 4.50% 5.15% 4.76%
- 2012 (based on U.S. ERP) 4.50% 3.80% 4.65% 4.50% 4.36%
- 2011 (based on U.S. ERP) 3.60% 3.80% 3.50% 4.25% 3.79%

Aon Hewitt | Retirement and Investment Investment advice and consulting services provided by Aon Hewitt Investment Consulting, Inc., an Aon Company. 22
Investment Analysis Current Frontier
Key Takeaways: The current portfolio is well-diversified
– Return-seeking assets are broadly diversified
– Safety asset allocation should withstand stressed markets
Return Seeking Risk-Reducing
Expected Nominal
Return
Expected Nominal Volatility
Sharpe Ratio
Global Equity Real Estate Strategic Private
Equity Cash &
Short Duration Bonds
Interm. Duration
Gov't Bonds
Interm. Duration
Credit Current Policy (81% RS) 6.81% 12.68% 0.3160 53% 10% 12% 6% 1% 9% 9% Current Frontier 0% 0% Return-Seeking 3.56% 4.25% 0.1793 0% 0% 0% 0% 0% 50% 50% 10% Return-Seeking 4.05% 4.19% 0.2979 7% 1% 1% 1% 0% 45% 45% 20% Return-Seeking 4.51% 4.70% 0.3632 13% 2% 3% 1% 0% 40% 40% 30% Return-Seeking 4.94% 5.64% 0.3802 20% 4% 4% 2% 0% 35% 35% 40% Return-Seeking 5.36% 6.83% 0.3746 26% 5% 6% 3% 0% 30% 30% 50% Return-Seeking 5.75% 8.16% 0.3614 33% 6% 7% 4% 0% 25% 25% 60% Return-Seeking 6.11% 9.57% 0.3464 39% 7% 9% 4% 0% 20% 20% 70% Return-Seeking 6.46% 11.03% 0.3318 46% 9% 10% 5% 0% 15% 15% 80% Return-Seeking 6.78% 12.53% 0.3180 52% 10% 12% 6% 0% 10% 10% 90% Return-Seeking 7.09% 14.05% 0.3051 59% 11% 13% 7% 0% 5% 5% 100% Return-Seeking 7.37% 15.58% 0.2932 65% 12% 15% 7% 0% 0% 0%
Aon Hewitt | Retirement and Investment Investment advice and consulting services provided by Aon Hewitt Investment Consulting, Inc., an Aon Company. 23
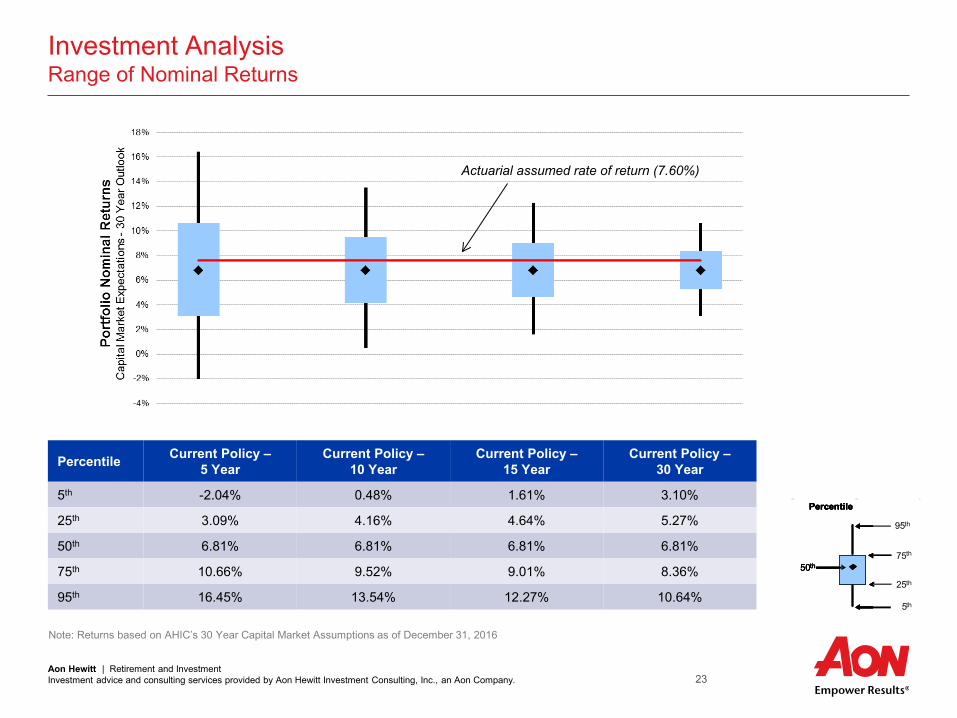
Investment Analysis Range of Nominal Returns
Actuarial assumed rate of return (7.60%)
Note: Returns based on AHIC’s 30 Year Capital Market Assumptions as of December 31, 2016
50th
95th
75th
25th
5th
Percentile
50th
95th
75th
25th
5th
Percentile
50th
95th
75th
25th
5th
Percentile
50th
95th
75th
25th
5th
Percentile
Percentile Current Policy – 5 Year
Current Policy – 10 Year
Current Policy – 15 Year
Current Policy – 30 Year
5th -2.04% 0.48% 1.61% 3.10%
25th 3.09% 4.16% 4.64% 5.27%
50th 6.81% 6.81% 6.81% 6.81%
75th 10.66% 9.52% 9.01% 8.36%
95th 16.45% 13.54% 12.27% 10.64%

Aon Hewitt | Retirement and Investment Investment advice and consulting services provided by Aon Hewitt Investment Consulting, Inc., an Aon Company. 24
Investment Analysis Range of Real Returns
Note: Returns based on AHIC’s 30 Year Capital Market Assumptions as of December 31, 2016
50th
95th
75th
25th
5th
Percentile
50th
95th
75th
25th
5th
Percentile
50th
95th
75th
25th
5th
Percentile
50th
95th
75th
25th
5th
Percentile
Percentile Current Policy – 5 Year
Current Policy – 10 Year
Current Policy – 15 Year
Current Policy – 30 Year
5th -4.27% -1.78% -0.65% 0.84%
25th 0.82% 1.89% 2.37% 2.99%
50th 4.52% 4.52% 4.52% 4.52%
75th 8.36% 7.22% 6.72% 6.07%
95th 14.12% 11.22% 9.96% 8.34%

Aon Hewitt | Retirement and Investment Investment advice and consulting services provided by Aon Hewitt Investment Consulting, Inc., an Aon Company. 25
Analysis Asset-Liability Projection Analysis

Aon Hewitt | Retirement and Investment Investment advice and consulting services provided by Aon Hewitt Investment Consulting, Inc., an Aon Company. 26
Asset-Liability Projection Analysis Employer Contribution Rate (Defined Benefit Plan Only)
Key Takeaway: Higher return-seeking allocations will reduce the expected (50th percentile) outcome but with a wider range of outcomes
* Projections assume constant 7.60% discount rate for pension liabilities for all investment policies studied
Strategy
Year 2025 2035 2045 2025 2035 2045 2025 2035 20455th Percentile 4.0% 2.1% 0.4% 3.9% 2.0% 0.4% 3.8% 2.0% 0.4%25th Percentile 8.8% 6.2% 4.4% 7.3% 5.1% 4.2% 5.6% 4.8% 4.1%50th Percentile 13.6% 18.5% 15.3% 13.0% 16.7% 12.8% 12.5% 15.0% 10.0%75th Percentile 18.3% 26.1% 24.1% 18.6% 25.8% 23.5% 18.9% 25.5% 23.2%95th Percentile 24.6% 33.3% 32.2% 25.6% 33.8% 32.5% 26.4% 34.3% 32.9%
Probability > 10% 69% 67% 62% 63% 64% 58% 59% 62% 50%
70% Return-Seeking Current Policy (81% RS) 90% Return-Seeking
70% Return-Seeking Current Policy (81% RS) 90% Return-Seeking
0%
5%
10%
15%
20%
25%
30%
35%
40%20
16
2021
2026
2031
2036
2041
2016
2021
2026
2031
2036
2041
2016
2021
2026
2031
2036
2041
Empl
oyer
Con
tribu
tion
Perc
enta
ge(P
lan
Year
)A
ll fig
ures
in %
of P
ayro
ll
5th Percentile 25th Percentile 50th Percentile 75th Percentile 95th Percentile

Aon Hewitt | Retirement and Investment Investment advice and consulting services provided by Aon Hewitt Investment Consulting, Inc., an Aon Company. 27
Asset-Liability Projection Analysis Market Value of Assets / Actuarial Liability Funded Ratio
Key Takeaways: Higher return-seeking allocations will increase the probability of fully funding the plan in the expected (50th percentile) outcome
but with a wider range of outcomes Downside risk (95th percentile outcomes) illustrates a steady decline in funded ratios across the policies modeled
* Projections assume constant 7.60% discount rate for pension liabilities for all investment policies studied
Strategy
Year 2025 2035 2045 2025 2035 2045 2025 2035 20455th Percentile 41% 31% 27% 39% 30% 27% 37% 29% 26%25th Percentile 58% 50% 48% 58% 51% 50% 58% 52% 53%50th Percentile 75% 72% 76% 78% 78% 84% 80% 83% 93%75th Percentile 95% 107% 144% 102% 122% 178% 108% 137% 210%95th Percentile 132% 219% 572% 149% 267% 739% 165% 319% 908%
Probability > 100% 22% 30% 41% 27% 38% 46% 32% 42% 48%
70% Return-Seeking Current Policy (81% RS) 90% Return-Seeking
70% Return-Seeking Current Policy (81% RS) 90% Return-Seeking
0%
25%
50%
75%
100%
125%
150%
175%
200%20
16
2021
2026
2031
2036
2041
2016
2021
2026
2031
2036
2041
2016
2021
2026
2031
2036
2041
Fund
ed R
atio
(MVA
/ AL
)M
arke
t Val
ue o
f Ass
ets
/ Act
uaria
l Lia
bilit
y
5th Percentile 25th Percentile 50th Percentile 75th Percentile 95th Percentile
Aon Hewitt | Retirement and Investment Investment advice and consulting services provided by Aon Hewitt Investment Consulting, Inc., an Aon Company. 28
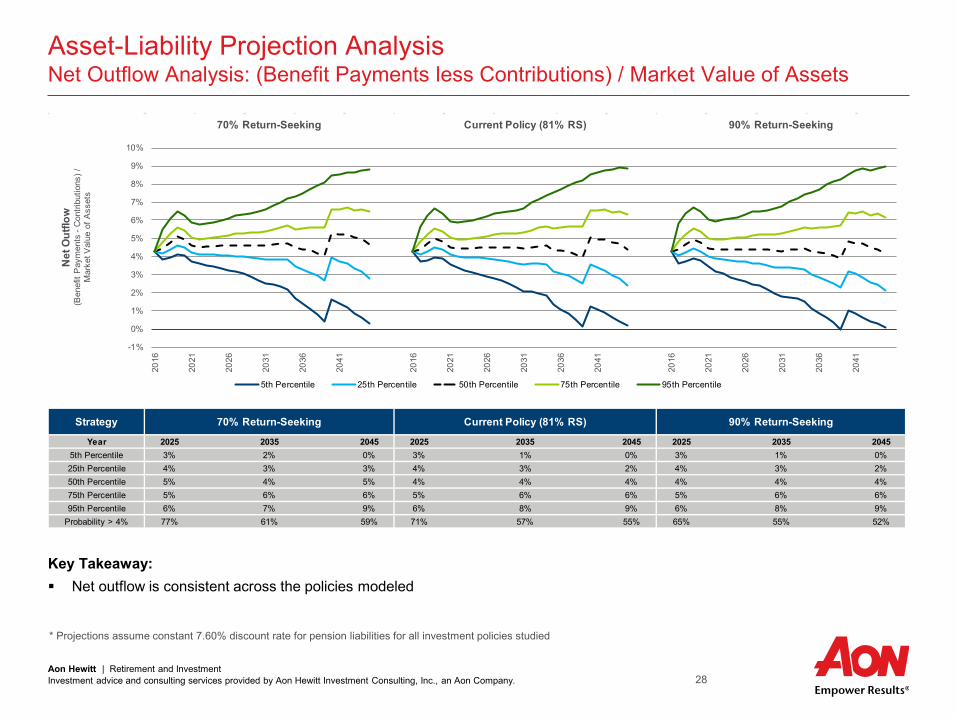
Asset-Liability Projection Analysis Net Outflow Analysis: (Benefit Payments less Contributions) / Market Value of Assets
Key Takeaway: Net outflow is consistent across the policies modeled
* Projections assume constant 7.60% discount rate for pension liabilities for all investment policies studied
Strategy
Year 2025 2035 2045 2025 2035 2045 2025 2035 20455th Percentile 3% 2% 0% 3% 1% 0% 3% 1% 0%25th Percentile 4% 3% 3% 4% 3% 2% 4% 3% 2%50th Percentile 5% 4% 5% 4% 4% 4% 4% 4% 4%75th Percentile 5% 6% 6% 5% 6% 6% 5% 6% 6%95th Percentile 6% 7% 9% 6% 8% 9% 6% 8% 9%
Probability > 4% 77% 61% 59% 71% 57% 55% 65% 55% 52%
70% Return-Seeking Current Policy (81% RS) 90% Return-Seeking
70% Return-Seeking Current Policy (81% RS) 90% Return-Seeking
-1%
0%
1%
2%
3%
4%
5%
6%
7%
8%
9%
10%20
16
2021
2026
2031
2036
2041
2016
2021
2026
2031
2036
2041
2016
2021
2026
2031
2036
2041
Net
Out
flow
(Ben
efit
Pay
men
ts -
Con
tribu
tions
) /M
arke
t Val
ue o
f Ass
ets
5th Percentile 25th Percentile 50th Percentile 75th Percentile 95th Percentile

Aon Hewitt | Retirement and Investment Investment advice and consulting services provided by Aon Hewitt Investment Consulting, Inc., an Aon Company. 29
Economic CostPresent Value of Contributions plus AL Funding Shortfall/(Surplus)* at 7.60%, $billions
Ave
rage
Cos
t (A
ll 5,
000
Sce
nario
s)
0% RS
100% RS
0% RS
100% RS
$0
$20
$40
$60
$80
$100
$120$40 $60 $80 $100 $120 $140 $160 $180
Risk
Average Risk (Worst 1,000 Scenarios)
Rew
ard
July 1, 2021 (5 Year)
July 1, 2026 (10 Years)
July 1, 2046 (30 Years)
July 1, 2031 (15 Years)
Asset-Liability Projection Analysis Economic Cost Analysis over a 5, 10, 15, and 30-Year Horizon
Key Takeaway: The magnitude of the risk/reward
trade-off changes over a longer-term projection
* Projections assume constant 7.60% discount rate for pension liabilities for all investment policies studied
*Excludes 50% of surplus in excess of 110% of Actuarial liability, and includes twice the shortfall below 40% of Actuarial liability, on a market value basis

Aon Hewitt | Retirement and Investment Investment advice and consulting services provided by Aon Hewitt Investment Consulting, Inc., an Aon Company. 30
Economic CostPresent Value of Contributions plus AL Funding Shortfall/(Surplus)* at 7.60%, $billions
Ave
rage
Cos
t (A
ll 5,
000
Sce
nario
s)
0% RS
100% RS
0% RS
100% RS
$0
$20
$40
$60
$80
$100
$120$40 $60 $80 $100 $120 $140 $160 $180
Risk
Average Risk (Worst 1,000 Scenarios)
Rew
ard
July 1, 2021 (5 Year)
July 1, 2031 (15 Years)
Baseline ERP = 3.72%
ERP = 4.72%
ERP = 2.72%
Risk-Reward Analysis Sensitivity to Equity Risk Premium Assumption
Observation: The dashed lines illustrate how the
Economic Cost curve shifts under alternative equity risk premium assumptions over a 5 and 15-year time horizon.
* Projections assume constant 7.60% discount rate for pension liabilities for all investment policies studied.
*Excludes 50% of surplus in excess of 110% of Actuarial liability, and includes twice the shortfall below 40% of Actuarial liability, on a market value basis

Aon Hewitt | Retirement and Investment Investment advice and consulting services provided by Aon Hewitt Investment Consulting, Inc., an Aon Company. 31
Short-Term Funded Ratio Shortfall Analysis (Based on Market Value of Assets)
FRS’ funded ratio based on the current allocation projects to the following outcomes after 5 years: 34.6% probability of being below 70% funded 19.0% probability of being below 60% funded 7.8% probability of being below 50% funded
50% Funded Status Dialing up the risk to 90% return-seeking assets will increase
this probability of falling below 50% funded to 8.9% Dialing down risk to 70% return-seeking assets will decrease
the probability to 6.1%
70% Funded Status Dialing up the risk to 90% return-seeking assets will reduce
the probability of falling below 70% funded to 33.8% Dialing down risk to 70% return-seeking assets will
increase the probability to 36.1%

Aon Hewitt | Retirement and Investment Investment advice and consulting services provided by Aon Hewitt Investment Consulting, Inc., an Aon Company. 32
Analysis Public Pension Peer Comparison

Aon Hewitt | Retirement and Investment Investment advice and consulting services provided by Aon Hewitt Investment Consulting, Inc., an Aon Company. 33
Public Pension Peer Comparison Overview
Public Fund Peer Asset Allocation Comparison – Asset allocation should be matched to each defined benefit plan’s unique design – Peer comparison is meant to inform and not dictate policy

Aon Hewitt | Retirement and Investment Investment advice and consulting services provided by Aon Hewitt Investment Consulting, Inc., an Aon Company. 34
Public Pension Peer Comparison FRS’ Investment Return Assumption versus Public Peers
The chart to the left illustrates the trend in investment return assumptions over the past 15 years according to information compiled by Public Plans Data (PPD)
The median Investment return assumption has declined from 8.00% in 2001-2010 to 7.50% based on the latest survey data
FRS’ historical return assumption has been plotted to show how it lines up with the historical trends.
Source: Public Plans Data (publicplansdata.org) as of December 2016

Aon Hewitt | Retirement and Investment Investment advice and consulting services provided by Aon Hewitt Investment Consulting, Inc., an Aon Company. 35
Public Pension Peer Comparison FRS’ Asset Allocation versus Public Peers
* Source: “Institutional Investors Market Trends 2015”, Greenwich Associates ** Source: “2016 Report on State Retirement Systems: Funding Levels and Asset Allocation”, Wilshire Consulting *** Source: AHIC Public Peer Average is based on a universe of AHIC’s 11 largest public pension plans with total assets ranging from $14B–$142B
Asset AllocationFlorida
Retirement System
Large Public Pension Plans
(>$5B)*
Total Public Pension Universe*
Wilshire Report on State Retirement
Systems **
AHIC PublicPeer Average ***
Equity ExposureGlobal Equity 53.0% 3.9% 3.8% 45.5%
Total U.S. Equity 0.0% 24.9% 25.3% 27.3%Total Int'l Equity 0.0% 18.5% 18.4% 20.1%Private Markets 6.0% 8.3% 8.1% 10.0% 12.1%
Total Equity 59.0% 55.6% 55.6% 57.4% 57.6%
Fixed Income ExposureU.S. Fixed Income 18.0% 20.8% 20.7% 21.1%
High Yield Bonds / Bank Loans 0.0%Non-US Developed Bonds 0.0% 2.6% 2.7% 2.3%
Emerging Market Debt 0.0% 0.7% 0.7%Inflation Protected 0.0%
Total Fixed Income 18.0% 24.1% 24.1% 23.4% 21.3%
Real Asset ExposureUS Infrastructure (Public + Private) 0.0%
Commodities / Gold 0.0% 1.2% 1.2%Real Estate 10.0% 8.5% 8.4% 8.1%
Total Real Assets 10.0% 9.7% 9.6% 8.1% 12.9%
Hedge Funds / Strategic 12.0% 4.3% 4.4% 5.8%Multi-Asset / Risk Parity 0.0% 1.4% 1.5% 2.3%Money Market / Cash 1.0% 1.8% 1.8% 0.4%Leverage 0.0%Other 0.0% 3.0% 3.0% 11.1%
Net Other 13.0% 10.5% 10.7% 11.1% 8.5%Total 100% 100% 100% 100% 100%

Aon Hewitt | Retirement and Investment Investment advice and consulting services provided by Aon Hewitt Investment Consulting, Inc., an Aon Company. 36
Summary & Conclusions

Aon Hewitt | Retirement and Investment Investment advice and consulting services provided by Aon Hewitt Investment Consulting, Inc., an Aon Company. 37
Summary of Results
Key Observations: Plan is projected to approach fully funded status via the current policy Employer contribution rate is expected to grow over the near-term before eventually declining Adjusting the return-seeking vs. risk-reducing allocation will exhibit standard risk/reward trade-off of expected costs
and risks
All Scenarios 30-year Present Value 30-year Ending of Contributions (ER + EE) Funded Ratio (MVA / AL)
$ billions Expected1 Downside2 Expected1 Downside2 Current Policy (81% RS) $66.0 $114.8 85% 27% 0% Return-Seeking $98.9 $106.7 39% 24% 10% Return-Seeking $94.7 $104.7 41% 25% 20% Return-Seeking $90.6 $104.7 45% 26% 30% Return-Seeking $86.4 $105.7 50% 27% 40% Return-Seeking $82.5 $107.2 56% 27% 50% Return-Seeking $78.3 $108.9 62% 28% 60% Return-Seeking $74.3 $110.9 68% 27% 70% Return-Seeking $70.5 $112.8 76% 27% 80% Return-Seeking $66.3 $114.5 84% 27% 90% Return-Seeking $62.2 $116.8 93% 27% 100% Return-Seeking $58.5 $119.1 103% 26%
1 Expected = 50th percentile outcome or central expectation across all 5,000 simulations 2 Downside = 95th percentile outcome across all 5,000 simulations

Aon Hewitt | Retirement and Investment Investment advice and consulting services provided by Aon Hewitt Investment Consulting, Inc., an Aon Company. 38
Summary and Conclusions
We believe the current portfolio is well-constructed with 81% return-seeking assets
The equity risk premium is 3.72%, compared to 3.94% from 2016 Asset returns are not expected to keep pace with the actuarial
assumed rate of return (7.60%) Expected real return of 4.52% falls short of the investment policy
target of 5.00%
The funded ratio is projected to trend toward full funding over the course of the projection period
Higher return-seeking strategies trend closer to full funding but with greater risk
Longer time horizons are expected to reward higher levels of risk; shorter time horizons reward risk less
Adverse market experience could significantly impact the funded status of the Plan over the projection period
Investment Analysis
Asset-Liability Projection Analysis

Aon Hewitt | Retirement and Investment Investment advice and consulting services provided by Aon Hewitt Investment Consulting, Inc., an Aon Company. 39
Appendix Assumptions & Methods

Aon Hewitt | Retirement and Investment Investment advice and consulting services provided by Aon Hewitt Investment Consulting, Inc., an Aon Company. 40
FRS Capital Market Assumptions—Q1 20171
Expected Real Return
Expected Nominal Return
Expected Nominal Volatility
Equity 1 Global Equity IMI 4.9% 7.2% 19.0%
Fixed Income 2 Cash (Gov't) 0.6% 2.8% 2.0%
3 Intermediate Gov't Bonds (4-Year Duration) 0.9% 3.1% 4.0%
4 Intermediate Corporate Bonds (4-Year Duration) 1.8% 4.0% 5.0%
Alternatives 5 Strategic Allocation (Custom)2 5.1% 7.4% 9.0%
6 Real Estate (Custom)3 3.0% 5.3% 11.5%
7 Private Equity 6.1% 8.4% 24.5%
Inflation 8 Inflation 0.0% 2.2% 1.5%
1 Expected return assumptions are based upon the AHIC capital market assumptions adjusted for the delta in Global Equity Risk Premium (ERP) 2 Strategic assumption breakdown is found on the next page 3 Real Estate assumption was modeled as follows: 76.50% Core Real Estate 13.50% Broad Real Estate 10.00% REITS

Aon Hewitt | Retirement and Investment Investment advice and consulting services provided by Aon Hewitt Investment Consulting, Inc., an Aon Company. 41
FRS Capital Market Assumptions—Q1 2017
The Strategic Investment allocation was modeled as follows:
Capital Market Assumption % of Total Asset
Allocation % of Strategic
Investment Private Equity Mezzanine 0.7% 6.0% Direct Lending 0.6% 4.9% Private Equity Distressed Debt 2.0% 16.6% Global Public Equity 1.1% 9.2% Hedge Funds – Equity Long/Short 0.5% 4.2% Real Estate Debt 1.2% 10.2% Timber 0.5% 4.0% Commodities 0.2% 1.9% Infrastructure 0.4% 3.1% Hedge Funds – Global Macro 1.1% 9.2% Hedge Funds – CTAs 1.0% 8.3% Hedge Funds – Event Driven 0.6% 5.0% Hedge Funds – Direct Hedge Funds (Buy List) 2.1% 17.5% Total 12.0% 100.0%

Aon Hewitt | Retirement and Investment Investment advice and consulting services provided by Aon Hewitt Investment Consulting, Inc., an Aon Company. 42
AHIC Capital Market Assumptions—Q1 2017
Nominal Correlations 1 2 3 4 5 6 7 8 1 Global Equity IMI 1.00 0.08 -0.06 0.09 0.85 0.47 0.67 0.07 2 Cash (Gov't) 0.08 1.00 0.63 0.50 0.12 0.16 0.09 0.50 3 Intermediate Gov't Bonds (4-Year Duration) -0.06 0.63 1.00 0.78 -0.05 0.04 -0.04 0.27 4 Intermediate Corporate Bonds (4-Year Duration) 0.09 0.50 0.78 1.00 0.23 0.10 0.08 0.20 5 Strategic Allocation (Custom) 0.85 0.12 -0.05 0.23 1.00 0.42 0.59 0.12 6 Real Estate (Custom) 0.47 0.16 0.04 0.10 0.42 1.00 0.38 0.09 7 Private Equity 0.67 0.09 -0.04 0.08 0.59 0.38 1.00 0.06 8 Inflation 0.07 0.50 0.27 0.20 0.12 0.09 0.06 1.00

Aon Hewitt | Retirement and Investment Investment advice and consulting services provided by Aon Hewitt Investment Consulting, Inc., an Aon Company. 43
Explanation of Capital Market Assumptions—Q1 2017 (30 Years)
The following capital market assumptions were developed by Aon Hewitt's Global Asset Allocation Team and represent the long-term capital market outlook (i.e., 30 years) based on data at the end of the fourth quarter of 2016. The assumptions were developed using a building block approach, reflecting observable inflation and interest rate information available in the fixed income markets as well as Consensus Economics forecasts. Our long-term assumptions for other asset classes are based on historical results, current market characteristics, and our professional judgment. Inflation – Expected Level (2.2%) Based on Consensus Economics long-term estimates and our near-term economic outlook, we expect U.S. consumer price inflation to be approximately 2.2% during the next 30 years. Real Returns for Asset Classes Fixed Income Cash (0.6%) – Over the long run, we expect the real yield on cash and money market instruments to produce a real
return of 0.6% in a moderate- to low-inflationary environment. TIPS (1.3%) – We expect intermediate duration Treasury Inflation-Protected Securities to produce a real return of
about 1.3%. Core Fixed Income (i.e., Market Duration) (1.6%) – We expect intermediate duration Treasuries to produce a real
return of about 0.9%. We estimate the fair value credit spread (credit risk premium - expected losses from defaults and downgrades) to be 0.7%, resulting in a long-term real return of 1.6%.
Long Duration Bonds – Government and Credit (1.8%) – We expect Treasuries with a duration comparable to the Long Government Credit Index to produce a real return of 1.2%. We estimate the fair value credit spread (credit risk premium - expected losses from defaults and downgrades) to be 0.6%, resulting in an expected real return of 1.8%.

Aon Hewitt | Retirement and Investment Investment advice and consulting services provided by Aon Hewitt Investment Consulting, Inc., an Aon Company. 44
Explanation of Capital Market Assumptions—Q1 2017 (30 Years)
Long Duration Bonds – Credit (2.3%) – We expect Treasuries with a duration comparable to the Long Credit Index to produce a real return of 1.2 %. We estimate the fair value credit spread (credit risk premium - expected losses from defaults and downgrades) to be 1.1%, resulting in an expected real return of 2.3%.
Long Duration Bonds – Government (1.2%) – We expect Treasuries with a duration of ~12 years to produce a real return of 1.2% during the next 30 years.
High Yield Bonds (3.3%) – We expect intermediate duration Treasuries to produce a real return of about 0.9%. We estimate the fair value credit spread (credit risk premium - expected losses from defaults and downgrades) to be 2.4%, resulting in an expected real return of 3.3 %.
Bank Loans (2.8%) – We expect LIBOR to produce a real return of about 1.1%. We estimate the fair value credit spread (credit risk premium - expected losses from defaults) to be 1.7%, resulting in an expected real return of 2.8%.
Non-US Developed Bonds: 50% Hedged (0.8%) – We forecast real returns for non-US developed market bonds to be 0.8% over a 30-year period after adjusting for a 50% currency hedge. We assume a blend of one-third investment grade corporate bonds and two-thirds government bonds. We also produce assumptions for 0% hedged and 100% hedged non-US developed bonds.
Emerging Market Bonds (Sovereign; USD) (3.2%) – We forecast real returns for emerging market sovereign bonds denominated in USD to be 3.2% over a 30-year period.
Emerging Market Bonds (Corporate; USD) (2.9%) – We forecast real returns for emerging market corporate bonds denominated in USD to be 2.9% over a 30-year period.
Emerging Market Bonds (Sovereign; Local) (3.9%) – We forecast real returns for emerging market sovereign bond denominated in local currency to be 3.9% over a 30-year period.
Multi Asset Credit (MAC) (4.4%) – We assume real returns from beta exposure to high yield, bank loans and emerging market debt to add 3.4% plus 1.0% from alpha (net of fees) over a 30-year period.

Aon Hewitt | Retirement and Investment Investment advice and consulting services provided by Aon Hewitt Investment Consulting, Inc., an Aon Company. 45
Explanation of Capital Market Assumptions—Q1 2017 (30 Years)
Equities Large Cap U.S. Equity (4.1%) – This assumption is based on our 30-year outlook for large cap U.S. company
dividends and real earnings growth. Adjustments are made for valuations as needed. Small Cap U.S. Equity (4.6%) – Adding a 0.5% return premium for small cap U.S. equity over large cap U.S. equity
results in an expected real return of 4.6%. This return premium is theoretically justified by the higher risk inherent in small cap U.S. equity versus large cap U.S. equity, and is also justified by historical data. In recent years, higher small cap valuations relative large cap equity has reduced the small cap premium.
Global Equity (Developed & Emerging Markets) (4.9%) – We employ a building block process similar to the U.S. equity model using the developed and emerging markets that comprise the MSCI All-Country World Index. Our roll-up model produces an expected real return of 4.9% for global equity.
International (Non-U.S.) Equity, Developed Markets (4.7%) – We employ a building block process similar to the U.S. equity model using the non-U.S. developed equity markets that comprise the MSCI EAFE Index.
Emerging Market Stocks (5.4%) - We employ a building block process similar to the U.S. equity model using the non-U.S. emerging equity markets that comprise the MSCI Emerging Markets Index.
Equity Risk Insurance Premium Strategies- High Beta (3.9%) – We expect nominal returns from insurance equity risk premium to average 4.4% plus 1.8% from cash & dividends over the next 30 years.
Alternative Asset Classes Hedge Fund-of-Funds Universe (2.1%) – The generic category “hedge funds” encompasses a wide range of
strategies accessed through “fund-of-funds” vehicles. We also assume the median manager is selected and also allow for the additional costs associated with Fund-of-Funds management. A top-tier portfolio of funds (hedge fund-of-funds buy-list) could add an additional 1.1% in return at similar volatility based on alpha, lower fees and better risk management.

Aon Hewitt | Retirement and Investment Investment advice and consulting services provided by Aon Hewitt Investment Consulting, Inc., an Aon Company. 46
Explanation of Capital Market Assumptions—Q1 2017 (30 Years)
Hedge Fund-of-Funds Buy List (3.2%) – The generic category of top-tier “hedge funds” encompasses a wide range of strategies accessed through “fund-of-funds” vehicles. We assume additional costs associated with Funds-of-Funds management. To use this category the funds must be buy rated or we advise on manager selection.
Broad Hedge Funds (3.5%) – Represents a diversified portfolio of direct hedge fund investments. This investment will tend to be less diversified than a typical “fund-of-funds” strategy as there will be fewer underlying managers and will not include the extra layer of fees found in a Fund-of-Funds structure.
Broad Hedge Funds Buy List (4.8%) – Represents a diversified portfolio of top-tier direct hedge fund investments. This investment will tend to be less diversified than a typical “fund-of-funds” strategy as there will be fewer underlying managers and will not include the extra layer of fees found in a Fund-of-Funds structure. To use this category the funds must be buy rated or we advise on manager selection.
Real Estate (3.1%) – Our real return assumption for broad real estate market is based on a gross income of about 5.1%, management fees of roughly 2%, and future capital appreciation near the rate of inflation during the next 30 years. We assume a portfolio of equity real estate holdings that is diversified by property type and by geographic region.
Core Real Estate (2.8%) – Our real return assumption for core real estate is based on a gross income of about 4.8%, management fees of roughly 2%, and future capital appreciation near the rate of inflation during the next 30 years. We assume a portfolio of equity real estate holdings that is diversified by property type and geographic region.
U.S. REITs (3.9%) – Our real return assumption for U.S. REITs is based on income of 3.9% and future capital appreciation near the rate of inflation over the next 30 years. REITs are a sub-set of the U.S. small/mid cap equities.
Commodities (3.2%) – Our commodity assumption is for a diversified portfolio of commodity futures contracts. Commodity futures returns are composed of three parts: spot price appreciation, collateral return, and roll return (positive or negative change implied by the shape of the future curve). We believe that spot prices will converge with CPI over the long run (i.e., 2.2%). Collateral is assumed to be LIBOR cash 1.1%. Also, we believe the roll effect will be near zero, resulting in a real return of approximately 3.2% for commodities.

Aon Hewitt | Retirement and Investment Investment advice and consulting services provided by Aon Hewitt Investment Consulting, Inc., an Aon Company. 47
Explanation of Capital Market Assumptions—Q1 2017 (30 Years)
Private Equity (6.2%) – Our private equity assumption reflects a diversified fund of funds with exposure to buyouts, venture capital, distressed debt, and mezzanine debt.
Infrastructure (3.9%) – Our infrastructure assumption is formulated using a cash flow based approach that projects cash flows (on a diversified portfolio of assets) over a 30 year period. Income and capital growth as well as gearing levels, debt costs and terms, relevant tax and management expenses are all taken into consideration. Our approach produces an expected real return of 3.9% for infrastructure.
Equity Risk Insurance Premium Strategies- Low Beta (4.0%) – We assume nominal returns from cash of 2.8% + 3.5% from alpha.
Volatility / Correlation Assumptions Assumed volatilities are formulated with reference to implied volatilities priced into option contracts of various terms, as well as with regard to historical volatility levels. For asset classes which are not marked to market (for example real estate), we “de-smooth” historical returns before calculating volatilities. Importantly, we consider expected volatility trends in the future – in recent years we assumed the re-emergence of an economic cycle and a loss of confidence in central bankers would lead to an increase in volatility. Correlation assumptions are generally similar to actual historical results; however, we do make adjustments to reflect our forward-looking views as well as current market fundamentals.

Aon Hewitt | Retirement and Investment Investment advice and consulting services provided by Aon Hewitt Investment Consulting, Inc., an Aon Company. 48
Appendix Horizon Survey of Capital Market Assumptions
Aon Hewitt | Retirement and Investment Investment advice and consulting services provided by Aon Hewitt Investment Consulting, Inc., an Aon Company. 49
Capital Market Assumption Overview
We have what we consider a consistent and conservative approach to modeling asset class returns, risk, and correlations
AHIC regularly reviews these critical inputs relative to peer consultants as well as the investment management community
The following slides include a review of 2016 assumptions relative to a study of peer averages – AHIC is often more conservative from an expected return standpoint than the peer average – While we do not seek to change our approach based on how we stack up to peers, it is a helpful double-check to
make sure we are not too far off from others in the industry

Aon Hewitt | Retirement and Investment Investment advice and consulting services provided by Aon Hewitt Investment Consulting, Inc., an Aon Company. 50
2016 Horizon Survey Results AHIC vs. Other Advisors
The 2016 Horizon Survey generally showed return expectations slightly lower in 2016 than 2015 – Equity return assumptions are lower by an average of 0.1% – Fixed income return assumptions are higher by an average of 0.1% – Alternative asset class return assumptions are lower by an average of 0.1%
2016 AHIC 10-year forecast assumptions tend to be similar to the survey average in some asset classes (e.g., public
equities), and somewhat lower in others (e.g., alternatives) – AHIC equity assumptions are driven by market valuations, earnings growth expectations and assumed payouts to
investors. Recent experience suggests strong equity market performance has been driven more by increasing valuations than increasing profits. As markets have become more expensive, our equity return assumptions have consequently fallen
– AHIC fixed income assumptions reflect falling yields and flattening of yield curves during the first two quarters of 2016
– AHIC alternative asset class assumptions are generally lower due to methodological and inflation forecast differences compared to survey participant forecasts
In conclusion, AHIC assumptions appear somewhat more conservative than peers included in the 2016 Horizon
Survey of capital market assumptions

Aon Hewitt | Retirement and Investment Investment advice and consulting services provided by Aon Hewitt Investment Consulting, Inc., an Aon Company. 51
2016 Horizon Survey Results Distribution of Expected Returns from 35 Consultants
SOURCE: Horizon Actuarial survey of 2016 capital market assumptions from 35 independent investment advisors Expected returns of the survey are annualized over 10-years (geometric). AHIC expected returns are annualized over 10-years as of June 30, 2016
0.0%
2.0%
4.0%
6.0%
8.0%
10.0%
12.0%
14.0%
Expected Geometric Returns by Asset Class (10 Year Forecast)
Horizon Survey 10-Yr Average AHIC 10-Yr Maximum Minimum

Aon Hewitt | Retirement and Investment Investment advice and consulting services provided by Aon Hewitt Investment Consulting, Inc., an Aon Company. 52
2016 Horizon Survey Results AHIC Versus Peers
Expected RiskAsset Class Maximum Minimum Average Average Expected Return Expected Risk Expected Return Expected RiskUS Equity - Large Cap 8.0% 5.1% 6.6% 16.9% 6.4% 17.0% 6.3% 17.0%US Equity - Small/Mid Cap 9.0% 5.0% 7.0% 21.0% 6.6% 23.0% 6.8% 23.5%Non-US Equity - Developed 9.2% 3.0% 7.1% 19.5% 7.3% 20.0% 7.2% 20.0%Non-US Equity - Emerging 11.3% 5.8% 8.5% 26.4% 7.5% 30.0% 7.5% 30.5%US Fixed Income - Core 5.3% 2.1% 3.4% 6.0% 2.1% 3.5% 2.9% 5.0%US Fixed Income - Long Duration Corp 5.3% 2.3% 3.8% 10.5% 3.8% 11.5% 4.0% 15.0%US Fixed Income - High Yield 7.5% 3.7% 5.9% 11.0% 5.1% 12.0% 5.4% 12.0%Non-US Fixed Income - Developed 4.6% 0.9% 2.4% 7.6% 1.4% 5.5% 2.2% 6.5%Non-US Fixed Income - Emerging 7.7% 3.9% 5.8% 11.6% 4.0% 13.0% 4.9% 13.5%Treasuries (Cash Equivalents) 3.5% 0.3% 2.1% 2.8% 1.2% 1.0% 1.9% 2.0%TIPS (Inflation-Protected) 5.0% 1.9% 2.8% 6.5% 2.4% 4.5% 3.1% 4.5%Real Estate 10.0% 4.1% 6.4% 14.7% 5.1% 11.5% 5.1% 11.5%Hedge Funds 7.6% 4.2% 5.4% 8.4% 4.6% 9.0% 5.0% 9.5%Commodities 6.8% 1.8% 4.0% 18.5% 3.5% 17.0% 4.4% 17.0%Infrastructure 8.0% 5.5% 6.6% 13.8% 6.3% 14.5% 6.6% 14.5%Private Equity 11.8% 7.4% 9.2% 23.1% 8.5% 24.0% 8.5% 24.5%Inflation 2.2% 1.8% 2.1% 1.0% 2.1% 1.5%
10 Year Forecasts Horizon Survey AHIC
30 Year Forecasts Expected Geometric Returns (10-Yr)
Notes (Horizon Survey):Source: Horizon Actuarial survey of 2016 capital market assumptions from 35 independent investment advisorsExpected returns are annualized (geometric).
Notes (AHIC Forecasts):AHIC Forecasts are as of June 30, 2016US Equity - Small/Mid Cap forecasts represents AHIC forecasts for US Small Cap US Fixed Income - Long Duration forecasts represents AHIC forecasts for Long Duration CreditNon-US Fixed Income - Developed forecasts represents AHIC forecasts for Non-US Fixed Income - Developed (50% Hedged)Non-US Fixed Income- Emerging forecasts represents AHIC forecasts for Non-US Fixed Income- Emerging Sovereign USDReal Estate forecasts represents AHIC forecasts for Core Private Real EstateHedge Funds forecasts represents AHIC forecasts for Hedge Fund-of-Funds (Buy List)

Aon Hewitt | Retirement and Investment Investment advice and consulting services provided by Aon Hewitt Investment Consulting, Inc., an Aon Company. 53
2016 Horizon Survey Results Leading Methodologies & Reasons for Differences
Leading Methodologies Building Block Global Capital Asset Pricing Model (Global CAPM) Surveys Historical data (as a guide to future) Black-Litterman (combination of building block and
CAPM)
Reasons for Differences Methodology Time Horizon Arithmetic vs. Geometric forecasts* Alpha (active management)* Inflation Investment Fees Asset class definition
* While some firms in Horizon survey responded with Arithmetic forecasts, the results have been converted to Geometric forecasts for comparison purposes. Additionally, the return expectations included in the Horizon survey are based on indexed returns (no “alpha”). However, AHIC return assumptions for certain asset classes include “alpha” or active management premium (e.g., Private Equity and Hedge Funds)
Aon Hewitt | Retirement and Investment Investment advice and consulting services provided by Aon Hewitt Investment Consulting, Inc., an Aon Company. 54
Appendix Investment Guidance for Public Employee Retirement System Trustees

Aon Hewitt | Retirement and Investment Investment advice and consulting services provided by Aon Hewitt Investment Consulting, Inc., an Aon Company. 55
Investment Guidance for Public Employee Retirement System Trustees1
1. PERS trustees should look to the state for statutory direction on behalf of the taxpayers a) Prudent-person rule b) Peer analysis
2. PERS trustees should not be daunted by a liability value that exceeds the value of assets a) Do not feel obliged to incur greater risk in an effort to narrow the gap b) Funded status has less to do with investment performance than it does with public policy and politics
3. PERS trustees should not assume that an equity-oriented investment policy is suitable for their fund a) Discern the risk tolerance of taxpayers b) May conclude that a moderate level of risk is warranted
4. Trustees of individual PERSs should be cognizant of the existence and implications of the unitary state pension fund a) Unitary state pension fund is the only fund of economic consequence to the taxpayers b) Multiple actively managed funds may form, in total, a closet index fund
5. PERS investments should be exposed to rewarded risks, and insulated from unrewarded risks a) Market risk (equity exposure) is rewarded risk, on average b) Diversifiable risk is not
1 Richard M. Ennis, Is a Statewide Pension Fund a Person or a Cookie Jar? The Answer Has Implications for Investment Policy, Financial Analysts Journal, November-December 1988
Aon Hewitt | Retirement and Investment Investment advice and consulting services provided by Aon Hewitt Investment Consulting, Inc., an Aon Company. 56
Appendix About This Material

Aon Hewitt | Retirement and Investment Investment advice and consulting services provided by Aon Hewitt Investment Consulting, Inc., an Aon Company. 57
About This Material
This material includes a summary of calculations and consulting related to the finances of Florida State Board of Administration (SBA). The following variables have been addressed: Contributions Economic Cost Funded Ratio Net Outflow
This analysis is intended to assist the Investment Committee with a review of the associated issues and options, and its use may not be appropriate for other purposes. This analysis has been prepared solely for the benefit of the Investment Committee. Any further dissemination of this report is not allowed without the written consent of Aon Hewitt Investment Consulting, Inc. Our calculations were generally based on the methodologies identified in the actuary’s valuation report for SBA. We believe the methodology used in these calculations conforms to the applicable standards identified in the report. Experience different than anticipated could have a material impact on the ultimate costs of the benefits. In addition, changes in plan provisions or applicable laws could have a significant impact on cost. Actual experience may differ from our modeling assumptions. Our calculations were based on data provided by the plan actuary. The actuarial assumptions and methods and plan provisions reflected in these projections are the same as those used for the 2016 fiscal year actuarial valuation for SBA as noted in the actuarial report, except where noted in this report. Unless specifically noted, our calculations do not reflect any other changes or events after July 1, 2016. In conducting these projections, we have relied on plan design, demographic and financial information provided by other parties, including the plan’s actuary and plan sponsor. While we cannot verify the accuracy of all of the information, the supplied information was reviewed for consistency and reasonableness. As a result of this review, we have no reason to doubt the substantial accuracy or completeness of the information and believe that it has produced appropriate results. These projections have been conducted in accordance with generally accepted actuarial principles and practices, including applicable Actuarial Standards of Practice as issued by the Actuarial Standards Board. The undersigned actuary is familiar with the near-term and long-term aspects of pension valuations and meet the Qualification Standards of the American Academy of Actuaries necessary to render the actuarial opinions contained herein. All sections of this report are considered an integral part of the actuarial opinions. To our knowledge, no associate of Aon Hewitt Investment Consulting, Inc. providing services to SBA has any direct financial interest or indirect material interest in SBA. Thus, we believe there is no relationship existing that might affect our capacity to prepare and certify this report for SBA. Aon Hewitt Investment Consulting, Inc. Phil Kivarkis FSA, CFA

Aon Hewitt | Retirement and Investment Investment advice and consulting services provided by Aon Hewitt Investment Consulting, Inc., an Aon Company. 58
Legal Disclosures and Disclaimers
Investment advice and consulting services provided by Aon Hewitt Investment Consulting, Inc. (“AHIC”). The information contained herein is given as of the date hereof and does not purport to give information as of any other date. The delivery at any time shall not, under any circumstances, create any implication that there has been a change in the information set forth herein since the date hereof or any obligation to update or provide amendments hereto. This document is not intended to provide, and shall not be relied upon for, accounting, legal or tax advice or investment recommendations. Any accounting, legal, or taxation position described in this presentation is a general statement and shall only be used as a guide. It does not constitute accounting, legal, and tax advice and is based on AHIC’s understanding of current laws and interpretation. This document is intended for general information purposes only and should not be construed as advice or opinions on any specific facts or circumstances. The comments in this summary are based upon AHIC’s preliminary analysis of publicly available information. The content of this document is made available on an “as is” basis, without warranty of any kind. AHIC disclaims any legal liability to any person or organization for loss or damage caused by or resulting from any reliance placed on that content. AHIC. reserves all rights to the content of this document. No part of this document may be reproduced, stored, or transmitted by any means without the express written consent of AHIC. Aon Hewitt Investment Consulting, Inc. is a federally registered investment advisor with the U.S. Securities and Exchange Commission. AHIC is also registered with the Commodity Futures Trading Commission as a commodity pool operator and a commodity trading advisor, and is a member of the National Futures Association. The AHIC ADV Form Part 2A disclosure statement is available upon written request to: Aon Hewitt Investment Consulting, Inc. 200 E. Randolph Street Suite 1500 Chicago, IL 60601 ATTN: AHIC Compliance Officer © Aon plc 2017. All rights reserved.